Clinical EEG and Neuroscience - ULiege the EEG serves... · EEG and Clinical Neuroscience Society...
12
http://eeg.sagepub.com/ Clinical EEG and Neuroscience http://eeg.sagepub.com/content/45/1/22 The online version of this article can be found at: DOI: 10.1177/1550059413509801 2014 45: 22 originally published online 10 January 2014 Clin EEG Neurosci Steven Laureys and Vincent Bonhomme Nicolas Marchant, Robert Sanders, Jamie Sleigh, Audrey Vanhaudenhuyse, Marie-Aurélie Bruno, Jean François Brichant, How Electroencephalography Serves the Anesthesiologist Published by: http://www.sagepublications.com On behalf of: EEG and Clinical Neuroscience Society can be found at: Clinical EEG and Neuroscience Additional services and information for http://eeg.sagepub.com/cgi/alerts Email Alerts: http://eeg.sagepub.com/subscriptions Subscriptions: http://www.sagepub.com/journalsReprints.nav Reprints: http://www.sagepub.com/journalsPermissions.nav Permissions: What is This? - Jan 10, 2014 OnlineFirst Version of Record - Feb 12, 2014 Version of Record >> at Universite de Liege on September 5, 2014 eeg.sagepub.com Downloaded from at Universite de Liege on September 5, 2014 eeg.sagepub.com Downloaded from
Transcript of Clinical EEG and Neuroscience - ULiege the EEG serves... · EEG and Clinical Neuroscience Society...

http://eeg.sagepub.com/Clinical EEG and Neuroscience
http://eeg.sagepub.com/content/45/1/22The online version of this article can be found at:
DOI: 10.1177/1550059413509801
2014 45: 22 originally published online 10 January 2014Clin EEG NeurosciSteven Laureys and Vincent Bonhomme
Nicolas Marchant, Robert Sanders, Jamie Sleigh, Audrey Vanhaudenhuyse, Marie-Aurélie Bruno, Jean François Brichant,How Electroencephalography Serves the Anesthesiologist
Published by:
http://www.sagepublications.com
On behalf of:
EEG and Clinical Neuroscience Society
can be found at:Clinical EEG and NeuroscienceAdditional services and information for
http://eeg.sagepub.com/cgi/alertsEmail Alerts:
http://eeg.sagepub.com/subscriptionsSubscriptions:
http://www.sagepub.com/journalsReprints.navReprints:
http://www.sagepub.com/journalsPermissions.navPermissions:
What is This?
- Jan 10, 2014OnlineFirst Version of Record
- Feb 12, 2014Version of Record >>
at Universite de Liege on September 5, 2014eeg.sagepub.comDownloaded from at Universite de Liege on September 5, 2014eeg.sagepub.comDownloaded from

Clinical EEG and Neuroscience2014, Vol. 45(1) 22 –32© EEG and Clinical Neuroscience Society (ECNS) 2014Reprints and permissions:sagepub.com/journalsPermissions.navDOI: 10.1177/1550059413509801eeg.sagepub.com
Article
Introduction
The first observations of the effects of anesthetic agents on the EEG occurred soon after the development of clinical EEG, at the beginning of the 20th century.1 Interest in this noninvasive tool for exploring brain activity, and measuring the effects of anesthesia, became rapidly evident. However, the complexity of the EEG signal and its interpretation, as well as its high sen-sitivity to various types of perturbations, prevented rapid devel-opment of routine clinical applicability within the anesthesia field. Its intraoperative use remained limited to a small number of specialized research teams. A resurgence of interest took place at the end of the 20th century, with the development of EEG-derived indices that were aimed at simplifying EEG inter-pretation during anesthesia. The advent of digitization and computerization of the signal permitted the definition of spe-cific EEG parameters, whose evolution through the course of anesthesia was correlated to the intensity of the desired effects of anesthetic agents, such as the alteration of consciousness.2 Using mathematical algorithms, the combination of those parameters gave birth to dimensionless indices of the depth of specific components of general anesthesia. Simultaneously,
and particularly during the past 10 years, technological advances progressively, and more thoroughly, dissected the EEG signal. High-density EEG and channel multiplication improved space resolution, allowed identifying sources of activity, and provided a better topographical definition
509801 EEGXXX10.1177/1550059413509801Clinical EEG and NeuroscienceMarchant et alresearch-article2014
1Department of Anesthesia and Intensive Care Medicine, CHU Liege, Liege, Belgium2Coma Science Group, Cyclotron Research Center, Liege, Belgium3Department of Anaesthesia and Surgical Outcomes Research Centre, University College London Hospital and Wellcome, London, UK4Department of Imaging Neuroscience, University College London, London, UK5Department of Anesthesia, Waikato Clinical School of the University of Auckland, Waikato Hospital, Hamilton, New Zealand6University Department of Anesthesia and Intensive Care Medicine, CHR Citadelle, Liege, Belgium
Corresponding Author:Vincent Bonhomme, University Department of Anesthesia and ICM, CHR Citadelle and CHU Liege, Boulevard du 12ème de Ligne, 1, Liege, 4000, Belgium. Email: [email protected] figures are available online at http://eeg.sagepub.com
How Electroencephalography Serves the Anesthesiologist
Nicolas Marchant1,2, Robert Sanders3,4, Jamie Sleigh5, Audrey Vanhaudenhuyse2, Marie-Aurélie Bruno2, Jean François Brichant1,2, Steven Laureys2, and Vincent Bonhomme1,2,6
AbstractMajor clinical endpoints of general anesthesia, such as the alteration of consciousness, are achieved through effects of anesthetic agents on the central nervous system, and, more precisely, on the brain. Historically, clinicians and researchers have always been interested in quantifying and characterizing those effects through recordings of surface brain electrical activity, namely electroencephalography (EEG). Over decades of research, the complex signal has been dissected to extract its core substance, with significant advances in the interpretation of the information it may contain. Methodological, engineering, statistical, mathematical, and computer progress now furnishes advanced tools that not only allow quantification of the effects of anesthesia, but also shed light on some aspects of anesthetic mechanisms. In this article, we will review how advanced EEG serves the anesthesiologist in that respect, but will not review other intraoperative utilities that have no direct relationship with consciousness, such as monitoring of brain and spinal cord integrity. We will start with a reminder of anesthestic effects on raw EEG and its time and frequency domain components, as well as a summary of the EEG analysis techniques of use for the anesthesiologist. This will introduce the description of the use of EEG to assess the depth of the hypnotic and anti-nociceptive components of anesthesia, and its clinical utility. The last part will describe the use of EEG for the understanding of mechanisms of anesthesia-induced alteration of consciousness. We will see how, eventually in association with transcranial magnetic stimulation, it allows exploring functional cerebral networks during anesthesia. We will also see how EEG recordings during anesthesia, and their sophisticated analysis, may help corroborate current theories of mental content generation.
Keywordselectroencephalography, general anesthesia mechanisms, anesthesia monitoring depth
at Universite de Liege on September 5, 2014eeg.sagepub.comDownloaded from

Marchant et al 23
of anesthesia-induced changes. In addition, the detection of functional and effective interactions between brain regions defined the so-called functional and effective connectivity,3 which is thought to play an important role in supporting higher order brain functions.4
Hence, besides increasing clinical interest with regard to monitoring of anesthetic drug effects, advanced EEG, alone or in combination with other techniques such as transcranial mag-netic stimulation, has gained major importance in exploring the mechanisms of general anesthesia, with, consequently, impli-cations for the understanding of the mechanisms of mental con-tent generation. In this article, we will focus on those 2 specific aspects of advanced anesthesia-applied EEG.
Approaches to EEG Analysis of Current Use in the Anesthesia Field
The analysis of the EEG applied to anesthesia can be decom-posed into different categories, according to the considered approach (Figure 1). The first descriptions of the anesthetic effects on the EEG were syntactic, or semantic, dealing with wave shape, amplitude, and global frequency. The progressive definition of time and frequency domain parameters led to a more detailed analysis of anesthesia-induced changes. As dose
increases, anesthetic agents with hypnotic properties gradually modify the EEG, both in the time and frequency domain, and produce specific wave shapes. The description of EEG com-plexity through a time domain approach with parameters such as total power or zero crossing frequency is limited.5 Hence, a more precise description has been sought for using a frequency domain approach. Induced changes in the frequency domain are classically considered to be biphasic,1 at least for hypnotic agents that are presumed to act through the promotion of GABAergic inhibitory neurotransmission.6 At low doses, EEG desynchronizes and accelerates to frequencies between 13 and 30 Hz. This is known as β activation. The EEG then slows down toward δ activity (0.5-4 Hz) and its amplitude decreases.7 With propofol, a frequently used hypnotic agent, the observed slow waves resemble the slow waves of physiological sleep, but are spatially limited. At deeper stages, bursts followed by periods of flat signal occur, an EEG pattern known as burst suppression that can be quantified using the burst suppression ratio (proportion of the length of a signal epoch where the amplitude is below a specified voltage). Higher dosages of hypnotic agents are associated with isoelectricity.5 Waxing and waning 12- to 15-Hz oscillations lasting for at least half a sec-ond, known as sleep-like spindles, can also be observed,8 but their presence is not systematic.7 Power in the γ range (>25 Hz)9 displays variable modifications during anesthesia, depend-ing on the hypnotic agent, the brain region, and the exact limits of the studied frequency band. With propofol, at intermediate doses, an increase in γ power has been described.7 The altera-tions of first-order (time domain) and second-order (frequency domain) EEG parameters are not homogenously distributed over the scalp. Quantitative EEG (QEEG) studies have described the topographical distribution of frequency domain alterations during anesthesia,9 showing a frontal predominance for most studied parameters.10 For example, during propofol sedation, activity in the α range progressively disappears in the occipital part of the brain while progressively increasing in the frontal region. In addition, phase-amplitude relationships in the α and β range display reproducible modifications during con-sciousness-unconsciousness transitions.11
Several other parameters can be extracted from the dissec-tion of the EEG signal into its frequency components, and from the estimation of the relative contribution of each component to the global signal, namely the power spectrum of the EEG.5 Examples of such parameters are the peak frequency (the one with the highest power), the median frequency (50% of power is achieved by lower frequencies, and 50 % by higher ones), and the spectral edge frequency (a specified percentage of the power is achieved by lower frequencies, generally 90% or 95 %). Time and frequency domain description of the EEG can also be obtained through the use of discrete wavelet transform and eigenvector analysis.12,13 It consists in deriving a number of coefficients that best correspond to time and frequency domain information contained in a signal epoch.
Higher orders of time and frequency domain analysis have also been studied during anesthesia, such as coherence,9 a mea-sure of synchronization between brain regions at a given
Figure 1. Summary of the approaches to EEG analysis as applied to anesthesia, and examples of derived parameters, as well as type of information provided by each kind of analysis. Derived from the classification by Rampil.111 Besides syntactic analysis, which describes frequency, amplitude, and shape of the global signal, digitization of the EEG allows mathematical and statistical analysis. Nonparametric analysis extracts signal descriptors from time domain and frequency domain information, or from the estimated disorder into the signal. The parametric approach constructs statistical models that look at the ability of a given signal to predict another one.111
Abbreviations: Symbolic, symbolic entropy; Spectral, spectral entropy; AA, average amplitude; ZCF, zero crossing frequency; BSR, burst suppression ratio; PS, power spectrum; RP, relative power; PF, peak frequency; MF, median frequency; SEF, spectral edge frequency; QEEG, quantitative EEG; SC, spatial coherence; PhS, phase synchrony; DWT, discrete wavelet transform; ApEn, approximate entropy; PeEn, permutation entropy; SampEn, sample entropy; STE, symbolic transfer entropy; DCM, dynamic causal modeling; MM, meanfield modeling.
at Universite de Liege on September 5, 2014eeg.sagepub.comDownloaded from

24 Clinical EEG and Neuroscience 45(1)
frequency range, bispectrum,1 a measure of phase correlation between different frequency components, or phase synchrony.14 The physiological significance of those parameters is still not known with certainty, but their changes over sequential transi-tions between different anesthestic stages are consistent and reproducible. The inter-region coherence in the gamma band may be modified during anesthesia,15 while phase synchrony has been shown to increase in the θ, α, and γ frequency band during propofol-induced loss of consciousness.7,16
When administered to patients, some hypnotic anesthetic agents may produce different EEG patterns than those described above. For example, ketamine, although reducing α activity (8-13 Hz), induces high-amplitude rhythmic θ activity (4-10 Hz), polymorphic δ activity, and scattered β activity.17 The α
2-
adrenergic agonists such as clonidine or dexmedetomidine increase δ and θ power, as well as the activity in the spindle frequency range (12-15 Hz).18 The observed differences between agents are certainly related to differences regarding their mechanism of action.
Another approach to EEG analysis during anesthesia con-sists in estimating the underlying disorder into the signal, a physical concept named entropy. Intuitively, one may easily understand that EEG disorder will be higher in an awake indi-vidual as compared with an anesthetized unconscious one. EEG entropy can be calculated by EEG amplitude (Shannon or symbolic entropy), or by power spectrum (spectral entropy).2 The third type of entropy estimation is based on the prediction of future amplitudes according to previous ones, and hence estimates the stability of the system. During anesthesia, the EEG tracing is more predictable than during the awake state. This principle has been applied to calculate the approximate entropy,19 the sample entropy,20 and the permutation entropy.21 All these 3 types of entropy are based on single channel recordings.
Besides parameters that describe the EEG in the time and frequency domain, or describe the complexity of a single elec-trode EEG signal, other types of analyses may extract supple-mentary information and add the dimension of interactions between brain regions. Contrary to the other types of entropy, symbolic transfer entropy looks at causality between signals recorded at different sites, and hence allows exploitation of directed functional connectivity between brain regions.22 However, symbolic transfer entropy is an oversimplification of Granger causality analysis.23 Granger causality establishes a statistical link between the activity observed in a specific region and the activity recorded previously in another region.23 It has allowed evidencing directed functional connectivity alterations during propofol anesthesia.14 Other methods such as dynamic causal modeling3,23 and meanfield modeling,24 add a mechanistic dimension to the exploration of connectivity. They necessitate the a priori construction of mechanistic models that describe the coupling among brain regions. The task then con-sists in identifying the model that best fit the recorded data.
As illustrated above, an in depth dissection of the EEG sig-nal is able to provide a huge amount of information. This infor-mation may be of variable nature, ranging from numerical
signal descriptors whose combination reflects a specific state of brain activity, to statistical maps describing spatial coher-ence or phase synchrony between or within brain regions, sta-tistical maps describing functional connectivity, or mechanistic models. Evidently, the information driven from the EEG may serve either to measure anesthetic drug effects, or explore the mechanisms of anesthetic action on the brain.
Assessing Depth of Anesthesia Using EEG
The administration of anesthetic agents to patients aims at allowing them to tolerate unpleasant and painful interventions, while facilitating the surgical procedure and avoiding compli-cations. This is achieved through several pharmacodynamic effects of anesthetic agents including, among others, an altera-tion of consciousness (the hypnotic effect of anesthesia), immobility (essentially achieved through muscle relaxation), and limitation of reactions to noxious surgical stimulation (or anti-nociception). Depending on anesthetic agent combina-tions, doses, and inherent properties, each pharmacodynamic component of anesthesia may be more or less pronounced. Changing the combination allows adapting anesthesia to cir-cumstances. Hence, when referring to depth of anesthesia, one must be precise over the concerned pharmacodynamic ele-ment.25,26 In that respect, being able to separately and specifi-cally monitor each pharmacodynamic component of anesthesia, and modify anesthetic agent administration accordingly, would be ideal. Muscle relaxation can easily and reliably be assessed by peripheral neurostimulation and recording of muscle response, and is beyond the scope of this review. The other 2 main components of anesthesia, namely hypnosis and anti-nociception, may be approached through EEG recording and analysis.
The Hypnotic Component: Prevention of Intraoperative Awareness
The fear of unexpected intraoperative awareness, and the wish to prevent patients from experiencing such a traumatic event, has long prompted anesthesiologists to search for efficient pre-vention means. During anesthesia, the observation of common clinical alerts such as increased blood pressure, heart rate, tears, or movements is not sensitive and specific enough to achieve a reasonable degree of security. The reasons for this are myriad: pharmacodynamic effects of anesthesia interact with each other (eg, the level of hypnosis is influenced by the amount of noxious stimulation), the pharmacodynamic proper-ties of anesthetic agents are variable, there exists interindivid-ual variability in sensitivity to the effects of anesthetic agents, and patients often receive nonanesthetic medications with effects on clinical signs that are not related to the depth of one component of anesthesia or the other.25 Furthermore, con-sciousness is likely influenced by, but not directly related to, autonomic system activity, dissociating these signs from con-sciousness mechanistically.
at Universite de Liege on September 5, 2014eeg.sagepub.comDownloaded from

Marchant et al 25
Considering its sensitivity to the effects of anesthetic agents, EEG was the first noninvasive recording to catch anesthesiolo-gists’ attention in that domain. Interpreting single or multiple channels raw EEG is not within easy reach of untrained clini-cians, though with training this can be overcome. In addition, single time and frequency domain parameters often have poor prediction ability regarding depth of hypnosis,27 prompting the idea of developing dimensionless indices whose value would correlate with depth of the hypnotic component of anesthesia.
Commercially Available Dimensionless Indices. The general prin-ciple governing construction of EEG-derived dimensionless indices is based on the extraction of parameters from the EEG whose value is known to be statistically correlated with anes-thetic agent concentration and/or clinically assessed depth of hypnosis. These parameters then enter a mathematical algo-rithm whose output is a normalized index. The index is gener-ally a number varying between 0 and 100, or a letter indicating anesthetic stage. Currently, at least 7 different indices of that type are available on the market, namely the Bispectral Index (BIS, Covidien plc, Dublin, Ireland), the M-Entropy (RE and SE, Datex Ohmeda Inc, GE Healthcare, Madison, WI), the Patient State Index (PSI, SEDline, Masimo Corp, Irvine, CA), the Cerebral State Index (CSI, Danmeter-Goalwick, Odense, Denmark), the Narcotrend (Arbeitsgruppe Informatik/Biomet-rie der Anästhesieim Klinikum Region Hannover Oststadt-Heidehaus, Hannover, Germany), the WAV
CNS (NeuroSense,
NeuroWave Systems Inc, Cleveland, OH), and the aepEX (Medical Device Management Ltd, Essex, UK; Table 1). Sev-eral of these are generated through a patent-protected algo-rithm, whose details are not entirely divulged.
Historically, BIS was the first, and has been studied the most. Its calculation algorithm has evolved over time to ameliorate artifact rejection and reliability. It involves power spectrum, relative activity in the β frequency range, burst suppression activity, synchronized fast slow activity, and bispectrum.28
The spectral entropy of the EEG is calculated on the power spectrum, using the Shannon function. The calculation is per-formed over two different frequency bands to generate 2 differ-ent normalized numbers: the Response Entropy (RE; 0.8- to 47-Hz band), and the State Entropy (SE; 0.8- to 32-Hz band).29 RE and SE are independent of the frequency and amplitude scales of the EEG signal. SE ranges between 0 and 91, is mainly based on cortical EEG activity, and is supposed to reflect the depth of the hypnotic component of anesthesia. In addition to EEG activity, RE takes account of facial EMG activity, which increases in case of non-counterbalanced noxious stimulation. RE ranges between 0 and 100, and is always higher or equal to SE. Its gradient with SE has been proposed to reflect the balance between nociception and anti-nociception during anesthesia.30
The PSI is derived from 4 EEG channels, and has been designed to be less dependent on anesthetic drug combina-tion.31 The PSI algorithm incorporates relative activity in spe-cific frequency bands, interhemispheric coherence information, as well as anteroposterior frequency and phase relationships. It takes account of the frontal localization of power spectrum
changes during anesthesia. The output of the algorithm is, again, a dimensionless number between 0 and 100.32
Cerebral State Index calculation involves relative α and β powers, the difference between them, and the importance of burst suppression.33,34 The system automatically selects the best parameter to be used. Correspondence between CSI values and depth of the hypnotic component of anesthesia are well defined. The delay between EEG acquisition and index output is approximately 15 seconds.
The concepts governing the development of the Narcotrend were slightly different from the above-described indices. Six different visually recognizable EEG patterns were initially identified as corresponding to different sleep stages. They were further divided into a total of 15 different patterns evidenced during anesthesia. Each of these stages was then characterized by a set of EEG parameters, including spectrum, entropy, and autoregression. The output is a number between 0 and 100, as well as a letter corresponding to the anesthetic stage. This index seems to be more appropriate for propofol-based anesthesia than for anesthesia induced by volatile agents.
A wavelet analysis, which captures both time and frequency domain information on the EEG signal in the form of wavelet coefficients, is used to calculate the WAV
CNS (Wavelet-based
Anesthetic Value for Central Nervous System monitoring).12,13 The result is a 0 to 100 index with high stability in time during steady-state anesthesia and linear evolution during the transi-tion from the awake state to isoelectricity. The reaction time of that index is shorter than the reaction time of BIS.
The aepEX uses a different approach. It necessitates the administration of 7-Hz auditory clicks to the patient through earphones. Middle latency auditory evoked potentials are extracted from the raw EEG using a moving averaging win-dow. The index is then calculated based on the amplitude and latency of those evoked potentials,35,36 knowing that amplitude decreases and latency increases with hypnotic depth.
Clinical Utility of EEG Indices During Anesthesia. The debate on the prevention of intraoperative awareness.
The use of EEG indices correlating with hypnotic anesthetic agent pharmacodynamic effects or anesthetic stages is appeal-ing. From the beginning of their availability, a potential utility of those indices to prevent unexpected intraoperative aware-ness with explicit recall has been foreseen. Demonstrating such utility was not straightforward, and this was because of 3 main reasons (Table 2).
First, unexpected intraoperative awareness is a relatively rare event, with an overall estimated incidence of approxi-mately 0.2%. Hence, large studies, preferably randomized con-trol trials, were needed to demonstrate any potential benefit of using those monitors for prevention. Those studies are now available, and show conflicting results.37-42 According to Avidan and Mashour,43 an in-depth analysis of those studies leads to the conclusion that an EEG-driven administration of intravenous hypnotic anesthetic agents helps prevent unex-pected intraoperative awareness with explicit recall, at least in patients at higher risk of experiencing such an event. However,
at Universite de Liege on September 5, 2014eeg.sagepub.comDownloaded from
26 Clinical EEG and Neuroscience 45(1)
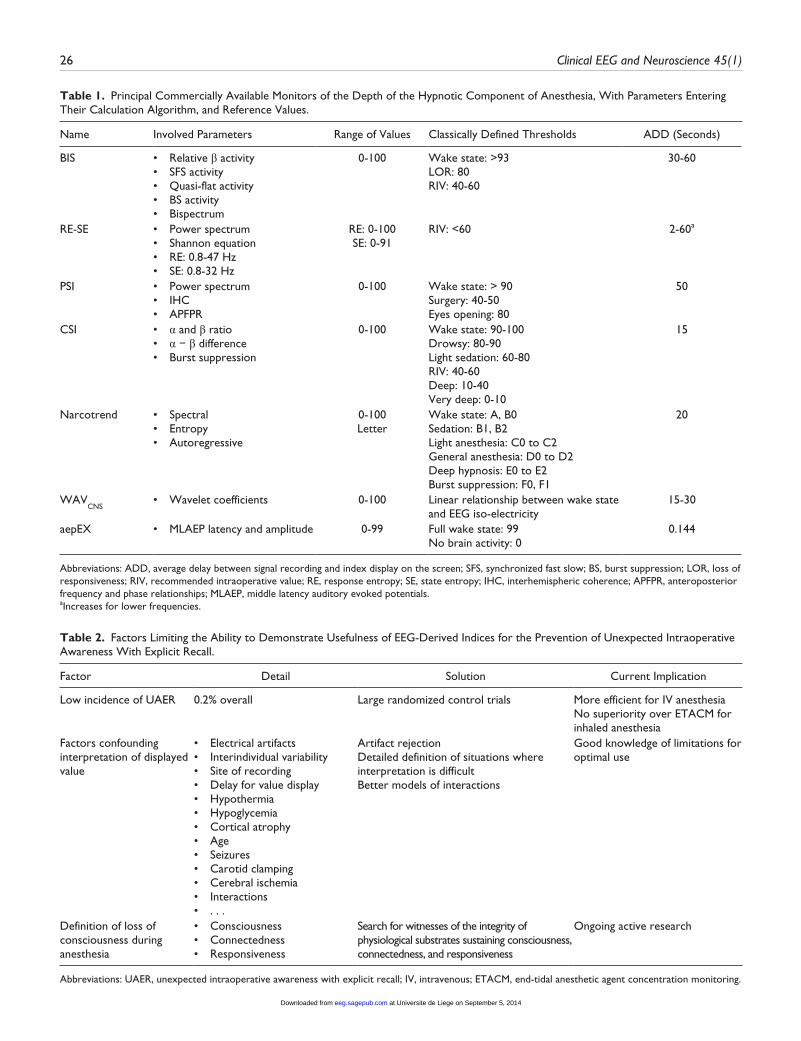
Table 1. Principal Commercially Available Monitors of the Depth of the Hypnotic Component of Anesthesia, With Parameters Entering Their Calculation Algorithm, and Reference Values.
Name Involved Parameters Range of Values Classically Defined Thresholds ADD (Seconds)
BIS • Relative β activity• SFS activity• Quasi-flat activity• BS activity• Bispectrum
0-100 Wake state: >93LOR: 80RIV: 40-60
30-60
RE-SE • Power spectrum• Shannon equation• RE: 0.8-47 Hz• SE: 0.8-32 Hz
RE: 0-100SE: 0-91
RIV: <60 2-60a
PSI • Power spectrum• IHC• APFPR
0-100 Wake state: > 90Surgery: 40-50Eyes opening: 80
50
CSI • α and β ratio• α − β difference• Burst suppression
0-100 Wake state: 90-100Drowsy: 80-90Light sedation: 60-80RIV: 40-60Deep: 10-40Very deep: 0-10
15
Narcotrend • Spectral• Entropy• Autoregressive
0-100Letter
Wake state: A, B0Sedation: B1, B2Light anesthesia: C0 to C2General anesthesia: D0 to D2Deep hypnosis: E0 to E2Burst suppression: F0, F1
20
WAVCNS
• Wavelet coefficients 0-100 Linear relationship between wake state and EEG iso-electricity
15-30
aepEX • MLAEP latency and amplitude 0-99 Full wake state: 99No brain activity: 0
0.144
Abbreviations: ADD, average delay between signal recording and index display on the screen; SFS, synchronized fast slow; BS, burst suppression; LOR, loss of responsiveness; RIV, recommended intraoperative value; RE, response entropy; SE, state entropy; IHC, interhemispheric coherence; APFPR, anteroposterior frequency and phase relationships; MLAEP, middle latency auditory evoked potentials.aIncreases for lower frequencies.
Table 2. Factors Limiting the Ability to Demonstrate Usefulness of EEG-Derived Indices for the Prevention of Unexpected Intraoperative Awareness With Explicit Recall.
Factor Detail Solution Current Implication
Low incidence of UAER 0.2% overall Large randomized control trials More efficient for IV anesthesiaNo superiority over ETACM for inhaled anesthesia
Factors confounding interpretation of displayed value
• Electrical artifacts• Interindividual variability• Site of recording• Delay for value display• Hypothermia• Hypoglycemia• Cortical atrophy• Age• Seizures• Carotid clamping• Cerebral ischemia• Interactions• . . .
Artifact rejectionDetailed definition of situations where interpretation is difficultBetter models of interactions
Good knowledge of limitations for optimal use
Definition of loss of consciousness during anesthesia
• Consciousness• Connectedness• Responsiveness
Search for witnesses of the integrity of physiological substrates sustaining consciousness, connectedness, and responsiveness
Ongoing active research
Abbreviations: UAER, unexpected intraoperative awareness with explicit recall; IV, intravenous; ETACM, end-tidal anesthetic agent concentration monitoring.
at Universite de Liege on September 5, 2014eeg.sagepub.comDownloaded from
Marchant et al 27
when volatile anesthetic agents are used, monitoring their end-tidal concentration, which reflects concentrations attained in the brain, and setting low concentration alarms is at least as efficient at achieving the same goal. The difference between intravenous and volatile agents may be explained by a larger interindividual variability of the minimal effective concentra-tion for intravenous agents compared with volatile agents.
Second, several confounding factors may impede the inter-pretation of EEG-derived indices, and may lead to erroneous conclusions regarding real depth of the hypnotic component of anesthesia. They include artifacts from surrounding electrical devices, interindividual variability in terms of baseline EEG characteristics, erroneous site of EEG recording, delay between EEG acquisition and value display,44-46 and specific clinical conditions such as hypothermia, hypoglycemia, dementia, corti-cal atrophy, advanced age,47 seizures, carotid clamping, and cerebral ischemia.25 In addition, the effect of the interactions between anesthetic medications on the index value is often not much considered but is important. For example, an observed BIS value of 40 does not mean the same in the presence of high anti-nociceptive agent concentration and relatively low hyp-notic agent concentration, or in the presence of the inverse.48 In the latter, the patient may be at higher risk of reacting to noxious stimulation, and perhaps waking up, than in the first case. Other medications, such as ketamine,49,50 nitrous oxide,17 and muscle relaxants, may also paradoxically modify the index value.51,52
Third, there has long been confusion regarding the definition of consciousness or loss of consciousness during anesthesia. From an operational point of view, it seems reasonable to distin-guish between different concepts that are relevant to anesthe-sia,53 namely consciousness, connectedness, and responsiveness, which are often mixed up, even in the anesthetic literature.54 Consciousness corresponds to subjective experience, connect-edness to the awareness of the environment and of external stimuli (as opposed to experience triggered by internal thoughts, dreams, and imaginings), and responsiveness movement by the patient be it spontaneous or goal-directed behavior. During anes-thesia, consciousness is not necessarily associated with connect-edness, responsiveness, or even recall. Connected consciousness describes experience of surgery or external stimuli during anes-thesia. Different physiological substrates and mechanisms sus-tain the presence or the absence of such abilities. As we will describe below, consciousness likely depends on the integrity of corticothalamic networks, while spontaneous responsiveness may depend on subcortical and spinal cord networks. The mech-anisms underlying connectedness remain more obscure, but may depend on specific neuromodulators and corticothalamic cir-cuits. Searching for specific signs of the integrity of each of them could help better detect the presence or absence of connected consciousness during anesthesia, and hence prevent patients from being conscious of their surgical procedure.
It appears that EEG-derived indices of the depth of the hyp-notic component of anesthesia are far from being a panacea, and that improvements are needed to optimize their clinical use with regard to detection of unexpected intraoperative
connectedness. At the present time, other clinical utilities may further justify their regular usage.
Other clinical utilities. No superiority of one type of monitor over the other has been evidenced. Insofar as they measure an effect of medications, they should allow individual titration, avoid episodes of overdosage,55 and hasten recovery when the procedure has come to its end,56 with less side effects. Although large randomized control studies have failed to corroborate such beneficial effects,43 they were not controlling for interac-tions between anesthetic medications. If anesthesia is achieved using high doses of hypnotic agents and low doses of anti-noci-ceptive agents, one may expect that EEG-guided titration will be less efficient at limiting hypnotic agent consumption than in situations with tightly controlled anti-nociception.57 Control-ling for overdosage may prove important, since an association has been found between prolonged time with low EEG indi-ces during anesthesia, and long-term outcome,58-61 but not with absolute amount of anesthetic agent received. However, this may reflect an intrinsic sensitivity of the brain to the effect of anesthetic agents in vulnerable patients. Hence, cause and effect remain far from established. Nonetheless, the ease of titration may even be further improved in the future, when closed-loop administration systems will be available for routine use .62-68
The Future. As stated above, there is a need for a refinement in the detection of the presence or absence of connected con-sciousness during anesthesia. A necessary step for achieving this goal is a detailed understanding of anesthesia-induced alteration of consciousness, connectedness, and responsive-ness,53 and a better definition of endpoints when designing studies in that domain. Recent advances in EEG analysis may provide the means to develop specific monitors of cortical con-nectivity, and particularly of fronto-parietal feedback connec-tivity, which is thought to be a sign of consciousness, but not necessarily of connectedness.69,70 High-density EEG, transcra-nial magnetic stimulation,4 Granger causality,23,71 symbolic transfer entropy,22 permutation entropy,21 and others might be the route to follow, but these techniques must be refined and/or simplified before used in daily practice. Monitoring connected-ness is not accessible the same way, and evoked potentials could be an alternative in that case.53 Finally, Purdon et al11 have recently proposed a refined analysis of phase-amplitude relationships, and topographical distribution of power spec-trum that identifies signatures of the presence or the absence of responsiveness during anesthesia.11
The Balance Between Noxious Stimulation and Anti-Nociception
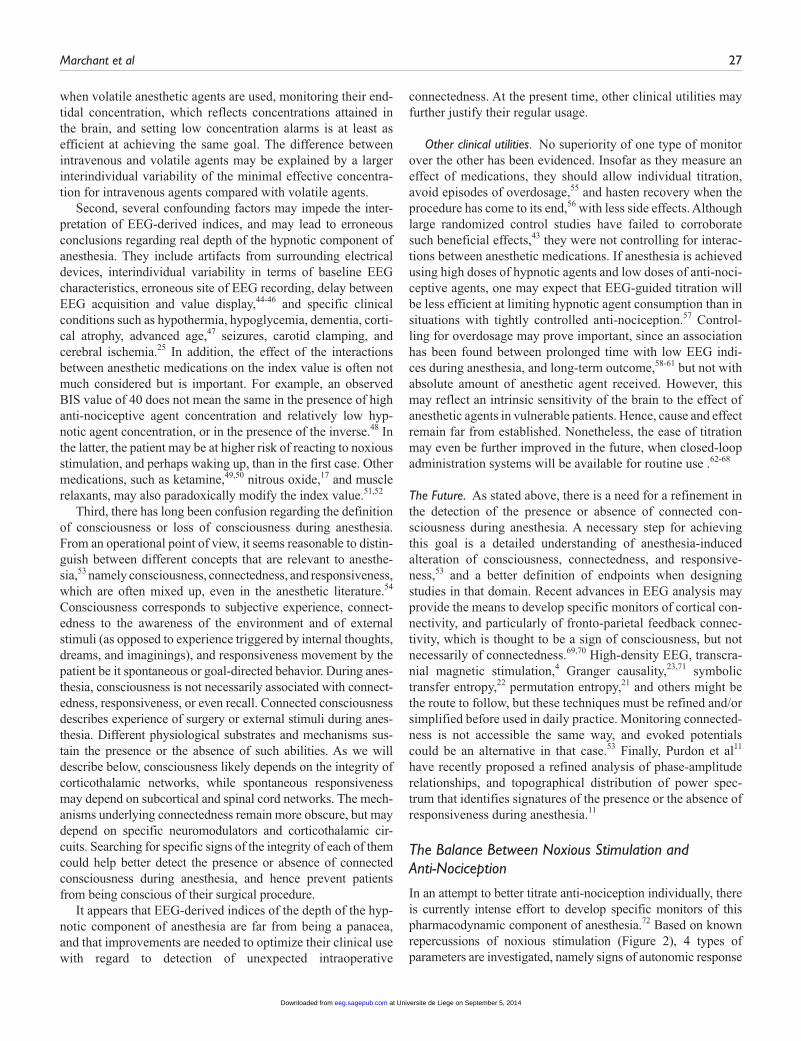
In an attempt to better titrate anti-nociception individually, there is currently intense effort to develop specific monitors of this pharmacodynamic component of anesthesia.72 Based on known repercussions of noxious stimulation (Figure 2), 4 types of parameters are investigated, namely signs of autonomic response
at Universite de Liege on September 5, 2014eeg.sagepub.comDownloaded from

28 Clinical EEG and Neuroscience 45(1)
to noxious stimulation, signs of withdrawal motor response, evoked potentials, and EEG variability. The first 2 types include parameters such as pupil diameter,73 heart rate variability,74,75 skin vasomotor reflex,76 skin conductance,77 spinal reflexes,78,79 and indices combining heart rate and pulse amplitude.80-84 These parameters have proven ability to appreciate the balance between noxious stimulation and anti-nociception to a certain degree, or being able to predict patient motor response to noxious stimula-tion, but their interpretation may sometimes be affected by con-founding factors.85-87 Other concepts use pharmacodynamic interaction modeling to derive theoretical indices of nociception, but do not involve physiological measurements (Noxious Stimulation Response Index, NSRI).88,89
Describing all these new indices in detail is beyond the scope of this review, because they are not related to the EEG. However, the latter may also provide information on nociception, either through the recording of evoked potentials, or through the study of EEG variability. Nociception-related somatosensory evoked potentials are sensitive to the noxious stimulation–anti-nocicep-tion balance,90 but their recording is not easy in the electrically hostile environment of an operating theater. Middle latency
auditory evoked potentials, and derived indices, may also pro-vide information on the level of anti-nociception.91 Their early variation in response to noxious stimulation, as compared to BIS, may simply be due to the arousal effect of noxious stimula-tion and shorter delay for index calculation. Recent interest has emerged regarding BIS and electromyographic (EMG) variabil-ity, or an index combining both parameters (the Composite Variability Index, CVI), at assessing the adequacy of anti-noci-ception during anesthesia.92 Again, the idea behind it is the arousal effect of noxious stimulation, and hence its effect on BIS value, and the evocation of a motor reflex that would trans-late into an increase in EMG activity. BIS variability can be estimated using the standard deviation of BIS values recorded during the previous 3 minutes. EMG variability corresponds to the standard deviation of EMG power over the same period of time. CVI is a normalized index ranging between 0 and 100. The algorithm for its calculation has been designed according to the ability of subparameters to predict the occurrence of a somatic event (or patient movement) in response to noxious stimulation. This new tool still needs clinical validation with respect to the influence of muscle relaxation on its value, reli-ability of considering patient movement as a surrogate of inad-equate anti-nociception, efficacy at guiding anti-nociceptive agent administration, and effect on outcome.93 The last EEG-derived parameter proposed to assess anti-nociception is the aforementioned RE-SE gradient of Spectral Entropy.94 The same restrictions as those described for CVI also apply to RE-SE, and particularly the effect of muscle relaxation.49,95-97
Functional Exploration of the Brain During Anesthesia Using EEG
Exploring Functional Connectivity
EEG studies have contributed to the considerable progress that has recently been made in the understanding of the mechanisms of anesthesia-induced alteration of consciousness.6,98,99 The advantage of EEG over other techniques, is that it allows exploring functional effective connectivity, or causal influence, between brain regions rather than statistical dependencies in changes of indirect signs of regional brain activity.23 From a holistic view, concepts have evolved toward dose-dependent targeted effects of hypnotic agents on brain functional assem-blies sustaining consciousness. Following the demonstration that the cortex was affected by hypnotic agents at lower doses than subcortical structures,100 and that higher order cortical association areas were more sensitive to that effect than lower order ones,101 the first evidence of altered connectivity into thalamocortical networks sustaining consciousness came from high-density EEG studies combined with transcranial magnetic stimulation.4 These findings were further confirmed by func-tional magnetic resonance imaging studies describing dose-dependent connectivity alterations into the Default Mode Network (DMN, involved in self-awareness), and in the Executive Control Network (ECN, involved in the awareness of the environment), while connectivity in lower order sensory networks was preserved.102 Granger causality and dynamic
Figure 2. Principles of nociception balance monitoring. Underlined parameters are those obtainable through EEG recordings. Noxious input evokes a motor response emerging from the spinal cord and the brainstem, and leading to spinal reflexes and an increase in electromyographic (EMG) power. Noxious input to the cortex produces an arousal effect and an increase in EEG variability. Noxious input also has an impact on the autonomic nervous system and its target organs such as the pupils, and the cardiovascular system. Pharmacodynamic modeling allows designing theoretical indices that correlate with the probability of a patient response to noxious stimulation.NSRI, Noxious Stimulation Response Index; ANS, autonomic nervous system; HRV, heart rate variability; SVR, skin vasomotor reflex; sBIS, Bispectral Index variability; CVI, Composite Variability Index; MLAEP, middle latency auditory evoked potentials; NRSEP, nociception-related somatosensory evoked potentials; RE-SE, gradient between response and state spectral entropy of the EEG; sEMG, variability of electromyographic activity.
at Universite de Liege on September 5, 2014eeg.sagepub.comDownloaded from
Marchant et al 29
causal models applied to EEG recordings during anesthesia also confirmed the preferential inhibition of frontoparietal feedback connectivity, an element of consciousness networks,22 while thalamocortical connectivity specific to those networks was shown to be preserved3 at doses that induce unresponsive-ness. That connectivity requires higher doses to disappear.53 Contrarily, the nonspecific thalamocortical connectivity involved in cortical arousal is early inhibited.103 In other net-works, such as the lower order visual and auditory networks, functional connectivity, including thalamocortical connectiv-ity, is relatively resistant to the action of hypnotic anesthetic agents,102 but cross-modal interactions are altered. All these changes may occur through deregulation of subcortical thal-amo-regulatory systems involving the putamen.104
Despite a current better definition of what happens during anesthesia, the exact sequence of events remains to be deter-mined. The link with known effects of hypnotic agents on sub-cortical systems sustaining arousal or promoting sleep is still not known with precision.6 Primary effects of anesthesia may occur at the cortical level with secondary effects on subcortical systems, but the inverse could also be true. Locally, cortical neuronal networks remain intact but become isolated from other brain regions,105 and this could be the consequence of a direct effect of hypnotic agents on the cortex, or the conse-quence of an indirect effect on subcortical structures. On emer-gence from anesthesia, connectivity recovery does not seem to simply follow the inverse of what happens during induction of anesthesia.103,106 These differential dynamics between induc-tion and recovery remain to be precisely defined. Finally, the exact link between biochemical targets of anesthetic agents and observed functional effects is still in the dark.
The whole picture of functional alterations during anesthe-sia is therefore far from being entirely understood. For a better comprehension of these mechanisms, there is a need for addi-tional studies that should ideally be designed according to the operational concepts of consciousness, connectedness, and responsiveness,53 and investigate dynamic changes rather than steady states.
EEG and Theories of Consciousness
The reversibility of anesthesia, and the study of anesthesia-induced EEG modifications, is a unique tool for studying con-sciousness, and for corroborating or invalidating conceptual theories about that state. For example, the reversible break-down of connectivity into corticothalamic networks during anesthesia4 fits in the integrated information theory (IIT).107 Like most respected theories of consciousness, IIT postulates that consciousness is generated by corticothalamic networks. Specialized cortical areas can distinguish among a large reper-toire of information, and connections within and between those areas allows integration of information. The breakdown of con-nectivity during anesthesia, and the associated loss of con-sciousness reinforce the hypotheses of ITT. Another example is the global workspace theory (GWT).108 GWT hypothesizes that
specialized brain regions share their information into a global workspace. Attention then brings one element of that informa-tion or the other from the backstage to the front of the con-scious scene. The discovery of frontoparietal connectivity alterations during anesthesia,22 which is thought to represent a global workspace breakdown, provides support to GWT.109 The third example is the theory explaining the ability of the brain to bind information into a single unified percept.15 This binding would occur through a hierarchical processing of infor-mation from lower order neurons to higher order ones (conver-gence), from lower order cell assemblies to higher order ones (assembly), and at a global level (synchrony). Oscillations in the γ frequency range would be the landmark of synchrony. The suppression of γ oscillations during anesthesia would be responsible for the unbinding of information, and therefore for the loss of consciousness. All those theories constitute at least parts of the substrate of consciousness, but their unification is not yet within easy reach. Several features of consciousness still require formal theoretical explanations, and the ability to get access to their quantification and measurement.110 Anesthesia and EEG will more than probably help progress in that domain.
Conclusions
As demonstrated in this review, EEG provides a huge amount of information to the anesthesiologist, either for routine clinical practice or for the understanding of the mechanisms of anesthe-sia. There is still a lot of work to be performed in both domains, for refining the way we provide anesthesia to our patients, avoid undesirable events, hopefully improve outcome, and understand what we do every day. EEG will be of great help to achieve these goals in the near future.
Declaration of Conflicting Interests
The author(s) declared no conflicts of interest with respect to the research, authorship, and/or publication of this article.
Funding
The author(s) disclosed receipt of the following financial support for the research, authorship, and/or publication of this article: Funds or technical help received for research, consultancy, and travel expenses from several companies: Orion, Covidien, Astra-Zeneca, Baxter, Acertys-GE, Neuro Wave. The authors also received funds from the Belgian National Funds for Scientific Research (Brussels, Belgium), the European Commission (Brussels, Belgium), the James McDonnell Foundation (Saint Louis, Missouri), the Mind Science Foundation (San Antonio, Texas), the French Speaking Community Concerted Research Action (Brussels, Belgium), the Fondation Médicale Reine Elisabeth (Brussels, Belgium), the Society for Anesthesia and Resuscitation of Belgium, the University of Liege (Liege, Belgium), and the University Hospital of Liege (Liege, Belgium) for their research. S. Laureys (Senior Research Associate) is employed by the Belgian National Funds for Scientific Research.
at Universite de Liege on September 5, 2014eeg.sagepub.comDownloaded from

30 Clinical EEG and Neuroscience 45(1)
References
1. Rampil IJ. A primer for EEG signal processing in anesthesia. Anesthesiology. 1998;89:980-1002.
2. Schwilden H. Concepts of EEG processing: from power spectrum to bispectrum, fractals, entropies and all that. Best Pract Res Clin Anaesthesiol. 2006;20:31-48.
3. Boly M, Moran R, Murphy M, et al. Connectivity changes under-lying spectral EEG changes during propofol-induced loss of con-sciousness. J Neurosci. 2012;32:7082-7090.
4. Ferrarelli F, Massimini M, Sarasso S, et al. Breakdown in corti-cal effective connectivity during midazolam-induced loss of con-sciousness. Proc Natl Acad Sci U S A. 2010;107:2681-2686.
5. Tonner PH, Bein B. Classic electroencephalographic parameters: median frequency, spectral edge frequency etc. Best Pract Res Clin Anaesthesiol. 2006;20:147-159.
6. Bonhomme V, Boveroux P, Vanhaudenhuyse A, et al. Linking sleep and general anesthesia mechanisms: this is no walkover. Acta Anaesthesiol Belg. 2011;62:161-171.
7. Murphy M, Bruno MA, Riedner BA, et al. Propofol anesthesia and sleep: a high-density EEG study. Sleep. 2011;34:283A-291A.
8. Leslie K, Sleigh J, Paech MJ, Voss L, Lim CW, Sleigh C. Dreaming and electroencephalographic changes during anes-thesia maintained with propofol or desflurane. Anesthesiology. 2009;111:547-555.
9. John ER, Prichep LS. The anesthetic cascade: a theory of how anesthesia suppresses consciousness. Anesthesiology. 2005;102:447-471.
10. Gugino LD, Chabot RJ, Prichep LS, John ER, Formanek V, Aglio LS. Quantitative EEG changes associated with loss and return of consciousness in healthy adult volunteers anaesthetized with pro-pofol or sevoflurane. Br J Anaesth. 2001;87:421-428.
11. Purdon PL, Pierce ET, Mukamel EA, et al. Electroencephalogram signatures of loss and recovery of consciousness from propofol. Proc Natl Acad Sci U S A. 2013;110:E1142-E1151.
12. Zikov T, Bibian S, Dumont GA, Huzmezan M, Ries CR. Quantifying cortical activity during general anesthesia using wavelet analysis. IEEE Trans Biomed Eng. 2006;53:617-632.
13. Bibian S, Dumont GA, Zikov T. Dynamic behavior of BIS, M-entropy and neuroSENSE brain function monitors. J Clin Monit Comput. 2011;25:81-87.
14. Barrett AB, Murphy M, Bruno MA, et al. Granger causality analysis of steady-state electroencephalographic signals during propofol-induced anaesthesia. PLoS One. 2012;7(1):e29072.
15. Mashour GA. Consciousness unbound: toward a paradigm of general anesthesia. Anesthesiology. 2004;100:428-433.
16. Lee U, Lee H, Muller M, Noh GJ, Mashour GA. Genuine and spurious phase synchronization strengths during consciousness and general anesthesia. PLoS One. 2012;7(10): e46313.
17. Hirota K. Special cases: ketamine, nitrous oxide and xenon. Best Pract Res Clin Anaesthesiol. 2006;20:69-79.
18. Bonhomme V, Maquet P, Phillips C, et al. The effect of clonidine infusion on distribution of regional cerebral blood flow in volun-teers. Anesth Analg. 2008;106:899-909.
19. Bruhn J, Ropcke H, Rehberg B, Bouillon T, Hoeft A. Electroencephalogram approximate entropy correctly classifies the occurrence of burst suppression pattern as increasing anes-thetic drug effect. Anesthesiology. 2000;93:981-985.
20. Shalbaf R, Behnam H, Sleigh J, Voss L. Measuring the effects of sevoflurane on electroencephalogram using sample entropy. Acta Anaesthesiol Scand. 2012;56:880-889.
21. Jordan D, Stockmanns G, Kochs EF, Pilge S, Schneider G. Electroencephalographic order pattern analysis for the separation of consciousness and unconsciousness: an analysis of approximate entropy, permutation entropy, recurrence rate, and phase coupling of order recurrence plots. Anesthesiology. 2008;109:1014-1022.
22. Ku SW, Lee U, Noh GJ, Jun IG, Mashour GA. Preferential inhibi-tion of frontal-to-parietal feedback connectivity is a neurophysi-ologic correlate of general anesthesia in surgical patients. PLoS One. 2011;6(10):e25155.
23. Friston K, Moran R, Seth AK. Analysing connectivity with Granger causality and dynamic causal modelling. Curr Opin Neurobiol. 2013;23:172-178.
24. Hindriks R, van Putten MJ. Meanfield modeling of propofol-induced changes in spontaneous EEG rhythms. Neuroimage. 2012;60:2323-2334.
25. Bonhomme V, Hans P. Cerebral monitoring devices: what we pay for. Acta Anaesthesiol Belg. 2006;57:419-428.
26. Bonhomme V, Hans P. Monitoring depth of anaesthesia: is it worth the effort? Eur J Anaesthesiol. 2004;21:423-428.
27. Schraag S, Mohl U, Bothner U, Georgieff M. Clinical utility of EEG parameters to predict loss of consciousness and response to skin incision during total intravenous anaesthesia. Anaesthesia. 1998;53:320-325.
28. Johansen JW. Update on bispectral index monitoring. Best Pract Res Clin Anaesthesiol. 2006;20:81-99.
29. Entropy Bein B.. Best Pract Res Clin Anaesthesiol. 2006;20:101-109.
30. Takamatsu I, Ozaki M, Kazama T. Entropy indices vs the bispec-tral index for estimating nociception during sevoflurane anaesthe-sia. Br J Anaesth. 2006;96:620-626.
31. Drover D, Ortega HR. Patient state index. Best Pract Res Clin Anaesthesiol. 2006;20:121-128.
32. White PF, Tang J, Ma H, Wender RH, Sloninsky A, Kariger R. Is the patient state analyzer with the PSArray2 a cost-effective alternative to the bispectral index monitor during the periopera-tive period? Anesth Analg. 2004;99:1429-1435.
33. Jensen EW, Litvan H, Revuelta M, et al. Cerebral state index dur-ing propofol anesthesia: a comparison with the bispectral index and the A-line ARX index. Anesthesiology. 2006;105:28-36.
34. Pilge S, Blum J, Kochs EF, Schoniger SA, Kreuzer M, Schneider G. Does the cerebral state index separate consciousness from unconsciousness? Anesth Analg. 2011;113:1403-1410.
35. Stoppe C, Peters D, Fahlenkamp AV, et al. aepEX monitor for the measurement of hypnotic depth in patients undergoing balanced xenon anaesthesia. Br J Anaesth. 2012;108:80-88.
36. Nishiyama T. Comparison of the two different auditory evoked potentials index monitors in propofol-fentanyl-nitrous oxide anesthesia. J Clin Anesth. 2009;21:551-554.
37. Avidan MS, Zhang L, Burnside BA, et al. Anesthesia awareness and the bispectral index. N Engl J Med. 2008;358:1097-1108.
38. Avidan MS, Jacobsohn E, Glick D, et al. Prevention of intraoper-ative awareness in a high-risk surgical population. N Engl J Med. 2011;365:591-600.
39. Zhang C, Xu L, Ma YQ, et al. Bispectral index monitoring pre-vent awareness during total intravenous anesthesia: a prospective, randomized, double-blinded, multi-center controlled trial. Chin Med J (Engl). 2011;124:3664-3669.
40. Myles PS, Leslie K, McNeil J, Forbes A, Chan MT. Bispectral index monitoring to prevent awareness during anaesthesia: the B-Aware randomised controlled trial. Lancet. 2004;363:1757-1763.
at Universite de Liege on September 5, 2014eeg.sagepub.comDownloaded from
Marchant et al 31
41. Mashour GA, Shanks A, Tremper KK, et al. Prevention of intra-operative awareness with explicit recall in an unselected surgi-cal population: a randomized comparative effectiveness trial. Anesthesiology. 2012;117:717-725.
42. Ekman A, Lindholm ML, Lennmarken C, Sandin R. Reduction in the incidence of awareness using BIS monitoring. Acta Anaesthesiol Scand. 2004;48:20-26.
43. Avidan MS, Mashour GA. Prevention of intraoperative awareness with explicit recall: making sense of the evidence. Anesthesiology. 2013;118:449-456.
44. Pilge S, Zanner R, Schneider G, Blum J, Kreuzer M, Kochs EF. Time delay of index calculation: analysis of cerebral state, bispec-tral, and narcotrend indices. Anesthesiology. 2006;104:488-494.
45. Zanner R, Pilge S, Kochs EF, Kreuzer M, Schneider G. Time delay of electroencephalogram index calculation: analysis of cerebral state, bispectral, and Narcotrend indices using periop-eratively recorded electroencephalographic signals. Br J Anaesth. 2009;103:394-399.
46. Kreuzer M, Zanner R, Pilge S, Paprotny S, Kochs EF, Schneider G. Time delay of monitors of the hypnotic component of anesthe-sia: analysis of state entropy and index of consciousness. Anesth Analg. 2012;115:315-319.
47. Aime I, Gayat E, Fermanian C, et al. Effect of age on the com-parability of bispectral and state entropy indices during the maintenance of propofol-sufentanil anaesthesia. Br J Anaesth. 2012;108:638-643.
48. Bouillon TW, Bruhn J, Radulescu L, et al. Pharmacodynamic inter-action between propofol and remifentanil regarding hypnosis, toler-ance of laryngoscopy, bispectral index, and electroencephalographic approximate entropy. Anesthesiology. 2004;100:1353-1372.
49. Vereecke HE, Vanluchene AL, Mortier EP, Everaert K, Struys MM. The effects of ketamine and rocuronium on the A-Line audi-tory evoked potential index, bispectral index, and spectral entropy monitor during steady state propofol and remifentanil anesthesia. Anesthesiology. 2006;105:1122-1134.
50. Hans P, Dewandre PY, Brichant JF, Bonhomme V. Comparative effects of ketamine on bispectral index and spectral entropy of the electroencephalogram under sevoflurane anaesthesia. Br J Anaesth. 2005;94:336-340.
51. Dahaba AA, Bornemann H, Hopfgartner E, et al. Effect of sugam-madex or neostigmine neuromuscular block reversal on bispec-tral index monitoring of propofol/remifentanil anaesthesia. Br J Anaesth. 2012;108:602-606.
52. Bonhomme V, Hans P. Muscle relaxation and depth of anaesthe-sia: where is the missing link? Br J Anaesth. 2007;99:456-460.
53. Sanders RD, Tononi G, Laureys S, Sleigh JW. Unresponsiveness not equal unconsciousness. Anesthesiology. 2012;116:946-959.
54. Russell IF. The ability of bispectral index to detect intra-operative wakefulness during total intravenous anaesthesia compared with the isolated forearm technique. Anaesthesia. 2013;68:502-511.
55. Klopman MA, Sebel PS. Cost-effectiveness of bispectral index monitoring. Curr Opin Anaesthesiol. 2011;24:177-181.
56. White PF. Use of cerebral monitoring during anaesthesia: effect on recovery profile. Best Pract Res Clin Anaesthesiol. 2006;20:181-189.
57. Hor TE, Van Der Linden P, De HS, Melot C, Bidgoli J. Impact of entropy monitoring on volatile anesthetic uptake. Anesthesiology. 2013;118:868-873.
58. Monk TG, Saini V, Weldon BC, Sigl JC. Anesthetic management and one-year mortality after noncardiac surgery. Anesth Analg. 2005;100:4-10.
59. Lindholm ML, Traff S, Granath F, et al. Mortality within 2 years after surgery in relation to low intraoperative bispectral index values and preexisting malignant disease. Anesth Analg. 2009;108:508-512.
60. Leslie K, Myles PS, Forbes A, Chan MT. The effect of bispec-tral index monitoring on long-term survival in the B-aware trial. Anesth Analg. 2010;110:816-822.
61. Kertai MD, Pal N, Palanca BJ, et al. Association of periopera-tive risk factors and cumulative duration of low bispectral index with intermediate-term mortality after cardiac surgery in the B-Unaware Trial. Anesthesiology. 2010;112:1116-1127.
62. Liu N, Le GM, Benabbes-Lambert F, et al. Feasibility of closed-loop titration of propofol and remifentanil guided by the spectral M-Entropy monitor. Anesthesiology. 2012;116:286-295.
63. Liu N, Chazot T, Hamada S, et al. Closed-loop coadministration of propofol and remifentanil guided by bispectral index: a ran-domized multicenter study. Anesth Analg. 2011;112:546-557.
64. Liu N, Chazot T, Trillat B, et al. Feasibility of closed-loop titration of propofol guided by the Bispectral Index for general anaesthesia induction: a prospective randomized study. Eur J Anaesthesiol. 2006;23:465-469.
65. Liu N, Chazot T, Genty A, et al. Titration of propofol for anes-thetic induction and maintenance guided by the bispectral index: closed-loop versus manual control: a prospective, randomized, multicenter study. Anesthesiology. 2006;104:686-695.
66. Reboso JA, Mendez JA, Reboso HJ, Leon AM. Design and implementation of a closed-loop control system for infusion of propofol guided by bispectral index (BIS). Acta Anaesthesiol Scand. 2012;56:1032-1041.
67. Struys MM, Mortier EP, De ST. Closed loops in anaesthesia. Best Pract Res Clin Anaesthesiol. 2006;20:211-220.
68. Struys MM, De Smet T, Versichelen LF, Van De Velde S, Van den Broecke R, Mortier EP. Comparison of closed-loop con-trolled administration of propofol using Bispectral Index as the controlled variable versus “standard practice” controlled admin-istration. Anesthesiology. 2001;95:6-17.
69. Lee U, Kim S, Noh GJ, Choi BM, Hwang E, Mashour GA. The directionality and functional organization of frontoparietal connectivity during consciousness and anesthesia in humans. Conscious Cogn. 2009;18:1069-1078.
70. Hudetz AG. Feedback suppression in anesthesia. Is it reversible? Conscious Cogn. 2009;18:1079-1081.
71. Nicolaou N, Hourris S, Alexandrou P, Georgiou J. EEG-based auto-matic classification of ‘awake’ versus ‘anesthetized’ state in general anesthesia using Granger causality. PLoS One. 2012;7(3):e33869.
72. Guignard B. Monitoring analgesia. Best Pract Res Clin Anaesthesiol. 2006;20:161-180.
73. Barvais L, Engelman E, Eba JM, Coussaert E, Cantraine F, Kenny GN. Effect site concentrations of remifentanil and pupil response to noxious stimulation. Br J Anaesth. 2003;91:347-352.
74. Jeanne M, Clement C, De JJ, Logier R, Tavernier B. Variations of the analgesia nociception index during general anaesthe-sia for laparoscopic abdominal surgery. J Clin Monit Comput. 2012;26:289-294.
75. Logier R, Jeanne M, De JJ, Dassonneville A, Delecroix M, Tavernier B. PhysioDoloris: a monitoring device for analgesia/nociception balance evaluation using heart rate variability analy-sis. Conf Proc IEEE Eng Med Biol Soc. 2010; 2010:1194-1197.
76. Shimoda O, Ikuta Y, Sakamoto M, Terasaki H. Skin vasomotor reflex predicts circulatory responses to laryngoscopy and intuba-tion. Anesthesiology. 1998;88:297-304.
at Universite de Liege on September 5, 2014eeg.sagepub.comDownloaded from

32 Clinical EEG and Neuroscience 45(1)
77. Gjerstad AC, Storm H, Hagen R, Huiku M, Qvigstad E, Raeder J. Comparison of skin conductance with entropy during intubation, tetanic stimulation and emergence from general anaesthesia. Acta Anaesthesiol Scand. 2007;51:8-15.
78. von Dincklage F, Hackbarth M, Mager R, Rehberg B, Baars JH. Monitoring of the responsiveness to noxious stimuli during anaesthesia with propofol and remifentanil by using RIII reflex threshold and bispectral index. Br J Anaesth. 2010;104:201-208.
79. Baars JH, Mager R, Dankert K, Hackbarth M, von Dincklage F, Rehberg B. Effects of sevoflurane and propofol on the noci-ceptive withdrawal reflex and on the H reflex. Anesthesiology. 2009;111:72-81.
80. Huiku M, Uutela K, van Gils M, et al. Assessment of surgical stress during general anaesthesia. Br J Anaesth. 2007;98:447-455.
81. Wennervirta J, Hynynen M, Koivusalo AM, Uutela K, Huiku M, Vakkuri A. Surgical stress index as a measure of nociception/anti-nociception balance during general anesthesia. Acta Anaesthesiol Scand. 2008;52:1038-1045.
82. Struys MM, Vanpeteghem C, Huiku M, Uutela K, Blyaert NB, Mortier EP. Changes in a surgical stress index in response to stan-dardized pain stimuli during propofol-remifentanil infusion. Br J Anaesth. 2007;99:359-367.
83. Gruenewald M, Meybohm P, Ilies C, et al. Influence of differ-ent remifentanil concentrations on the performance of the surgi-cal stress index to detect a standardized painful stimulus during sevoflurane anaesthesia. Br J Anaesth. 2009;103:586-593.
84. Bergmann I, Gohner A, Crozier TA, et al. Surgical pleth index-guided remifentanil administration reduces remifentanil and propofol consumption and shortens recovery times in outpatient anaesthesia. Br J Anaesth. 2013;110:622-628.
85. Bonhomme V, Uutela K, Hans G, et al. Comparison of the sur-gical Pleth Index with haemodynamic variables to assess noci-ception-anti-nociception balance during general anaesthesia. Br J Anaesth. 2011;106:101-111.
86. Hans P, Verscheure S, Uutela K, Hans G, Bonhomme V. Effect of a fluid challenge on the Surgical Pleth Index during stable propofol-remifentanil anaesthesia. Acta Anaesthesiol Scand. 2012;56:787-796.
87. Hocker J, Broch O, Grasner JT, et al. Surgical stress index in response to pacemaker stimulation or atropine. Br J Anaesth. 2010;105:150-154.
88. Luginbuhl M, Schumacher PM, Vuilleumier P, et al. Noxious stimulation response index: a novel anesthetic state index based on hypnotic-opioid interaction. Anesthesiology. 2010;112:872-880.
89. von Dincklage F, Correll C, Schneider MH, Rehberg B, Baars JH. Utility of Nociceptive Flexion Reflex Threshold, Bispectral Index, Composite Variability Index and Noxious Stimulation Response Index as measures for nociception during general anaesthesia. Anaesthesia. 2012;67:899-905.
90. Kochs E, Treede RD, Schulte am Esch J, Bromm B. Modulation of pain-related somatosensory evoked potentials by general anes-thesia. Anesth Analg. 1990;71:225-230.
91. Bonhomme V, Llabres V, Dewandre PY, Brichant JF, Hans P. Combined use of Bispectral Index and A-Line Autoregressive Index to assess anti-nociceptive component of balanced anaesthe-sia during lumbar arthrodesis. Br J Anaesth. 2006;96:353-360.
92. Mathews DM, Clark L, Johansen J, Matute E, Seshagiri CV. Increases in electroencephalogram and electromyogram variabil-ity are associated with an increased incidence of intraoperative somatic response. Anesth Analg. 2012;114:759-770.
93. Mashour GA, Avidan MS. Variability indices of processed electroencephalography and electromyography. Anesth Analg. 2012;114:713-714.
94. Guerrero JL, Matute E, Alsina E, Del BB, Gilsanz F. Response entropy changes after noxius stimulus. J Clin Monit Comput. 2012;26:171-175.
95. Aho AJ, Lyytikainen LP, Yli-Hankala A, Kamata K, Jantti V. Explaining entropy responses after a noxious stimulus, with or without neuromuscular blocking agents, by means of the raw electroencephalographic and electromyographic characteristics. Br J Anaesth. 2011;106:69-76.
96. Kawaguchi M, Takamatsu I, Kazama T. Rocuronium dose-depend-ently suppresses the spectral entropy response to tracheal intuba-tion during propofol anaesthesia. Br J Anaesth. 2009;102:667-672.
97. Hans P, Giwer J, Brichant JF, Dewandre PY, Bonhomme V. Effect of an intubation dose of rocuronium on Spectral Entropy and Bispectral IndexTM responses to laryngoscopy during propo-fol anaesthesia. Br J Anaesth. 2006;97:842-847.
98. Bonhomme VL, Boveroux P, Brichant JF, Laureys S, Boly M. Neural correlates of consciousness during general anesthesia using functional magnetic resonance imaging (fMRI). Arch Ital Biol. 2012;150:155-163.
99. Bonhomme V, Boveroux P, Hans P, et al. Influence of anesthesia on cerebral blood flow, cerebral metabolic rate, and brain func-tional connectivity. Curr Opin Anaesthesiol. 2011;24:474-479.
100. Velly LJ, Rey MF, Bruder NJ, et al. Differential dynamic of action on cortical and subcortical structures of anesthetic agents during induction of anesthesia. Anesthesiology. 2007;107:202-212.
101. Ramani R, Qiu M, Constable RT. Sevoflurane 0.25 MAC pref-erentially affects higher order association areas: a functional magnetic resonance imaging study in volunteers. Anesth Analg. 2007;105:648-655.
102. Boveroux P, Vanhaudenhuyse A, Bruno MA, et al. Breakdown of within- and between-network resting state functional magnetic resonance imaging connectivity during propofol-induced loss of consciousness. Anesthesiology. 2010;113:1038-1053.
103. Hudetz AG. General anesthesia and human brain connectivity. Brain Connect. 2012;2:291-302.
104. Mhuircheartaigh RN, Rosenorn-Lanng D, Wise R, Jbabdi S, Rogers R, Tracey I. Cortical and subcortical connectivity changes during decreasing levels of consciousness in humans: a functional magnetic resonance imaging study using propofol. J Neurosci. 2010;30:9095-9102.
105. Lewis LD, Weiner VS, Mukamel EA, et al. Rapid fragmentation of neuronal networks at the onset of propofol-induced uncon-sciousness. Proc Natl Acad Sci U S A. 2012;109:E3377-E3386.
106. Friedman EB, Sun Y, Moore JT, et al. A conserved behavioral state barrier impedes transitions between anesthetic-induced unconsciousness and wakefulness: evidence for neural inertia. PLoS One. 2010;5(7):e11903.
107. Tononi G. An information integration theory of consciousness. BMC Neurosci. 2004;5:42.
108. Baars BJ, Ramsoy TZ, Laureys S. Brain, conscious experience and the observing self. Trends Neurosci. 2003;26:671-675.
109. Changeux JP. Conscious processing: implications for general anesthesia. Curr Opin Anaesthesiol. 2012;25:397-404.
110. Seth AK, Izhikevich E, Reeke GN, Edelman GM. Theories and measures of consciousness: an extended framework. Proc Natl Acad Sci U S A. 2006;103:10799-10804.
111. Rampil IJ. Electroencephalogram. In: Albin MS, ed. Textbook of Neuroanesthesia: With Neurosurgical and Neuroscience Perspectives. 1st ed. New York, NY: McGraw-Hill: 1997;193-219.
at Universite de Liege on September 5, 2014eeg.sagepub.comDownloaded from