Climatology of Asia Region - Web UPI Official
17
1 Climatology of South – East Asia Region *) By : Bayong Tjasyono HK. Atmospheric Sciences Research Group Faculty of Earth Sciences and Technology Institut Teknologi Bandung, Indonesia Abstract The number of meteorological station in general is small in the South – East Asia Region, particularly in mountainous areas. During the Second World War and the Vietnam War these was an interruption in weather observation, so that it necessary to use old soucers which are often with small accuracy. South–East Asia Region is generally affected by Indian monsoon or Australasia monsoon. This region covered by tropical atmosphere. Meteorologist often use the boundary to define tropical atmosphere by using the latitude of 30 0 N and 30 0 S, which is known as “horse latitude”, but the others use the latitude 23.5 0 N (tropics of Cancer) and 23.5 0 S (tropics of Capricorn). The Walker circulation is a zonal circulation along the equator indicated by the air mass increase in the western and decrease in eastern Pacific. The warm episode in the central and eastern Pacific Ocean is called the El Niño years, and the cool episode is called the La Niña years. The Walker circulation intensity is recognized through the variation in sea surface temperature (SST). The sea– atmosphere coupling event is called ENSO (El Niño – Southenr Oscillation). ENSO causes a rainfall deficiency and a long drought in Indonesia and Philippine. ________________________ *) Submitted to The Second Workshop on ASEAN Regional Climate Model Validation, Puslitbang BMG, 7 – 9 July 2008, Yogyakarta.
Transcript of Climatology of Asia Region - Web UPI Official

1
Climatology of South – East Asia Region *)
By : Bayong Tjasyono HK. Atmospheric Sciences Research Group
Faculty of Earth Sciences and Technology Institut Teknologi Bandung, Indonesia
Abstract
The number of meteorological station in general is small in the South – East
Asia Region, particularly in mountainous areas. During the Second World War and
the Vietnam War these was an interruption in weather observation, so that it
necessary to use old soucers which are often with small accuracy.
South–East Asia Region is generally affected by Indian monsoon or
Australasia monsoon. This region covered by tropical atmosphere. Meteorologist
often use the boundary to define tropical atmosphere by using the latitude of 300 N
and 300 S, which is known as “horse latitude”, but the others use the latitude 23.50
N (tropics of Cancer) and 23.50 S (tropics of Capricorn).
The Walker circulation is a zonal circulation along the equator indicated by
the air mass increase in the western and decrease in eastern Pacific. The warm
episode in the central and eastern Pacific Ocean is called the El Niño years, and the
cool episode is called the La Niña years. The Walker circulation intensity is
recognized through the variation in sea surface temperature (SST). The sea–
atmosphere coupling event is called ENSO (El Niño – Southenr Oscillation). ENSO
causes a rainfall deficiency and a long drought in Indonesia and Philippine.
________________________
*) Submitted to The Second Workshop on ASEAN Regional Climate Model
Validation, Puslitbang BMG, 7 – 9 July 2008, Yogyakarta.
2
Solar Radiation
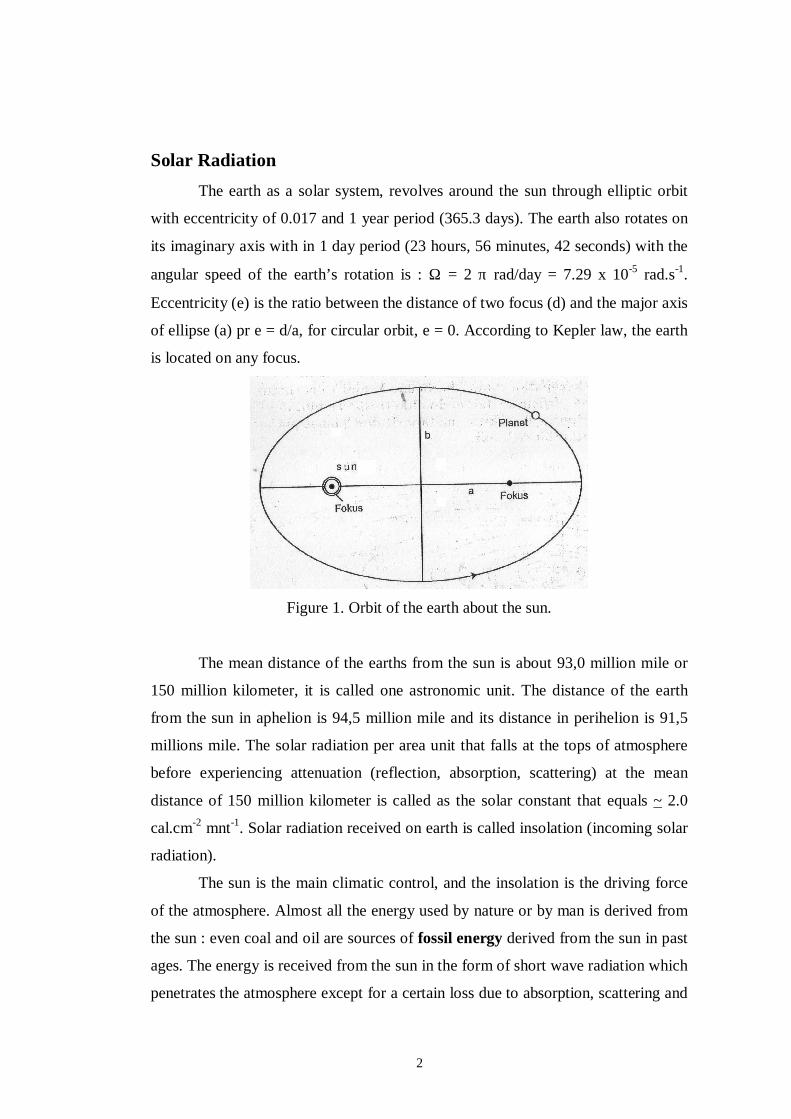
The earth as a solar system, revolves around the sun through elliptic orbit
with eccentricity of 0.017 and 1 year period (365.3 days). The earth also rotates on
its imaginary axis with in 1 day period (23 hours, 56 minutes, 42 seconds) with the
angular speed of the earth’s rotation is : Ω = 2 π rad/day = 7.29 x 10⁻⁵ rad.s-1.
Eccentricity (e) is the ratio between the distance of two focus (d) and the major axis
of ellipse (a) pr e = d/a, for circular orbit, e = 0. According to Kepler law, the earth
is located on any focus.
Figure 1. Orbit of the earth about the sun.
The mean distance of the earths from the sun is about 93,0 million mile or
150 million kilometer, it is called one astronomic unit. The distance of the earth
from the sun in aphelion is 94,5 million mile and its distance in perihelion is 91,5
millions mile. The solar radiation per area unit that falls at the tops of atmosphere
before experiencing attenuation (reflection, absorption, scattering) at the mean
distance of 150 million kilometer is called as the solar constant that equals ~ 2.0
cal.cm-2 mnt-1. Solar radiation received on earth is called insolation (incoming solar
radiation).
The sun is the main climatic control, and the insolation is the driving force
of the atmosphere. Almost all the energy used by nature or by man is derived from
the sun : even coal and oil are sources of fossil energy derived from the sun in past
ages. The energy is received from the sun in the form of short wave radiation which
penetrates the atmosphere except for a certain loss due to absorption, scattering and

3
reflection. Some of the energy received at the earth’s surface is also lost by
reflection especially over snow and water surfaces. Therefore, the main radiation or
energy source for the earth is the sun.
The energy is carried to earth by electromagnetic radiation. It travels at
speed of light in the form of waves which, like sea waves. Solar radiation is
referred to as shortwave radiation and has wavelengths between 0.15 and 3.0 µm.
Radiation with wavelengths between 3.0 and 100 µm (micrometer) is referred to as
longwave or infrared radiation. In the earth’s atmosphere or at the earth’s surface,
radiation can be absorbed, reflected, transmitted or re–emitted.
Several laws describe the characteristics of emitted radiation, based on the
black body concept. The quantity of radiation emitted by black body per second per
area unit is :
4b TE σ= (1a)
called as the Stefan–Boltzmann law, where σ = 56.7 nWm-2 K-4 (1 nW = 10-9 W)
called Stefan–Boltzmann constant, and T is absolute temperature. If the object is
not a perfect black body (gray body), the equation (1a) can be expressed as :
4b TE εσ= (1b)
where ε : emissivity is a measure of the ability of a body to emit the radiation. For
black body ε = 1 and gray body ε < 1. Typical emissivity values for natural
materials are given in Table 1.
Table 1. Emissivity values for natural materials (Mc Gregor and Nieuwolt, 1998)
Material ε (Emissivity)
Soils (dark wet to light dry)
Desert
Grass (long to short)
Agricultural crops
Deciduous forests
Water
0.90 – 0.98
0.84 – 0.91
0.90 – 0.95
0.90 – 0.99
0.98
0.92 – 0.97

4
For a given temperature there is a single peak of emission at one
wavelength. The wavelength of peak emission (λmax) may be estimated using
Wien’s displacement law expressed as :
T
amax =λ (2)
a = 2897, when λmax in micrometer and T in Kelvin. The higher the absolute
temperature (T), the shorter the wavelength Figure 2, for the cases of 6000 K and
300 K which are representative absolute temperatures for the sun and the earth.
Figure 2. Distribution of radiant energy from a black body at 6000 K (left hand side
vertical and lower horizontal axes). Peak emittances are in the shortwave
range of 0.4 to 0.6 µm for the sun (6000 K) and the longwave range of 8
to 12 µm for the earth (300 K). From Mc Gregor and Niewolt, 1998.
The two earth’s rotation and revolution mouvements cause annual migration
of the sun from tropic of Cancer on 22 June to ewuator latitude 00 on 23 September
to tropic of Capricorn on 22 December and back to the equator on 21 March. The
effect of the annual migration of the sun in the four seasons : summer, autumn,
winter and spring, see figure 3. The position of the sun above the equator is twice
per year i.e., on 21 March and 23 September called equinoxes.

5
Figure 3. Annual migration of the sun.
The Monsoons
The word monsoons means season or mausin in Arabian language or
musim in bahasa Indonesia, it implies a change in direction of the surface pressure
gradient and in prevailing weather. The pressure gradient force (Fp) can be
expressed as :
n
p1Fp
∂
∂
ρ−= (3)
The negative sign indicates that the direction of pressure gradient force is from high
pressure cell toward low pressure. The geostrophic wind (Vg) is expressed by :
n
p
f
1Vp
∂
∂
ρ= (4)
Where :
∂n : distance of two isobars
∂p : the difference of high and low pressures
ρ : air density
f : Coriolis parameter, f = 2 Ω sin φ
Ω : angular velocity of the earth’s rotation in the north pole, and in
latitude of φ is Ω sin φ.
6
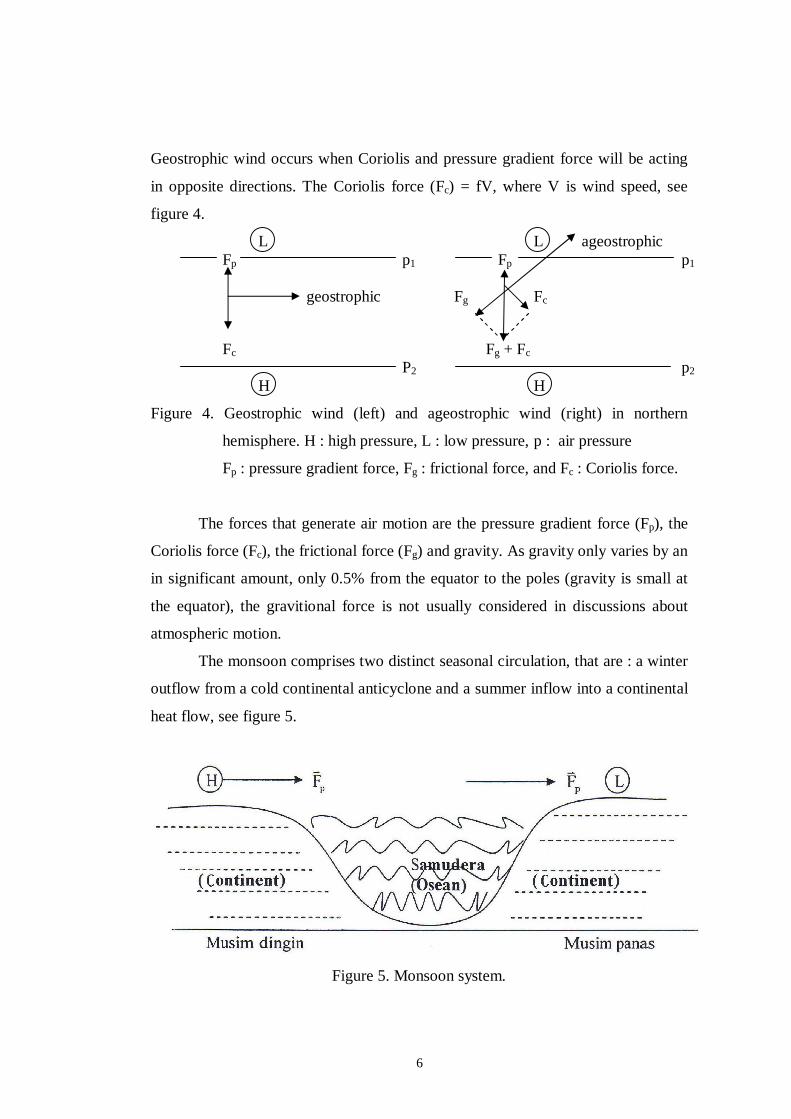
Geostrophic wind occurs when Coriolis and pressure gradient force will be acting
in opposite directions. The Coriolis force (Fc) = fV, where V is wind speed, see
figure 4.
L L ageostrophic Fp p1 Fp p1
geostrophic Fg Fc
Fc Fg + Fc
P2 p2
H H
Figure 4. Geostrophic wind (left) and ageostrophic wind (right) in northern
hemisphere. H : high pressure, L : low pressure, p : air pressure
Fp : pressure gradient force, Fg : frictional force, and Fc : Coriolis force.
The forces that generate air motion are the pressure gradient force (Fp), the
Coriolis force (Fc), the frictional force (Fg) and gravity. As gravity only varies by an
in significant amount, only 0.5% from the equator to the poles (gravity is small at
the equator), the gravitional force is not usually considered in discussions about
atmospheric motion.
The monsoon comprises two distinct seasonal circulation, that are : a winter
outflow from a cold continental anticyclone and a summer inflow into a continental
heat flow, see figure 5.
Figure 5. Monsoon system.

7
The main characteristics of the monsoon regions are as follows :
i. the prevailing wind direction deviates by at least 1200 between January and
July.
ii. the average frequency of prevailing wind direction in January and July is more
than 40%.
iii. less than one cyclone–anticyclone alternation occurs on average every two
years in any one month in a 50 latitude – longitude rectangle.
iv. the mean resultant winds in at least one of the months exceeds 3 ms-1. (Ramage,
1971).
The resultant wind speed (V) :
yx2y
2x VjViVorVVV
rrr+=+= (5)
where :
Vx : zonal (W – E) wind speed
Vy : meridional (S – N) wind speed
The monsoon regions of the world according to these characteristics are
shown in figure 6.
Figure 6. Areas with monsoon circulations according to the criteria of Ramage
(1971).
Three general factors for the existence of the monsoons are :
i. The differential seasonal heating of the oceans and continents. Important
seasonal temperature and pressure changes take place. Seasonal contrasts in
land surface temperature produce atmospheric pressure changes which produce

8
seasonal reversals of the pressure gradient force, the basic driving force of
winds, so that there are major seasonal wind reversals which are referred to as
monsoon.
ii. Moisture processes in the atmosphere. As moist air rises over summertime
heated land surface, then the moisture condenses, releasing energy of latent
heat of condensation. This extra heating raises summer land – ocean pressure
differences higher than in the absence of moisture in the atmosphere. Moisture
processes therefore add to the vigour of the monsoon.
iii. The earth’s rotation. This rotation produces a rotation force called the Coriolis
force. In northern hemisphere the Coriolis force bends the monsoon current to
right–hand, and it bends to the left–hand in southern hemisphere. The Coriolis
force cause the monsoon currents moves in curved paths. Inter – hemispheric
differences in the direction of the Coriolis force also cause winds to change
direction as they cross the equator, see figure 7.
(a)
(b)
Figure 7. East and South–East Asian Monsoon in northern hemisphere winter (a)
and summer (b). Source : Susilo, 1996.

9
Among the monsoons, East and South–East monsons are well development
due to its large of Asian Continent and the effect of highland Tibet as a barrier
between polar and tropical air mass. In northern hemisphere winter, it is formed
high pressure cell in northern Asian Continent centered in Siberia. In southern
hemisphere winter air flow in the opposite direction, southeast wind come from
high pressure cell or anticyclone over Australian Continent blows toward northwest
passes Indonesia and Indian ocean.
Intertropical Convergence Zone
The air mass from the two hemisphere converges in a band called the
Intertropical Convergence zone (ICZ). This ICZ is located in the equatorial low
pressure area as a claudy and weak wind, it is called as doldrums. This
convergence zone has various different name due to different perception about the
structure and characteristic of this convergence zone. Besides Intertropical
Convergence Zone (ICZ), there are the other name, such as Intertropical Front (IF),
Equatorial Front (EF), and Intertropical Discontinuity (ID).
Because of air masses from the two hemispheres have the equal thermal
characteristics, the name of front is less known in the tropic. The application of the
word front i.e., Intertropical Front and Equatorial Front is therefore not exactly the
same. In general, the Intertropical Convergence Zone (ICZ) is used over ocean,
while the Intertropical Discontinuity (ID) is a fitname applied over continent. The
structure and characteristics of ICZ and ID depend on the location, such as
topography, distribution of continent and ocean. ICZ and ID displace toward north
in boreal summer and toward south in austral summer following the annual
migration of the sun. In July (boreal maximum summer) the position of ICZ/ID is
about 250 N over Asia Continent, between 5 and 100 N over ocean. In January
(austral maximum summer) the position of ICZ/ID is about 150 S over continent
and near equator over ocean see Figure 8.

10
Figure 8. Mean position of ICZ in January and July.
The Walker Circulation and Dipole Equatorial Ocean
The Walker circulation is a zonal circulation along the equator. In normal
condition it is characterized by the ascent of air in the western Pacific and descent
in the eastern Pacific off the coast of Equatorial South America. This circulation is
found by Sir Gilbert Walker who in the 1920s, had recognized an east to west
variation of atmospheric pressure across the Pacific. This pressure see–saw Walker
called the southern oscillation (SO). The intensity of the Walker circulation appears
to be controlled by sea surface temperature variation in the eastern and western
Pacific. Changes in sea surface temperatures are transferred into the atmospheric
pressure changes. The increase sea surface temperature (SST) or warm episode in
central and eastern Pacific called El Niño. The combination of ocean and
atmospheric events have known as ENSO (El Niño – Southern Oscillation).
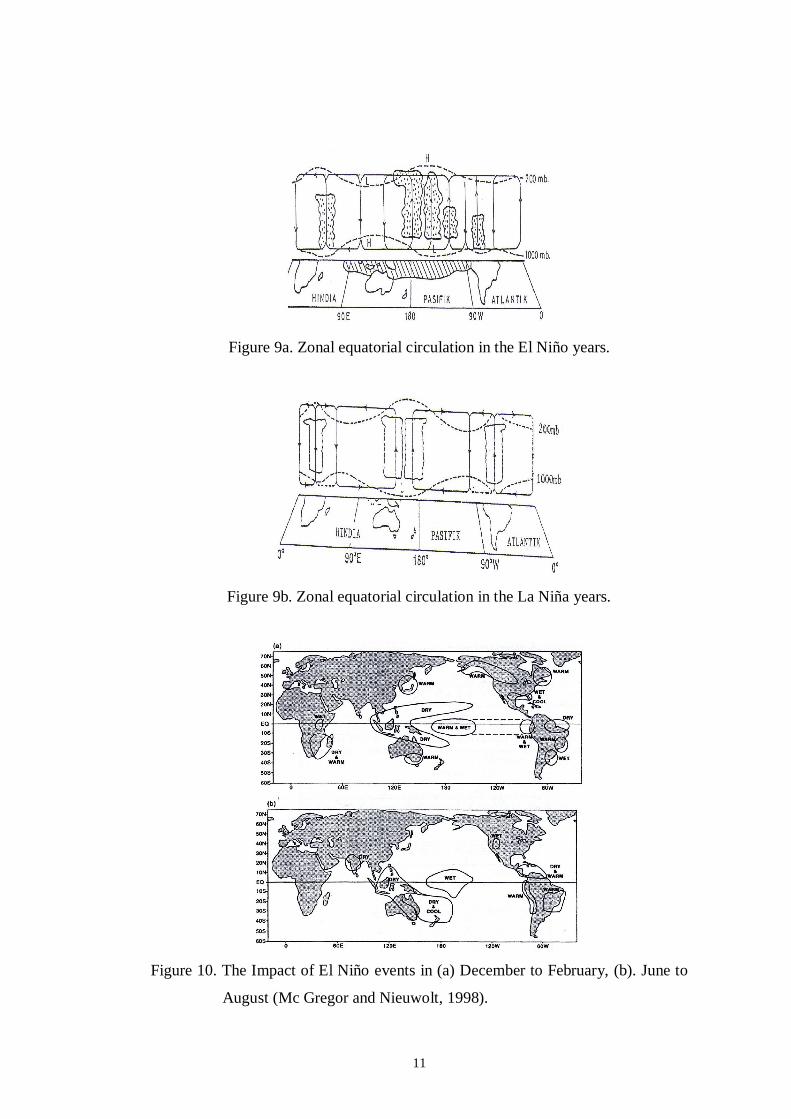
In the El Niño years, the Walker circulation subsides in the western Pacific
and ascends in the central and eastern Pacific. On the Contrary, the non El Niño (La
Niña), the Walker circulation ascends in the western Pacific and descends in the
eastern Pacific. In the La Niña years occur strengthen of the convection in the
western Pacific.
11
Figure 9a. Zonal equatorial circulation in the El Niño years.
Figure 9b. Zonal equatorial circulation in the La Niña years.
Figure 10. The Impact of El Niño events in (a) December to February, (b). June to
August (Mc Gregor and Nieuwolt, 1998).

12
One of the most noticeable changes to weather patterns of the low latitudes
during ENSO years is the shift of thunderstorm activity from the Indonesian area
eastward into the central Pacific. This results is anomalously wet conditions for the
central Pacific islands, whil for tropical Australia, New Guinea, Indonesia and
Philippines, abnormally dry conditions prevail in both summer and winter seasons
(Figure 10).
La Niña, also has associated with it climatic anomalies. There is a complete
reversal of the ENSO climatic anomaly in La Niña years. During La Niña, the
normal central Pacific dryness is worsened due to cooler than normal SST
suppressing rainfall formation processes through their effect on atmospheric
stability (Figure 11).
Figure 11. The impact of La Niña (the antithesis of El Niño) events for (a)
December to February, (b) June to August (Mc Gregor and Nieuwolt,
1998)
Indian Ocean Dipole (IOD) or Dipole Mode (DM) is natural phenomenon
which emerge from coupled interaction between atmosphere and ocean in the Indian
Ocean. Rainfall in the western Sumatera in influenced by Dipole Mode in the
equatorial Indian Ocean (Saji et al., 2001). IOD negative increase and IOD positif
decrease the rainfall in West and South Sumatera. IOD or DM is determined by the

13
fluctuation of SST above and below the normal between east coast of Africa and
west coast of Sumatera. Dipole Mode Index (DMI) is determined by the difference
of SST anomalies in the western (box A : 500 E – 700 E, 100 S – 100 N) and eastern
Indian Ocean (box B : 900 E – 1100 E, 100 S – 00 eq.), see Figure 12 and 13.
Figure 12. Determination of DM in the equatorial Indian Ocean.
Figure 13. Positive and negative Dipole Mode.
14
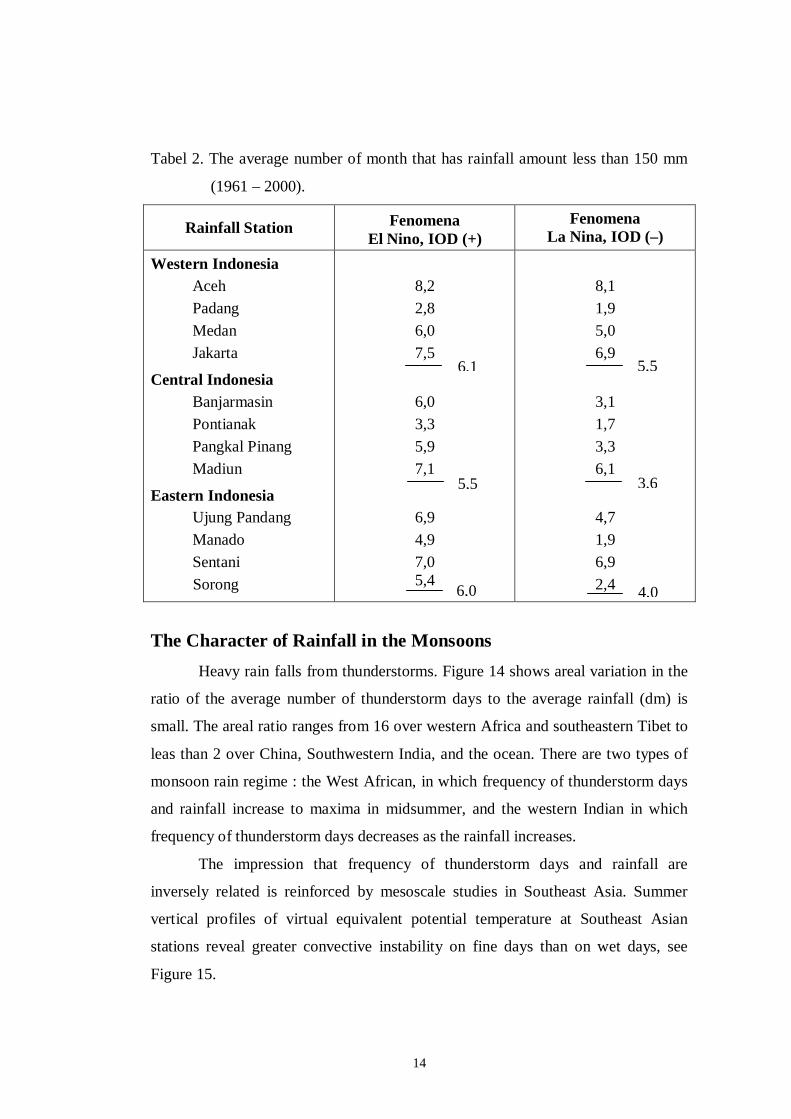
Tabel 2. The average number of month that has rainfall amount less than 150 mm
(1961 – 2000).
Rainfall Station Fenomena El Nino, IOD (+)
Fenomena La Nina, IOD (–)
Western Indonesia
Aceh
Padang
Medan
Jakarta
Central Indonesia
Banjarmasin
Pontianak
Pangkal Pinang
Madiun
Eastern Indonesia
Ujung Pandang
Manado
Sentani
Sorong
8,2
2,8
6,0
7,5
6,0
3,3
5,9
7,1
6,9
4,9
7,0 5,4
8,1
1,9
5,0
6,9
3,1
1,7
3,3
6,1
4,7
1,9
6,9
2,4
The Character of Rainfall in the Monsoons
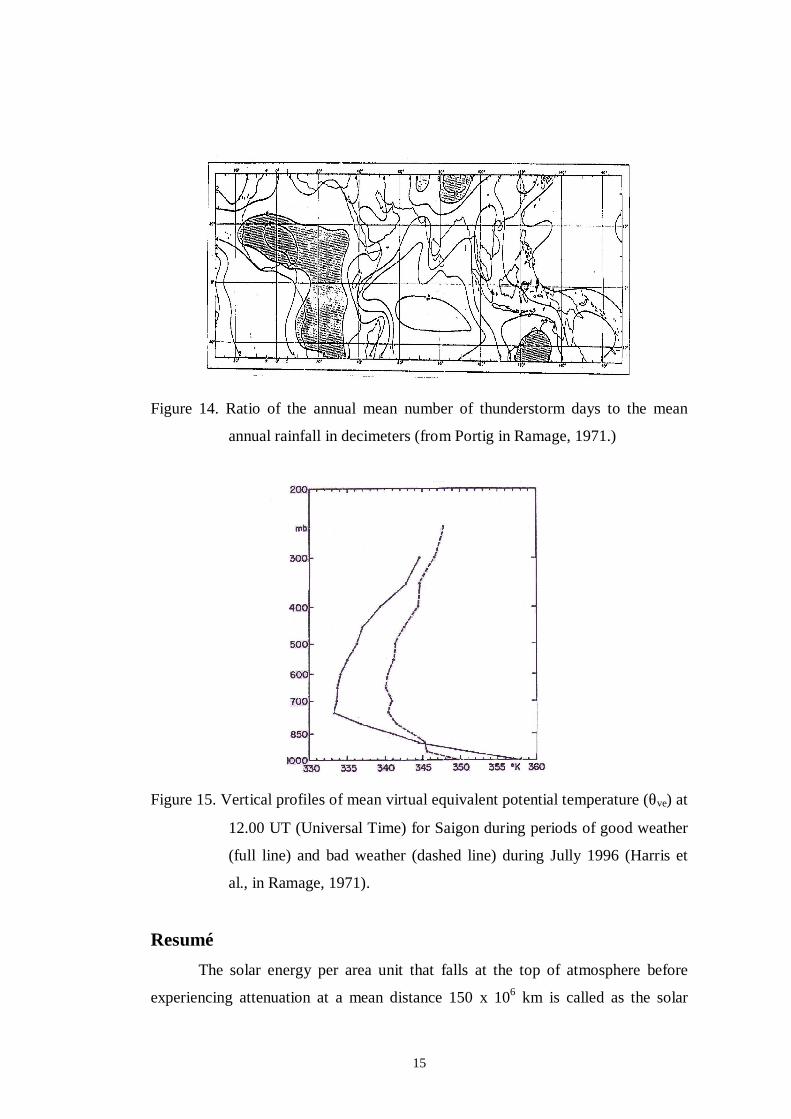
Heavy rain falls from thunderstorms. Figure 14 shows areal variation in the
ratio of the average number of thunderstorm days to the average rainfall (dm) is
small. The areal ratio ranges from 16 over western Africa and southeastern Tibet to
leas than 2 over China, Southwestern India, and the ocean. There are two types of
monsoon rain regime : the West African, in which frequency of thunderstorm days
and rainfall increase to maxima in midsummer, and the western Indian in which
frequency of thunderstorm days decreases as the rainfall increases.
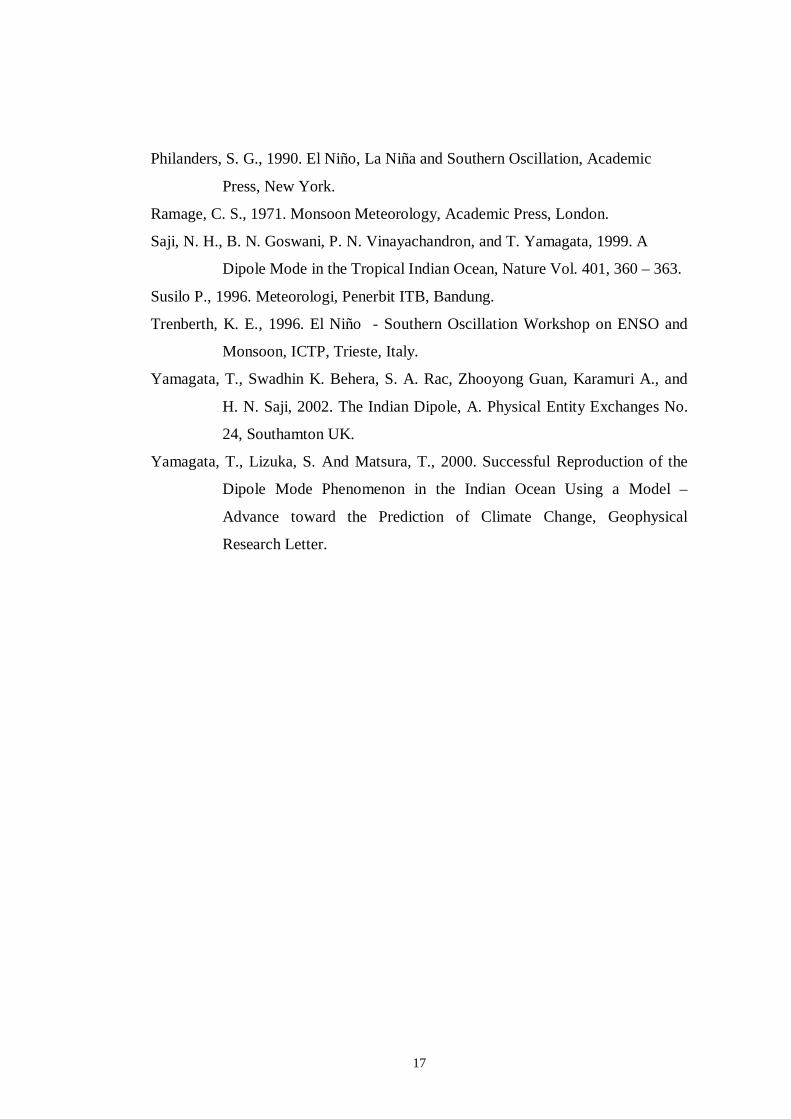
The impression that frequency of thunderstorm days and rainfall are
inversely related is reinforced by mesoscale studies in Southeast Asia. Summer
vertical profiles of virtual equivalent potential temperature at Southeast Asian
stations reveal greater convective instability on fine days than on wet days, see
Figure 15.
6,1
5,5
6,0
5,5
3,6
4,0
15
Figure 14. Ratio of the annual mean number of thunderstorm days to the mean
annual rainfall in decimeters (from Portig in Ramage, 1971.)
Figure 15. Vertical profiles of mean virtual equivalent potential temperature (θve) at
12.00 UT (Universal Time) for Saigon during periods of good weather
(full line) and bad weather (dashed line) during Jully 1996 (Harris et
al., in Ramage, 1971).
Resumé
The solar energy per area unit that falls at the top of atmosphere before
experiencing attenuation at a mean distance 150 x 106 km is called as the solar

16
constant ~ 2.0 cal cm-2 mnt-1. Actually, the solar constant varies depend on the
uphelion and perihelion. Solar radiation is the main energy source for processes that
operate in the climate system. Because the low latitudes receive more radiation than
they lose, the surface net radiation balance is positive.
Monsoon wind is caused by the physical properties between ocean and
continent. The ocean becomes warm slowly when there is solar radiation and it also
becomes cool slowly when there is no sunlight compared to continent. As a result,
the ocean is cooler in summer and it is warmer in winter compared to the continent.
The monsoon are characterized by seasonal reversal of the prevailing wind systems
and seasonal contrast in regimes of cloudiness, precipitation and temperature.
Differential seasonal heating of oceans and continents, moisture processes in the
atmosphere and the earth’s rotation are the main factors which explain the existence
of the monsoon.
The Indian Ocean Dipole (IOD) influence rainfall in the western Sumatera.
IOD negative increase the rainfall, while IOD positive decrease the rainfall in West
and South Sumatera. El Niño/IOD (+) cause the decrease and La Niña/IOD (–)
event cause the increase of rainfall amount in Indonesia. Dipole Mode Index is
determined by the difference of SST anomalies in the western and eastern Indian
Ocean.
Acknowledgements
The author is gratefully thank the Program Riset KK–ITB No. 082d/K01.18/PL/
2008 for funding this research
References
Bayong Tjasyono HK, and A. M. Mustofa, 2000. Seasonal rainfall variation over
monsoonal areas, JTM, Vol. VII, No. 4.
Eva Gusmira, 2005. Pengaruh Dipole Mode terhadap angin zonal dan curah hujan
di Sumatera Barat, Thesis of Atmospheric Sciences, ITB.
Mc Gregor, G. R., and S. Niewolt, 1998. Tropical Climatology, John Wiley &
Sons, New York.
17
Philanders, S. G., 1990. El Niño, La Niña and Southern Oscillation, Academic
Press, New York.
Ramage, C. S., 1971. Monsoon Meteorology, Academic Press, London.
Saji, N. H., B. N. Goswani, P. N. Vinayachandron, and T. Yamagata, 1999. A
Dipole Mode in the Tropical Indian Ocean, Nature Vol. 401, 360 – 363.
Susilo P., 1996. Meteorologi, Penerbit ITB, Bandung.
Trenberth, K. E., 1996. El Niño - Southern Oscillation Workshop on ENSO and
Monsoon, ICTP, Trieste, Italy.
Yamagata, T., Swadhin K. Behera, S. A. Rac, Zhooyong Guan, Karamuri A., and
H. N. Saji, 2002. The Indian Dipole, A. Physical Entity Exchanges No.
24, Southamton UK.
Yamagata, T., Lizuka, S. And Matsura, T., 2000. Successful Reproduction of the
Dipole Mode Phenomenon in the Indian Ocean Using a Model –
Advance toward the Prediction of Climate Change, Geophysical
Research Letter.