
Climate predictions and climate projections
36
Climate predictions and climate projections How are statements about future climate made?
Transcript of Climate predictions and climate projections
Climate predictions and climate projectionsHow are statements about future climate made?

2
3
Contents
Foreword �����������������������������������������������������������������������������������������������������������������������������5
Introduction: The climate system and its variability ���������������������������������������������������������������6
Climate change – its anthropogenic factor �����������������������������������������������������������������������������8
Assessment Report of the Intergovernmental Panel on Climate Change ����������������������������������9
Climate trend in Germany �������������������������������������������������������������������������������������������������� 10
Attribution research at the DWD ���������������������������������������������������������������������������������������� 11
Climate modelling �������������������������������������������������������������������������������������������������������������� 12
Looking into the future requires scenarios of possible developments������������������������������������ 14
Climate projections for several decades to centuries ������������������������������������������������������������ 16
Climate projections for Germany ����������������������������������������������������������������������������������������� 18
Impact of climate change on cities �������������������������������������������������������������������������������������� 20
Climate predictions for the next weeks to years ������������������������������������������������������������������� 22
Always up to date – the decadal climate predictions for the next ten years ��������������������������� 24
The DWD publishes seasonal climate predictions every month ��������������������������������������������� 26
Outlook on the climate conditions for the next few weeks ���������������������������������������������������� 28
The DWD’s climate services based on climate predictions and climate projections ���������������� 30
Outlook ������������������������������������������������������������������������������������������������������������������������������ 33

4
5
ForewordDear readers,
The Deutscher Wetterdienst (DWD) regularly provides the general public, business and polit-
icians with updated climate predictions for the coming weeks, months and years as well as
climate projections up to the end of the 21st century. The products and information derived from
this enable a seamless view into the climatological future and, together with other relevant
framework conditions, provide evidence on which to base planning and policy decisions in the
development of adaptation measures against climate change on various timescales.
Intensive research and development is currently going on in the field of climatology in order to
achieve a better understanding of the many relevant processes within the climate system and
their interactions, as well as to optimise the way they are represented in models. On all time-
scales – from climate predictions for the coming few weeks, months and years through to
climate projections for the next decades and centuries – and on all spatial scales – from
global and regional through to local solutions – the quality of products, predictions and projec-
tions derived from climate simulations can be increased by an improved understanding of the
processes and the subsequent integration of the newly generated knowledge into an Earth
system model. The DWD therefore collaborates with many other national and international
scientific institutions on continuous improvements to predictions and projections and the models
they are based on. The aim of all this work is, based on state-of-the-art research, to provide our
customers with the best possible, quality-assured climate information about the climate of the
future.
This brochure is intended to contribute to the understanding of how statements about the
future climate are made, how they can be interpreted and what services and activities the DWD
contributes in this field.
Tobias Fuchs
Head of Climate and Environment, Deutscher Wetterdienst
6
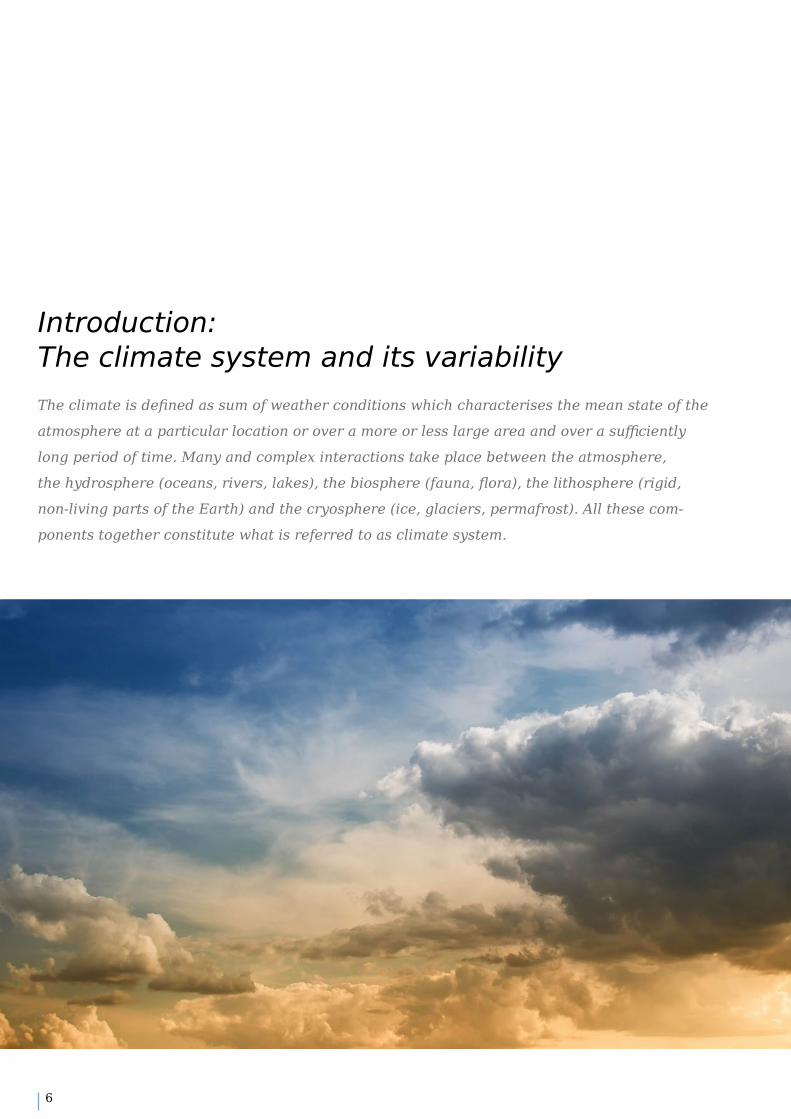
Introduction: The climate system and its variabilityThe climate is defined as sum of weather conditions which characterises the mean state of the
atmosphere at a particular location or over a more or less large area and over a suffciently
long period of time. Many and complex interactions take place between the atmosphere,
the hydrosphere (oceans, rivers, lakes), the biosphere (fauna, flora), the lithosphere (rigid,
non-living parts of the Earth) and the cryosphere (ice, glaciers, permafrost). All these com-
ponents together constitute what is referred to as climate system.
7
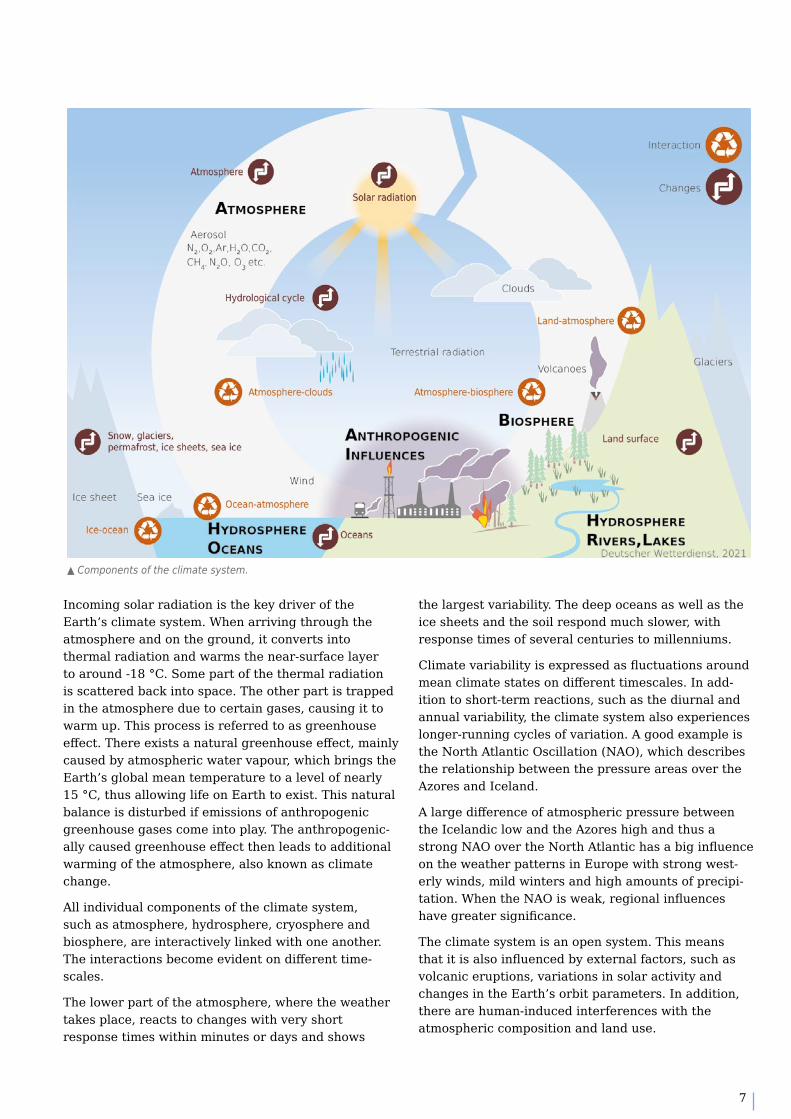
▲ Components of the climate system.
Incoming solar radiation is the key driver of the Earth’s climate system. When arriving through the atmosphere and on the ground, it converts into thermal radiation and warms the near-surface layer to around -18 °C. Some part of the thermal radiation is scattered back into space. The other part is trapped in the atmosphere due to certain gases, causing it to warm up. This process is referred to as greenhouse effect. There exists a natural greenhouse effect, mainly caused by atmospheric water vapour, which brings the Earth’s global mean temperature to a level of nearly 15 °C, thus allowing life on Earth to exist. This natural balance is disturbed if emissions of anthropogenic greenhouse gases come into play. The anthropogenic- ally caused greenhouse effect then leads to additional warming of the atmosphere, also known as climate change.
All individual components of the climate system, such as atmosphere, hydrosphere, cryosphere and biosphere, are interactively linked with one another. The interactions become evident on different time- scales.
The lower part of the atmosphere, where the weather takes place, reacts to changes with very short response times within minutes or days and shows
the largest variability. The deep oceans as well as the ice sheets and the soil respond much slower, with response times of several centuries to millenniums.
Climate variability is expressed as fluctuations around mean climate states on different timescales. In add- ition to short-term reactions, such as the diurnal and annual variability, the climate system also experiences longer-running cycles of variation. A good example is the North Atlantic Oscillation (NAO), which describes the relationship between the pressure areas over the Azores and Iceland.
A large difference of atmospheric pressure between the Icelandic low and the Azores high and thus a strong NAO over the North Atlantic has a big influence on the weather patterns in Europe with strong west-erly winds, mild winters and high amounts of precipi- tation. When the NAO is weak, regional influences have greater significance.
The climate system is an open system. This means that it is also influenced by external factors, such as volcanic eruptions, variations in solar activity and changes in the Earth’s orbit parameters. In addition, there are human-induced interferences with the atmospheric composition and land use.
8
The climate is described by statistical properties (such as averages, extreme values, frequencies, etc.) of the climate elements over a suffciently long period oftime. As recommended by the World Meteorological Organization (WMO), it is common practice to use 30-year periods to record the climate and climatechanges in order to exclude the influence of naturalvariability in statistical analyses. The current 30-yearperiod is 1991–2020. The WMO reference period1961–1990 continues to be used for assessing climatechange and for comparisons with recent measurementdata. Different emission and land use scenarios thattake account of human influence and the possible
evolution of greenhouse gas concentrations have been developed as a basis for estimating the climate trend in the next decades and centuries. One of the scenarios, for example, describes a world in which energy supply largely depends on fossil fuel combus-tion; it is known as business-as-usual scenario, or RCP8.5 for short. Another scenario assumes that global warming can be limited before 2100 to less than 2 °C compared with pre-industrial levels; this scenario is referred to as climate protection scenario, or RCP2.6 for short.
Climate change affects the entire ecosystem. Global warming impacts the whole atmospheric circulation system. This, among other things, leads to changes in the spatial distribution patterns of precipitation. Melting ice from glaciers and polar ice causes the sea levels to rise. Vegetation zones shift.
Recent observations reveal that warming advances faster in the Arctic than in other regions. As the Arctic sea ice melts, the atmosphere warms up more due to shrinking sunlight-reflecting (white) ice surface being replaced by a much darker ocean surface. This absorbs more solar radiation. This effect is known as ice-albedo feedback.
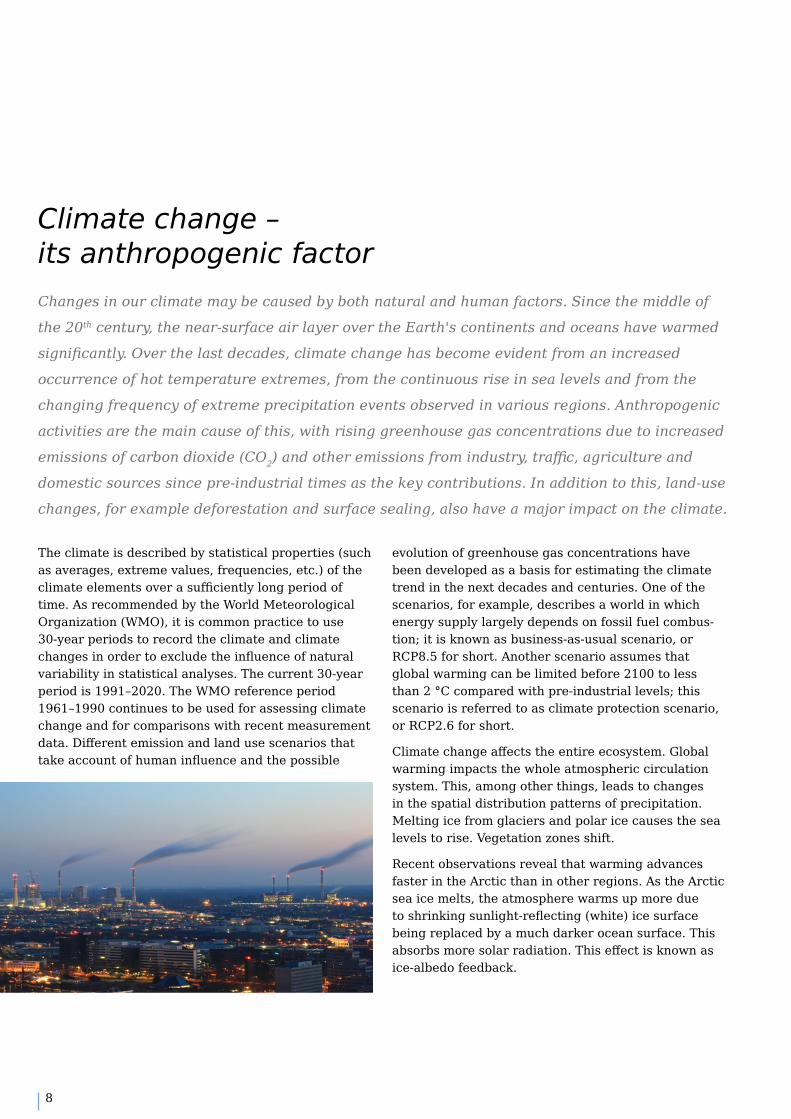
Climate change – its anthropogenic factorChanges in our climate may be caused by both natural and human factors. Since the middle of
the 20th century, the near-surface air layer over the Earth's continents and oceans have warmed
significantly. Over the last decades, climate change has become evident from an increased
occurrence of hot temperature extremes, from the continuous rise in sea levels and from the
changing frequency of extreme precipitation events observed in various regions. Anthropogenic
activities are the main cause of this, with rising greenhouse gas concentrations due to increased
emissions of carbon dioxide (CO2) and other emissions from industry, traffc, agriculture and
domestic sources since pre-industrial times as the key contributions. In addition to this, land-use
changes, for example deforestation and surface sealing, also have a major impact on the climate.

9
The Intergovernmental Panel on Climate Change has the task of summarising the state of scientific research on climate change for policy makers to enable them to make science-based decisions. A further task is to compile international research on the impacts of global warming and its risks, as well as mitigation and adaptation strategies in a report and to make a scientific assessment. Hundreds of scientists from all over the world contribute to the work of the IPCC, bringing together the findings of all climate research in the IPCC's Assessment Reports. To date, the IPCC has published five complete Assessment Reports and more than ten Special Reports, as well as Guidelines for National Greenhouse Gas Inventories.
The IPCC’s Sixth Assessment Report (AR6) will be completed in 2022. It consists of three volumes, each
written by a separate Working Group (WG), as well as an overarching synthesis report:
◆ WG I – The Physical Science Basis of ClimateChange (publication in August 2021)
◆ WG II - Climate Change: Impacts, Adaptation andVulnerability (scheduled publication in February2022)
◆ WG III – Mitigation of Climate Change (scheduledpublication in March 2022)
◆ Synthesis Report – Overview of the key state-ments of the three Working Group volumes andthe three Special Reports: 1.5 °C global warming,ocean and cryosphere, climate change and landsystems (scheduled publication in September2022).
Assessment Report of the Intergovernmental Panel on Climate ChangeThe Intergovernmental Panel on Climate Change (IPCC) is a United Nations body created in
1988 by the United Nations Environment Programme (UNEP) and the World Meteorological
Organisation (WMO).
▲ Human influence has warmed the climate at a rate that is unprecedented in at least the last 2000 years.The figure shows the changes in global surface temperature relative to 1850–1900. Left panel: Change in global surface temperature (decadalaverage) as reconstructed (1–2000) and observed (1850–2020). Right panel: Change in global surface temperature (annual average) asobserved (black line) and simulated using human & natural (beige line and area) and only natural factors (green line and area) (both 1850–2020). Source: IPCC AR6 (2021), Fig. SPM.1.
10
Climate trend in Germany Suffcient data have been available in ermany since 1881 to determine changes in climate.
This means that the average conditions for temperature and precipitation can be traced back to
the end of the 19th century.
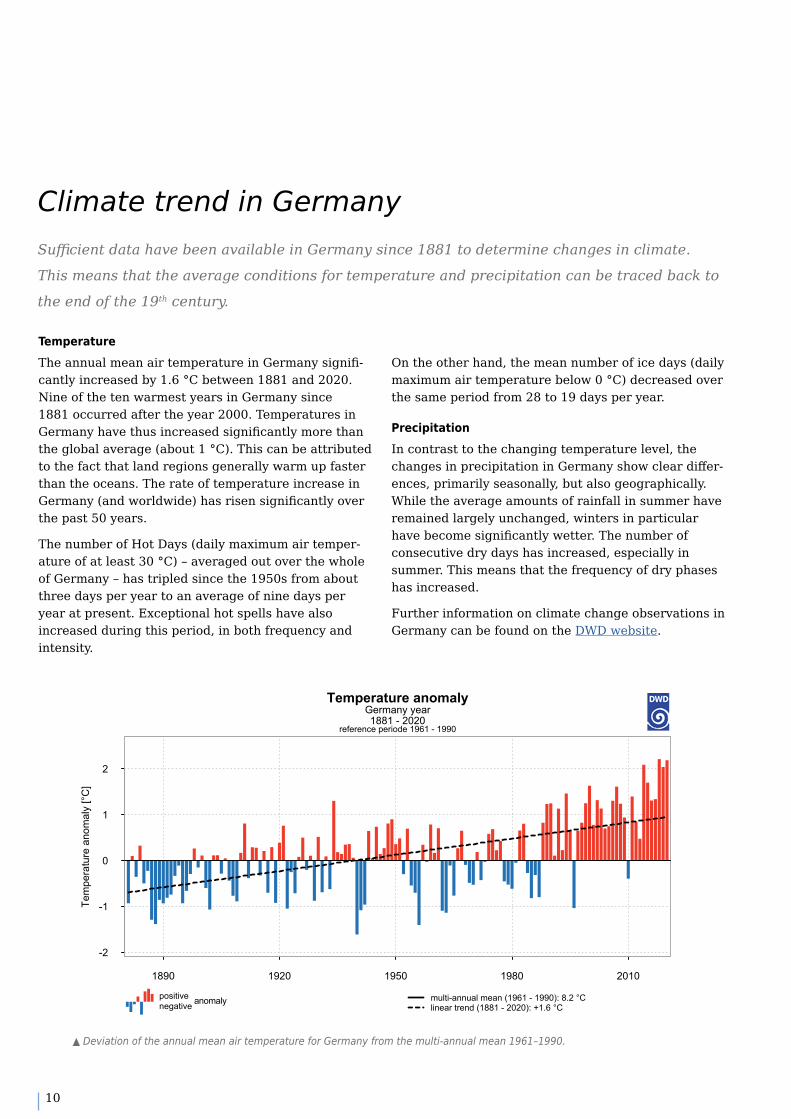
TemperatureThe annual mean air temperature in Germany signifi- cantly increased by 1.6 °C between 1881 and 2020. Nine of the ten warmest years in Germany since 1881 occurred after the year 2000. Temperatures in Germany have thus increased significantly more than the global average (about 1 °C). This can be attributed to the fact that land regions generally warm up faster than the oceans. The rate of temperature increase in Germany (and worldwide) has risen significantly over the past 50 years.
The number of Hot Days (daily maximum air temper-ature of at least 30 °C) – averaged out over the whole of Germany – has tripled since the 1950s from about three days per year to an average of nine days per year at present. Exceptional hot spells have also increased during this period, in both frequency and intensity.
1890 1920 1950 1980 2010
-2
-1
0
1
2
Tem
pera
ture
ano
mal
y [°C
]
Temperature anomalyGermany year1881 - 2020
reference periode 1961 - 1990
positivenegative Anomaly multi-annual mean (1961 - 1990): 8.2 °C
linear trend (1881 - 2020): +1.6 °C
▲ Deviation of the annual mean air temperature for Germany from the multi-annual mean 1961–1990.
On the other hand, the mean number of ice days (daily maximum air temperature below 0 °C) decreased over the same period from 28 to 19 days per year.
PrecipitationIn contrast to the changing temperature level, the changes in precipitation in Germany show clear differ-ences, primarily seasonally, but also geographically. While the average amounts of rainfall in summer have remained largely unchanged, winters in particular have become significantly wetter. The number of consecutive dry days has increased, especially in summer. This means that the frequency of dry phases has increased.
Further information on climate change observations in Germany can be found on the DWD website.
anomaly
11
Attribution research at the DWD Are extreme weather events occurring more frequently as a result of climate change?
This question is being investigated by the relatively young discipline of attribution research.
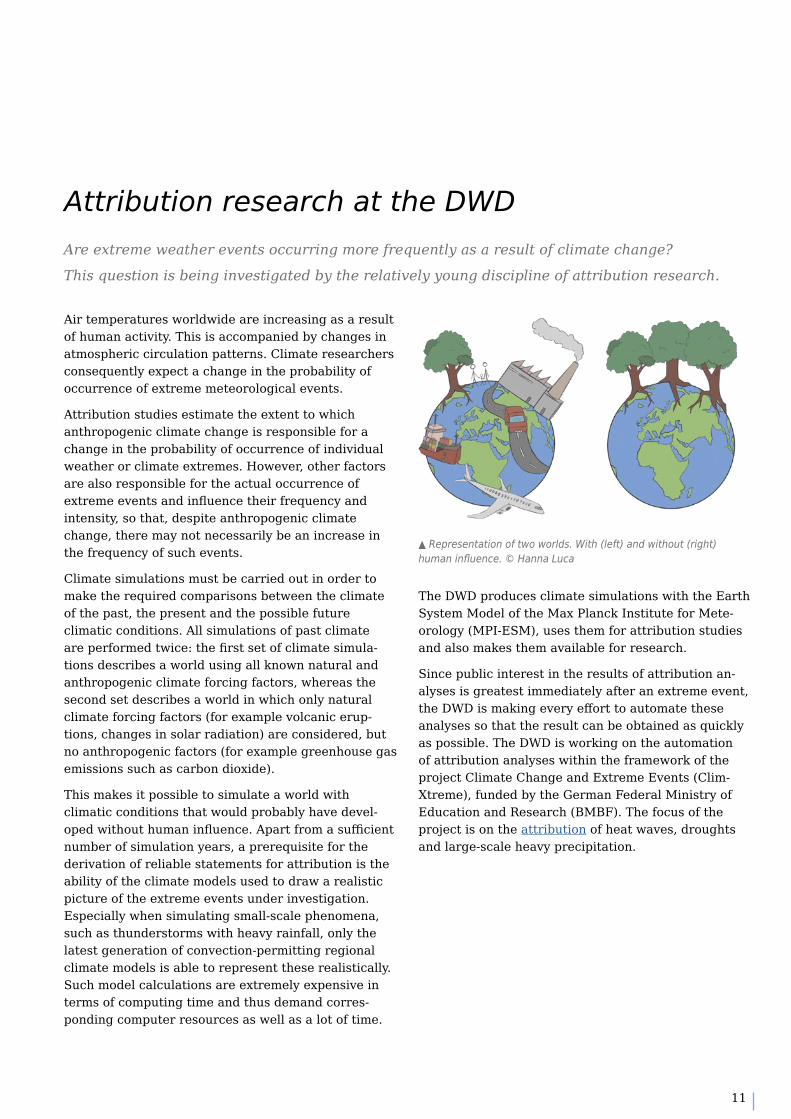
▲ Representation of two worlds. With (left) and without (right)human influence. © Hanna Luca
Air temperatures worldwide are increasing as a result of human activity. This is accompanied by changes in atmospheric circulation patterns. Climate researchers consequently expect a change in the probability of occurrence of extreme meteorological events.
Attribution studies estimate the extent to which anthropogenic climate change is responsible for a change in the probability of occurrence of individual weather or climate extremes. However, other factors are also responsible for the actual occurrence of extreme events and influence their frequency and intensity, so that, despite anthropogenic climate change, there may not necessarily be an increase in the frequency of such events.
Climate simulations must be carried out in order to make the required comparisons between the climate of the past, the present and the possible future climatic conditions. All simulations of past climate are performed twice: the first set of climate simula-tions describes a world using all known natural and anthropogenic climate forcing factors, whereas the second set describes a world in which only natural climate forcing factors (for example volcanic erup-tions, changes in solar radiation) are considered, but no anthropogenic factors (for example greenhouse gas emissions such as carbon dioxide).
This makes it possible to simulate a world with climatic conditions that would probably have devel-oped without human influence. Apart from a suffcientnumber of simulation years, a prerequisite for the derivation of reliable statements for attribution is the ability of the climate models used to draw a realistic picture of the extreme events under investigation. Especially when simulating small-scale phenomena, such as thunderstorms with heavy rainfall, only the latest generation of convection-permitting regional climate models is able to represent these realistically. Such model calculations are extremely expensive in terms of computing time and thus demand corres-ponding computer resources as well as a lot of time.
The DWD produces climate simulations with the Earth System Model of the Max Planck Institute for Mete-orology (MPI-ESM), uses them for attribution studies and also makes them available for research.
Since public interest in the results of attribution an- alyses is greatest immediately after an extreme event, the DWD is making every effort to automate these analyses so that the result can be obtained as quickly as possible. The DWD is working on the automation of attribution analyses within the framework of the project Climate Change and Extreme Events (Clim-Xtreme), funded by the German Federal Ministry of Education and Research (BMBF). The focus of the project is on the attribution of heat waves, droughts and large-scale heavy precipitation.
12
Climate modellingEarly studies of the future climate were often based on using observation data from the past
and projecting these into the future. Now that climate change is taking place, this is no longer
possible. Simulation of the future climate has therefore been founded on climate models since
the 1960s.
Global climate modelsStatements about the world's future climate can be made using global models. In the early stages of climate modelling in the 1960s, highly simplified models were developed to represent the dynamics of the Earth's atmosphere and oceans. The complexity of these climate models has grown steadily along with the rapid progress in high-performance computing and with the increasing understanding of the climate system and its interactions. In addition to atmosphere and oceans, global climate models nowadays also include the hydrosphere, biosphere and cryosphere – for which reason they are referred to as Earth system models.
Climate models are based on the physical equations for the conservation of momentum, energy and mass. At first, these equations are simplified to such a degree that they are valid for discrete grid points. The climate system is spanned by a large number of such grid points in order to take account of all three spatial dimensions. The spacing between the grid points determines the spatial resolution of the climate model. Owing to the large number of grid points, supercom-puters are used to solve the equations for each grid point of the global grid.
Assumptions need to be made about processes which the model resolution cannot resolve (for example certain waves, turbulence or convection). This is often done on the basis of measurements, from which it is possible to derive empirical relationships. This procedure is referred to as parametrisation, which
means approximation to real processes that cannot be described by means of discrete equations alone. In contrast to the natural climate system, climate models are closed systems. They can only describe interde-pendencies and interactions between components if these are implemented in the models.
The resolution of global climate models (with grid spacings of currently above 100 km) is still not suff- cient for describing the various characteristics of climate change in a certain region of the Earth (for example Europe, Germany) in detail.
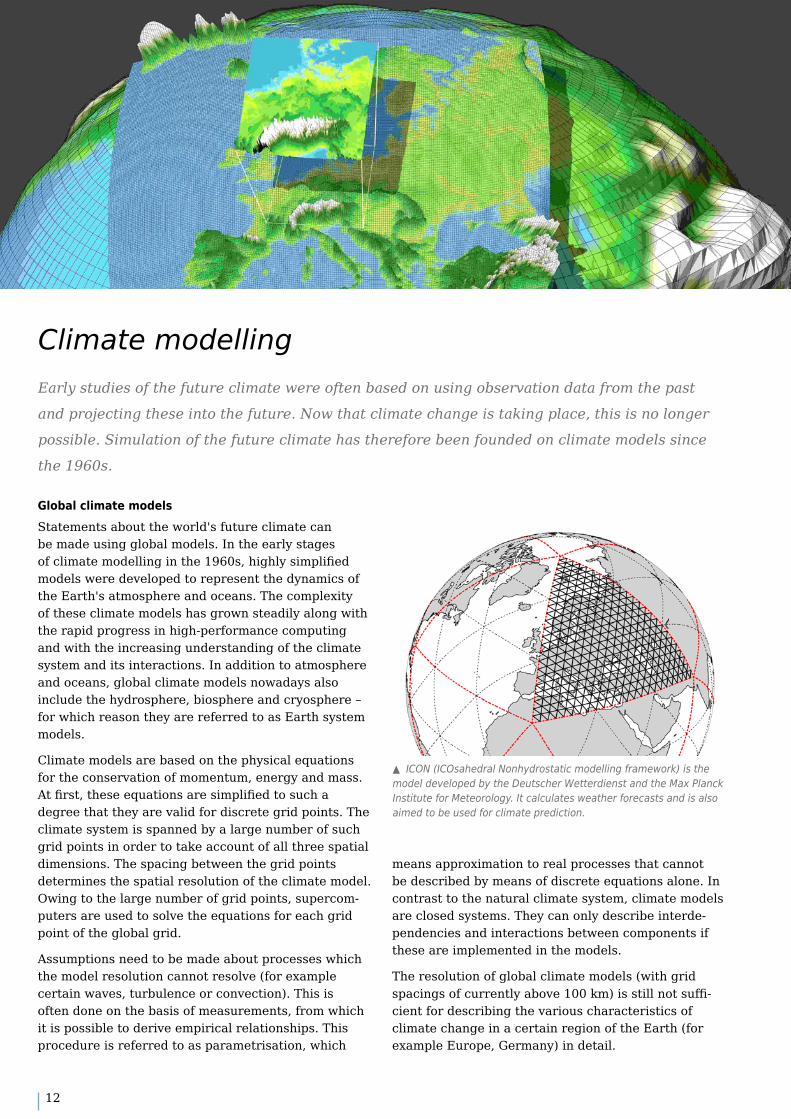
▲ ICON (ICOsahedral Nonhydrostatic modelling framework) is themodel developed by the Deutscher Wetterdienst and the Max PlanckInstitute for Meteorology. It calculates weather forecasts and is alsoaimed to be used for climate prediction.
13
Regional climate modelsThis is where regional climate models come into play, which offer a much finer mesh of grid points over certain regions (for example continents). There exist a number of different regional, dynamic climate models around the world, all driven by the outputs from global climate models. In the regional models, the horizontal grid spacing can be reduced to 1–20 km, allowing more processes to be described directly by the underlying model equations and less processes by parametrisation. Some global models now also use local grid refinement, for example over Europe.
Another approach to refine global information relies on the statistical exploitation of observed data in order to transpose larger-scaled information to local scale. This method is known as empirical statistical downscaling. The statistical relations found are used to refine a multitude of data sets from global climate simulations for local applications in Germany, and this at low computing effort.
Climate simulationsThe models described above are used to simulate the processes happening in the climate system. The closer the prediction is to the start point, the greater the influence by the current state of the climate system. The longer the period of climate simulation, the smaller the influence of the initial state. Key factors of influence then are the Earth’s movement around the sun (seasons), the level of greenhouse gases in the atmospheric composition (centuries) and the planetary constellation (millenniums).
DWD's activities in the field of climate modellingOver the last years, the DWD and the Max Planck Institute for Meteorology have developed the model ICON1 in close co-operation. The model is already in use at the DWD for operational weather forecasting. In future, it will also be used for climate predictions and climate projections. Furthermore, the DWD has been involved for many years in the further development of the regional climate models COSMO-CLM2,3 and ICON-CLM4. These models serve to produce simula-
1 ICON - ICOsahedral Nonhydrostatic modelling framework 2 COSMO - Consortium for Small-scale Modeling 3 COSMO-CLM - COSMO model in CLimate Mode4 ICON-CLM - ICON model in CLimate Mode
tions of the current as well as the future climate and its changes especially for a range of different applica-tions in Germany. The focus currently is on very high spatial resolutions, which means grid spacings of less than 3 km. These will enable better representation of small-scale and extreme events. In the last few years, the DWD has been developing the empirical-statistical regionalisation method EPISODES. This method is used to downscale data sets from climate predictions and climate projections to spatial resolutions of 5 km and 12 km, respectively.
The most recent product of the DWD is a high-resolu-tion climate simulation (grid spacing of 3 km) for the period 1970–2020, generated using a recalculation of global weather (reanalysis). The data from this simula-tion will soon be available for general use on the ESGF portal5 of the DWD.
5 ESGF – Earth System Grid Federation

14
Looking into the future requires scenarios of possible developmentsIn order to be able to assess the expected societal and economic changes over the coming
decades, scenarios are developed. These scenarios describe changes in land use and atmos-
pheric greenhouse gas concentrations. Based on these assumptions, a climate projection
provides information on the future state of the climate system.
For the climate scenarios in the Fifth Assessment Report, the IPCC used Representative Concentration Pathways (RCPs), which represent very different socio-economic developments and, as a result, differ- ent impacts on the Earth's radiation and energy budget. These impacts are primarily attributed to different future changes in greenhouse gas emissions. The focus is on four scenarios: RCP2.6, RCP4.5,
RCP6.0 and RCP8.5. They form the basis for assessing the range of future climate changes. The numbers in the scenario names refer to the increase in radiative forcing levels expected at the end of the 21st century given the respective assumptions or, in other words, to the additional energy flow (for example, in the RCP8.5 scenario, 8.5 additional watts per square metre (W/m²) in 2100 compared with the years 1861–1880).
Climate scenarios in the Fifth Assessment Report
▲ Future emissions cause future additional warming, with total warming dominated by past and future CO₂ emissions. Future annual emissionsof CO₂ (left) and of a subset of key non-CO₂ drivers (right) across five illustrative scenarios. Source: IPCC AR6 (2021), Fig. SPM.4a (extract).
15
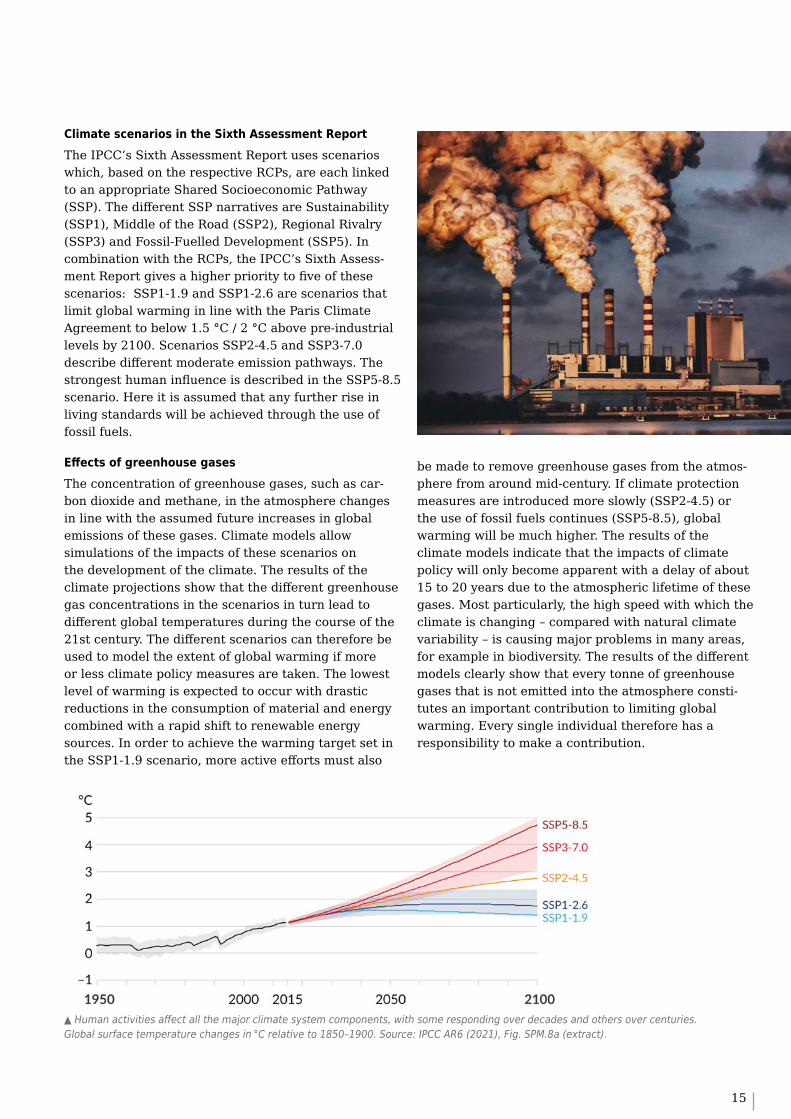
Climate scenarios in the Sixth Assessment ReportThe IPCC’s Sixth Assessment Report uses scenarios which, based on the respective RCPs, are each linked to an appropriate Shared Socioeconomic Pathway (SSP). The different SSP narratives are Sustainability (SSP1), Middle of the Road (SSP2), Regional Rivalry (SSP3) and Fossil-Fuelled Development (SSP5). In combination with the RCPs, the IPCC’s Sixth Assess-ment Report gives a higher priority to five of these scenarios: SSP1-1.9 and SSP1-2.6 are scenarios that limit global warming in line with the Paris Climate Agreement to below 1.5 °C / 2 °C above pre-industrial levels by 2100. Scenarios SSP2-4.5 and SSP3-7.0 describe different moderate emission pathways. The strongest human influence is described in the SSP5-8.5 scenario. Here it is assumed that any further rise in living standards will be achieved through the use of fossil fuels.
Effects of greenhouse gasesThe concentration of greenhouse gases, such as car- bon dioxide and methane, in the atmosphere changes in line with the assumed future increases in global emissions of these gases. Climate models allow simulations of the impacts of these scenarios on the development of the climate. The results of the climate projections show that the different greenhouse gas concentrations in the scenarios in turn lead to different global temperatures during the course of the 21st century. The different scenarios can therefore be used to model the extent of global warming if more or less climate policy measures are taken. The lowest level of warming is expected to occur with drastic reductions in the consumption of material and energy combined with a rapid shift to renewable energy sources. In order to achieve the warming target set in the SSP1-1.9 scenario, more active efforts must also
be made to remove greenhouse gases from the atmos-phere from around mid-century. If climate protection measures are introduced more slowly (SSP2-4.5) or the use of fossil fuels continues (SSP5-8.5), global warming will be much higher. The results of the climate models indicate that the impacts of climate policy will only become apparent with a delay of about 15 to 20 years due to the atmospheric lifetime of these gases. Most particularly, the high speed with which the climate is changing – compared with natural climate variability – is causing major problems in many areas, for example in biodiversity. The results of the different models clearly show that every tonne of greenhouse gases that is not emitted into the atmosphere consti-tutes an important contribution to limiting global warming. Every single individual therefore has a responsibility to make a contribution.
▲ Human activities affect all the major climate system components, with some responding over decades and others over centuries. Global surface temperature changes in °C relative to 1850–1900. Source: IPCC AR6 (2021), Fig. SPM.8a (extract).
16
Climate projections for several decades to centuries
Global climate projections are co-ordinated and generated worldwide as part of the Coupled Model Intercomparison Project (CMIP), set up by the World Climate Research Programme (WCRP) of the World Meteorological Organisation (WMO).
Besides global projection activities, regional climate projections are co-ordinated and generated worldwide by the Coordinated Regional Climate Downscaling Experiment (CORDEX) initiative of WCRP. For Europe, there are a multitude of simulations available, with
grid spacings of approximately 50 km and 12.5 km. The results of the projections are often presented as deviations from a reference period. These deviations are also referred to as climate change signals.
The DWD's activities are mainly dedicated to regional climate projections for Europe and Germany. To this aim, globally available data from the latest climate projections are collected, analysed and made available to the users.
For longer term simulations of the climate for several decades to centuries, the boundary
conditions of the climate system are of particular importance. In addition to natural factors (for
example the varying solar constant and aerosol from volcanic eruptions), these also include
anthropogenic impacts on the climate system, such as greenhouse gas emissions and land-use
changes as described in climate scenarios.
International collaboration in the field of climate projection
17
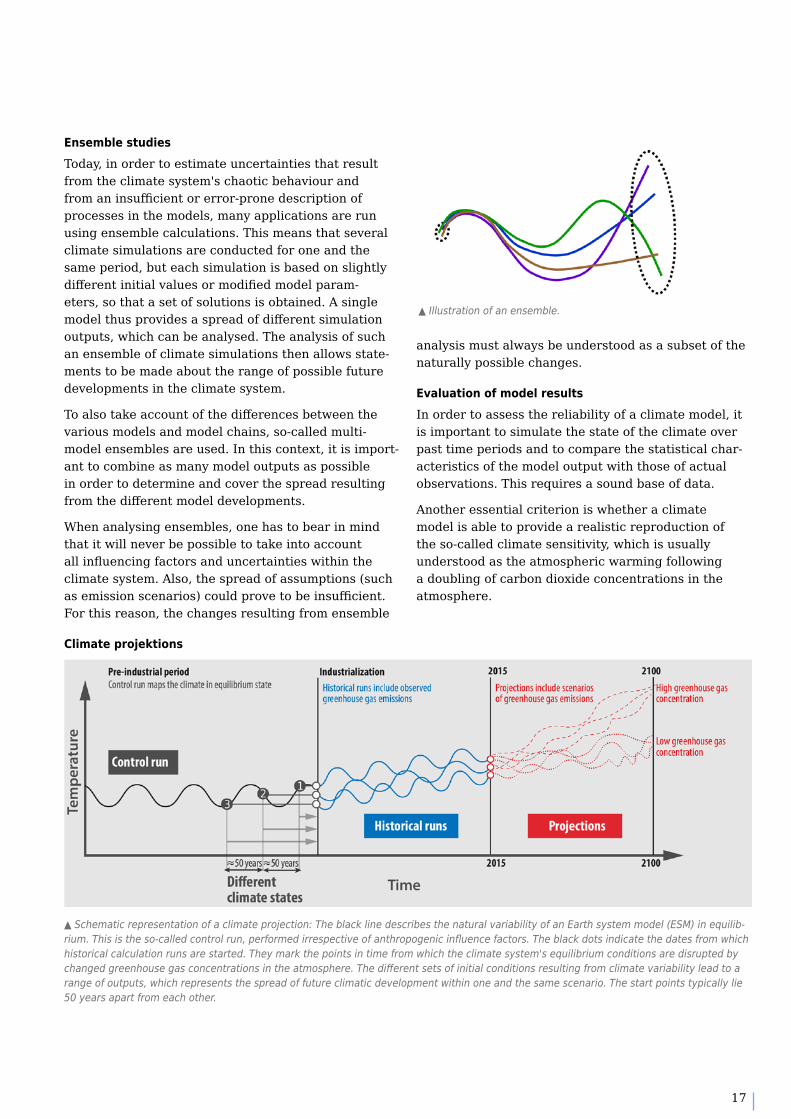
Ensemble studiesToday, in order to estimate uncertainties that result from the climate system's chaotic behaviour and from an insuffcient or error-prone description of processes in the models, many applications are run using ensemble calculations. This means that several climate simulations are conducted for one and the same period, but each simulation is based on slightly different initial values or modified model param- eters, so that a set of solutions is obtained. A single model thus provides a spread of different simulation outputs, which can be analysed. The analysis of such an ensemble of climate simulations then allows state-ments to be made about the range of possible future developments in the climate system.
To also take account of the differences between the various models and model chains, so-called multi-model ensembles are used. In this context, it is import- ant to combine as many model outputs as possible in order to determine and cover the spread resulting from the different model developments.
When analysing ensembles, one has to bear in mind that it will never be possible to take into account all influencing factors and uncertainties within the climate system. Also, the spread of assumptions (such as emission scenarios) could prove to be insuffcient. For this reason, the changes resulting from ensemble
analysis must always be understood as a subset of the naturally possible changes.
Evaluation of model resultsIn order to assess the reliability of a climate model, it is important to simulate the state of the climate over past time periods and to compare the statistical char-acteristics of the model output with those of actual observations. This requires a sound base of data.
Another essential criterion is whether a climate model is able to provide a realistic reproduction of the so-called climate sensitivity, which is usually understood as the atmospheric warming following a doubling of carbon dioxide concentrations in the atmosphere.
▲ Schematic representation of a climate projection: The black line describes the natural variability of an Earth system model (ESM) in equilib-rium. This is the so-called control run, performed irrespective of anthropogenic influence factors. The black dots indicate the dates from which historical calculation runs are started. They mark the points in time from which the climate system's equilibrium conditions are disrupted by changed greenhouse gas concentrations in the atmosphere. The different sets of initial conditions resulting from climate variability lead to a range of outputs, which represents the spread of future climatic development within one and the same scenario. The start points typically lie 50 years apart from each other.
▲ Illustration of an ensemble.
Climate projektions
18
Climate projections for GermanyClimate models are able to project the future climate with the help of different scenarios. iven
suffciently large ensembles of climate projections, which are made globally available in co-oper-
ation with many other institutions, statistical statements can be made about possible future states
of the climate. The analyses of such climate ensembles form the basis for the DWD's erman
Climate Atlas. The DWD also contributes to the further development of regionalisation methods
aimed at better describing the impacts of a changing global climate on the climate conditions,
for example, in ermany.
International activities to provide climate projections are supported at national level by various research projects.
The global climate projections taken into account in the IPCC Assessment Reports are systematically evalu-ated by the DWD with special reference to Germany and complemented by further regional climate projec-tions. In addition, climate projections with a very high spatial resolution (about 3 km grid spacing) are calculated.
The DWD checks the quality of regional climate pro- jections for Europe and, if successful, they are inte-grated into the DWD reference ensemble. This is a collection of all simulations that meet defined criteria in order to guarantee the most consistent data basis
possible for calculating climate indicators or for use as input data for impact models. The reference ensemble can be displayed interactively in the German Climate Atlas, allowing different climate scenarios and climate elements to be selected. For more complex impact models, however, it is impossible to use all climate projections of the reference ensemble as forcing. For these cases, the DWD provides the DWD core ensemble. For each scenario, five to six simulations are selected from the reference ensemble that best repre-sent the spread of change signals in the reference ensemble for temperature and precipitation up to the end of 2100.
Through the German contribution to the global climate projections, the DWD also collaborated on the data basis for the IPCC’s Sixth Assessment Report.
DWD's activities in the field of climate projection
19
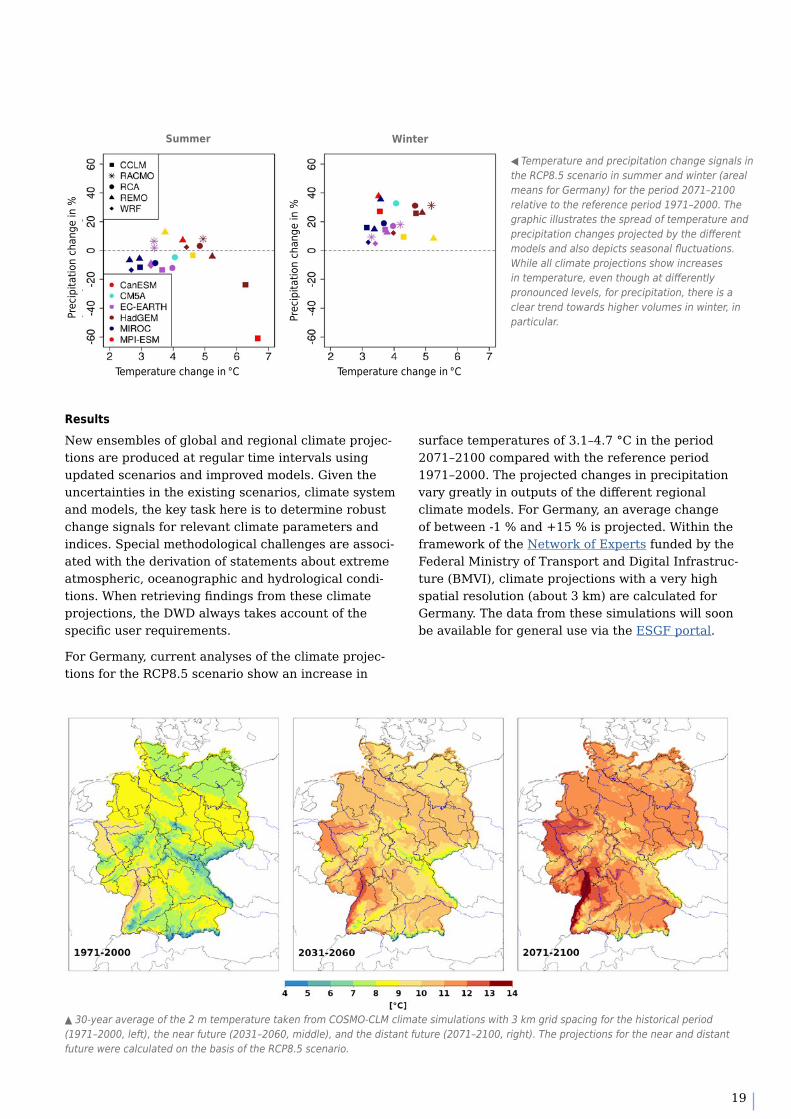
◀ Temperature and precipitation change signals inthe RCP8.5 scenario in summer and winter (arealmeans for Germany) for the period 2071–2100relative to the reference period 1971–2000. Thegraphic illustrates the spread of temperature andprecipitation changes projected by the differentmodels and also depicts seasonal fluctuations.While all climate projections show increasesin temperature, even though at differentlypronounced levels, for precipitation, there is aclear trend towards higher volumes in winter, inparticular.
New ensembles of global and regional climate projec-tions are produced at regular time intervals using updated scenarios and improved models. Given the uncertainties in the existing scenarios, climate system and models, the key task here is to determine robust change signals for relevant climate parameters and indices. Special methodological challenges are associ-ated with the derivation of statements about extreme atmospheric, oceanographic and hydrological condi-tions. When retrieving findings from these climate projections, the DWD always takes account of the specific user requirements.
For Germany, current analyses of the climate projec-tions for the RCP8.5 scenario show an increase in
Results
▲ 30-year average of the 2 m temperature taken from COSMO-CLM climate simulations with 3 km grid spacing for the historical period(1971–2000, left), the near future (2031–2060, middle), and the distant future (2071–2100, right). The projections for the near and distantfuture were calculated on the basis of the RCP8.5 scenario.
surface temperatures of 3.1–4.7 °C in the period 2071–2100 compared with the reference period 1971–2000. The projected changes in precipitation vary greatly in outputs of the different regional climate models. For Germany, an average change of between -1 % and +15 % is projected. Within the framework of the Network of Experts funded by the Federal Ministry of Transport and Digital Infrastruc-ture (BMVI), climate projections with a very high spatial resolution (about 3 km) are calculated for Germany. The data from these simulations will soon be available for general use via the ESGF portal.
Winter
Temperature change in °CTemperature change in °C
Prec
ipita
tion
chan
ge in
%
Prec
ipita
tion
chan
ge in
%
Summer
20
Impact of climate change on citiesThe climate in cities and urban agglomerations differs from that of the rural surroundings
due to the built-up fabric. Even within a city, there is a high spatial variability of many climate
parameters. Knowledge of the urban climate and its changes is therefore essential in order to
adapt successfully to the impacts of climate change in urban areas.
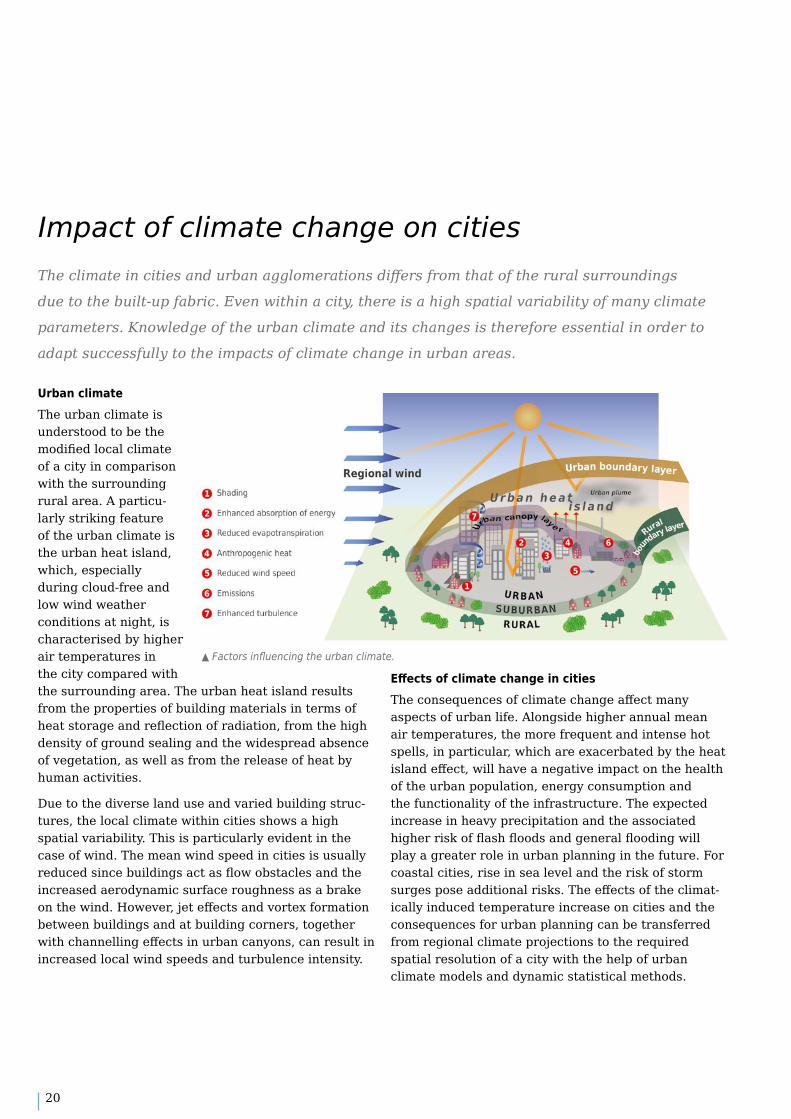
The urban climate is understood to be the modified local climate of a city in comparison with the surrounding rural area. A particu-larly striking feature of the urban climate is the urban heat island, which, especially during cloud-free and low wind weather conditions at night, is characterised by higher air temperatures in the city compared with the surrounding area. The urban heat island results from the properties of building materials in terms of heat storage and reflection of radiation, from the high density of ground sealing and the widespread absence of vegetation, as well as from the release of heat by human activities.
Due to the diverse land use and varied building struc-tures, the local climate within cities shows a high spatial variability. This is particularly evident in the case of wind. The mean wind speed in cities is usually reduced since buildings act as flow obstacles and the increased aerodynamic surface roughness as a brake on the wind. However, jet effects and vortex formation between buildings and at building corners, together with channelling effects in urban canyons, can result in increased local wind speeds and turbulence intensity.
Effects of climate change in citiesThe consequences of climate change affect many aspects of urban life. Alongside higher annual mean air temperatures, the more frequent and intense hot spells, in particular, which are exacerbated by the heat island effect, will have a negative impact on the health of the urban population, energy consumption and the functionality of the infrastructure. The expected increase in heavy precipitation and the associated higher risk of flash floods and general flooding will play a greater role in urban planning in the future. For coastal cities, rise in sea level and the risk of storm surges pose additional risks. The effects of the climat-ically induced temperature increase on cities and the consequences for urban planning can be transferred from regional climate projections to the required spatial resolution of a city with the help of urban climate models and dynamic statistical methods.
▲ Factors influencing the urban climate.
Urban climate
21
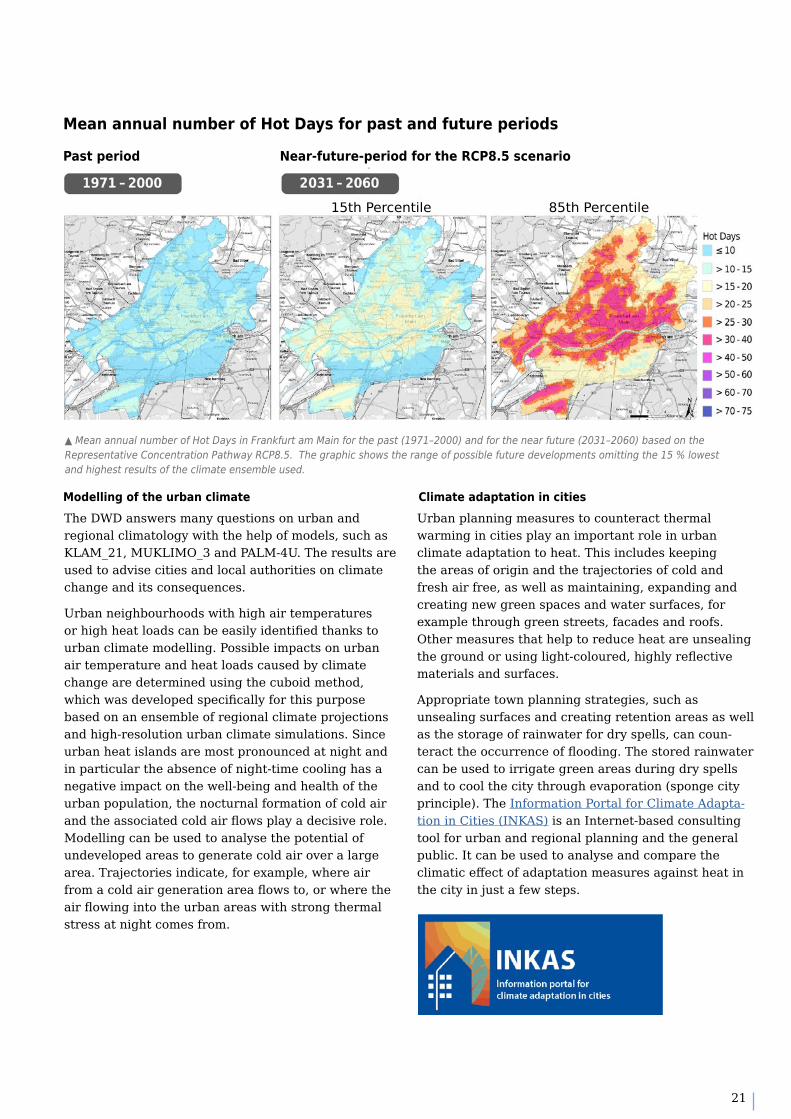
▲ Mean annual number of Hot Days in Frankfurt am Main for the past (1971–2000) and for the near future (2031–2060) based on theRepresentative Concentration Pathway RCP8.5. The graphic shows the range of possible future developments omitting the 15 % lowestand highest results of the climate ensemble used.
The DWD answers many questions on urban and regional climatology with the help of models, such as KLAM_21, MUKLIMO_3 and PALM-4U. The results are used to advise cities and local authorities on climate change and its consequences.
Urban neighbourhoods with high air temperatures or high heat loads can be easily identified thanks to urban climate modelling. Possible impacts on urban air temperature and heat loads caused by climate change are determined using the cuboid method, which was developed specifically for this purpose based on an ensemble of regional climate projections and high-resolution urban climate simulations. Since urban heat islands are most pronounced at night and in particular the absence of night-time cooling has a negative impact on the well-being and health of the urban population, the nocturnal formation of cold air and the associated cold air flows play a decisive role. Modelling can be used to analyse the potential of undeveloped areas to generate cold air over a large area. Trajectories indicate, for example, where air from a cold air generation area flows to, or where the air flowing into the urban areas with strong thermal stress at night comes from.
Urban planning measures to counteract thermal warming in cities play an important role in urban climate adaptation to heat. This includes keeping the areas of origin and the trajectories of cold and fresh air free, as well as maintaining, expanding and creating new green spaces and water surfaces, for example through green streets, facades and roofs. Other measures that help to reduce heat are unsealing the ground or using light-coloured, highly reflective materials and surfaces.
Appropriate town planning strategies, such as unsealing surfaces and creating retention areas as well as the storage of rainwater for dry spells, can coun-teract the occurrence of flooding. The stored rainwater can be used to irrigate green areas during dry spells and to cool the city through evaporation (sponge city principle). The Information Portal for Climate Adapta-tion in Cities (INKAS) is an Internet-based consulting tool for urban and regional planning and the general public. It can be used to analyse and compare the climatic effect of adaptation measures against heat in the city in just a few steps.
Modelling of the urban climate Climate adaptation in cities
15th Percentile 85th Percentile
Mean annual number of Hot Days for past and future periods
Past period Near-future-period for the RCP8�5 scenario
22
Climate predictions for the next weeks to yearsClimate predictions describe the future evolution of the climate system for time horizons from
several weeks, months and years on the basis of the past and current state of the atmosphere.
They bridge the gap between weather forecasts for the coming days and climate projections
up to the end of the 21st century. As is the case with climate projections, climate predictions,
especially decadal climate predictions, are driven by greenhouse gas concentrations, the future
characteristics of which are estimated using different scenarios of societal development. Just
like weather forecasts, climate predictions moreover rely essentially on a good knowledge of the
current state of the climate system as the initial condition.
Weather forecasts are able to provide a fairly detailed description of the meteorological events over the next few days. Forecasts become increasingly uncertain the further they look. This is mainly due to the chaotic behaviour of the atmosphere.
As the projected future state of the atmosphere depends strongly on what the initial conditions are, these are taken into account in the forecasting models. In certain weather situations, even the slightest change in the initial values could lead to predicting completely different weather developments.
Despite this, climate predictions allow climate trend estimates to be made for the coming weeks, months, seasons or years by including not only the atmosphere,
but also the interactive processes between it and the other components of the climate system. Especially components with a so-called long-term memory, such as the oceans and sea ice, contribute to the predict-ability of the future climate.
The term long-term memory refers to the slowness with which the system responds to changes. For instance, the influence of the sun, wind and rain on the oceans persists much longer and is returned to the atmosphere at a different place and time. Taking account of all these components is what transforms a pure atmosphere model into a comprehensive Earth system model.
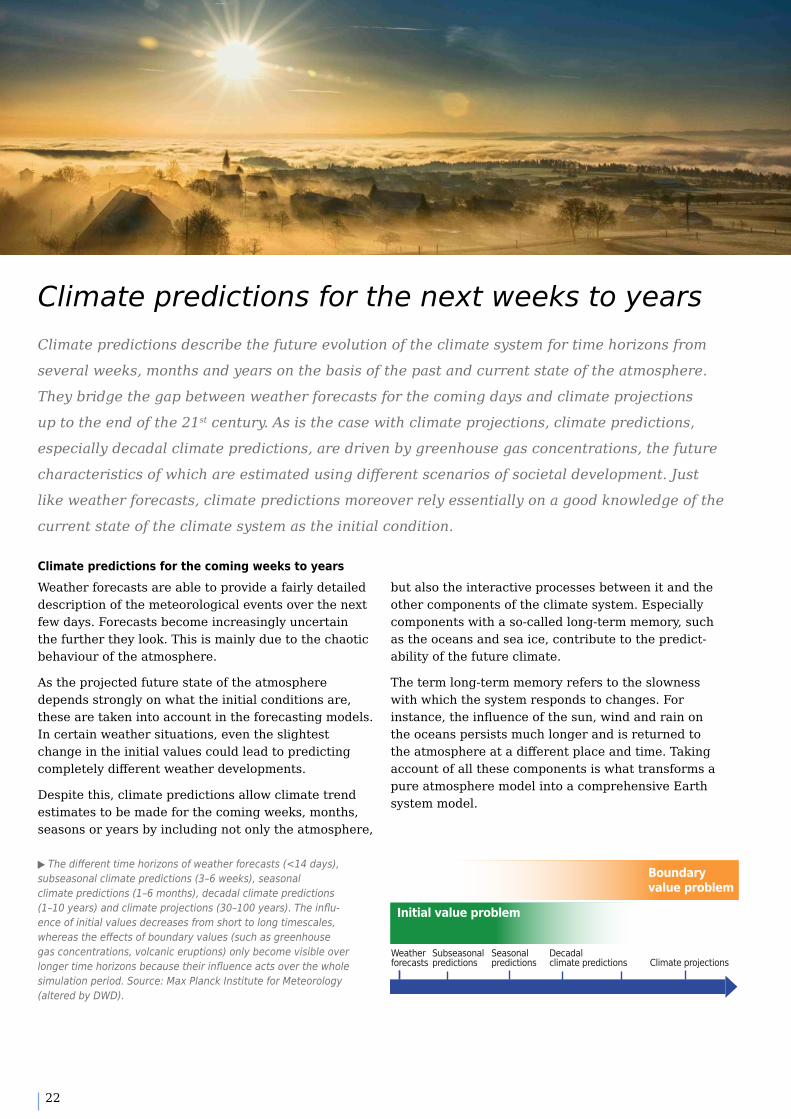
Days Weeks Months Years Decades Centuries
Climate projections
Initial value problem
Boundaryvalue problem
Weatherforecasts
Subseasonalpredictions
Seasonalpredictions
Decadalclimate predictions
▶ The different time horizons of weather forecasts (<14 days),subseasonal climate predictions (3–6 weeks), seasonalclimate predictions (1–6 months), decadal climate predictions(1–10 years) and climate projections (30–100 years). The influ-ence of initial values decreases from short to long timescales,whereas the effects of boundary values (such as greenhousegas concentrations, volcanic eruptions) only become visible overlonger time horizons because their influence acts over the wholesimulation period. Source: Max Planck Institute for Meteorology(altered by DWD).
Climate predictions for the coming weeks to years
23
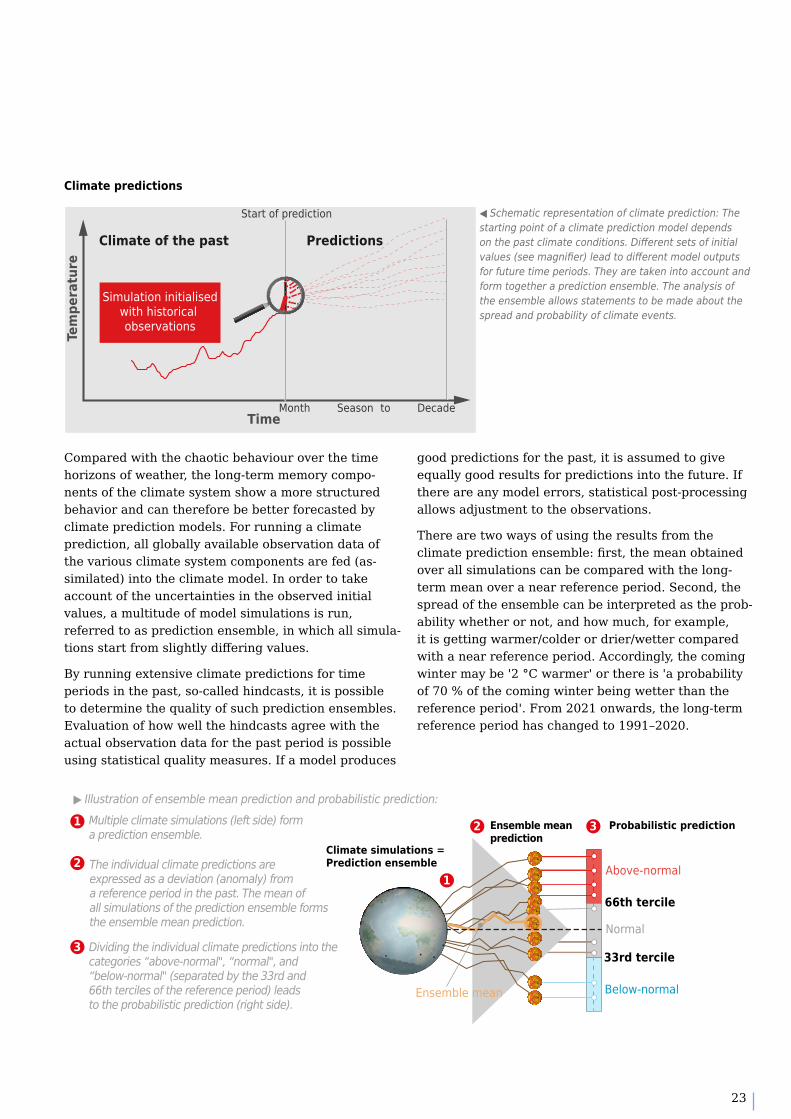
◀ Schematic representation of climate prediction: Thestarting point of a climate prediction model dependson the past climate conditions. Different sets of initialvalues (see magnifier) lead to different model outputsfor future time periods. They are taken into account andform together a prediction ensemble. The analysis ofthe ensemble allows statements to be made about thespread and probability of climate events.
Compared with the chaotic behaviour over the time horizons of weather, the long-term memory compo-nents of the climate system show a more structured behavior and can therefore be better forecasted by climate prediction models. For running a climate prediction, all globally available observation data of the various climate system components are fed (as- similated) into the climate model. In order to take account of the uncertainties in the observed initial values, a multitude of model simulations is run, referred to as prediction ensemble, in which all simula-tions start from slightly differing values.
By running extensive climate predictions for time periods in the past, so-called hindcasts, it is possible to determine the quality of such prediction ensembles. Evaluation of how well the hindcasts agree with the actual observation data for the past period is possible using statistical quality measures. If a model produces
good predictions for the past, it is assumed to give equally good results for predictions into the future. If there are any model errors, statistical post-processing allows adjustment to the observations.
There are two ways of using the results from the climate prediction ensemble: first, the mean obtained over all simulations can be compared with the long-term mean over a near reference period. Second, the spread of the ensemble can be interpreted as the prob-ability whether or not, and how much, for example, it is getting warmer/colder or drier/wetter compared with a near reference period. Accordingly, the coming winter may be '2 °C warmer' or there is 'a probability of 70 % of the coming winter being wetter than the reference period'. From 2021 onwards, the long-term reference period has changed to 1991–2020.
Climate predictions Start of prediction
Simulation initialisedwith historical observations
Time
Climate of the past Predictions
Month Season to Decade
Tem
pera
ture
Climate simulations =Prediction ensemble
1
▶ Illustration of ensemble mean prediction and probabilistic prediction:
1 Multiple climate simulations (left side) forma prediction ensemble.
2 The individual climate predictions areexpressed as a deviation (anomaly) froma reference period in the past. The mean ofall simulations of the prediction ensemble formsthe ensemble mean prediction.
3 Dividing the individual climate predictions into thecategories “above-normal", “normal", and“below-normal" (separated by the 33rd and66th terciles of the reference period) leadsto the probabilistic prediction (right side).
Ensemble mean
Ensemble meanprediction
Above-normal
66th tercile
Normal
33rd tercile
Below-normal
Probabilistic prediction2 3
Climate predictions
24
Always up to date – the decadal climate predictions for the next ten yearsDecadal climate predictions describe the climate development for the next few years up to a
decade. They cover a time frame which is of crucial importance for political, economic and
societal decision-making and for the planning of climate adaptation measures. The DWD
has integrated the decadal ensemble climate prediction system of the MiKlip (Mittelfristige
Klimaprognosen) project on medium-term climate predictions into its operational service and
now produces decadal climate predictions annually. The results are published on the DWD
climate prediction website.
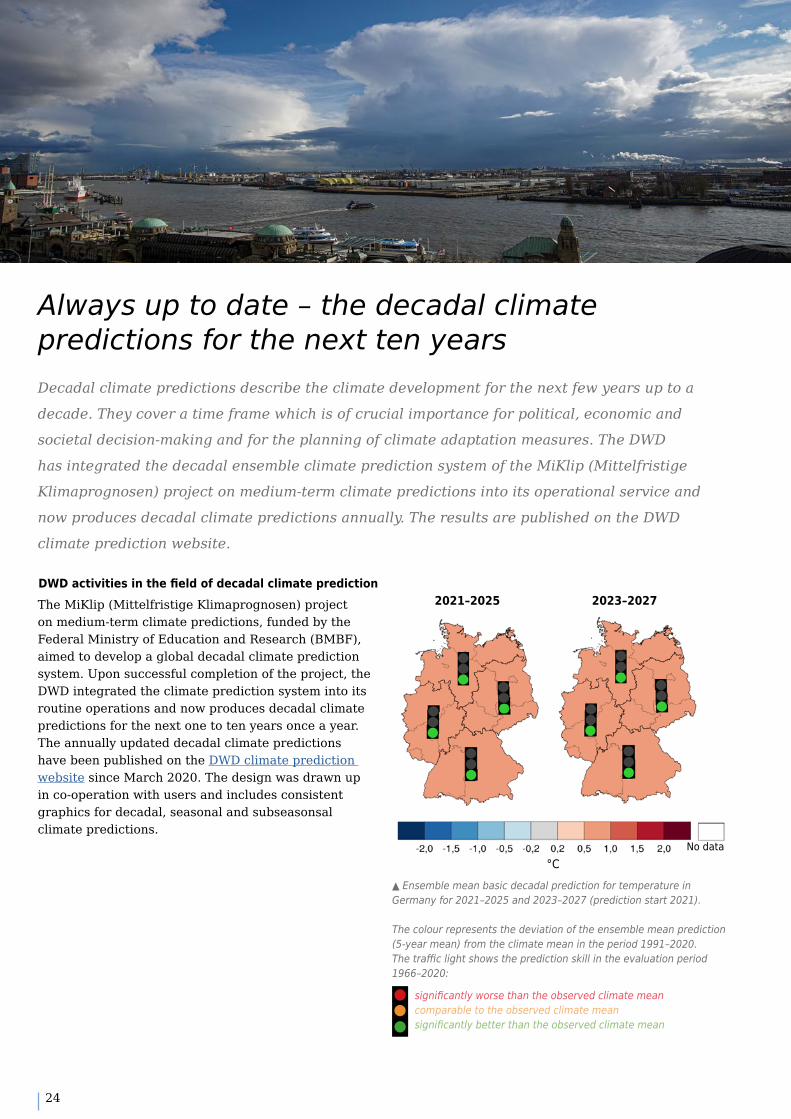
DWD activities in the field of decadal climate predictionThe MiKlip (Mittelfristige Klimaprognosen) project on medium-term climate predictions, funded by the Federal Ministry of Education and Research (BMBF), aimed to develop a global decadal climate prediction system. Upon successful completion of the project, the DWD integrated the climate prediction system into its routine operations and now produces decadal climate predictions for the next one to ten years once a year. The annually updated decadal climate predictions have been published on the DWD climate prediction website since March 2020. The design was drawn up in co-operation with users and includes consistent graphics for decadal, seasonal and subseasonsal climate predictions.
▲ Ensemble mean basic decadal prediction for temperature inGermany for 2021–2025 and 2023–2027 (prediction start 2021).
The colour represents the deviation of the ensemble mean prediction (5-year mean) from the climate mean in the period 1991–2020. The traffic light shows the prediction skill in the evaluation period 1966–2020:
significantly worse than the observed climate meancomparable to the observed climate meansignificantly better than the observed climate mean
°C
2021–2025 2023–2027
No data

25
Intensive dialogue with users guarantees the develop-ment of tailored decadal climate prediction products in collaboration with the target groups, for example from the fields of water management, forestry or disaster risk management.
ResultsThe basic climate predictions on the DWD climate prediction website show maps, time series and tables of ensemble mean and probabilistic predictions for temperature and precipitation. 1- and 5-year means in four German regions and the corresponding prediction skills are represented using a traffc light system. ForGermany in 2021–2025 and 2023–2027, for example,
predictions show temperatures 0.5–1.0 °C higher than in the reference period 1991–2020. For precipitation, the DWD climate prediction system forecasts a prob-ability of over 80 % for dry periods in the next ten years in southern Germany.
The expert climate predictions offer more detailed, grid point-based information for Germany, Europe and the world. The prediction skill is represented by three dot sizes. Regional refinement of global climate predictions for Germany, which is crucial for decision makers, is achieved by statistical downscaling to about 20 km.
▲ Probabilistic basic decadal prediction (prediction start 2021) for precipitationin southern Germany as a time series for various time periods.
The bars represent the probabilities of the three categories (dry/normal/wet) of the climate prediction (mean annual sum over 5 years) compared with the climate characteristics in the period 1991–2020. The category Normal is defined as 893 mm–940 mm.
The traffic light shows the prediction skill in the evaluation period 1966–2020:
significantly worse than the observed climate meancomparable to the observed climate meansignificantly better than the observed climate mean
Germany: South
Mean Yearly Sum
Prob
abili
ty D
ry/N
orm
al/W
et (%
)
26
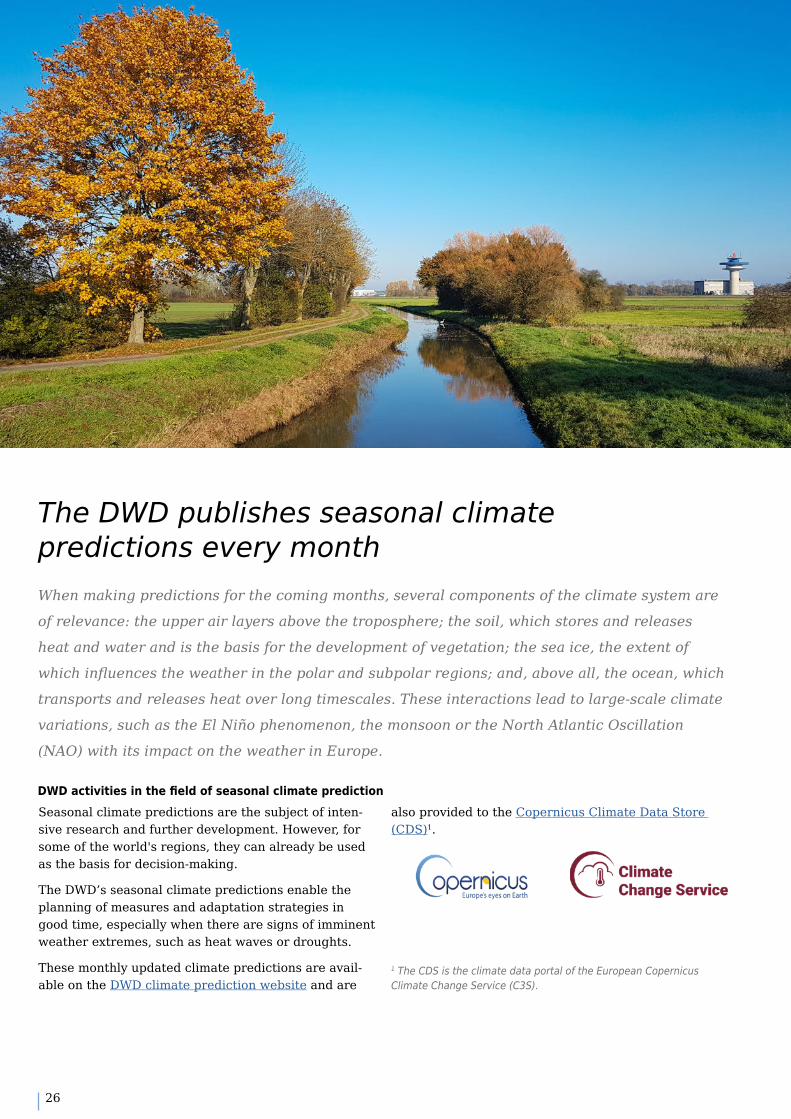
The DWD publishes seasonal climate predictions every monthWhen making predictions for the coming months, several components of the climate system are
of relevance: the upper air layers above the troposphere; the soil, which stores and releases
heat and water and is the basis for the development of vegetation; the sea ice, the extent of
which influences the weather in the polar and subpolar regions; and, above all, the ocean, which
transports and releases heat over long timescales. These interactions lead to large-scale climate
variations, such as the El Niño phenomenon, the monsoon or the North Atlantic Oscillation
(NAO) with its impact on the weather in Europe.
Seasonal climate predictions are the subject of inten-sive research and further development. However, for some of the world's regions, they can already be used as the basis for decision-making.
The DWD’s seasonal climate predictions enable the planning of measures and adaptation strategies in good time, especially when there are signs of imminent weather extremes, such as heat waves or droughts.
These monthly updated climate predictions are avail-able on the DWD climate prediction website and are
also provided to the Copernicus Climate Data Store (CDS)1.
1 The CDS is the climate data portal of the European Copernicus Climate Change Service (C3S).
DWD activities in the field of seasonal climate prediction
27
Seasonal climate predictions still contain many uncertainties for some regions, such as Europe or Germany. Nevertheless, the quality of the predictions is quite useful in some months in certain parts of Europe and Germany.
The prediction skill can be improved, for example, by analysing selected ensemble members, which repro-duce the large-scale air circulation over Europe and the North Atlantic quite accurately. This can lead to a significant improvement in predictions for winter. Furthermore, statistical downscaling allows a regional refinement of the coarse global seasonal climate prediction for Germany to about 20 km.
A particularly robust example for practical applica-tion is the seasonal climate prediction of an El Niño event in the tropical Pacific. This phenomenon occurs when the mean sea surface temperature anomaly in a specific region of the Pacific is above 0.5 °C for at least three consecutive months. An El Niño event changes the trade winds and the temperature of the surface water in the tropical Pacific and consequently impacts on the precipitation patterns in many adjacent areas but also in more distant regions.
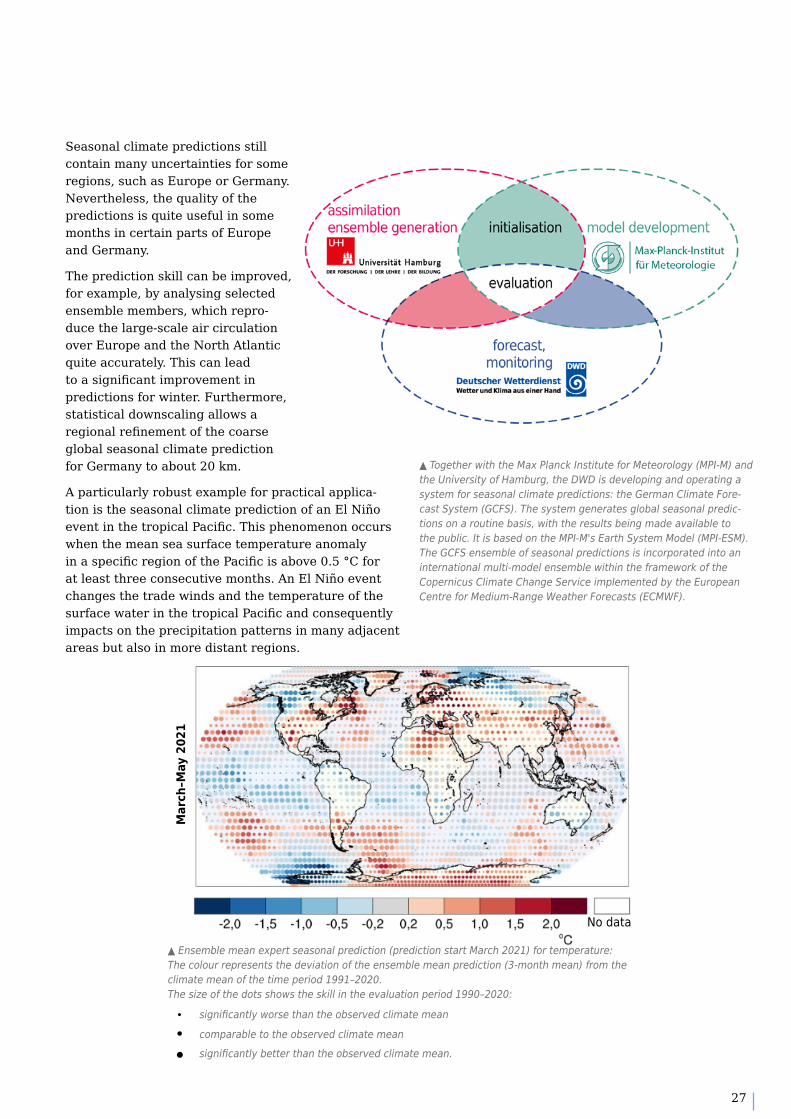
▲ Together with the Max Planck Institute for Meteorology (MPI-M) andthe University of Hamburg, the DWD is developing and operating asystem for seasonal climate predictions: the German Climate Fore-cast System (GCFS). The system generates global seasonal predic-tions on a routine basis, with the results being made available tothe public. It is based on the MPI-M's Earth System Model (MPI-ESM).The GCFS ensemble of seasonal predictions is incorporated into aninternational multi-model ensemble within the framework of theCopernicus Climate Change Service implemented by the EuropeanCentre for Medium-Range Weather Forecasts (ECMWF).
▲ Ensemble mean expert seasonal prediction (prediction start March 2021) for temperature:The colour represents the deviation of the ensemble mean prediction (3-month mean) from theclimate mean of the time period 1991–2020.The size of the dots shows the skill in the evaluation period 1990–2020:
significantly worse than the observed climate mean
comparable to the observed climate mean
significantly better than the observed climate mean.
No data
Mar
ch–M
ay 2
021
28
Outlook on the climate conditions for the next few weeksSubseasonal climate predictions describe the large-scale atmospheric development for the next
few weeks. They close the gap between weather forecasting and seasonal climate prediction and
thus enable seamless climate predictions on timescales ranging from weeks to years or longer.
DWD’s activities in the field of subseasonal climate predictionSubseasonal climate predictions deliver statements about weekly mean temperatures and weekly amounts of precipitation for the next few weeks to support timely planning and development of weather-depend- ent activities and measures. Subseasonal climate predictions begin when it is no longer possible to make reliable weather forecasts (about 14 days in the future) and provide statements for the third to sixth prediction week ahead as compared with the refer-ence climate. From 2022, these subseasonal climate predictions will be published weekly on the DWD climate prediction website. They are based on the monthly forecasting system of the European Centre for Medium-Range Weather Forecasts (ECMWF). The
ECMWF is supported by 34 countries with a view to pooling together the resources needed for the complex simulations.
The DWD is investigating potential future areas of application for subseasonal climate predictions. Work is going on to find out, for example, whether medium- term statements on soil moisture and associated drought conditions can be made by linking subsea-sonal predictions to a soil moisture budget model. In co-operation with other authorities, the DWD is working on predictions for flood risk management and for supporting sediment management in estuary areas.
29
The presentation of the subseasonal climate predic-tions on the DWD climate prediction website will be consistent with the graphics for decadal and seasonal climate predictions. From 2022, maps, time series and value tables for ensemble mean predictions and prob-abilistic predictions for temperature and precipitation in Germany, Europe and the world will be displayed. Subseasonal climate predictions will be provided
together with the corresponding prediction skill. Their production relies on weekly predictions from 51 prediction model runs over six weeks and from eleven hindcast runs. For data provision and presen- tation on the website, the grid resolution for Germany will be refined employing the empirical statistical downscaling method EPISODES.
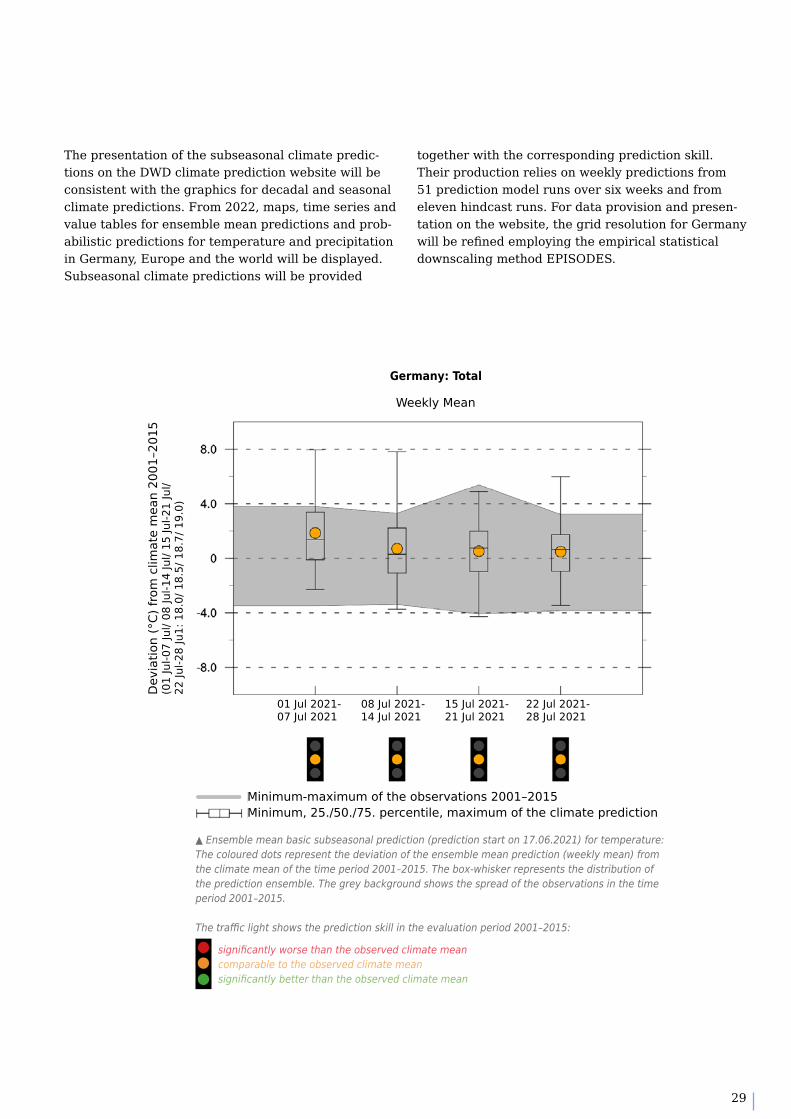
▲ Ensemble mean basic subseasonal prediction (prediction start on 17.06.2021) for temperature:The coloured dots represent the deviation of the ensemble mean prediction (weekly mean) fromthe climate mean of the time period 2001–2015. The box-whisker represents the distribution ofthe prediction ensemble. The grey background shows the spread of the observations in the timeperiod 2001–2015.
The traffic light shows the prediction skill in the evaluation period 2001–2015:
significantly worse than the observed climate meancomparable to the observed climate meansignificantly better than the observed climate mean
Germany: Total
Dev
iatio
n (°
C) fr
om c
limat
e m
ean
2001
–201
5 (0
1 Ju
l-07
Jul/
08 Ju
l-14
Jul/
15 Ju
l-21
Jul/
22
Jul-2
8 Ju
1: 1
8.0/
18.
5/ 1
8.7/
19.
0)
01 Jul 2021-07 Jul 2021
08 Jul 2021-14 Jul 2021
15 Jul 2021-21 Jul 2021
22 Jul 2021-28 Jul 2021
Minimum-maximum of the observations 2001–2015Minimum, 25./50./75. percentile, maximum of the climate prediction
Weekly Mean
30
The consequences of climate change affect many fields of action in politics and business.
Extreme events, such as heat waves, droughts, heavy precipitation, etc., trigger chains of effects
which ultimately involve protecting and safeguarding life and property. The Federal overnment
is addressing this issue as part of the implementation of the erman Strategy for Adaptation to
Climate Change (DAS) adopted in December 2008, and since then continuously updated to take
into account aspects of climate impact, climate risk and adaptation. The aim is to inform stake-
holders at all levels about the risks and opportunities of climate change for their area of activity
to be prepared. The DWD provides the climate-related data stock.
Tailor-made climate services The DWD’s key tasks include tailored climate services, all developed in close collaboration with the target groups. Our Regional Climate Offces and the CentralClimate Offce at the headquarters in Offenbach areresponsible for co-ordinating collaboration with users.
The DWD organises an annual user workshop on climate predictions and climate projections. We also publish biannual and situation-based newsletters on topics of current interest in the field of climate science and user-specific applications, as well as their future perspectives in the field of climate predictions and climate projections. Updated climate predictions are regularly published on the DWD climate prediction
The DWD advises and supports users of climate data on issues related to climate, climate variability and climate change.
The services offered include:
◆ consultancy regarding all questions about climate change◆ statistical analyses of climate projection data◆ release of climate projection data and products◆ release of climate prediction data and products
Any questions regarding this can be addressed to the DWD at [email protected]
website. The products and product range offered are constantly being expanded to integrate suggestions from users for easier understanding and additional services. The German Climate Atlas combines climate monitoring and climate projections for Germany with a focus on different fields of action.
The DWD also co-operates with other research insti-tutions on the development of project-based products, such as Test Reference Years (TRY) or the wind climatology project QuWind100, which are provided free of charge to users on the DWD website. In the examples mentioned, observation data and projections of the future were prepared in line with targets and
The DWD’s climate services based on climate predictions and climate projections
31
demand. The interactive service of the CDC portal is dedicated to the special purpose of climate monitoring. A wide range of measured and derived climate data can be retrieved and displayed here. The CDC portal is continuously being expanded.
Climate services in GermanyUp-to-date and reliable basic data and information on climatological, oceanographic and hydrological param-eters as well as the operational services derived from them are continuously needed for the present and the future in order to adapt the transport system to the impacts of climate change and to extreme weather and climate events, but also for many other fields of action of the German Strategy for Adaptation to Climate Change (DAS). The Federal Ministry of Transport and Digital Infrastructure (BMVI) set up the DAS core service Climate and Water in 2020 to fulfil this task and commissioned the DWD with its co-ordination. This service regularly creates and delivers products to support the DAS.
Based on preliminary work in previous and ongoing research projects (such as the BMVI Network of Experts), selected services are already available for operational use in the web portal of the DAS core service Climate and Water. There are plans to develop further services on the basis of current research results in order to expand the portfolio of climate services.
In addition, the DWD has joined forces with other federal agencies to form the German Climate Service
Network (DKD) in order to provide joint climate services for Germany. The DKD offce is run by theDWD. The establishment of the DKD as a network aims to facilitate access to scientifically sound information to support decisions in politics, administration and industry. The aim is that existing knowledge about the climate can then be put to optimum use. This information is made available in the German Climate Preparedness Portal (KLiVO) run on the initiative of the Federal Government and under the joint manage-ment of the DWD and the Federal Environment Agency (UBA). The portal itself offers a collection of access points to a wide range of climate information and climate adaptation services.
Importance of climate services at international levelThese activities make up the DWD contribution to the components recommended by the United Nations Global Framework for Climate Services for success-fully operating climate services at the national level.
At the European level, the operational Copernicus Climate Change Service (C3S) is extremely important. It provides the latest climate indicators and modelled indices for the future. In order to demonstrate its uses, C3S employs impact models to develop practical applications for agriculture, forestry, health care, energy, water and tourism, which support adaptation to climate change. The DWD supplies this Copernicus service with climate prediction data, basic climate variables and climate bulletins.
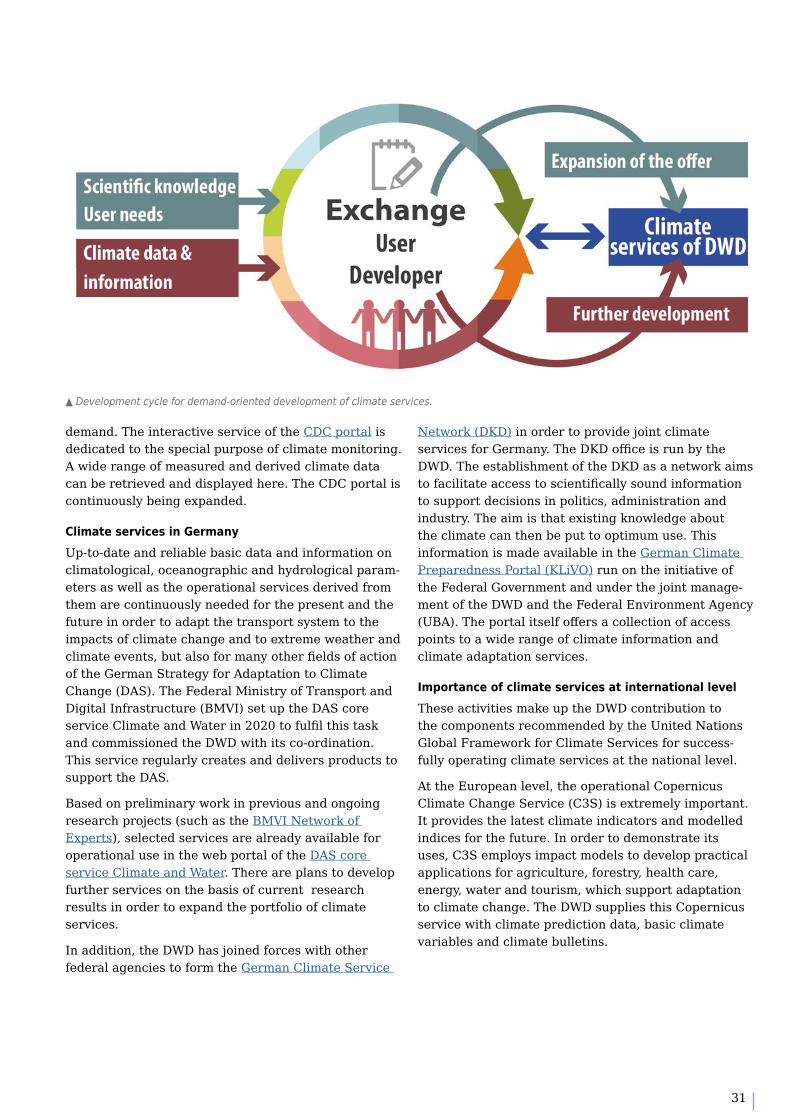
▲ Development cycle for demand-oriented development of climate services.

32
33
OutlookThe Deutscher Wetterdienst, in line with its statutory mandate, provides meteorological and
climatological information ranging from weather forecasts through to climate projections. For
the time horizons beyond those covered by traditional weather forecasts, this is done with the
help of climate models. Today's climate models cover all essential components of the climate
system. However, they still need further improvement in order to provide an even better
description of the climate system with all its components and their interactions, as well as to
increase the quality of resulting predictions and projections. The addition of new observation
data and the analysis of ensembles are vital preconditions for reducing uncertainties.
Statistical models together with dynamic climate models offer a promising approach and can be
increasingly used in the future for ensemble enhancement and follow-up.
A further challenge is the provision of results with higher spatial resolutions down to the local/
municipal level. The use of increasingly finer grids in climate simulations brings other compo-
nents of the climate system into focus, which, because of their complexity, had so far not been
suffciently clear in modelling. Examples are the climate impact of buildings and atmospheric
chemistry. Such questions are addressed through climate research and included in the next
generation of climate models.
More work must be done on seasonal and decadal climate prediction, in particular, to reduce
uncertainties and improve their validity at regional level. The particular importance of these
types of predictions has been emphasised within the framework of the ongoing World Climate
Research Programme (WCRP). The DWD's long-term goal is to achieve seamless climate
prediction/projection capabilities on all temporal and spatial scales. Work has already begun
on the adaptation of the ICON model so that it can be used for climate applications as well
as in weather forecasts. It is expected that the reliability of future climate predictions will be
improved largely by this new state-of-the-art model system.
Co-operation with potential target groups, such as the insurance and wind energy sectors,
disaster management, agriculture or transport, is also of vital importance in connection with
the development of climate services based on climate predictions and climate projections. The
DWD's activities are aimed at providing users with practical products in the field of climate
predictions and climate projections.
34
Publishing details:AuthorsBarbara Früh, Jennifer Brauch, Susanne Brienen, Saskia Buchholz, Kristina Fröhlich, Amelie Hoff, Florian Imbery, Frank Kreienkamp, Jennifer Lenhardt, Nora Leps, Andreas Paxian, Heidi Seybert, Christian Steger, Andreas Walter, Sabrina Wehring
Editorial teamBarbara Früh
Layout and typesettingMichael Kügler, Marcel Reichel, Anja Thomas
Pictures and graphics:DWD, except:
Fotolia.de, altered by DWD: front cover, p. 18 top (Earth globe: Anton Balazh, historical sea map: caz)
Michael Kügler: pp. 8, 26; Hanna Luca: p. 11
Pixabay: p. 3 (left: Larisa Koshkina, centre: Hans Braxmeier, right: Naturfreund_Pics); p. 4 Hans Braxmeier; p. 15 top jwvein; p. 18 bottom jplenio; p. 22 top Winterseitler
Panthermedia.net: p. 6 (Candy18); p. 16 top (kwest); p. 28 Patrick Lienin
ESA-ATG: p. 32; DKRZ: p. 12 top
DKRZ/ESiWACE2, land surface: NASA Blue Marble: p. 13
IPCC AR6: p. 9: Sum. Policymakers Fig. SPM.5; p. 14: Tech. Sum. Fig. TS.4; p. 15 bottom: Chapter 4 Fig. 4.2
MPI: p. 22 buttom, altered by DWDBMVI-Expertennetzwerk/BMVI Network of Experts: p. 19 top
Online editionThis publication is only available in electronic form on our website at www.dwd.de/climateforecastsandprojections.
The online issue is subject to licence: http://creativecommons.org/licenses/by-nc-nd/3.0/deed.de
Contact informationTel.: +49 (0)69 8062-2912 E-mail: [email protected]
Citation informationDWD (2021): Climate predictions and climate projections; Deutscher Wetterdienst, Offenbach am Main, Germany, 36 pages.
ISBN 978-3-88148-532-6 (Online)

35
Web links in this brochure
DWD websitewww.dwd.de
Attribution research at the DWD(in German only)www.dwd.de/attribution
Network of expertswww.bmvi-expertennetzwerk.de
Information portal INKAS for climate adaptation in citieswww.dwd.de/inkas
Copernicus Climate Change Servicehttps://cds.climate.copernicus.eu
Newsletters of the DWD – subscriptionwww.dwd.de/EN/service/newsletter/newsletters_node.html
QuWind 100 (in German only)www.dwd.de/qwind100
German Climate Preparedness Portal KLIVO https://www.klivoportal.de/EN/Home/home_node.html
German Climate Atlaswww.dwd.de/klimaatlas
DAS core service Climate and Water (in German only)www.das-basisdienst.de
Information on the climate in Germanywww.dwd.de/klima-deutschland
Access to climate model data (available via ESGF node)https://esgf.dwd.de/
DWD reference ensemble(in German only)www.dwd.de/ref-ensemble
DWD climate prediction websitewww.dwd.de/klimavorhersagen
DWD user workshop on climate predic- tions and climate projections (in German only)www.dwd.de/klimanutzerworkshop
Access to data sets of test reference years (in German only)www.dwd.de/TRY
Access to climate data via the CDC Portalhttps://cdc.dwd.de/portal
Electronic version of this brochurewww.dwd.de/ climateforecastsandprojections

DW
D, 4
th e
ditio
n, 1
1.21
Deutscher WetterdienstClimate and Environment Consultancy
Frankfurter Strasse 135 63067 Offenbach/Main GERMANY
Tel.: +49 (0)69 8062-2912 E-mail: [email protected]
Go to www.dwd.de to access our pages on
Find out more about climate research at the DWD