Climate change risk - ausindenergy.com › file › 2019 › 04 › Appendix-Q... · Floating...
41
Appendix Q Climate change risk
Transcript of Climate change risk - ausindenergy.com › file › 2019 › 04 › Appendix-Q... · Floating...

Appendix QClimate change risk

Australian Industrial Energy Port Kembla Gas Terminal
Preliminary Climate Change Risk Assessment
November 2018

GHD | Report for Australian Industrial Energy - Port Kembla Gas Terminal, 2127477 | i
Executive summary Climate change poses a risk to new infrastructure developments including energy supply and port infrastructure. The Illawarra region is likely to be impacted by increasing temperatures, a decrease in rainfall, and experience greater intensity of extreme weather events in the future.
A preliminary climate change risk assessment was performed to provide the project proponent with a high level assessment of climate risks that may impact the operations of a floating LNG facility located at Port Kembla Inner Harbour, and to inform the Environmental Impact Statement (EIS) for the proposed asset.
Projections from CSIRO and state agencies informed this risk assessment, by providing an indication of how these climate variables may change over time, and how this may impact a new Floating Storage and Regasification Unit (FSRU) and wharf infrastructure with the potential to operate for the next 10–15 years.
Climate change risk is inherently uncertain, therefore the data provided may be used as an indication of what may transpire in the mid-term, however this change may occur sooner or later than currently projected. These projections must be subject to updates to current climate science including research into coastal climate change impacts which is currently being performed in New South Wales.
A total of eleven climate change risks were identified for the floating LNG facility across impacts such as extreme temperature, sea level rise, storm surge and extreme storm conditions that climate change is projected to potentially cause.
Each identified risk was assessed by multi-disciplinary staff from within the EIS project team, using a generic risk evaluation matrix available for this type of risk assessment:
The highest priority risks caused by climate change identified are posed by rising sea level, east coast low activity and extreme winds.
No high or extreme risks were identified, due in part to the adaptive nature of a floating asset which is anticipated to operate in this capacity for a relatively short period of time. In addition the selected location of the Inner Harbour confers a degree of protection from coastal storm activity.
A number of potential adaptations were identified for consideration, including a designed 14 cm allowance for berthing facilities to account for sea level rise. Potential adaptations should be considered by the asset stakeholders at design stage and operation to ensure that climate risks are adequately addressed to allow the floating LNG facility to be resilient to the impacts of climate change.
This report is subject to, and must be read in conjunction with, the limitations set out in Section 1.4.1 and the assumptions and qualifications contained throughout the Report.
ii | GHD | Report for Australian Industrial Energy - Port Kembla Gas Terminal, 2127477
Table of contents 1. Introduction..................................................................................................................................... 1
1.1 Background .......................................................................................................................... 1
1.2 Project overview ................................................................................................................... 1
1.3 Purpose of this report........................................................................................................... 2
1.4 Scope of assessment........................................................................................................... 2
1.5 Use and limitations of this report ......................................................................................... 3
2. Assessing climate risk .................................................................................................................... 5
2.1 Climate change context ....................................................................................................... 5
2.2 Climate change uncertainty ................................................................................................. 5
2.3 Typical assessment method ................................................................................................ 6
3. Assessment method ....................................................................................................................... 8
3.1 Asset context and design life ............................................................................................... 8
3.2 Climate baseline data .......................................................................................................... 8
3.3 Climate projection data ........................................................................................................ 9
3.4 Risk ranking ....................................................................................................................... 11
3.5 Adaptation responses ........................................................................................................ 11
4. Climate data ................................................................................................................................. 12
4.1 Asset context ..................................................................................................................... 12
4.2 Climate baseline and projection data ................................................................................. 15
4.3 Coastal processes ............................................................................................................. 18
5. Risk assessment .......................................................................................................................... 20
5.1 Higher risk climate impacts ................................................................................................ 20
6. Adaptation .................................................................................................................................... 24
7. References ................................................................................................................................... 25
Table index Table 1 Asset components ............................................................................................................... 8
Table 2 Climate change projection scenarios ................................................................................. 10
Table 3 Asset context and climate tools available .......................................................................... 12
Table 4 Climate data ....................................................................................................................... 15
Table 5 Climate change risk assessment summary ....................................................................... 22
Table 6 Consequence descriptors .................................................................................................... 1
Table 7 Likelihood descriptors .......................................................................................................... 3
Table 8 Combined risk matrix ........................................................................................................... 4
GHD | Report for Australian Industrial Energy - Port Kembla Gas Terminal, 2127477 | iii
Figure index Figure 1 Risk management process (adapted from AS 5334-2013) ................................................. 7
Figure 2 Project location .................................................................................................................. 14
Figure 3 Monthly sea level at Port Kembla (BOM, July 2018) ......................................................... 18
Appendices Appendix A – Risk Matrix
Appendix B – Full climate risk assessment

iv | GHD | Report for Australian Industrial Energy - Port Kembla Gas Terminal, 2127477
Definitions
Term Definition Adaptation Changes made in response to the likely threats and opportunities arising
from climate variability and climate change. Adaptive capacity Ability of a system to respond to climate change to moderate potential
damages, to take advantage of opportunities, or to cope with the consequences.
AWS Automatic Weather Station BOM Bureau of Meteorology Climate scenario Coherent, plausible description of a possible future state of the climate. CO2 Carbon dioxide Consequence Outcomes of an event affecting objectives. Control Measure that is modifying a risk. CSIRO Commonwealth Science and Industrial Research Organisation DJF Denotes summer; December, January, February ECL East Coast Low EIS Environmental Impact Statement ESCCI Eastern Seaboard Climate Change Initiative FSRU Floating storage and regasification unit Impact A threat or an opportunity that may arise as a result of either the weather
or climate change both in the short and long term, and represents the fact that the issue is one that is constantly evolving.
IPCC Intergovernmental Panel on Climate Change LGA Local Government Area Likelihood Chance of something happening. NCCARF National Climate Change Adaptation Research Facility ppm Parts per million RCP Representative Concentration Pathway Residual risk Risk remaining after risk treatment (this can contain unidentified risk,
and may be known as ‘retained risk’). Resilience Adaptive capacity of an organisation in a complex and changing
environment. Risk owner Person or entity with the accountability and authority to manage the risk. Sensitivity Degree to which a system is affected. Either adversely or beneficially, by
climate-related stimuli. SEARs Secretary’s Environmental Assessment Requirements SSVE Southern slopes Victoria east and south-east NSW sub-cluster Vulnerability (to climate change)
Degree to which a system is susceptible to, or unable to cope with, adverse effects of climate change including climate variability and extremes.
Definitions for risk and climate terms provided are adapted from AS 5334-2013 Chapter 4 – Definitions.
GHD | Report for Australian Industrial Energy - Port Kembla Gas Terminal, 2127477 | 1
1. Introduction 1.1 Background
Australian Industrial Energy (AIE) proposes to develop the Port Kembla Gas Terminal (the project). The project involves the development of a liquefied natural gas (LNG) import terminal at Port Kembla, south of Wollongong in New South Wales (NSW). The project will be the first of its kind in NSW and provide a simple, flexible solution to the state’s gas supply challenges.
NSW currently imports more than 95% of the natural gas it uses, with the majority of supplies coming as interstate supplies from Victoria and South Australia. In recent years, gas supplies to the Australian east coast market have tightened, resulting in increased prices for both industrial and domestic users. Several recent economic studies have predicted significant future gas shortfalls for NSW by 2022.
The project provides an immediate solution to address predicted shortages and is predicted to result in considerable economic benefits for both the Illawarra region and NSW.
The project will have capacity to deliver 100 petajoules of natural gas, equivalent to more than 70% of NSW’s gas needs and provide between 10 to 12 days of natural gas storage in case of interstate supply disruption. LNG will be sourced from worldwide suppliers and transported by LNG carriers to the Port Kembla Gas Terminal. The LNG will then be re-gasified for input into the NSW gas transmission network.
1.1.1 Project objectives
Key objectives of the project are to:
Introduce a new source of competitively priced gas to meet predicted supply shortfalls and help put downward pressure on prices.
Provide gas security to NSW with ability to supply more than 70% of the State’s gas needs.
Provide long term contracts to industrial users and ability to meet 100% of the State’s industrial demand (manufacturers, power stations, hospitals, small businesses etc.).
Help support the 300,000 jobs across NSW, and the 15,000 jobs in the Illawarra region, which rely on the competitive, reliable supply of natural gas.
Support the diversification and future growth of Port Kembla consistent with the NSW Ports 30 Year Master Plan.
1.2 Project overview
The project incorporates four key components proposed to be located within industrial land declared under the State Environmental Planning Policy (Three Ports), which include:
LNG carrier vessels — of the hundreds currently in operation transporting LNG from production facilities to demand centres globally.
Floating storage and regasification unit (FSRU) — a vessel which will be moored at berth 101 on the eastern side of the Inner Harbour at Port Kembla. There are around 30 of these currently in operation worldwide with a further 75 ordered or in feasibility planning.
Wharf and berth facilities — such as offloading arms which transfer gas from the FSRU into the pipeline.
Gas pipeline — a short underground gas pipeline connection from Berth 101 to the existing east coast gas transmission network at Cringila.

2 | GHD | Report for Australian Industrial Energy - Port Kembla Gas Terminal, 2127477
At present it is envisaged that an LNG shipment will be required every 2 to 3 weeks to provide for an annual supply of up to 100 PJ of gas. Supply could be increased further to around 140 to 150 PJ per annum through a slight increase in LNG delivery schedules and pipeline upgrades.
It will take 10 – 12 months to complete construction and other works in order to start operations for the project and subject to approval processes, it is possible to have first gas by early 2020.
The estimated capital investment for the development is between $200 and $250 million.
1.3 Purpose of this report
The purpose of this report is to present the findings of a preliminary climate change risk assessment to provide the project proponent with an overview of any evident climate change risks, or climate risk areas which should be further considered during development of the project.
This preliminary climate change risk assessment is intended to inform the project proponent of potential vulnerabilities of the proposed asset from climate hazards and identify ways to address and minimise this vulnerability. Specifically this includes:
Identifying the potential climatic events and hazards that could impact the proposed asset, based on its scale, location, asset components and design life.
Assessment of climate change risk under two timeframes and emission scenarios to provide a qualitative weighting of potential risks.
Linking asset vulnerability associated with climate change to the design of the asset, and potential adaptation options to improve asset resilience.
This report provides input to the body of knowledge to consider various aspects and implications of the proposed asset for the Environmental Impact Statement (EIS). However, as this report is not a requirement of the Secretary’s Environmental Assessment Requirements (SEARs), this report is intended to highlight areas of risk and does not constitute a comprehensive climate change risk assessment.
1.4 Scope of assessment
GHD performed a preliminary climate change risk assessment to contribute towards the development of a climate-resilient asset. This preliminary assessment was conducted using Australian Standard 5334-2013 Climate change adaptation for settlements and infrastructure – A risk based approach. The specific scope in relation to this report comprised the following:
Providing some context for the asset within relevant Federal, State and Local government climate change assessment and adaptation policies and guidelines.
Reviewing publicly available CSIRO and BoM climate data appropriate for the site to gather baseline data and projections to inform possible risks to proposed assets.
Collaborating with multi-disciplinary members of the EIS team to identify applicable risks and assess likelihood and consequence against two timeframes and emission scenarios (refer Section 3.4).
Identifying potential adaptation and mitigation which are planned or may be considered in future stages of design or implementation of the project, including an indication of how these may reduce residual risk.
1.4.1 Scope limitations and key assumptions for assessment
This is a preliminary climate change risk assessment at the reference design stage, and accordingly the scope of the assessment does not include:
GHD | Report for Australian Industrial Energy - Port Kembla Gas Terminal, 2127477 | 3
Modelling of any kind or detailed vulnerability analysis of climate change impacts and risks on design. The assessment is based on current publicly available climate science, with no bespoke modelling performed for specific climate impacts to inform design parameters.
Determining whether proposed adaptation measures should be or can be reasonably implemented and should be considered during detailed design in collaboration with broader asset stakeholders and cost planners.
Completing all elements of AS 5334, including:
– Identification of specific explicit goals and values with respect to climate change
– Identification of specific impacts studies that would be required to further assess consequences of extreme events
– Consideration of future projections in the external context, including land use, demographics, industry and commerce, and supporting infrastructure
– Independent review of the assessment, per the guidance of AS 5334.
Consultation with reference design team members, the project proponent or wider stakeholders. Any future climate risk assessments for this asset may wish to include broader consultation with designers, risk managers, operational managers, and asset owner representatives.
This preliminary climate change risk assessment is indicative of design at the time of the risk assessment and would need to be reviewed during the detailed design phase to provide a current assessment in line with any updates to design.
Analysis of climate change is based on climate change projections available at the time of assessment. These are best available projections of likely future conditions – as such, they have inherent uncertainties as to the likelihood of occurrence and intensity of events (refer Chapter 2).
The assessment of risks has been informed by using a generic risk matrix available in AS 5334. If the risk appetite of the project proponent is significantly different to the risk descriptions set out in the generic matrix in AS 5334 the assessment of risks provided in this report may not align with the proponent’s risk appetite. In this case, the project proponent should ensure that a more bespoke risk matrix is used in a subsequent follow-up climate change risk assessment.
1.5 Use and limitations of this report
This report: has been prepared by GHD for Australian Industrial Energy and may only be used and relied on by Australian Industrial Energy for the purpose agreed between GHD and the Australian Industrial Energy as set out in Sections 1.3 and 1.4 of this report.
GHD otherwise disclaims responsibility to any person other than Australian Industrial Energy arising in connection with this report. GHD also excludes implied warranties and conditions, to the extent legally permissible.
The services undertaken by GHD in connection with preparing this report were limited to those specifically detailed in the report and are subject to the scope limitations set out in the report.
The opinions, conclusions and any recommendations in this report are based on conditions encountered and information reviewed at the date of preparation of the report. GHD has no responsibility or obligation to update this report to account for events or changes occurring subsequent to the date that the report was prepared.
The opinions, conclusions and any recommendations in this report are based on assumptions made by GHD described in this report refer Section 1.4.1 of this report. GHD disclaims liability arising from any of the assumptions being incorrect.

4 | GHD | Report for Australian Industrial Energy - Port Kembla Gas Terminal, 2127477
GHD has prepared this report on the basis of information provided by Australian Industrial Energy and others who provided information to GHD (including Government authorities), which GHD has not independently verified or checked beyond the agreed scope of work. GHD does not accept liability in connection with such unverified information, including errors and omissions in the report which were caused by errors or omissions in that information.
GHD | Report for Australian Industrial Energy - Port Kembla Gas Terminal, 2127477 | 5
2. Assessing climate risk 2.1 Climate change context
There is a growing body of evidence that shows Australia’s climate has changed and continues to change significantly, particularly driven by the work of the Commonwealth Scientific and Industrial Research Organisation (CSIRO) and Bureau of Meteorology (BoM). This will continue to place property, communities and infrastructure assets under risk, which can manifest itself in a number of ways, affecting physical asset life, life-cycle maintenance costs, operating costs and/or revenue. To add to the uncertainty, potential impacts influenced by climate change could be realised in either the short term or decades from today.
Infrastructure is designed to function and perform within the environment that it exists, and to respond to the variable weather conditions for which it has been designed. State, national and international design standards and codes of practice exist to provide the parameters necessary to ensure the desired reliability and level of resilience of various infrastructure components to extreme conditions.
The proposed floating LNG facility asset is subject to climate change uncertainty, from the risks posed to physical asset by climate hazards under the influence of climate change. The NSW state government has a strong focus on research of climate change impacts broadly, and particularly regarding coastal impacts, with significant local climate change research projects being undertaken through the NSW Adaptation Research Hub. This research will inform risk assessments in the future, especially relating to the impact of rising sea level and climatological phenomena such as east coast lows, which have already been shown to impact large carrier vessels in NSW. For any asset to be resilient to the impacts of climate change, consideration must be made to the climate hazards which are applicable to the asset type and broader context, including regular review to incorporate the latest climate science. The results of a climate change risk assessment at any stage of a design promotes resilience and consideration of adaptation, either through designed adaptations or in allowance for future adaptive capacity.
2.2 Climate change uncertainty
Although climate projections represent the presently accepted forefront of climate change science, there is still a high level of uncertainty that exists regarding the climate changes that may actually eventuate. This uncertainty becomes more pronounced as the timescale of the projection is extended. Several areas of uncertainty exist which influence the accuracy of climate change projections, including:
Scenario uncertainty, due to the uncertain future global emissions and concentrations of greenhouse gases and aerosols, resulting from uncertainties regarding the current and future activities of humans.
Climate response uncertainty, resulting from limitations to scientific understanding of the climate system and its representation in climate models, and consequently how much the climate will change due to increased atmospheric concentration of greenhouse gases. This includes natural variability uncertainty, stemming from unperturbed variability in the climate system.
Location specific uncertainties, regarding the assignment of probability distributions to regional climate change projections, and projecting climate change at small spatial scales, particularly for coastal and mountainous areas.

6 | GHD | Report for Australian Industrial Energy - Port Kembla Gas Terminal, 2127477
The inevitability of uncertainty is stated within AS 5334, and it is recognised that decisions and adaptation planning processes should be flexible enough to cope with potential knowledge gaps.
2.3 Typical assessment method
Each climate risk to an asset is rated by identifying and assessing each of the following components:
The climate variable (rainfall, temperature, sea level, high-wind days, etc.), considered in terms of how its patterns may change over time.
The impact of change of that climate variable or a collection of variables in so far as how it may affect the integrity or reliability of some part or component of the infrastructure, or the asset as a whole, and how this may affect the infrastructure operations or reliability overall.
The vulnerability of an asset, or the extent to which it may be able to cope with climate changes. It can be determined through a consideration of:
– The sensitivities of the asset components to various climate variables, and whether environmental ‘thresholds’ exist beyond which an asset may become damaged or operate ineffectively or inefficiently;
– The possible extent of changes in the climate and the frequencies, durations and severities of extreme weather events; and
– The ability of the asset to cope with those changes, and how adaptable the current controls are to meeting new challenges.
The method applied for this climate change risk assessment is consistent with 5334-2013 Climate change adaptation for settlements and infrastructure – A risk based approach which in turn follows the principles of AS/NZS ISO 31000 Risk management – Principles and guidelines.
Although this assessment is specific to climate change and the risks to the LNG facility posed by climate variables, in principle a climate change risk management process typically follows the same process as for any type of risk as shown in Figure 1 below, derived from AS/NZS ISO 31000 – Risk management – Principles and guidelines. This report presents the first iteration of this process, incorporating the three steps defined as a risk assessment, in addition to a preliminary establishment of the context of the asset.

GHD | Report for Australian Industrial Energy - Port Kembla Gas Terminal, 2127477 | 7
Figure 1 Risk management process (adapted from AS 5334-2013)
•Establishing the context
•Risk identification
•Risk analysis
•Risk evaluation
•Risk treatment (adaptation)
Risk assessment
Interaction at each stage and iterative cycles of:
Communication and consultation
Monitoring and review

8 | GHD | Report for Australian Industrial Energy - Port Kembla Gas Terminal, 2127477
3. Assessment method 3.1 Asset context and design life
The development of a LNG import terminal at Port Kembla is anticipated to consist of the following asset components for the purposes of the preliminary climate change risk assessment.
Table 1 Asset components
Component Description
FSRU Double hulled tanker that stores LNG
Berthing Facility Wharf facilities; quick release hooks, beam, mooring dolphins, fenders, quay wall
Gas transmission pipeline
Anticipated 18 inch diameter design in accordance with AS 2885 Australian Pipeline Code
Loading arms Able to withstand -161 °C of LNG under high pressure
LNG carriers Associated LNG carriers anticipated to arrive at 2-3 weekly intervals
Port access channel Dredging of the port will allow access, managed by Ports NSW
Access roads Design includes some allowance for access roads for staff, and fencing
Safety and communications infrastructure
At the current stage of design this infrastructure is anticipated to be largely located within the FSRU
This system is designed to allow shipments of gas to meet market demand and the FSRU may be relocated if the facility is no longer required. The design life for this project is anticipated to be nominally 10 -15 years, with consideration for future extension subject to dry docking for vessel maintenance and market demand. Some asset components, such as the FSRU, have an asset life of 20 -30+ years, noting that FSRUs and carrier vessels may be sold and reused elsewhere beyond this project. In addition, the wharf infrastructure would typically be expected to have around a 50 year design life, extending beyond this particular operational use.
3.2 Climate baseline data
Climate baseline data represents a historical trend of weather data obtained from an appropriate nearby weather station, expressed as an average value for different climate variables measured at that station. Selection of an appropriate weather station involves consideration of the time period and variables measured, and the proximity of the station to the asset being assessed.
The Bellambi weather station was selected for the climate baseline data for the majority of the climate statistics. Bellambi represents the closest weather station in a comparable coastal location with a large range of climate statistics which have been tracked for approximately 20 years. The climate change modelling from CSIRO has been developed based on a 20 year baseline period of 1986-2005, therefore in the selection of weather station data it is ideal to replicate this time period for baseline data. The use of an averaged baseline period allows climate to be more realistically captured to avoid representing weather fluctuations as the average climate.
GHD | Report for Australian Industrial Energy - Port Kembla Gas Terminal, 2127477 | 9
The majority of the Bellambi climate statistics have been measured between 1997 and 2018 which represents a baseline similar to 1986-2005, in a comparable location to Port Kembla. These are not congruent, however would not be likely to alter the outcome for a preliminary assessment intended to identify some key climate risk areas. The values used represent a more conservative approach, whereby a later baseline has been used which would already have been subject to the effects of climate change which are projected. As the data is used to inform predictions of risk which are inherently uncertain, the slight difference in baseline between the data used and that which CSIRO uses to model the projections is unlikely to alter the outcome of the risks assessed.
Both averages and extremes during this time period were captured and supplemented with additional baseline data captured in Port Kembla and the broader Illawarra region (Table 4).
The following climate variables were identified as applicable to this proposed asset and investigated, guided by the AS 5334 suggested variables for liquid fuels storage and distribution infrastructure and port infrastructure:
Temperature; extreme temperature and solar radiation
Rainfall; extreme rainfall, drought and soil moisture
Sea conditions; sea level rise, storm surge and surface temperature
Wind; average and extreme wind
Storms, lightning, hail, and east coast lows.
Although bushfire risk is also suggested by AS 5334 for liquid fuels storage and distribution infrastructure, this variable was not assessed. The area of land which will be developed, including the footprint for new pipeline area is not bushfire prone according to the NSW Rural Fire Service mapping tool1. The number of fire danger days is projected to increase in the future, however increased smoke is likely to be the only potential climate hazard at the Port Kembla Inner Harbour, which was not determined to have an impact to this asset.
Cyclones are a suggested assessment variable for both fuel storage and distribution and port infrastructure. However, research by the Eastern Seaboard Climate Change Initiative (ESCCI) indicates that there are five types of east coast lows, one of which is the extratropical cyclone. As such, east coast lows were assessed in this report as a more applicable climate event which can be comparable to cyclones in their impact (ESCCI, 2016).
3.3 Climate projection data
The Intergovernmental Panel on Climate Change (IPCC) has developed four scenarios for global climate projections that relate to how the world may respond to the challenge of a changing climate, the need to continue to produce and use energy and resources, and the global greenhouse gas emissions that may occur. These scenarios incorporate diverging tendencies based on alternative economic, globalisation and environmental pathways. These have been modified through subsequent reports and renamed as Representative Concentration Pathways (RCPs) in the IPCC’s Fifth Assessment Report.
The CSIRO and BoM released the Climate Change in Australia Technical Report in 2015, which links strongly to findings of the latest IPCC Fifth Assessment Report, and updates the projections previously outlined in the 2007 Technical Report. The 2015 Technical Report uses over 40 global climate models to produce climate change projections as they relate to IPCC RCP scenarios.
1 Available online at https://www.rfs.nsw.gov.au/plan-and-prepare/building-in-a-bush-fire-area/planning-for-bush-fire-protection/bush-fire-prone-land/check-bfpl, accessed Oct 2018
10 | GHD | Report for Australian Industrial Energy - Port Kembla Gas Terminal, 2127477
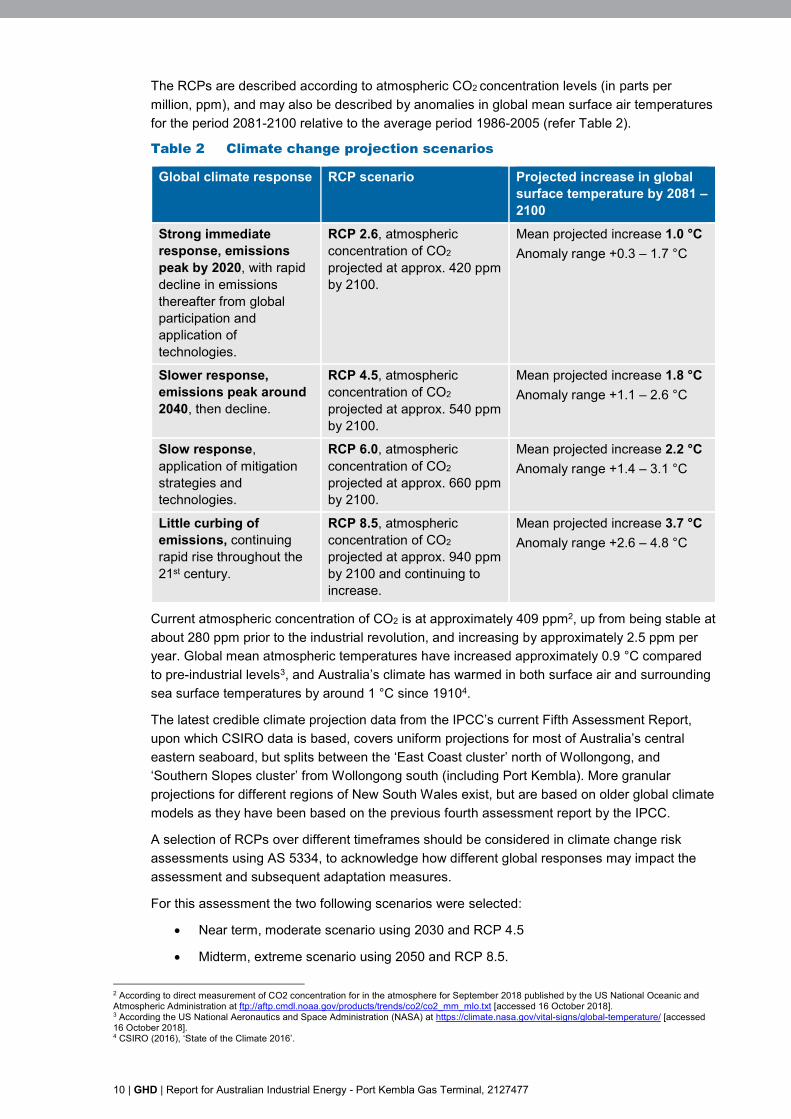
The RCPs are described according to atmospheric CO2 concentration levels (in parts per million, ppm), and may also be described by anomalies in global mean surface air temperatures for the period 2081-2100 relative to the average period 1986-2005 (refer Table 2).
Table 2 Climate change projection scenarios
Global climate response RCP scenario Projected increase in global surface temperature by 2081 – 2100
Strong immediate response, emissions peak by 2020, with rapid decline in emissions thereafter from global participation and application of technologies.
RCP 2.6, atmospheric concentration of CO2 projected at approx. 420 ppm by 2100.
Mean projected increase 1.0 °C Anomaly range +0.3 – 1.7 °C
Slower response, emissions peak around 2040, then decline.
RCP 4.5, atmospheric concentration of CO2 projected at approx. 540 ppm by 2100.
Mean projected increase 1.8 °C Anomaly range +1.1 – 2.6 °C
Slow response, application of mitigation strategies and technologies.
RCP 6.0, atmospheric concentration of CO2 projected at approx. 660 ppm by 2100.
Mean projected increase 2.2 °C Anomaly range +1.4 – 3.1 °C
Little curbing of emissions, continuing rapid rise throughout the 21st century.
RCP 8.5, atmospheric concentration of CO2 projected at approx. 940 ppm by 2100 and continuing to increase.
Mean projected increase 3.7 °C Anomaly range +2.6 – 4.8 °C
Current atmospheric concentration of CO2 is at approximately 409 ppm2, up from being stable at about 280 ppm prior to the industrial revolution, and increasing by approximately 2.5 ppm per year. Global mean atmospheric temperatures have increased approximately 0.9 °C compared to pre-industrial levels3, and Australia’s climate has warmed in both surface air and surrounding sea surface temperatures by around 1 °C since 19104.
The latest credible climate projection data from the IPCC’s current Fifth Assessment Report, upon which CSIRO data is based, covers uniform projections for most of Australia’s central eastern seaboard, but splits between the ‘East Coast cluster’ north of Wollongong, and ‘Southern Slopes cluster’ from Wollongong south (including Port Kembla). More granular projections for different regions of New South Wales exist, but are based on older global climate models as they have been based on the previous fourth assessment report by the IPCC.
A selection of RCPs over different timeframes should be considered in climate change risk assessments using AS 5334, to acknowledge how different global responses may impact the assessment and subsequent adaptation measures.
For this assessment the two following scenarios were selected:
Near term, moderate scenario using 2030 and RCP 4.5
Midterm, extreme scenario using 2050 and RCP 8.5.
2 According to direct measurement of CO2 concentration for in the atmosphere for September 2018 published by the US National Oceanic and Atmospheric Administration at ftp://aftp.cmdl.noaa.gov/products/trends/co2/co2_mm_mlo.txt [accessed 16 October 2018]. 3 According the US National Aeronautics and Space Administration (NASA) at https://climate.nasa.gov/vital-signs/global-temperature/ [accessed 16 October 2018]. 4 CSIRO (2016), ‘State of the Climate 2016’.

GHD | Report for Australian Industrial Energy - Port Kembla Gas Terminal, 2127477 | 11
Per the AS 5334, these projections are current, authoritative and credible.
Although AS 5334 allows the use of a single projection and timeframe for projects with a shorter design life (e.g. 30 years), the use of two projections allows assessment to cover any extended use or repurposing of asset components. In addition, the use of 2050, beyond the design life of the project, allows a more conservative approach of considering the most extreme potential scenario that wharf infrastructure could face, acknowledging that scenarios may transpire earlier than projected.
Each projection scenario represents an average period, with 2030 representing the average for years 2020-2039 and 2050 representing years 2040-2059. The two emission scenarios of RCP 4.5 and 8.5 were selected to provide a multiple potential futures, including a longer term extreme case to ensure that climate risk is not underestimated.
3.4 Risk ranking
Risk analysis involves estimating the likelihood and consequences associated with each of the described risks, with the overall risk level as a function of those two parameters. The risk matrix used for this assessment (provided in Appendix A), including the descriptors for consequence and likelihood, comes from AS 5334. The use of AS 5334 to provide the risk matrix was deemed appropriate for the planning of a proposed asset.
The risk matrix is used to guide:
The allocation of consequences against service reliability, financial, environmental, social/cultural and regulatory objectives.
The determination of likelihood that a described event and the associated impact may arise.
The relative level of risk associated with an event that can then be used to prioritise its management.
A workshop was held on 5 October 2018 with members of the EIS team including the Principal Environmental Consultant managing the EIS, an Environmental Planner, Principal Greenhouse Gas Auditor familiar with LNG facility operations and a Sustainability Consultant. This workshop provided the identification and evaluation of risks to the asset, considering the asset’s proposed location, objectives and intended operations. The risk assessment was subsequently reviewed by a Principal Maritime Engineer who has previously designed berth facilities within Port Kembla’s Inner Harbour.
As a preliminary climate change risk assessment this workshop did not include design team members or broader asset stakeholders for the proposed asset. Any future climate change risk assessment should consider broadening the level of consultation for the assessment.
Baseline climate and projection data (Table 4) were used to inform the assessment of likelihood and consequence for each impact.
3.5 Adaptation responses
Adaptations are identified which have already been planned in reference design, or could potentially be adopted in future design or operation of the asset. Risks were reassessed in light of these planned and potential adaptations, to provide an indication of residual risk that may be achieved if these actions are performed. The adaptation options and residual risk provide additional information, however would need to be considered and implemented by the asset owner at future stages of the project, such as at detailed design and commencement of operations.

12 | GHD | Report for Australian Industrial Energy - Port Kembla Gas Terminal, 2127477
4. Climate data 4.1 Asset context
The berth, FSRU and associated gas pipeline modifications are proposed for a specific location as the outcome of considered assessment. The location of the proposed asset is subject to weather and climate change impacts at various levels. There are similarities in the changing climate experienced by areas at different scales which are typically governed by different government bodies or organisations which may provide climate change mapping or asset management and adaptation guidance relating to climate change.
The context of the pipeline, wharf and FSRU aligns to climate trends and growing knowledge and adaptation management strategies at each of the following scales identified in Table 3 below. Each of these scales is useful to consider when planning to create an asset which is resilient to a changing climate, for example sea level rise is projected at cluster scale, while changes to days above 35 degrees may be better captured at the regional scale.
Table 3 Asset context and climate tools available
Relative location Description/extent Climate Change implications Inner Harbour Specific location of the
wharf for the FSRU and associated infrastructure
Somewhat protected position afforded by planned position within the Inner Harbour
Port Kembla Location of the wharf, south-east coast of NSW
Climate data is tracked for Port Kembla by BOM Coastal outlook to the Tasman Sea, coastal climate change impacts are important to consider
Wollongong City Council
Local government area, 80 km south of Sydney
Wollongong City council has a coastal hazards mapping tool
Illawarra Region Region of NSW, including Wollongong, Shellharbour and Kiama
Projections and advice provided by OEH (AdaptNSW) NARCliM provides projections at 10 km resolution using models from the IPCC’s Fourth Assessment Report
Eastern Seaboard of Australia
An entity which experiences a unique climate in Australia, from approximately Fraser Island down to East Gippsland
Climate change implications provided by AdaptNSW, including research into east coast lows and other local climate influences
Southern Slopes Cluster
Natural Resource Management area defined by CSIRO, Wollongong is the northern tip of the southern slopes cluster, down to the southern tip of Tasmania and across part of coastal Victoria
Projections are available at a cluster level or sub-cluster level from CSIRO Projections by CSIRO use models from the IPCC’s Fifth Assessment Report Port Kembla is located in the Southern Slopes cluster, more specifically the Southern slopes Victoria east and south-east NSW sub-cluster (SSVE)
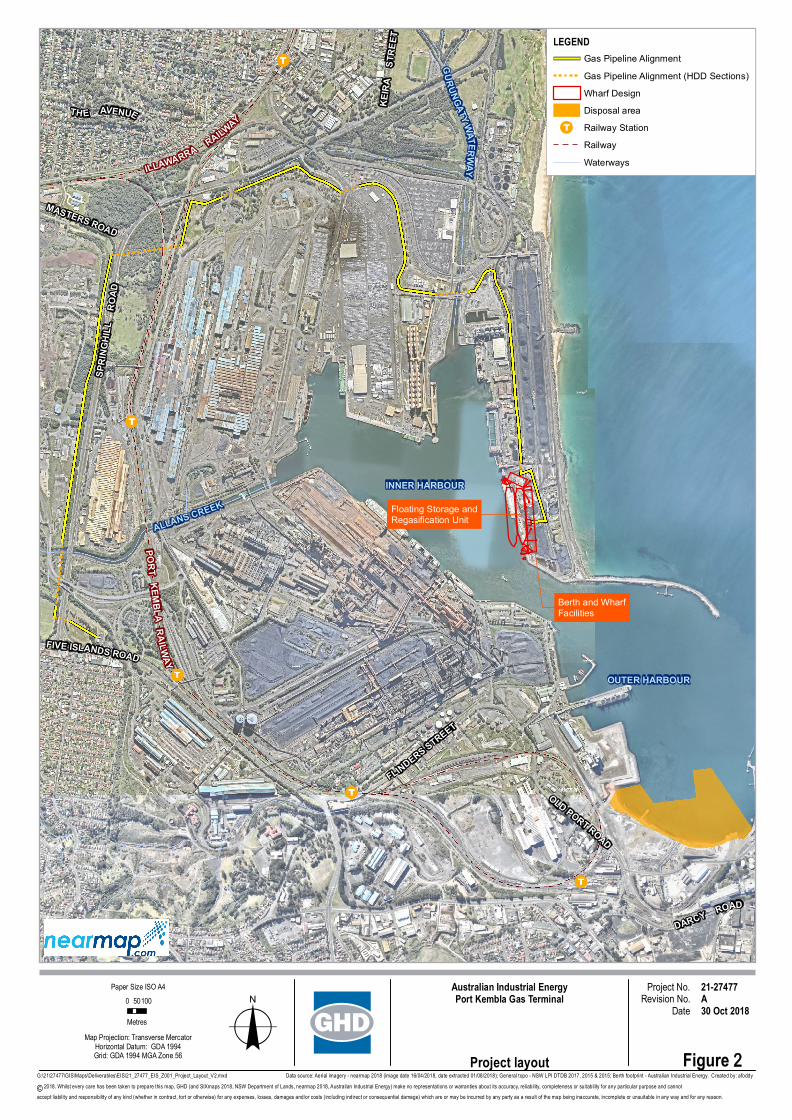
Figure 2 demonstrates the layout of the proposed asset within the Port Kembla Inner Harbour. The CoastAdapt shoreline explorer5 indicates that the entirety of the harbour is dominantly artificial and therefore typically low erodibility. To the north of the Outer Harbour the shores are
5 http://coastadapt.com.au/coastadapt-interactive-map, accessed 11 October 2018

GHD | Report for Australian Industrial Energy - Port Kembla Gas Terminal, 2127477 | 13
classified as dominantly sandy with very high erodibility (visible top right of Figure 2), while to the south shores are dominantly hard rock with low erodibility.
OUTER HARBOUR
INNER HARBOUR
ALLANS CREEK
GU
RUNGATY
WATER
WAYILLAWARRA
RAILWAY
POR
TK
EMBLA
RA
ILWAY
FLINDERS STREET
KEI
RA
STR
EET
MASTERS ROAD
THE AVENUE
DARCY ROAD
SPR
ING
HIL
L R
OA
D
FIVE ISLANDS ROAD
OLD PORT ROAD
Figure 2
0 50100
Metres
Project No.Revision No. A
21-27477Date 30 Oct 2018
Australian Industrial EnergyPort Kembla Gas Terminal
Map Projection: Transverse MercatorHorizontal Datum: GDA 1994Grid: GDA 1994 MGA Zone 56
Paper Size ISO A4
o
LEGENDGas Pipeline Alignment
Gas Pipeline Alignment (HDD Sections)
Wharf Design
Disposal area
!T Railway Station
Railway
Waterways
Project layoutData source: Aerial imagery - nearmap 2018 (image date 16/04/2018, date extracted 01/08/2018); General topo - NSW LPI DTDB 2017, 2015 & 2015; Berth footprint - Australian Industrial Energy. Created by: afoddyG:\21\27477\GIS\Maps\Deliverables\EIS\21_27477_EIS_Z001_Project_Layout_V2.mxd
© 2018. Whilst every care has been taken to prepare this map, GHD (and SIXmaps 2018, NSW Department of Lands, nearmap 2018, Australian Industrial Energy) make no representations or warranties about its accuracy, reliability, completeness or suitability for any particular purpose and cannotaccept liability and responsibility of any kind (whether in contract, tort or otherwise) for any expenses, losses, damages and/or costs (including indirect or consequential damage) which are or may be incurred by any party as a result of the map being inaccurate, incomplete or unsuitable in any way and for any reason.
Floating Storage andRegasification Unit
Berth and WharfFacilities

GHD | Report for Australian Industrial Energy - Port Kembla Gas Terminal, 2127477 | 15
4.2 Climate baseline and projection data
The climate trends projected and baseline data summary are provided in Table 4 below. These projections informed the assessment of consequence and likelihood identified in Chapter 5.
Table 4 Climate data
VARIABLE CURRENT CLIMATE CLIMATE CHANGE PROJECTIONS
Climate variable Annual Historical
trend Bellambi AWS
Baseline period
Near term, moderate scenario 2030, RCP 4.5
Mid‐term, extreme scenario 2050, RCP 8.5 Source
Mean maximum daily temperature (°C) ‐ Annual
21.4 1997‐2018 +0.7° (0.5 to 1.0) +1.6° (1.2 to 2.0) 1
Mean maximum daily temperature (°C) ‐ Summer (DJF)
24.6 1997‐2018 +0.8° (0.5 to 1.3) +1.7° (1.2 to 2.4) 1
Days p.a. over 35 °C 1.7 1997‐2018 +0 to 3 n/a 7
Days p.a. over 40 °C 0.2 1997‐2018 Substantial increase in warm spells 4
Highest temperature for years 1997 to 2018 (°C)
43.7 1 Jan 2006
Discrete event
n/a
Hottest day: Summer monthly maximum (DJF)
40.5 1997‐2018 +1.2° (0.6 to 1.9) +2.1° (1.0 to 2.9) 2
Mean daily solar exposure (MJ/(m*m))
15.5 2007‐2018 +0.7% (‐0.1 to 2.0) +1.9% (+0.2 to 3.7) 1
Mean rainfall (mm) ‐ annual 1123.8 1997‐2018 ‐2% (‐9 to 6) ‐3.9% (‐8.7 to 4.1) 3, 1
Highest daily rainfall (mm) for years 1997 to 2018
240 18 Aug 1998
Discrete event
n/a
Wettest day: monthly maximum 1‐day rainfall event (mm) ‐ Annual
122 1997‐2018 +4.4% (‐1.5 to 9.6) +9.8% (‐1.2 to 14.3) 2
Maximum 1 day rainfall for a 20 year ARI event
n/a +6.7% (‐2.1 to 16.4) +10.1% (‐2.2 to 22.8) 2
Drought n/a Increased time spent in drought 6
Soil moisture n/a ‐2.3% (‐4.2 to ‐0.4) n/a 3

16 | GHD | Report for Australian Industrial Energy - Port Kembla Gas Terminal, 2127477
Climate variable Annual Historical
trend Bellambi AWS
Baseline period
Near term, moderate scenario 2030, RCP 4.5
Mid‐term, extreme scenario 2050, RCP 8.5 Source
Sea level rise Refer baseline
graph +0.14 m (0.09 to 0.18) +0.27 m (0.19 to 0.36) 10
Storm surge n/a Storm surge in NSW often due to East Coast Low activity (refer below) 9
Percentage exceedance for significant wave height (m) for Port Kembla, years 1974 to 2012
5.62 1974‐2011 n/a (Baseline: 11)
Sea surface temperature Approx 15 to 25°C Mar‐Oct 2018
Rise in sea surface temperature (Baseline: 8), 14
Avg. 9 am wind speed (km/h) 17.0 1997‐2010 +0.4% (‐2.0 to 1.3) +0.9% (‐1.9 to 2.5) 1
Avg. 3 pm wind speed (km/h) 23.3 1997‐2010 +0.4% (‐2.0 to 1.3) +0.9% (‐1.9 to 2.5) 1
Maximum wind gust for years 2003‐2018 (km/h)
141 24 Aug 2003
Discrete event
n/a
East Coast Lows 10 per year
(Illawarra region)
Low/mid intensity ECL: ‐19% frequency in winter, +9% frequency in summer
High intensity ECL: ‐6% frequency in winter, +28% frequency in summer
(Baseline: 12) 13
Lightning 20‐25 thunder days (Illawarra region)
+5‐6% change per degree warming (Baseline: 12) 12
Hail 3 hailstorms per
year (Illawarra region)
Hail projections unclear (Baseline: 12)
Table notes:
1 CSIRO BOM 2015, Climate Change in Australia Summary Data Explorer, Southern Slopes Cluster Projections
2 CSIRO BOM 2015, Climate Change in Australia Extremes Data Explorer, Southern Slopes Cluster Projections
3 CSIRO BOM 2015, Climate Change in Australia Projections Cluster Report - Southern Slopes, Table 1
4 CSIRO BOM 2015, Climate Change in Australia Projections Cluster Report - Southern Slopes, Section 4.2.1
5 CSIRO BOM 2015, Climate Change in Australia Projections Cluster Report - Southern Slopes, Section 4.4.1
GHD | Report for Australian Industrial Energy - Port Kembla Gas Terminal, 2127477 | 17
6 CSIRO BOM 2015, Climate Change in Australia Projections Cluster Report - Southern Slopes, Section 4.4.2
7 Office of Environment and Heritage 2014, Illawarra Climate change snapshot
8 Manly Hydraulics Laboratory NSW Offshore Sea Surface Temperature, recording for March - Oct 2018
9 CSIRO BOM 2015, Climate Change in Australia Projections Cluster Report - Southern Slopes, Section 4.11.1
10 NCCARF 2017, CoastAdapt sea level rise projection for Wollongong LGA
11 Manly Hydraulics Laboratory (2018). Port Kembla Offshore Wave, Height, Period & Direction, accessed Oct 2018
12 Environment, climate change & water 2010, Impacts of climate change on natural hazards profile, Illawarra region
13 Eastern Seaboard Climate Change Initiative 2016, East Coast Lows Research Program Synthesis for NRM Stakeholders
14 CSIRO BOM 2015, Climate Change in Australia Projections Cluster Report - Southern Slopes, Section 4.11.2
NB: DJF designates December January, February for the Australian summer period
This data is used to inform the risk assessment, however it is worth noting that it is difficult to predict the interactions between multiple of these variables, and that the worst conditions may arise where multiple unfavourable climate conditions coincide.

18 | GHD | Report for Australian Industrial Energy - Port Kembla Gas Terminal, 2127477
4.3 Coastal processes
4.3.1 Sea level rise
As a significant port, Port Kembla has a number of climate variables which have been tracked by BOM for a long period of time. Monthly sea level has been captured at Port Kembla as demonstrated in Figure 3 below, demonstrating the natural variability which exists.
Figure 3 Monthly sea level at Port Kembla (BOM, July 2018)
Projections for sea level rise have high confidence and model agreement, and the National Climate Change Adaptation Research Facility (NCCARF) through CoastAdapt publishes allowance values which indicate the height difference needed to confer an equivalent level (particularly in respect to asset protection) to the baseline of 1986-2005 in relation to sea level. The allowance for 2030 under RCP 4.5 is 14 cm for Wollongong Local Government Area (LGA).
Sea level rise will have implications for coastal erosion and inundation, and will increase the storm surge height. In addition, engineered controls in coastal areas may become less effective, increasing the vulnerability of physical assets in coastal areas. For example, storm surge which is projected to increase will be further exacerbated by rising sea levels. Astronomical tides, wind-waves and storm surges will all contribute to extreme sea level events.
4.3.2 East coast lows
Two notable examples exist when east coast lows have directly impacted carriers in NSW which serve to demonstrate the particular climate risks faced by this kind of asset:
Bulk carrier Sygna drifted in extreme wind and swell conditions off the coast of Newcastle and grounded, causing a major pollution incident in 1974
Bulk carrier Pasha was grounded near Newcastle, resulting in a three week salvage operation in 2007.
GHD | Report for Australian Industrial Energy - Port Kembla Gas Terminal, 2127477 | 19
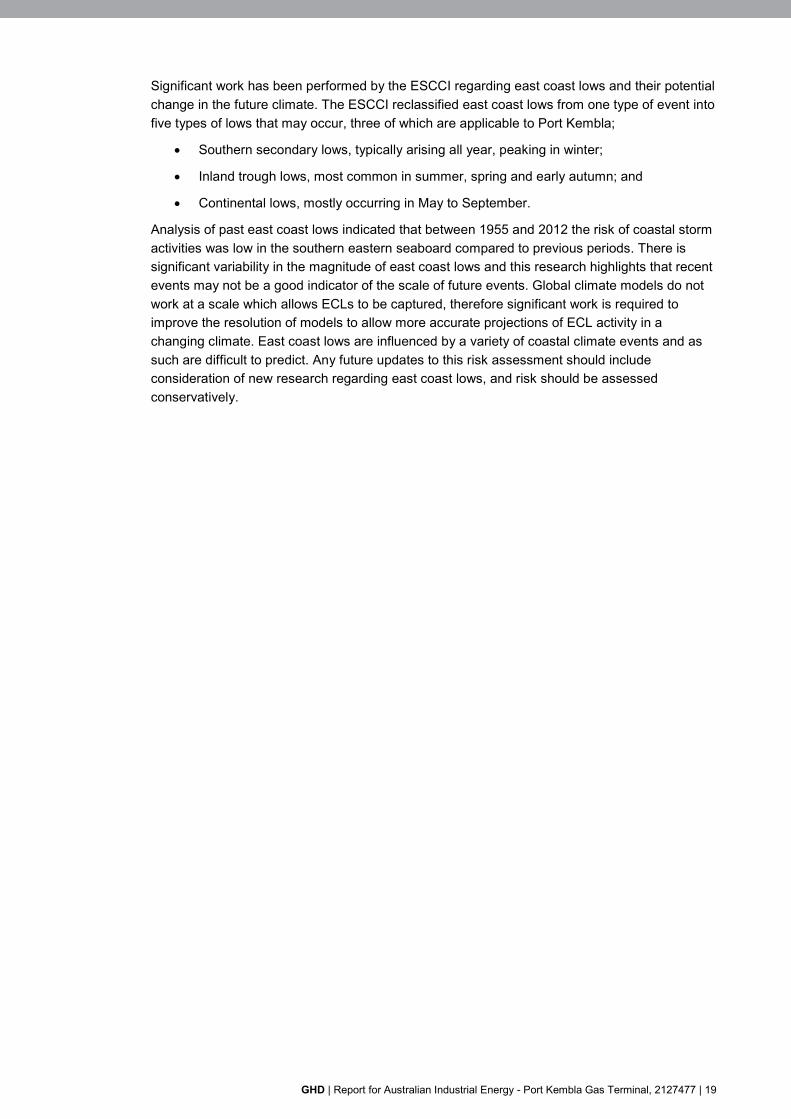
Significant work has been performed by the ESCCI regarding east coast lows and their potential change in the future climate. The ESCCI reclassified east coast lows from one type of event into five types of lows that may occur, three of which are applicable to Port Kembla;
Southern secondary lows, typically arising all year, peaking in winter;
Inland trough lows, most common in summer, spring and early autumn; and
Continental lows, mostly occurring in May to September.
Analysis of past east coast lows indicated that between 1955 and 2012 the risk of coastal storm activities was low in the southern eastern seaboard compared to previous periods. There is significant variability in the magnitude of east coast lows and this research highlights that recent events may not be a good indicator of the scale of future events. Global climate models do not work at a scale which allows ECLs to be captured, therefore significant work is required to improve the resolution of models to allow more accurate projections of ECL activity in a changing climate. East coast lows are influenced by a variety of coastal climate events and as such are difficult to predict. Any future updates to this risk assessment should include consideration of new research regarding east coast lows, and risk should be assessed conservatively.

20 | GHD | Report for Australian Industrial Energy - Port Kembla Gas Terminal, 2127477
5. Risk assessment This preliminary climate change risk assessment identified eleven risks which are applicable to the proposed FSRU and associated infrastructure. A summary of the climate change risks identified, including their ratings under the current baseline climate, in 2030 (under RCP 4.5) and 2050 (under RCP 8.5) is provided in Table 5. Additionally, adaptation options were identified and their effect on the residual risk assessed in light of these controls which have been or may be adopted in the future.
An FSRU and associated wharf infrastructure may inherently be more resilient to the effects of climate than a fixed asset, as an FSRU is moveable and as such is designed to operate in a wide variety of climates across the world. This includes particularly harsh climates which may be more extreme than Australia’s under the effect of climate change for some variables. For example FSRUs are designed to operate in Dubai and therefore may be more resilient to extreme heat than other infrastructure which is not designed for such a wide range of ambient and extreme temperatures. Given that FSRUs are also required and designed to travel across the sea in rough conditions, risks from storm surge and hail were assessed as low.
Typically impacts identified have consequences for the infrastructure service, causing delays or early renewal, and financial cost to the operation of the asset. In addition some impacts were identified which may have consequences for the environment or social impact.
5.1 Higher risk climate impacts
5.1.1 Sea level rise impacts
The most certain future climate risk to the proposed asset is posed by sea level rise which is projected with very high confidence. Sea level rise increases the chance of inundation to wharf infrastructure or stress from a comparative change in height between the FSRU and the dock for the loading arms. Sea level rise is projected to be 14 cm under RCP 4.5 and RCP 8.5 by 2030 for Wollongong LGA. Accordingly, the reference design for the wharf currently includes an allowance to account for this climate impact of approximately 14 cm. This means that in 2030 the level of the wharf under 14 cm sea level rise would have a similar risk to current conditions of inundation which the 14 cm additional height adaptation. This is appropriate for the current maximum intended life of the LNG facility, however in 2050 sea level is predicted to rise by 22 cm therefore any remaining or repurposed infrastructure will be at higher risk of disruption from sea level rise. The residual risk of sea level rise impacting on berthing facilities was assessed as insignificant due to the anticipated placement of critical infrastructure such as significant electrical, communication and safety infrastructure within the FSRU which is not vulnerable to sea level rise or inundation, as a floating vessel.
5.1.2 East coast low impacts
East coast lows have been shown to impact bulk carriers in NSW (refer Section 5.1.2), therefore the likelihood of the FSRU to break from the berth and run aground or cause damage was assessed as possible. The selection of the Inner Harbour for this floating LNG facility was made with consideration of extreme weather events, and this precise location means that the FSRU and berth will be somewhat protected from east coast low impacts. Therefore the residual likelihood for this impact has been assessed as unlikely, but the potential consequences include damage and disruption to infrastructure service and environmental damage. The risk posed by east coast lows may be updated in the future to account for increased modelling capabilities in light of current research.

GHD | Report for Australian Industrial Energy - Port Kembla Gas Terminal, 2127477 | 21
5.1.3 Extreme wind impacts
Extreme winds are often associated with east coast low systems in the Illawarra region. Extreme winds were assessed as being the most likely residual risk to the asset, disrupting gas supply either by damage caused to the facility, or by the restricted safe movement of carriers causing delay to supply. There is high model agreement on little change in average wind speed for 2030 under RCP 4.5 for the Southern Slopes cluster, however there is little information regarding projections for extreme wind. It is unclear what implications the future climate will have for extreme wind, given the uncertainty of storm and east coast low projections. As the expected supply of LNG to the FSRU is anticipated to be on a 2-3 weekly basis, the adaptation measure identified for wind management is adaptive management of the asset, whereby managers may mitigate disruption to supply by timing delivery and scheduling of carriers appropriately. This would be the responsibility of management in conjunction with the Port Authority of NSW who are responsible for the management of shipping operations in Port Kembla, including the provision of Harbour Master functions, pilotage, navigation services and ship scheduling.
22 | GHD | Report for Australian Industrial Energy - Port Kembla Gas Terminal, 2127477
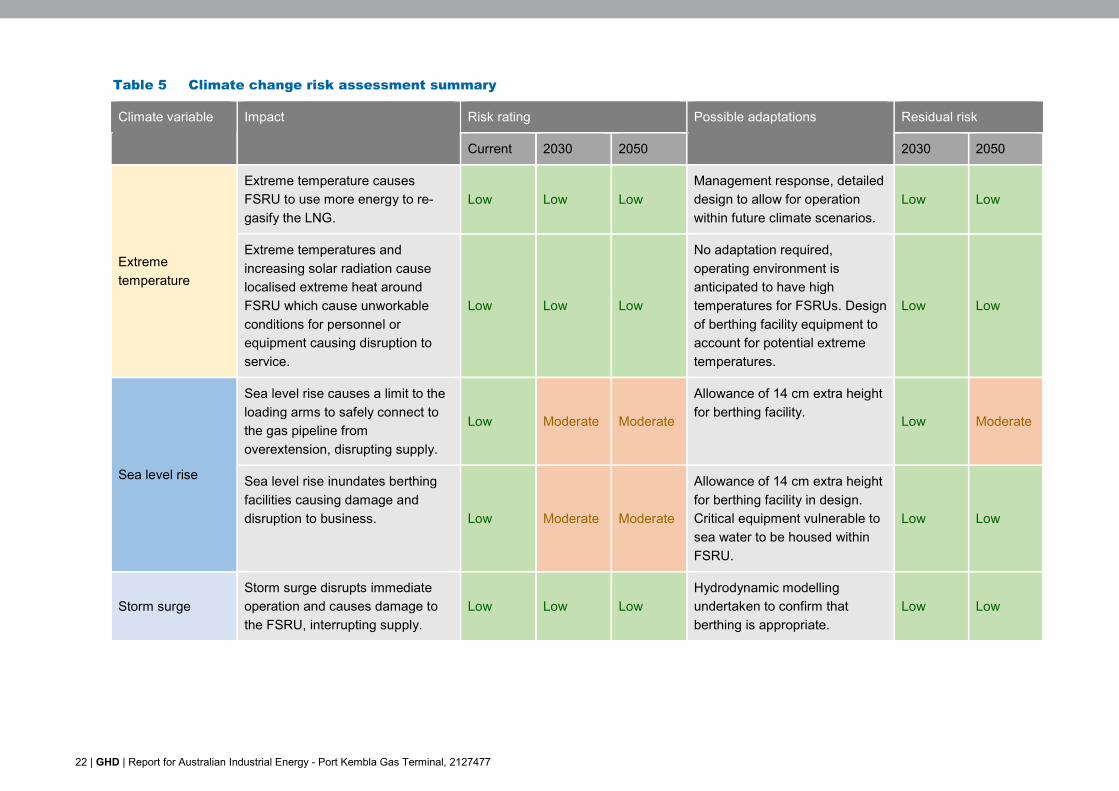
Table 5 Climate change risk assessment summary
Climate variable Impact Risk rating Possible adaptations Residual risk
Current 2030 2050 2030 2050
Extreme temperature
Extreme temperature causes FSRU to use more energy to re-gasify the LNG.
Low Low Low Management response, detailed design to allow for operation within future climate scenarios.
Low Low
Extreme temperatures and increasing solar radiation cause localised extreme heat around FSRU which cause unworkable conditions for personnel or equipment causing disruption to service.
Low Low Low
No adaptation required, operating environment is anticipated to have high temperatures for FSRUs. Design of berthing facility equipment to account for potential extreme temperatures.
Low Low
Sea level rise
Sea level rise causes a limit to the loading arms to safely connect to the gas pipeline from overextension, disrupting supply.
Low Moderate Moderate
Allowance of 14 cm extra height for berthing facility.
Low Moderate
Sea level rise inundates berthing facilities causing damage and disruption to business. Low Moderate Moderate
Allowance of 14 cm extra height for berthing facility in design. Critical equipment vulnerable to sea water to be housed within FSRU.
Low Low
Storm surge Storm surge disrupts immediate operation and causes damage to the FSRU, interrupting supply.
Low Low Low Hydrodynamic modelling undertaken to confirm that berthing is appropriate.
Low Low

GHD | Report for Australian Industrial Energy - Port Kembla Gas Terminal, 2127477 | 23
Climate variable Impact Risk rating Possible adaptations Residual risk
Current 2030 2050 2030 2050
Storm surge causes disturbance of sediment, cutting off channel allowing access to facility.
Low Low Low
Control of the channel and dredging is the responsibility of NSW Ports and regularly maintained.
Low Low
Sea water temperature
Sea level temperature rise allows more efficient heating of LNG from sea water.
Low Low Low None identified at this stage of the project. Low Low
East Coast Lows
East coast lows cause extreme conditions which leads to the FSRU to break from the berth, causing environmental damage and damage to the FSRU.
Low Moderate Moderate
Detailed design to account for extreme weather events. Site of Inner Harbour selected to reduce the impact of extreme storms.
Moderate Moderate
Hail Hail causes damage to loading arms or berthing infrastructure.
Low Low Low None identified at this stage of the project.
Low Low
Extreme wind
Safe navigation of vessels within Inner Harbour limited by extreme wind conditions, causing delay and interruption to supply.
Moderate Moderate Moderate
Port protocols and scheduling of services to manage this risk.
Moderate Moderate
Extreme wind disrupt immediate operation and causes damage to the FSRU, interrupting supply.
Moderate Moderate Moderate Port protocols and scheduling of services to manage this risk. Moderate Moderate
Further detail of the likelihood and consequence for each risk rating and the impact type used to determine consequence is provided in the full risk assessment table in Appendix B.

24 | GHD | Report for Australian Industrial Energy - Port Kembla Gas Terminal, 2127477
6. Adaptation The inevitability of climate change uncertainty impacts adaptation planning for climate risk, and it is recognised that decisions and planning processes should be flexible enough to cope with potential knowledge gaps. Accordingly, a key principle toward adapting to a future with an uncertain climate may be to adopt ‘adaptive management’, i.e. implementing incremental changes and adaptation measures based on climate and scientific monitoring and prescribed responses. Some adaptation options for infrastructure that may be deemed appropriate in response to the most extreme climate projections may require large-scale engineering or other works, the need for which will depend on the extent of climate change that actually transpires over time, as opposed to the conditions that were modelled.
Some adaptation measures have been planned for design as identified in Table 5 and will serve to make the LNG facility less vulnerable to the effects of climate change. The allowance of 14 cm for sea level rise is a key potential adaptation planned for design, which mitigates the effects of sea level rise for 2030. This is in accordance with the recommended allowance height suggested by the National Climate Change Adaptation Research Facility through the CoastAdapt projections for Wollongong Local Government Area.
Some of the potential adaptation responses identified in this risk assessment are management responses which would need to be implemented by the asset manager in conjunction with staff and wider stakeholders such as NSW Ports. Additional adaptation responses should be considered during detailed design and at future intervals of the project to ensure that climate risks are appropriately mitigated. Per AS 5334, continuous feedback loops of monitoring and review are required, as well as communication and consultation with relevant stakeholders, to continue to effectively manage risks.
Where risks are deemed to be a tolerable level, adaptation is not required, however this must be reassessed over the life of the proposed asset, particularly if climate projections are updated by CSIRO. Any future adaptation assessment should take into account factors such as the effectiveness, cost, duration and feasibility of the adaptation option, in addition to the impacts to greenhouse gas emissions, the social and environmental context and any implications for related risk profiles as a result of implementing the adaptation.

GHD | Report for Australian Industrial Energy - Port Kembla Gas Terminal, 2127477 | 25
7. References Australian Maritime Safety Authority (2007). National Plan to Combat Pollution of the Sea by Oil and other Noxious and Hazardous Substances, Annual Report 2006-2007
Australian Maritime Safety Authority (2018). Sygna, 26 May 1974, available online https://www.amsa.gov.au/marine-environment/incidents-and-exercises/sygna-26-may-1974
CSIRO (2015). Climate Change in Australia Projections Cluster Report – East Coast.
CSIRO (2015). Climate Change in Australia Projections Cluster Report – Southern Slopes.
CSIRO (2015). Climate Change in Australia Technical Report.
CSIRO (2016). State of the Climate 2016.
Manly Hydraulics Laboratory (2018). Port Kembla Offshore Wave, Height, Period & Direction, accessed Oct 2018 at http://new.mhl.nsw.gov.au/data/realtime/wave/Buoy-ptkmow
Manly Hydraulics Laboratory (n.d.). NSW Wave Climate Port Kembla Waverider Buoy Storm History, accessed Oct 2018.
National Climate Change Adaptation Research Facility (2017) Sea-level rise and future climate information for coastal councils, accessed Oct 2018 at https://coastadapt.com.au/sea-level-rise-information-all-australian-coastal-councils
Office of Environment and Heritage (2014). Illawarra Climate change snapshot.
Standards Australia Limited (2009). Risk management – Principles and guidelines.
Standards Australia Limited (2013). Australian Standard Climate change adaptation for settlements and infrastructure – A risk based approach.
State of New South Wales and Office of Environment and Heritage (2016). Eastern Seaboard Climate Change Initiative East Cost Lows Research Program Synthesis for NRM Stakeholders.
State of NSW and Department of Environment, Climate Change and Water (2010). Impacts of Climate Change on Natural Hazards Profile – Illawarra Region.
Note: references specific to climate data and projections are provided on page 15

GHD | Report for Australian Industrial Energy - Port Kembla Gas Terminal, 2127477
Appendices

GHD | Report for Australian Industrial Energy - Port Kembla Gas Terminal, 2127477 | 1
Appendix A – Risk Matrix Table 6 Consequence descriptors
Infrastructure service Adaptive capacity (see note 1)
Governance Social/cultural Environmental (see note 3)
Economy (see note 4)
Financial (see note 2)
Catastrophic Significant permanent damage and/or complete loss of the infrastructure and the infrastructure service. Loss of infrastructure support and translocation of service to other sites. Early renewal of infrastructure by >90%
Capacity destroyed, redesign required when repairing or renewing asset
Major policy shifts. Change to legislative requirements. Full change of management control
Severe adverse human health effects, leading to multiple events of total disability or fatalities. Total disruptions to employees, customers or neighbours. Emergency response at a major level
Very significant loss to the environment. May include localized loss of species, habitats or ecosystems. Extensive remedial action essential to prevent further degradation. Restoration likely to be required
Major effect on the local, regional and state economies
Extreme financial loss >90%
Major Extensive infrastructure damage requiring major repair. Major loss of infrastructure service. Early renewal of Infrastructure by 50–90%
Major loss in adaptive capacity. Renewal or repair would need new design to improve adaptive capacity
Notices issued by regulators for corrective actions. Changes required in management. Senior management responsibility questionable
Permanent physical injuries and fatalities may occur. Severe disruptions to employees, customers or neighbours
Significant effect on the environment and local ecosystems. Remedial action likely to be required
Serious effect on the local economy spreading to the wider economy
Major financial loss 50-90%

2 | GHD | Report for Australian Industrial Energy - Port Kembla Gas Terminal, 2127477
Infrastructure service Adaptive capacity (see note 1)
Governance Social/cultural Environmental (see note 3)
Economy (see note 4)
Financial (see note 2)
Moderate Limited infrastructure damage and loss of service. Damage recoverable by maintenance and minor repair. Early renewal of Infrastructure by 20–50%.
Some change in adaptive capacity. Renewal or repair may need new design to improve adaptive capacity
Investigation by regulators. Changes to management actions required
Frequent disruptions to employees, customers or neighbours. Adverse human health effects
Some damage to the environment, including local ecosystems. Some remedial action may be required
High impact on the local economy, with some effect on the wider economy
Moderate financial loss 10-50%
Infrastructure service Adaptive capacity (see note 1)
Governance Social/cultural Environmental (see note 3)
Economy (see note 4)
Financial (see note 2)
Minor Localized infrastructure service disruption. No permanent damage. Some minor restoration work required. Early renewal of infrastructure by 10–20%. Need for new/modified ancillary equipment
Minor decrease to the adaptive capacity of the asset. Capacity easily restored
General concern raised by regulators requiring response action
Short-term disruption to employees, customers or neighbours. Slight adverse human health effects or general amenity issues
Minimal effects on the natural environment
Minor effect on the broader economy due to disruption of service provided by the asset
Additional operational costs Financial loss small, <10%

GHD | Report for Australian Industrial Energy - Port Kembla Gas Terminal, 2127477 | 3
Infrastructure service Adaptive capacity (see note 1)
Governance Social/cultural Environmental (see note 3)
Economy (see note 4)
Financial (see note 2)
Insignificant No infrastructure damage, little change to service
No change to the adaptive capacity
No changes to management required
No adverse human health effects
No adverse effects on natural environment
No effects on the broader economy
Little financial loss or increase in operating expenses
Table notes:
1. Adaptive capacity relates to the ability of the infrastructure element to adapt/change/cope with change in the climate change variable.
2. Financial loss will be relative to the infrastructure element being considered. Dollar values need to include replacement cost for the infrastructure item and financial loss/costs relating to the loss of
the service provided by the infrastructure item.
3. 'Environment' here refers to the natural environment outside the asset being considered.
4. Economy refers to the local economy (town or region), the state economy or the economy of Australia as a whole. Significance of this measure will depend on the asset being considered.
Table 7 Likelihood descriptors
Rare Unlikely Possible Likely Almost Certain
Long term risks May occur in exceptional circumstances within the asset's lifetime period if the risk is not mitigated
Has a 10–30% chance of occurring in the asset's lifetime if the risk is not mitigated
Has a 40–60% chance of occurring in the asset's lifetime if the risk is not mitigated
Has a 60–90% chance of occurring within the asset's lifetime if the risk is not mitigated
Has a greater than 90% chance of occurring within the asset's lifetime if the risk is not mitigated
Event risks Unlikely during the next 50 years
May arise once in 25 to 50 years
May arise once in 25 years
May arise about once per year
Could occur several times per year
GHD | Report for Australian Industrial Energy - Port Kembla Gas Terminal, 2127477 | 4
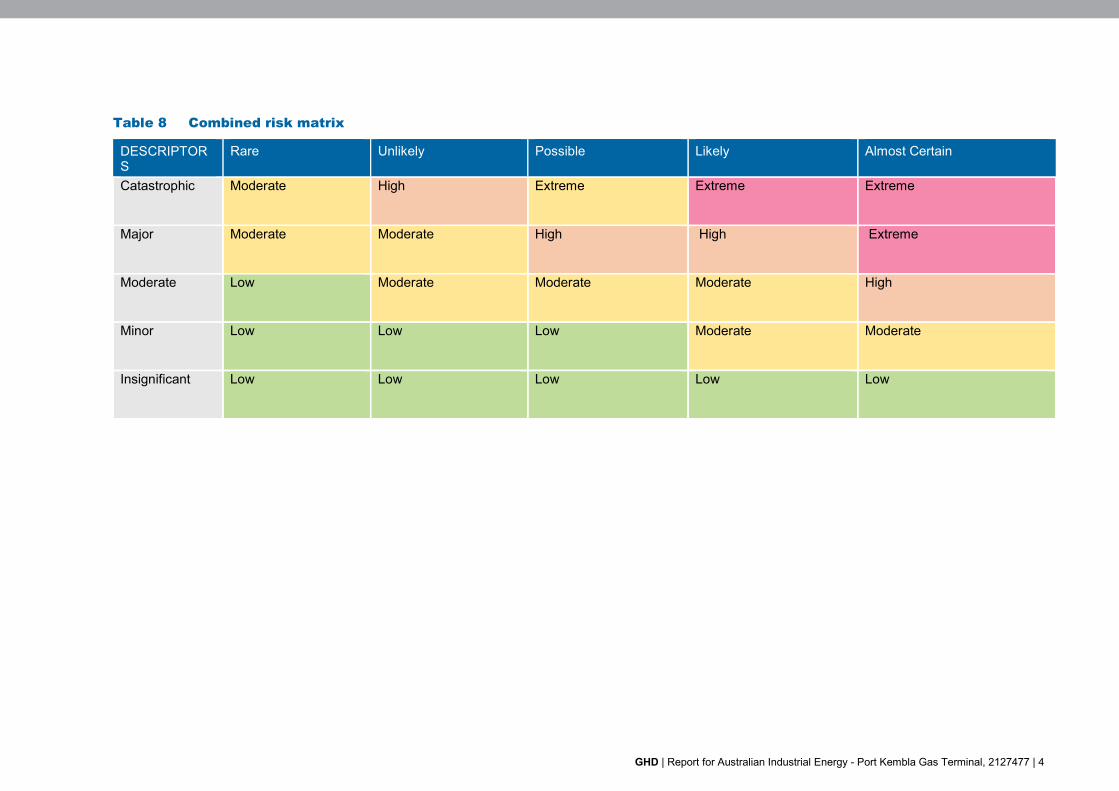
Table 8 Combined risk matrix
DESCRIPTORS
Rare Unlikely Possible Likely Almost Certain
Catastrophic Moderate High Extreme Extreme Extreme
Major Moderate Moderate High High Extreme
Moderate Low Moderate Moderate Moderate High
Minor Low Low Low Moderate Moderate
Insignificant Low Low Low Low Low
GHD | Report for Australian Industrial Energy - Port Kembla Gas Terminal, 2127477 | 5
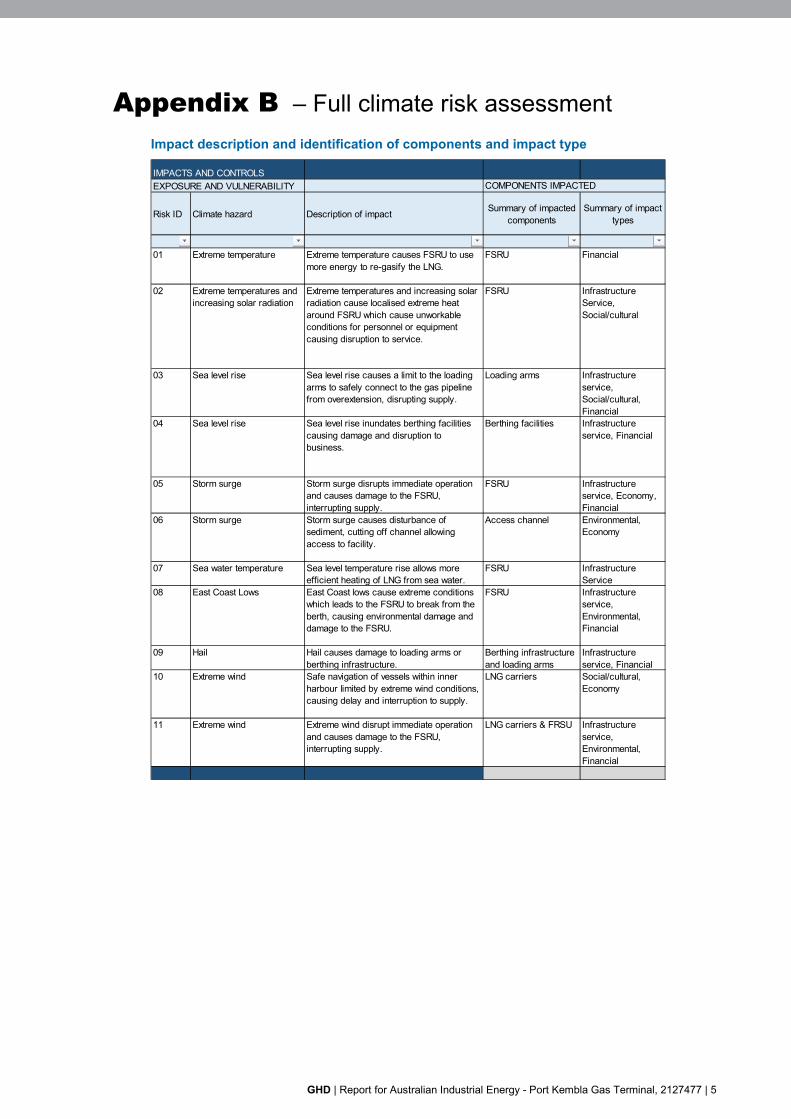
Appendix B – Full climate risk assessment Impact description and identification of components and impact type
IMPACTS AND CONTROLSEXPOSURE AND VULNERABILITY COMPONENTS IMPACTED
Risk ID Climate hazard Description of impact Summary of impacted components
Summary of impact types
01 Extreme temperature Extreme temperature causes FSRU to use more energy to re-gasify the LNG.
FSRU Financial
02 Extreme temperatures and increasing solar radiation
Extreme temperatures and increasing solar radiation cause localised extreme heat around FSRU which cause unworkable conditions for personnel or equipment causing disruption to service.
FSRU Infrastructure Service, Social/cultural
03 Sea level rise Sea level rise causes a limit to the loading arms to safely connect to the gas pipeline from overextension, disrupting supply.
Loading arms Infrastructure service, Social/cultural, Financial
04 Sea level rise Sea level rise inundates berthing facilities causing damage and disruption to business.
Berthing facilities Infrastructure service, Financial
05 Storm surge Storm surge disrupts immediate operation and causes damage to the FSRU, interrupting supply.
FSRU Infrastructure service, Economy, Financial
06 Storm surge Storm surge causes disturbance of sediment, cutting off channel allowing access to facility.
Access channel Environmental, Economy
07 Sea water temperature Sea level temperature rise allows more efficient heating of LNG from sea water.
FSRU Infrastructure Service
08 East Coast Lows East Coast lows cause extreme conditions which leads to the FSRU to break from the berth, causing environmental damage and damage to the FSRU.
FSRU Infrastructure service, Environmental, Financial
09 Hail Hail causes damage to loading arms or berthing infrastructure.
Berthing infrastructure and loading arms
Infrastructure service, Financial
10 Extreme wind Safe navigation of vessels within inner harbour limited by extreme wind conditions, causing delay and interruption to supply.
LNG carriers Social/cultural, Economy
11 Extreme wind Extreme wind disrupt immediate operation and causes damage to the FSRU, interrupting supply.
LNG carriers & FRSU Infrastructure service, Environmental, Financial

6 | GHD | Report for Australian Industrial Energy - Port Kembla Gas Terminal, 2127477
Risk assessment for current climate, 2030 and 2050
RISK ASSESSMENT
2030 RCP 8.5 2050 RCP 8.5
Risk ID Likelihood Consequence Risk Likelihood Consequence Risk Likelihood Consequence Risk
01Rare Insignificant Low Unlikely Insignificant Low Possible Insignificant Low
02
Rare Insignificant Low Rare Insignificant Low Rare Insignificant Low
03
Rare Moderate Low Unlikely Moderate Moderate Possible Moderate Moderate
04
Rare Minor Low Almost certain Minor Moderate Almost certain Minor Moderate
05Rare Moderate Low Rare Moderate Low Rare Moderate Low
06
Unlikely Minor Low Possible Minor Low Possible Minor Low
07 Rare Minor Low Rare Insignificant Low Rare Insignificant Low
08
Rare Moderate Low Possible Moderate Moderate Possible Moderate Moderate
09 Likely Insignificant Low Likely Insignificant Low Likely Insignificant Low
10
Likely Minor Moderate Likely Minor Moderate Likely Minor Moderate
11
Likely Moderate Moderate Likely Moderate Moderate Likely Moderate Moderate
CURRENT CLIMATE

GHD | Report for Australian Industrial Energy - Port Kembla Gas Terminal, 2127477 | 7
Residual risk assessment
2030 RCP 8.5 2050 RCP 8.5
Risk ID Likelihood Consequence Risk Likelihood Consequence Risk
01 Unlikely Insignificant Low Possible Insignificant Low
02
Rare Insignificant Low Rare Insignificant Low
03
Rare Moderate Low Unlikely Moderate Moderate
04Possible Insignificant Low Possible Insignificant Low
05Rare Moderate Low Rare Moderate Low
06Possible Minor Low Possible Minor Low
07 Rare Insignificant Low Rare Insignificant Low
08
Unlikely Moderate Moderate Unlikely Moderate Moderate
09 Likely Insignificant Low Likely Insignificant Low
10
Likely Minor Moderate Likely Minor Moderate
11
Likely Minor Moderate Likely Minor Moderate
RESIDUAL RISK RATING (Post-adaptation)

GHD
Level 13 133 Castlereagh Street Sydney NSW 2000 T: 61 2 9239 7100 E: [email protected]
© GHD 2018
This document is and shall remain the property of GHD. The document may only be used for the purpose for which it was commissioned and in accordance with the Terms of Engagement for the commission. Unauthorised use of this document in any form whatsoever is prohibited. 2127477-6870/https://projects.ghd.com/oc/Sydney1/eastcoastlngterminal/Delivery/Documents/2127477_REP_Climate change risk assessment.docx

www.ghd.com