Climate and Weather Projects at the NWCC to Support USDA-NRCS Activities n Climate Mapping n Time...
72
Climate and Weather Climate and Weather Projects at the NWCC Projects at the NWCC to Support to Support USDA-NRCS Activities USDA-NRCS Activities Climate Mapping Climate Mapping Time Series Development Time Series Development – Weather Generator Research (GEM) Weather Generator Research (GEM) – Serially Complete Dataset Serially Complete Dataset Snow Climate Monitoring & Analysis Snow Climate Monitoring & Analysis Soil Climate Monitoring & Analysis Soil Climate Monitoring & Analysis Internet Technologies for Climate Internet Technologies for Climate Delivery Delivery
-
Upload
jasper-rice -
Category
Documents
-
view
213 -
download
0
Transcript of Climate and Weather Projects at the NWCC to Support USDA-NRCS Activities n Climate Mapping n Time...
Climate and Weather Projects at Climate and Weather Projects at the NWCC to Support the NWCC to Support
USDA-NRCS ActivitiesUSDA-NRCS Activities Climate MappingClimate Mapping Time Series DevelopmentTime Series Development
– Weather Generator Research (GEM)Weather Generator Research (GEM)– Serially Complete DatasetSerially Complete Dataset
Snow Climate Monitoring & AnalysisSnow Climate Monitoring & Analysis Soil Climate Monitoring & AnalysisSoil Climate Monitoring & Analysis Internet Technologies for Climate DeliveryInternet Technologies for Climate Delivery
Climate MappingClimate Mapping
Collaborative effort between NRCS Collaborative effort between NRCS National Water and Climate Center National Water and Climate Center (NWCC) and the Spatial Climate (NWCC) and the Spatial Climate Analysis Service (SCAS) at Oregon Analysis Service (SCAS) at Oregon State UniversityState University
Goal is to produce new maps and Goal is to produce new maps and digital GIS layers of climate elements digital GIS layers of climate elements needed by the NRCS and othersneeded by the NRCS and others
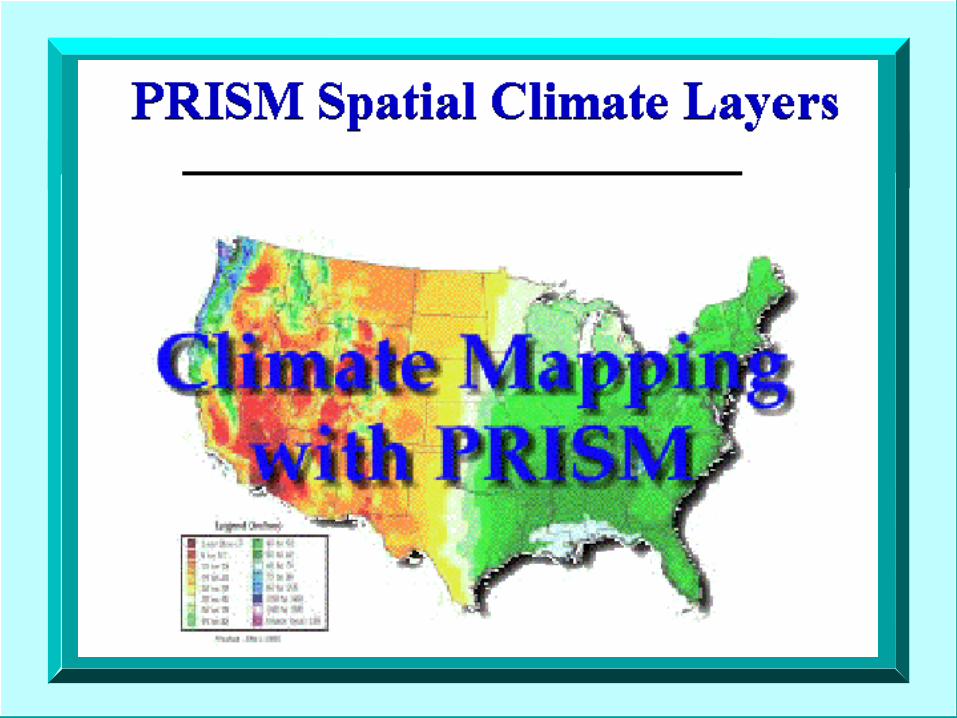
A Spatial Climate Modeling A Spatial Climate Modeling SystemSystem
PRISM (Parameter-elevation Regressions on PRISM (Parameter-elevation Regressions on Independent Slopes Model)Independent Slopes Model)
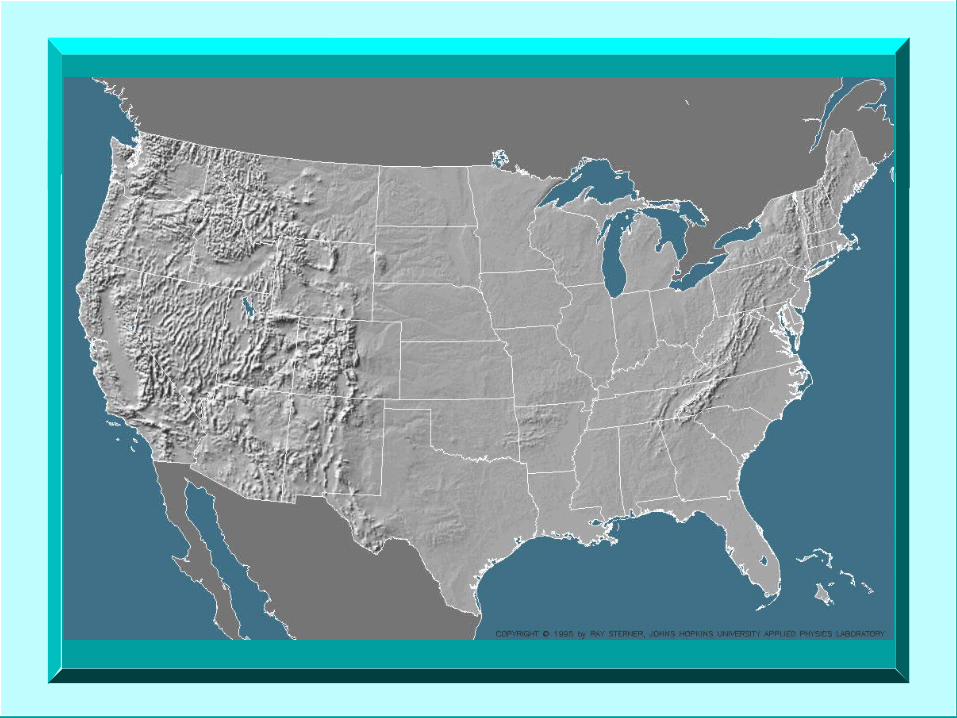
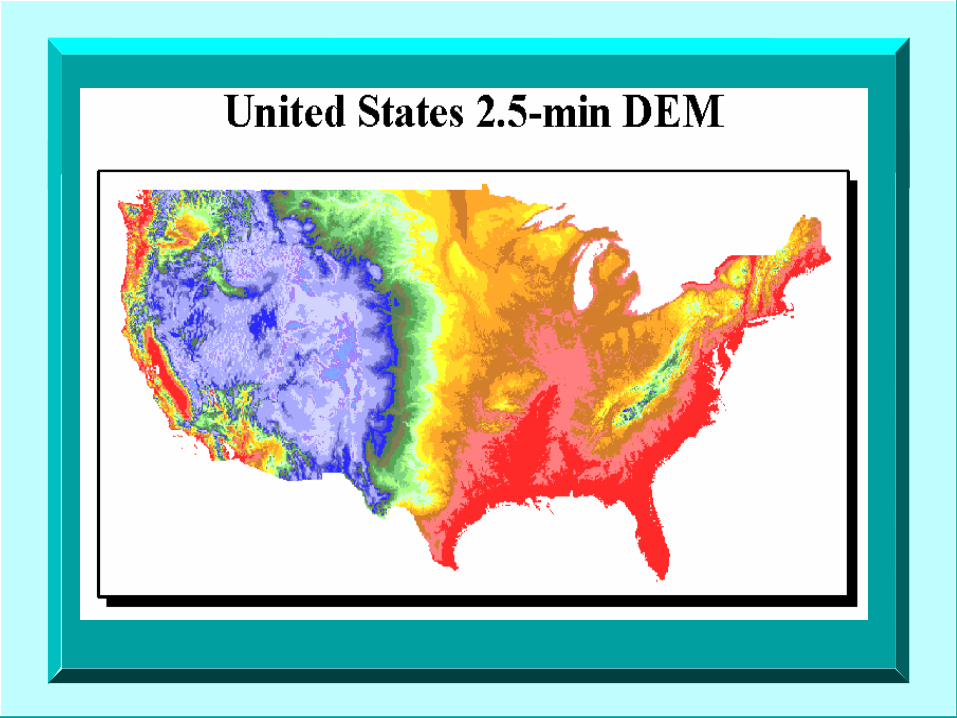
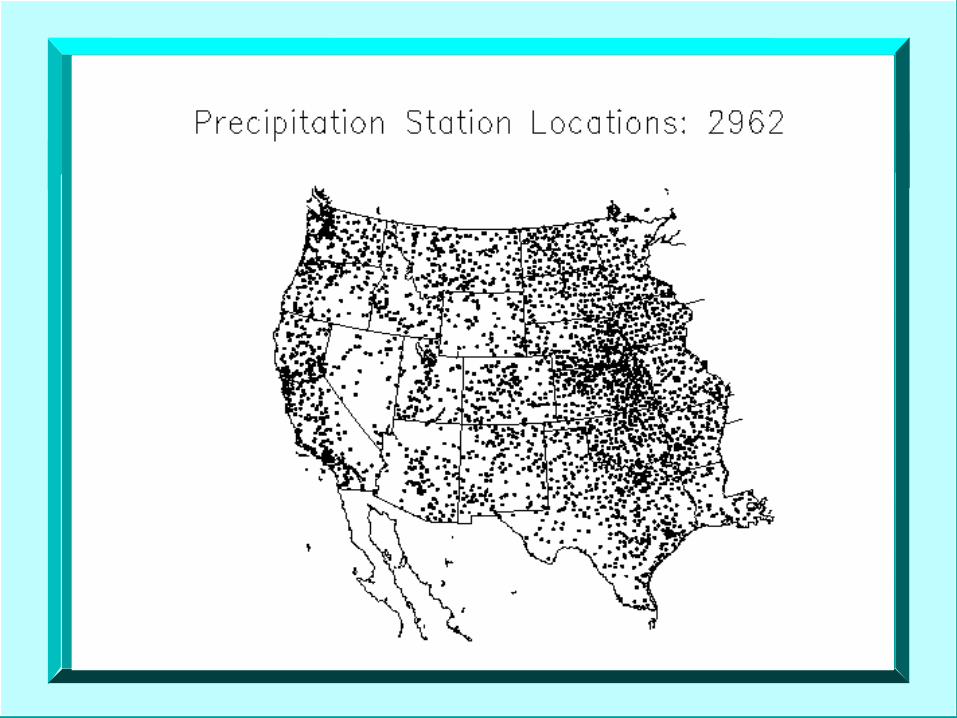
Statistical/Dynamical/Topographic approachStatistical/Dynamical/Topographic approach Uses point data, a DEM and a coordinated set Uses point data, a DEM and a coordinated set
of rules, decisions and calculations, designed to of rules, decisions and calculations, designed to mimic an “expert” climatologistmimic an “expert” climatologist
For good reference see PRISM Guide Book For good reference see PRISM Guide Book under Technical Papers at the OSU PRISM under Technical Papers at the OSU PRISM web siteweb site
PRISMPRISM Originally developed for precipitation only, Originally developed for precipitation only,
now expanded to temperature, dewpoint, now expanded to temperature, dewpoint, solar radiation and many derived variables solar radiation and many derived variables such as HDD’s/CDD’s, GDD’s, frost dates, such as HDD’s/CDD’s, GDD’s, frost dates, snowfall, snow water equivalent, etc.snowfall, snow water equivalent, etc.
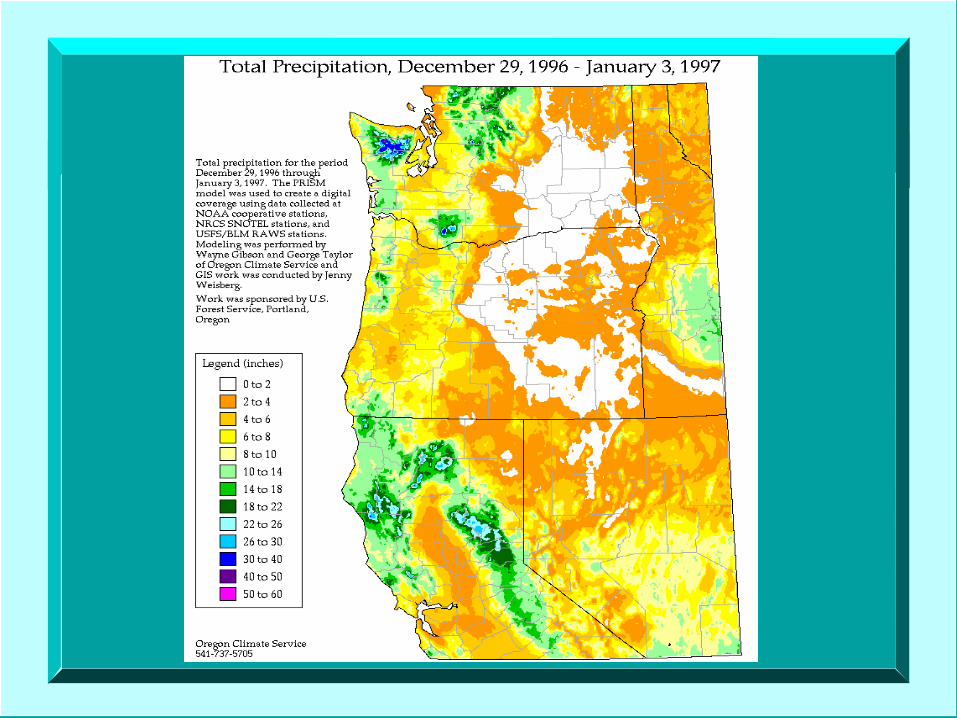
Most commonly applied in monthly or Most commonly applied in monthly or annual time increments, but also applied to annual time increments, but also applied to eventsevents
PRISM Model from OSU’sPRISM Model from OSU’sSpatial Climate Analysis ServiceSpatial Climate Analysis Service
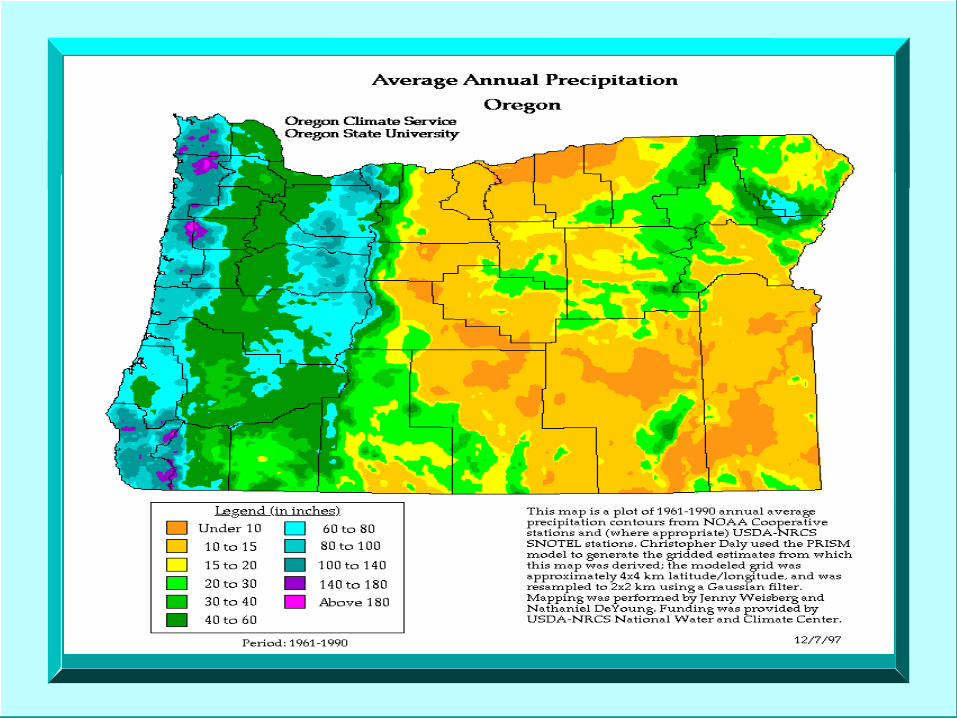
Funded primarily by the NRCS-NWCC since Funded primarily by the NRCS-NWCC since 1993 for development of spatial climate 1993 for development of spatial climate products for the U.S.products for the U.S.
4 km horizontal resolution raster data, and 4 km horizontal resolution raster data, and ARC polygon coverages both availableARC polygon coverages both available
Most commonly applied in monthly or annual Most commonly applied in monthly or annual time increments, but also applied to eventstime increments, but also applied to events
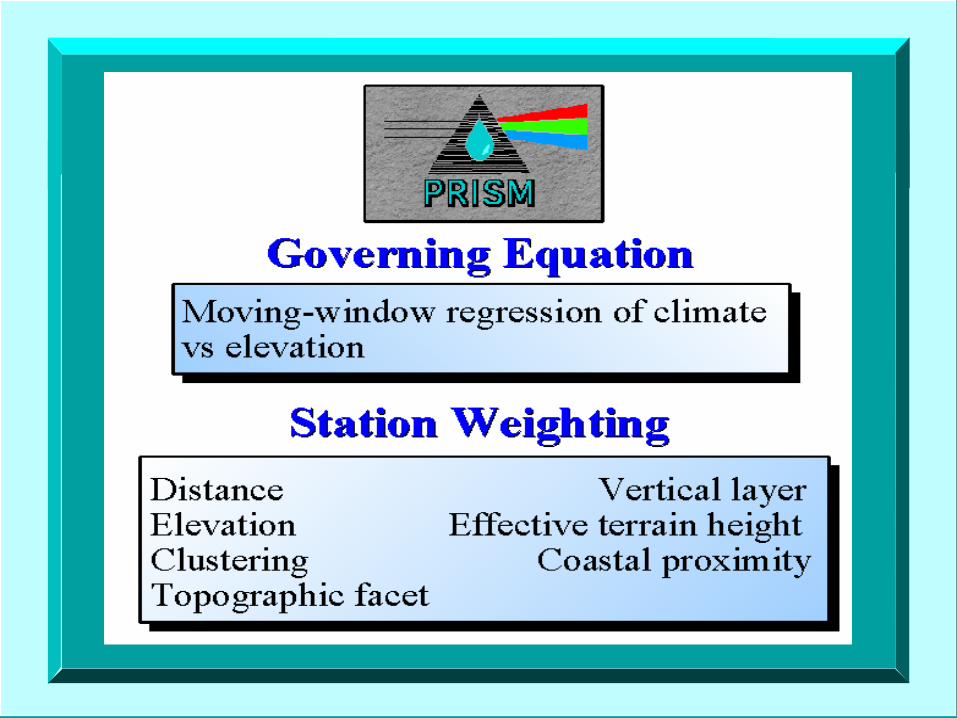
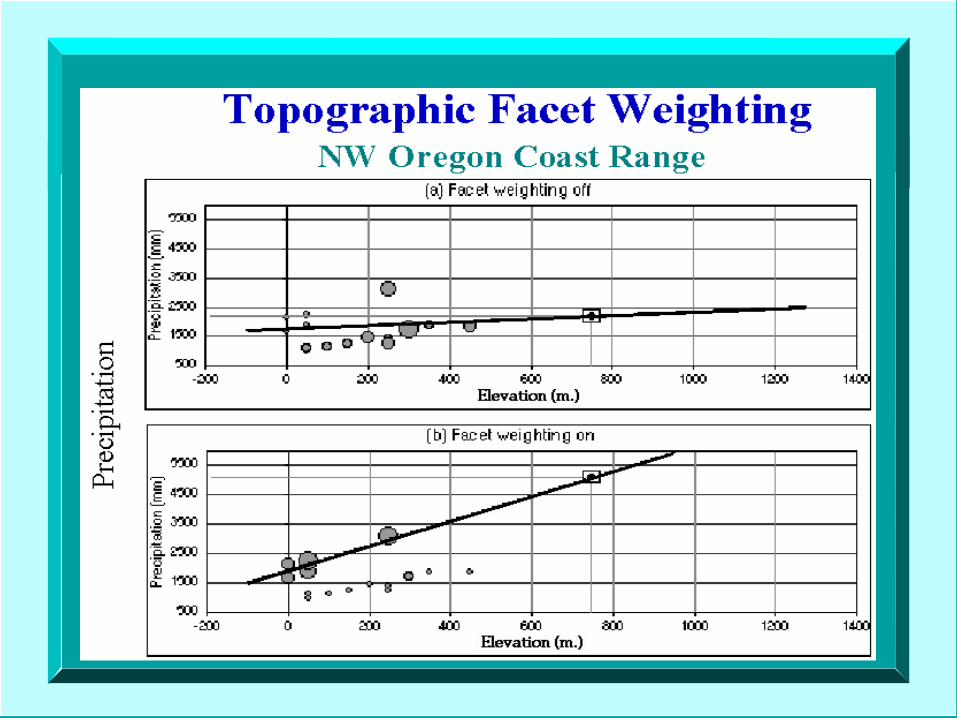
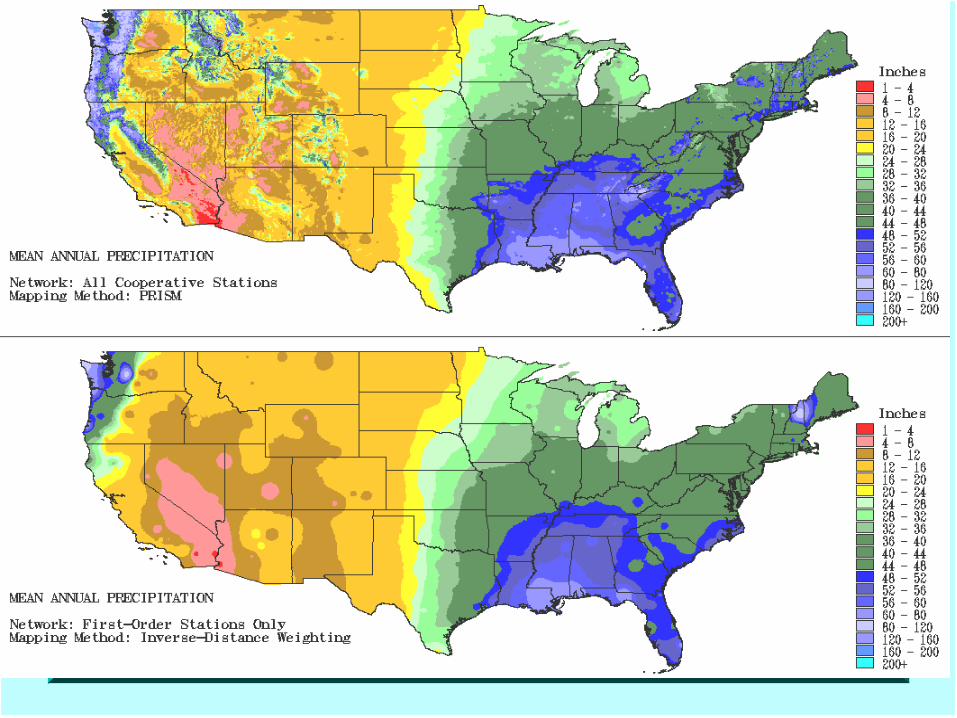
PRISMPRISM Any given grid cell value is determined Any given grid cell value is determined
by a linear regression of station values by a linear regression of station values against elevationagainst elevation
Stations assigned weightsStations assigned weights Combined weight of a station is a Combined weight of a station is a
function of many factorsfunction of many factors
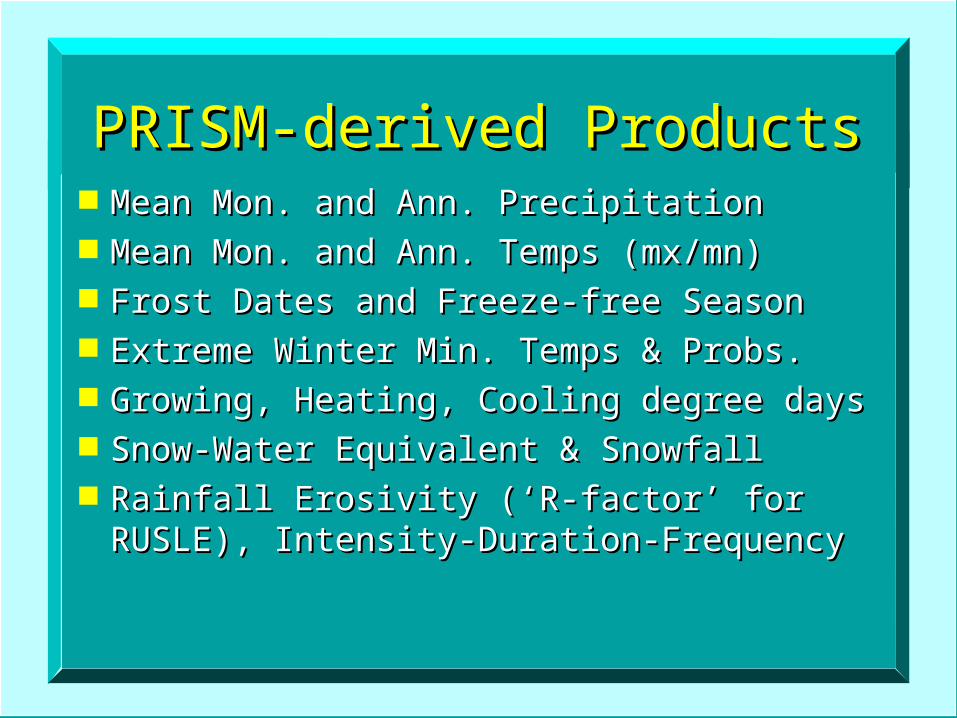
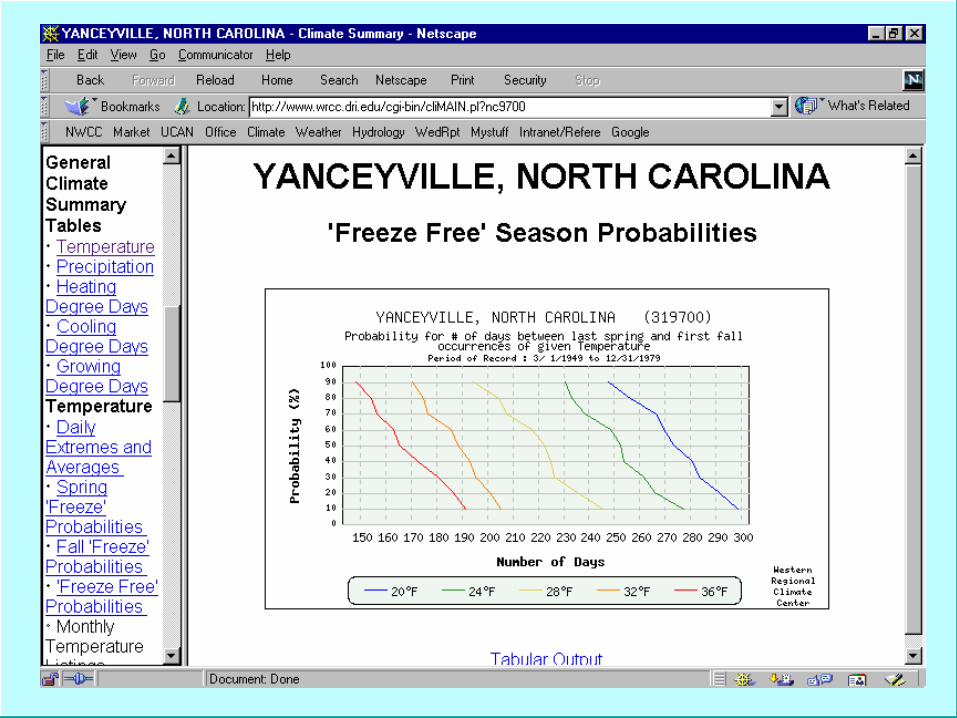
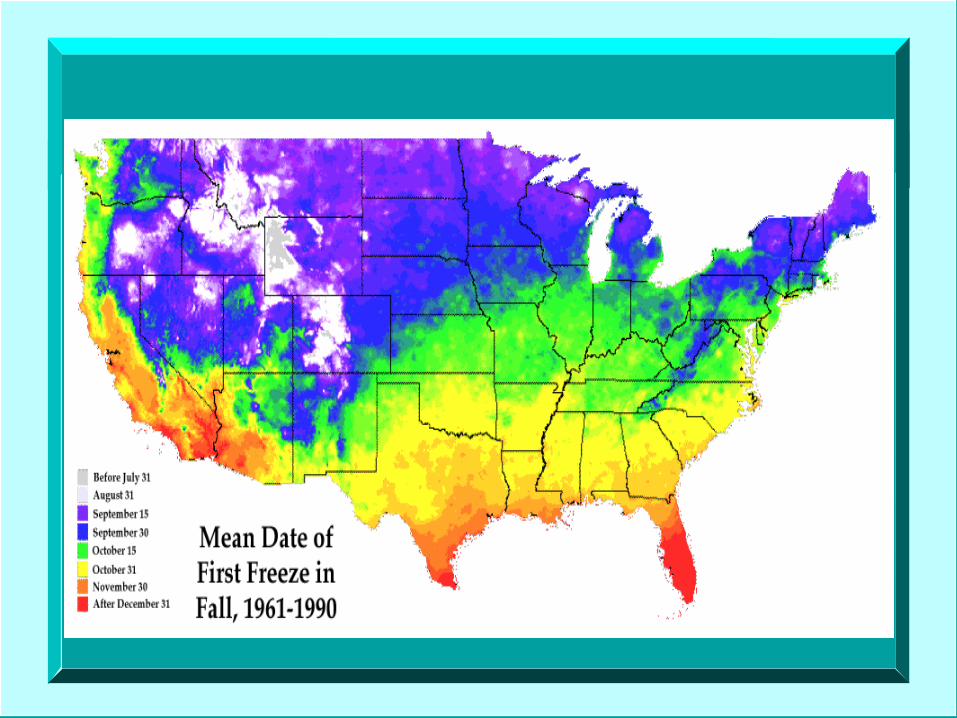
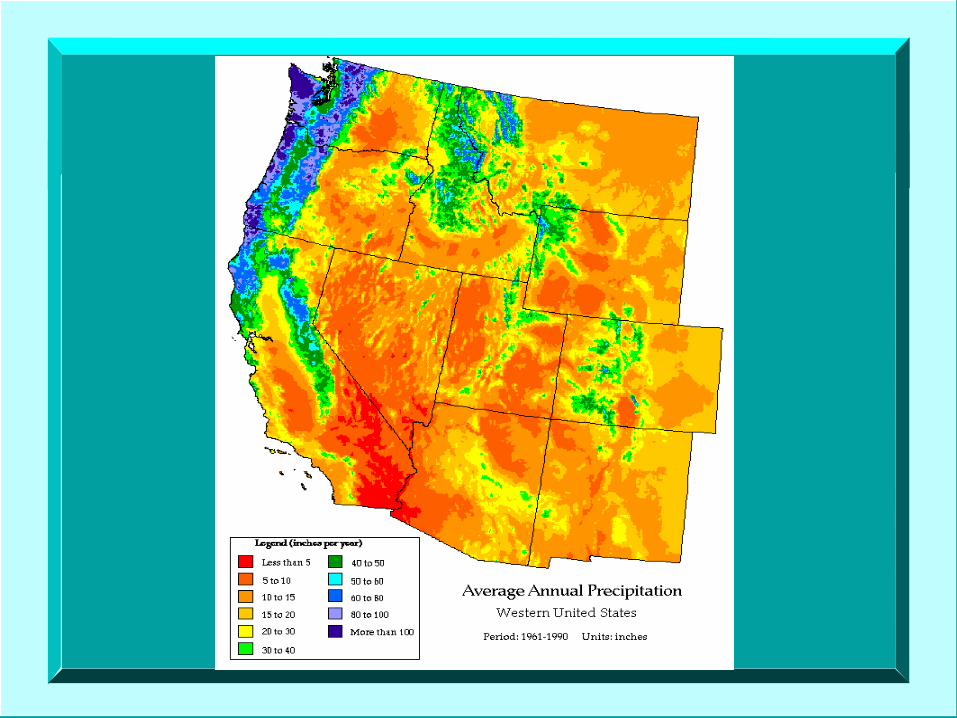
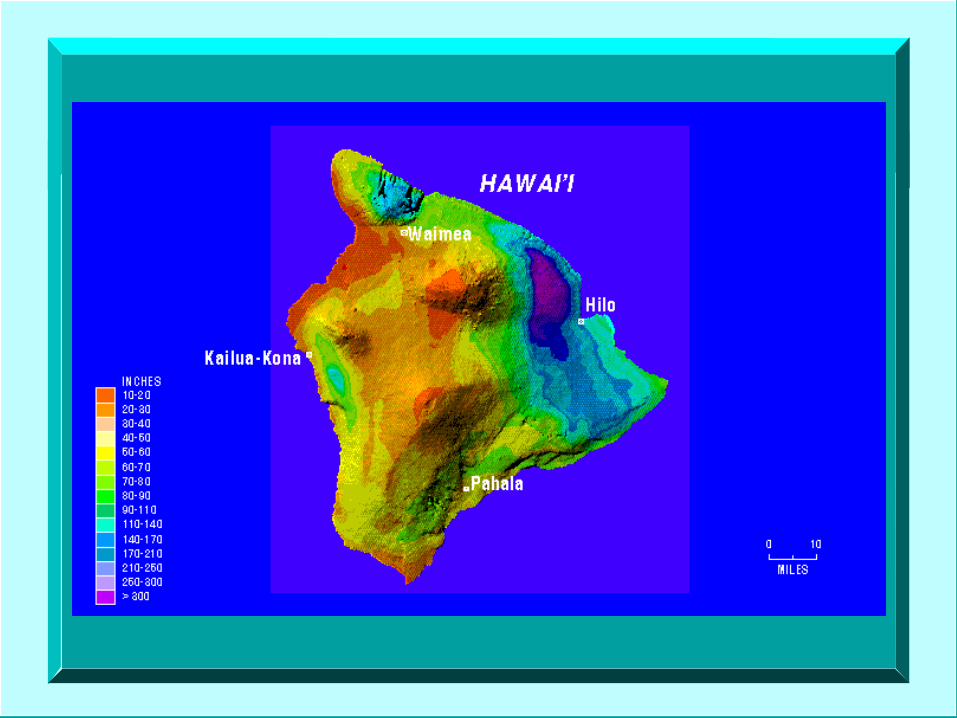
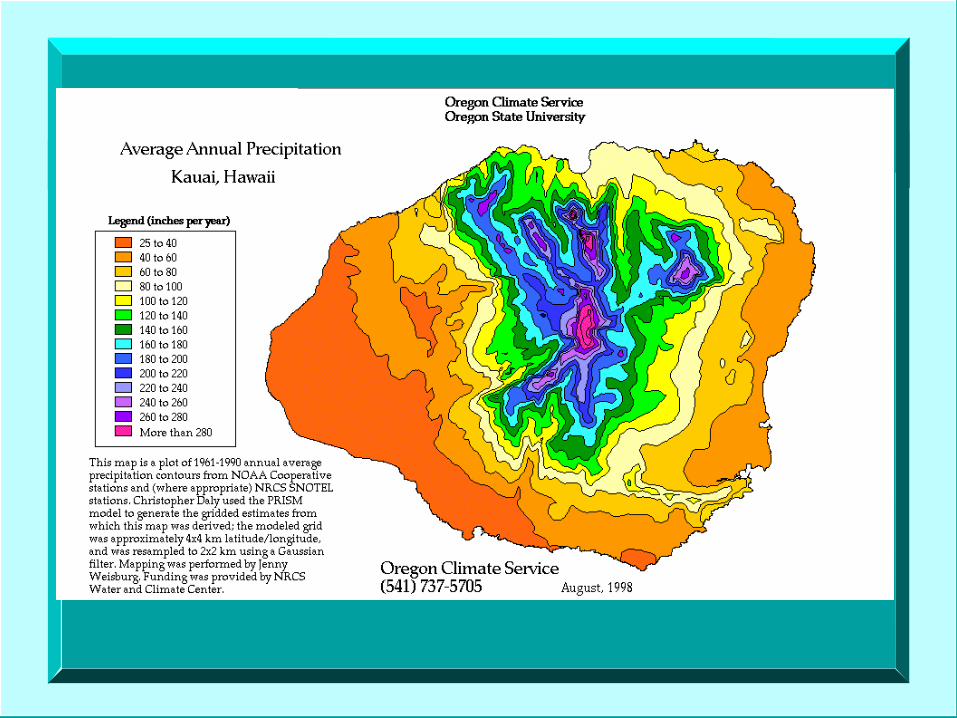
PRISM-derived ProductsPRISM-derived Products Mean Mon. and Ann. PrecipitationMean Mon. and Ann. Precipitation Mean Mon. and Ann. Temps (mx/mn)Mean Mon. and Ann. Temps (mx/mn) Frost Dates and Freeze-free SeasonFrost Dates and Freeze-free Season Extreme Winter Min. Temps & Probs.Extreme Winter Min. Temps & Probs. Growing, Heating, Cooling degree daysGrowing, Heating, Cooling degree days Snow-Water Equivalent & SnowfallSnow-Water Equivalent & Snowfall Rainfall Erosivity (‘R-factor’ for RUSLE), Rainfall Erosivity (‘R-factor’ for RUSLE),
Intensity-Duration-FrequencyIntensity-Duration-Frequency
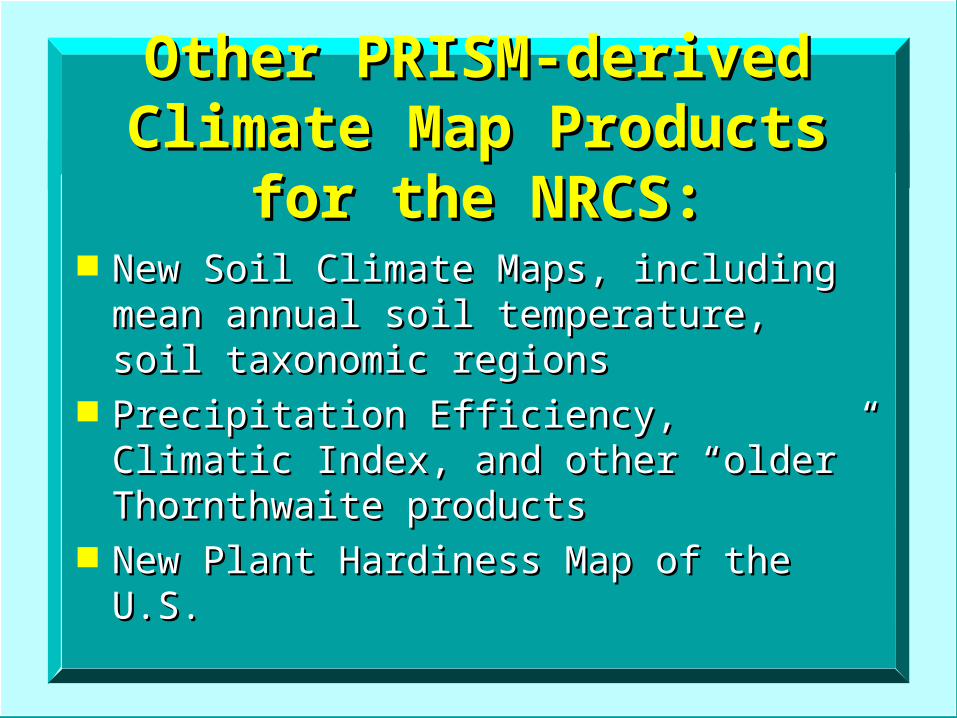
Other PRISM-derived Climate Other PRISM-derived Climate Map Products for the NRCS:Map Products for the NRCS:
New Soil Climate Maps, including mean New Soil Climate Maps, including mean annual soil temperature, soil taxonomic annual soil temperature, soil taxonomic regionsregions
Precipitation Efficiency, Climatic Index, Precipitation Efficiency, Climatic Index, and other “older” Thornthwaite productsand other “older” Thornthwaite products
New Plant Hardiness Map of the U.S.New Plant Hardiness Map of the U.S.
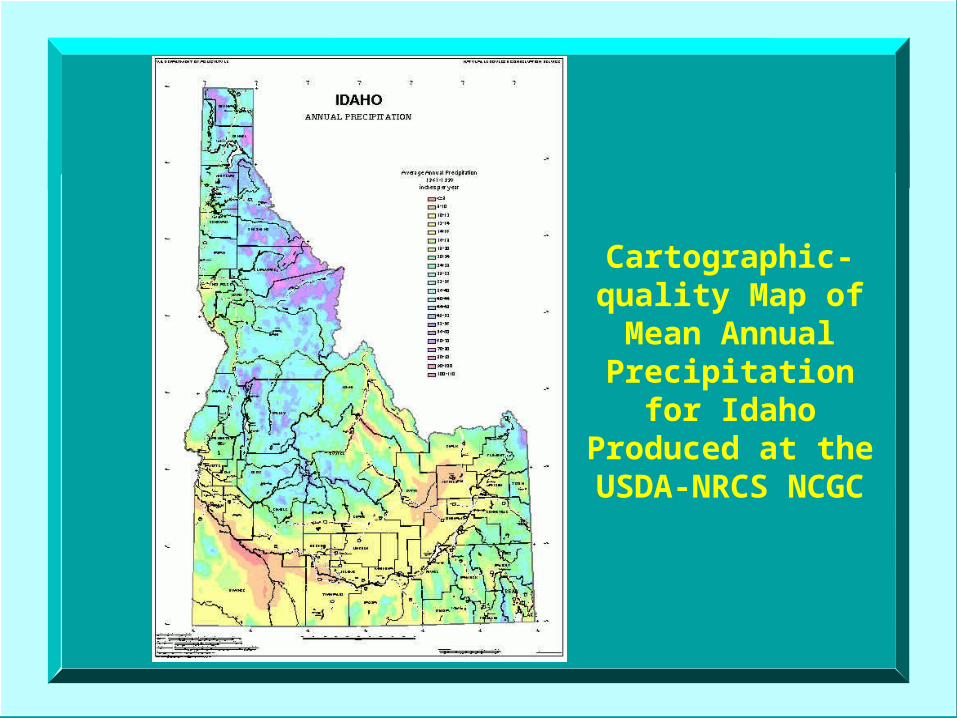
Cartographic-quality Map of Mean Annual
Precipitation for Idaho Produced at the USDA-NRCS NCGC
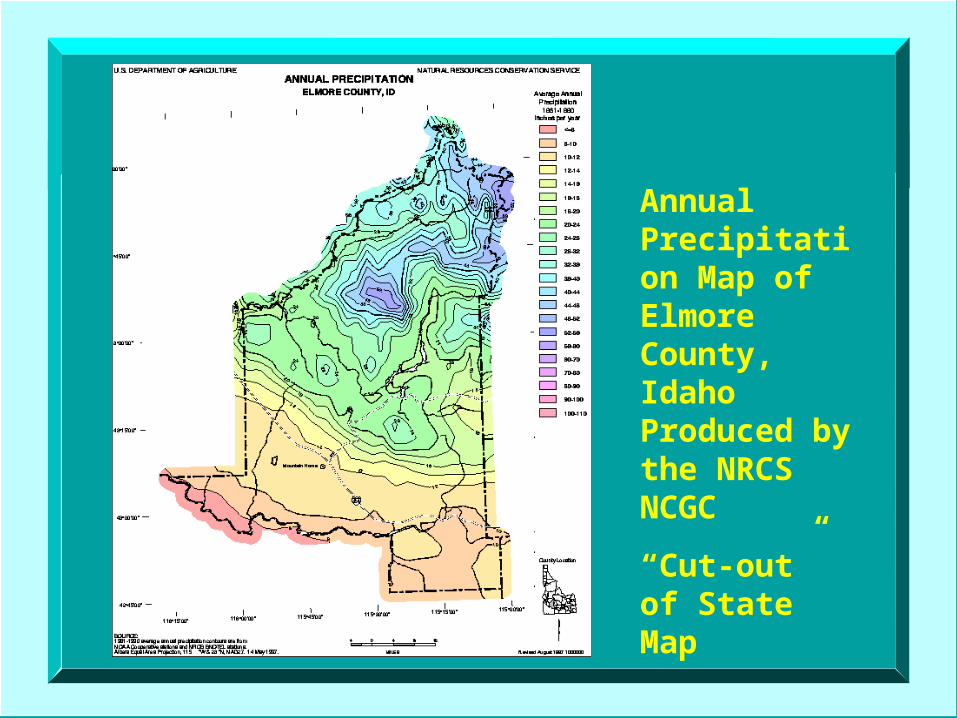
Annual Precipitation Map of Elmore County, Idaho Produced by the NRCS NCGC
“Cut-out” of State Map
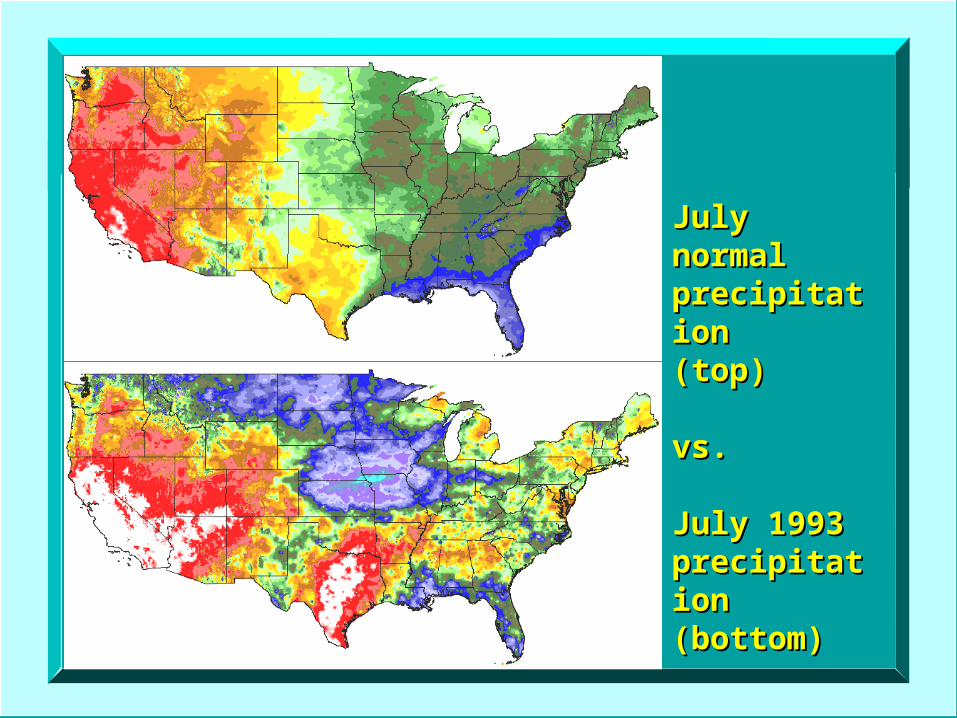
July normal July normal precipitationprecipitation(top) (top)
vs.vs. July 1993 July 1993 precipitation precipitation (bottom)(bottom)
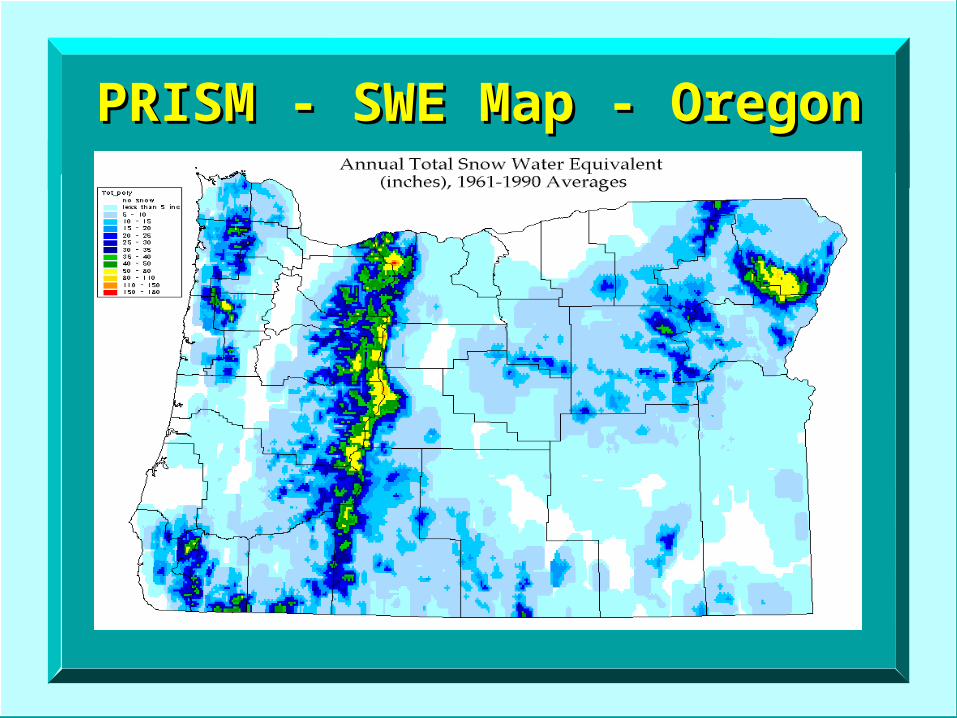
PRISM - SWE Map - OregonPRISM - SWE Map - Oregon
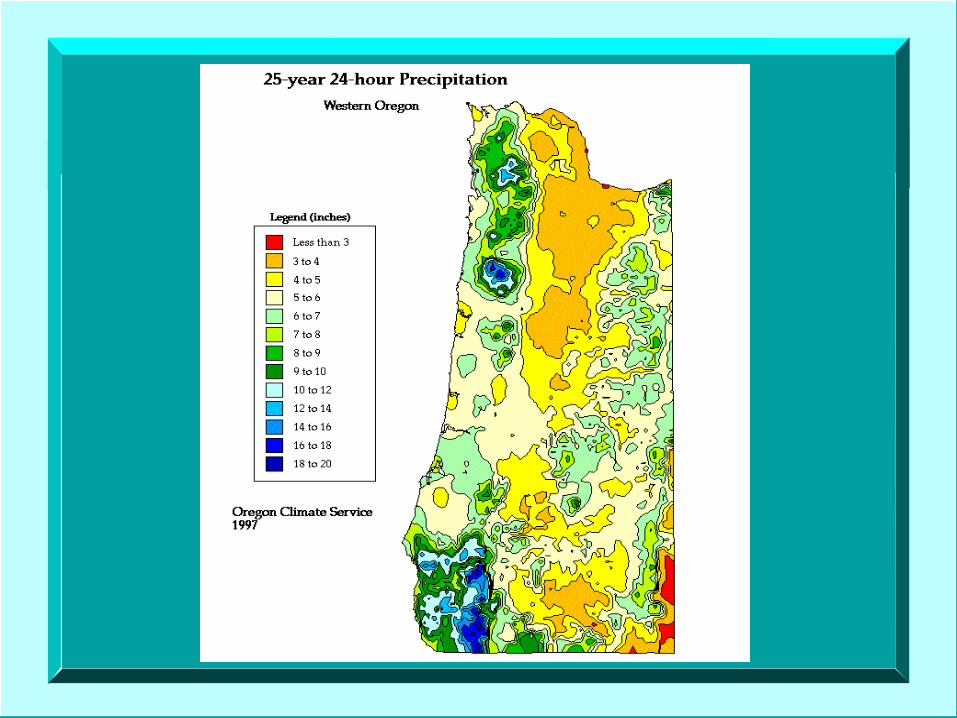
New Precipitation Frequency New Precipitation Frequency Maps Needed in the NRCSMaps Needed in the NRCS
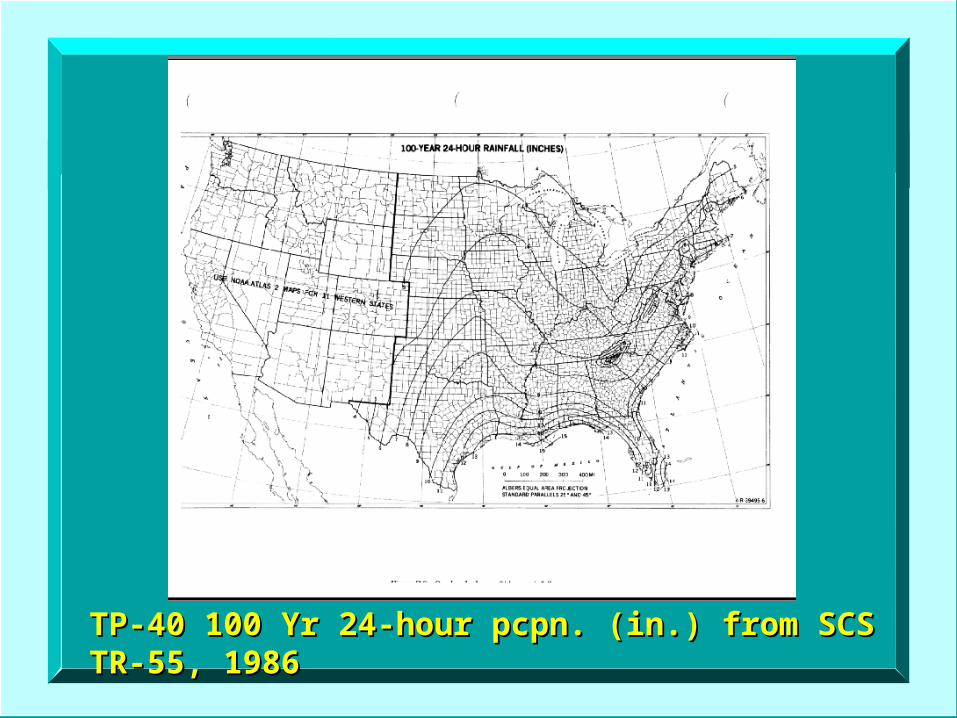
TP-40 100 Yr 24-hour pcpn. (in.) from SCS TP-40 100 Yr 24-hour pcpn. (in.) from SCS TR-55, 1986TR-55, 1986
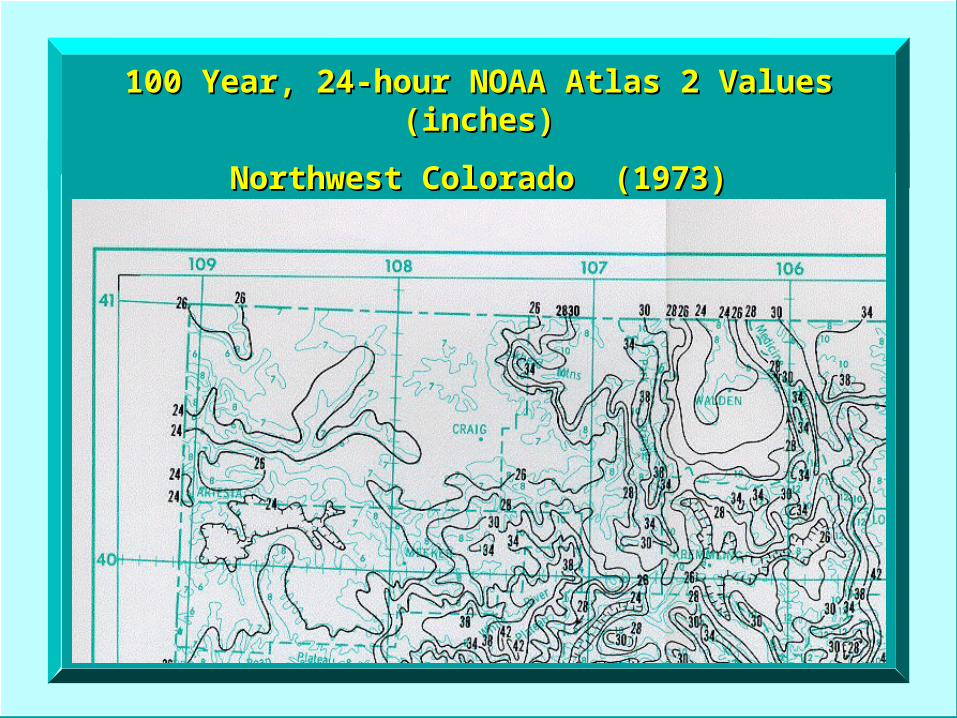
100 Year, 24-hour NOAA Atlas 2 Values (inches)100 Year, 24-hour NOAA Atlas 2 Values (inches)
Northwest Colorado (1973)Northwest Colorado (1973)
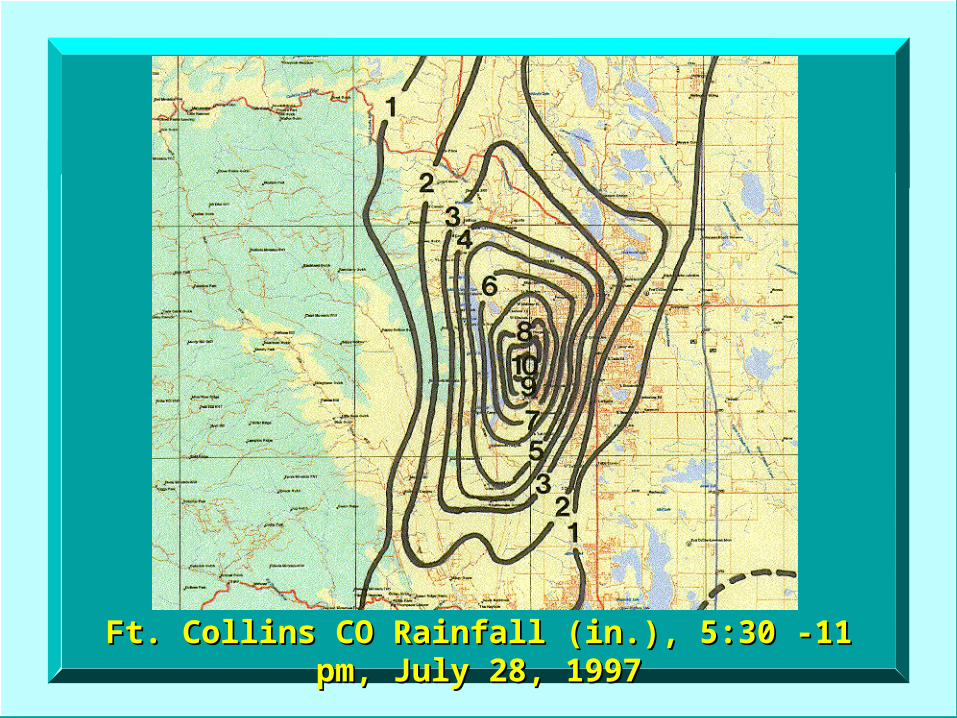
Ft. Collins CO Rainfall (in.), 5:30 -11 pm, July 28, 1997Ft. Collins CO Rainfall (in.), 5:30 -11 pm, July 28, 1997
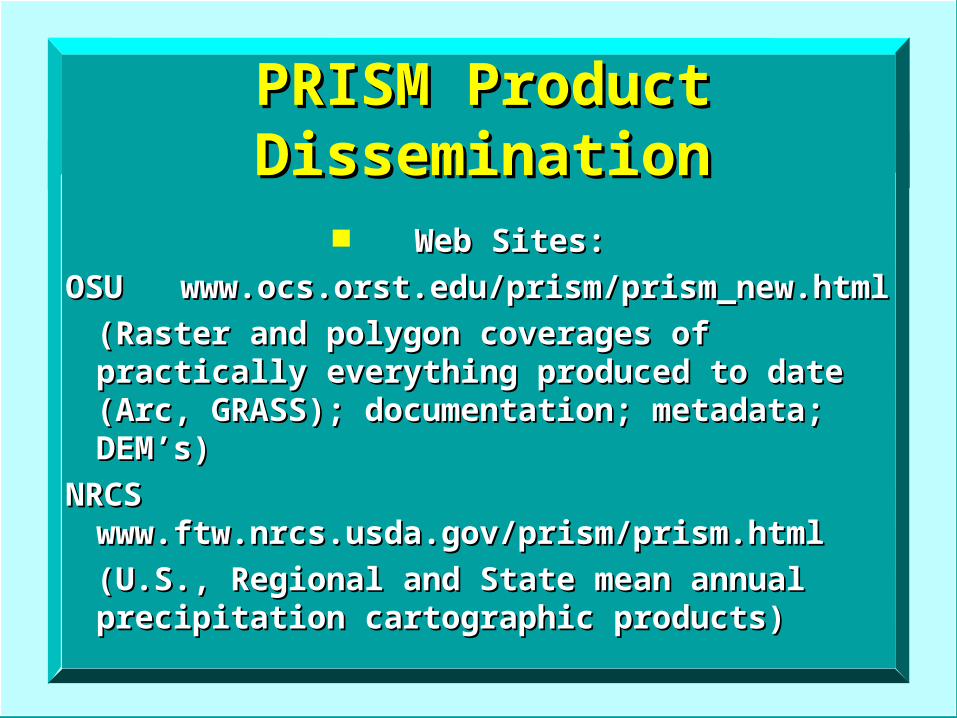
PRISM Product PRISM Product DisseminationDissemination
Web Sites:Web Sites:
OSU www.ocs.orst.edu/prism/prism_new.htmlOSU www.ocs.orst.edu/prism/prism_new.html
(Raster and polygon coverages of practically (Raster and polygon coverages of practically everything produced to date (Arc, GRASS); everything produced to date (Arc, GRASS); documentation; metadata; DEM’s)documentation; metadata; DEM’s)
NRCS NRCS www.ftw.nrcs.usda.gov/prism/prism.htmlwww.ftw.nrcs.usda.gov/prism/prism.html
(U.S., Regional and State mean annual (U.S., Regional and State mean annual precipitation cartographic products)precipitation cartographic products)
http://www.ftw.nrcs.usda.gov/prism/prism.html:http://www.ftw.nrcs.usda.gov/prism/prism.html:
Cartographic state mean annual precipitation mapsCartographic state mean annual precipitation maps Full repository of “official” NRCS PRISM layersFull repository of “official” NRCS PRISM layers
PRISM Product PRISM Product DisseminationDissemination
Compact Discs:Compact Discs:
All precipitation layers for all of the All precipitation layers for all of the U.S. 3 CD’s (East, Central, U.S. 3 CD’s (East, Central, West) of the lower 48 states. West) of the lower 48 states. Includes Arc Explorer viewing Includes Arc Explorer viewing software, and all documentation.software, and all documentation.
Available from the NRCS-NCGC:Available from the NRCS-NCGC:
800-672-5559800-672-5559
PRISM Product PRISM Product DisseminationDissemination
Hardcopy maps:Hardcopy maps:
Cartographic-quality, walls-size maps Cartographic-quality, walls-size maps of mean annual precipitation for of mean annual precipitation for each stateeach state
Available from the NRCS Climate Available from the NRCS Climate Data Liaison in each stateData Liaison in each state
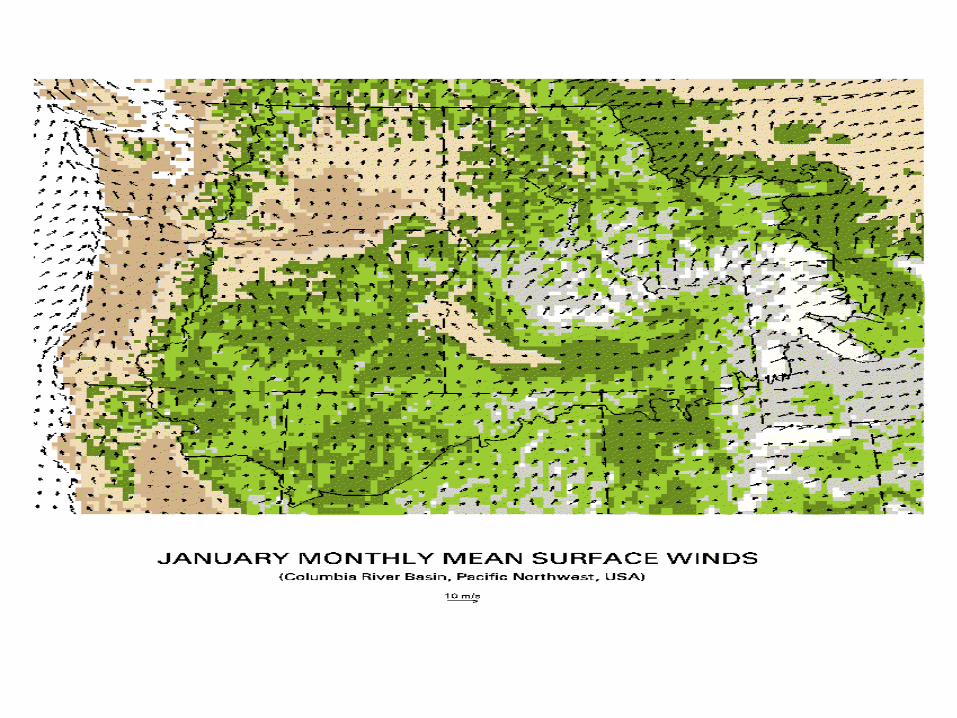
Wind Mapping to Support Wind Mapping to Support NRCS Air Quality ProgramNRCS Air Quality Program
Need high resolution mean and Need high resolution mean and event wind speeds and directions event wind speeds and directions for whole U.S.for whole U.S.
Atmospheric model needed for Atmospheric model needed for this: Sue Ferguson at USFS this: Sue Ferguson at USFS Research SeattleResearch Seattle
Mean monthly winds of U.S. at 5 Mean monthly winds of U.S. at 5 km resolution now nearly km resolution now nearly completecomplete
Time Series Development:Time Series Development:Weather Generator ResearchWeather Generator Research
and Integrationand Integration
Ultimate Question:Ultimate Question:What is really needed?What is really needed?
(for applications needing point-serial data)(for applications needing point-serial data)
A continuous time series of weather data of A continuous time series of weather data of sufficient length to make reasonable assessments sufficient length to make reasonable assessments for planning decisions, of sufficient temporal for planning decisions, of sufficient temporal resolution to match the time step in process resolution to match the time step in process models, and of sufficient spatial resolution and models, and of sufficient spatial resolution and accuracy to have confidence in its application in accuracy to have confidence in its application in any location in the U.S.any location in the U.S.
What are our choices?What are our choices?
Observed dataObserved data
-or--or-
Model-generated dataModel-generated data
Observed data: Point, “truth”, missing values, Observed data: Point, “truth”, missing values, limited record, one realization, only 1 or 2 limited record, one realization, only 1 or 2 elements at many stationselements at many stations
Generated data: Point, only an approximation of the Generated data: Point, only an approximation of the “true” climate, serially-complete, easy to generate“true” climate, serially-complete, easy to generate
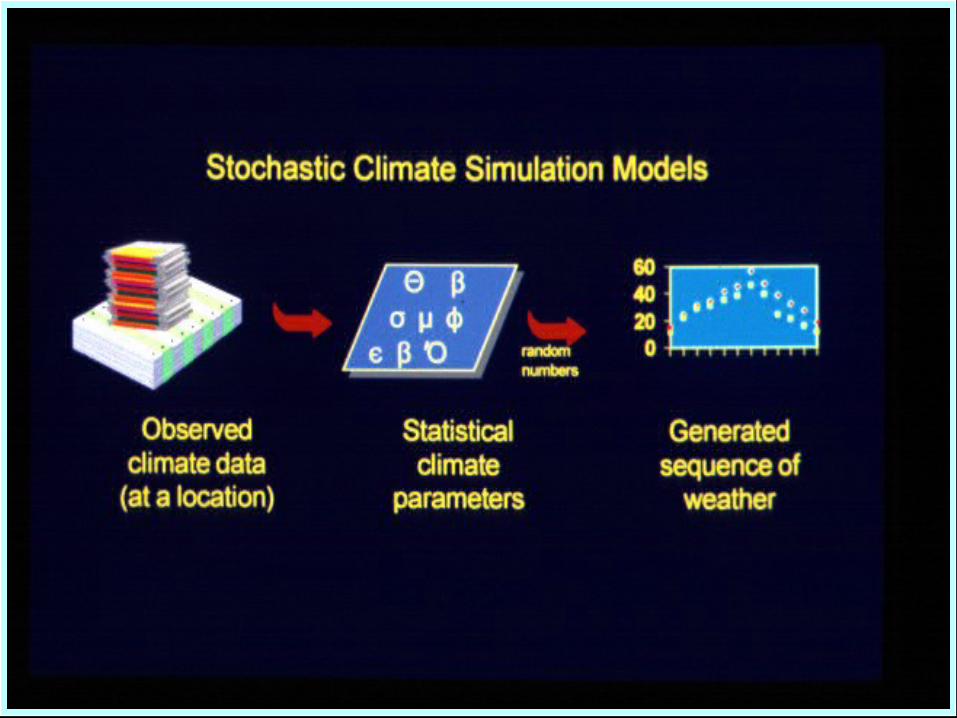
Why Stochastic Weather Why Stochastic Weather Generation Programs?Generation Programs?
Easily accessible, serially-complete data sets are Easily accessible, serially-complete data sets are producedproduced
Easily modified outputs to match other modeling Easily modified outputs to match other modeling requirementsrequirements
Weather/Climate scenarios for locations with Weather/Climate scenarios for locations with limited or no observed datalimited or no observed data
Ability to adjust model parameters for playing Ability to adjust model parameters for playing “What If ?” games; risk assessments“What If ?” games; risk assessments
ARS-NRCS WeatherARS-NRCS WeatherSimulation Team (WST)Simulation Team (WST)
Formed in response to need for updated, more Formed in response to need for updated, more dynamic weather simulation tooldynamic weather simulation tool
Comprised of 5-10 ARS and NRCS scientistsComprised of 5-10 ARS and NRCS scientists Major focus areas include storm generation Major focus areas include storm generation
(generating sub-daily time steps), GEM as a (generating sub-daily time steps), GEM as a predictive tool (linkage to large-scale forcings), predictive tool (linkage to large-scale forcings), generation of all needed weather elements, and generation of all needed weather elements, and spatial distribution of generator parametersspatial distribution of generator parameters
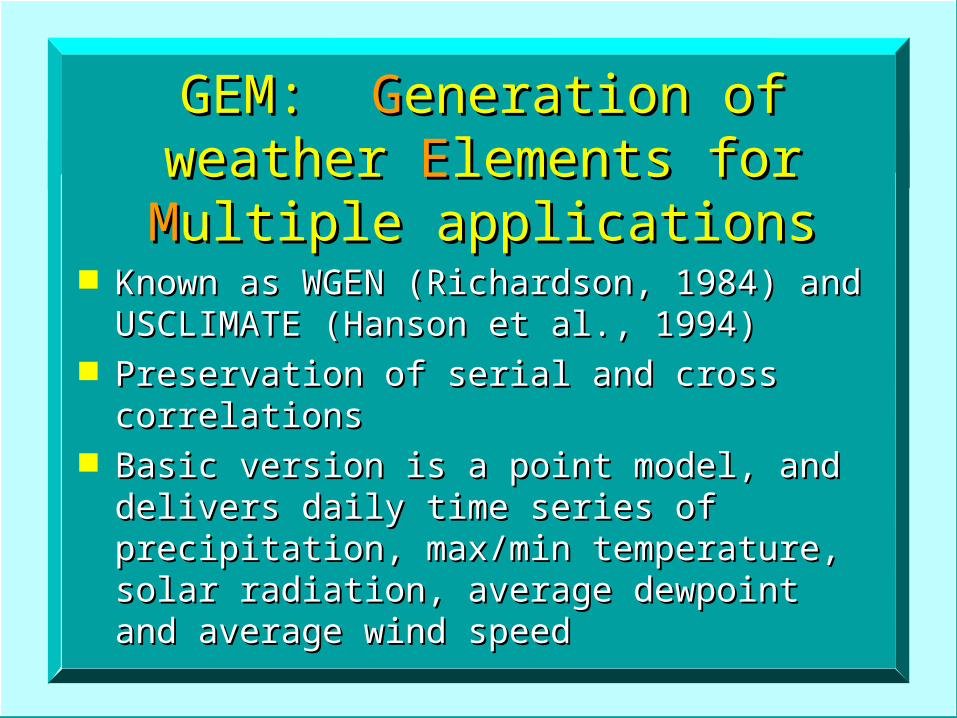
GEM: GEM: GGeneration of weather eneration of weather EElements for lements for MMultiple applicationsultiple applications
Known as WGEN (Richardson, 1984) and Known as WGEN (Richardson, 1984) and USCLIMATE (Hanson et al., 1994)USCLIMATE (Hanson et al., 1994)
Preservation of serial and cross correlationsPreservation of serial and cross correlations Basic version is a point model, and delivers daily Basic version is a point model, and delivers daily
time series of precipitation, max/min temperature, time series of precipitation, max/min temperature, solar radiation, average dewpoint and average solar radiation, average dewpoint and average wind speedwind speed
Distributing GEM Model Parameters Distributing GEM Model Parameters Using the PRISM (Parameter-elevation Using the PRISM (Parameter-elevation
Regressions on Independent Slopes Regressions on Independent Slopes Model) system at Oregon State UniversityModel) system at Oregon State University
Goal:Goal:To generate accurate climatic time series at To generate accurate climatic time series at
any point in the U.S., regardless of the any point in the U.S., regardless of the availability of historical climate information, availability of historical climate information,
for input to models, scenario development, and for input to models, scenario development, and many other usesmany other uses
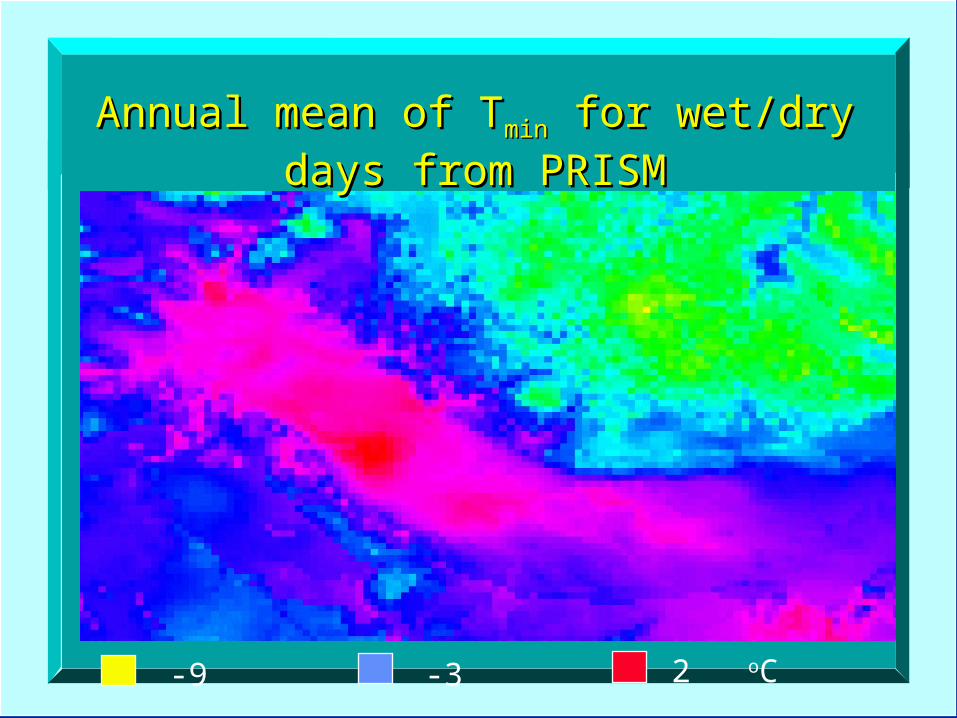
Annual mean of TAnnual mean of Tminmin for wet/dry days from for wet/dry days from
PRISMPRISM
-9 -3 2 oC
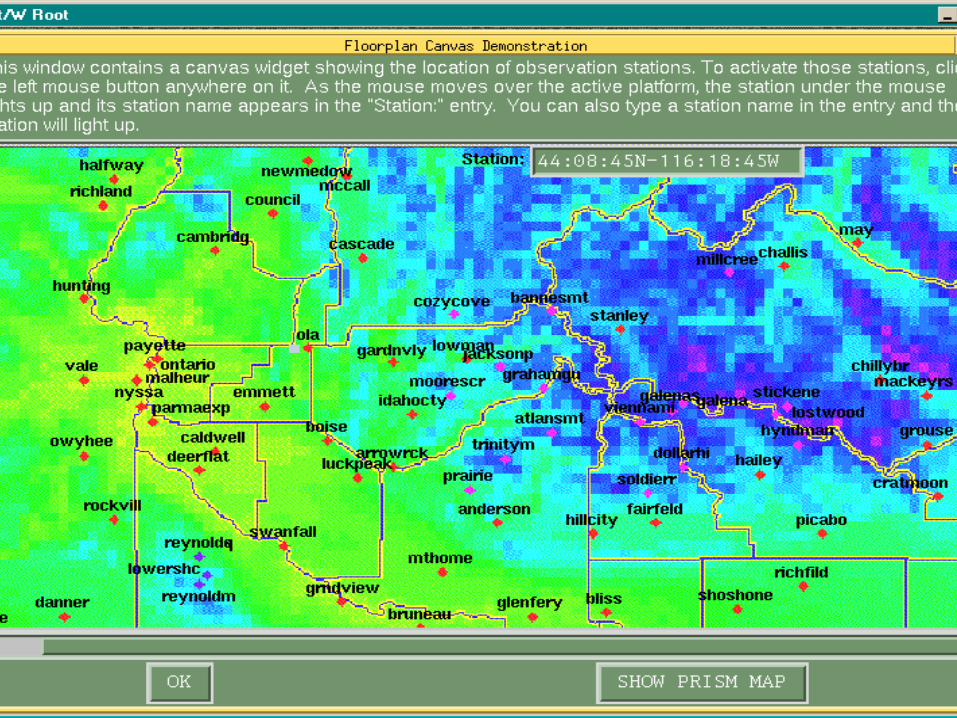
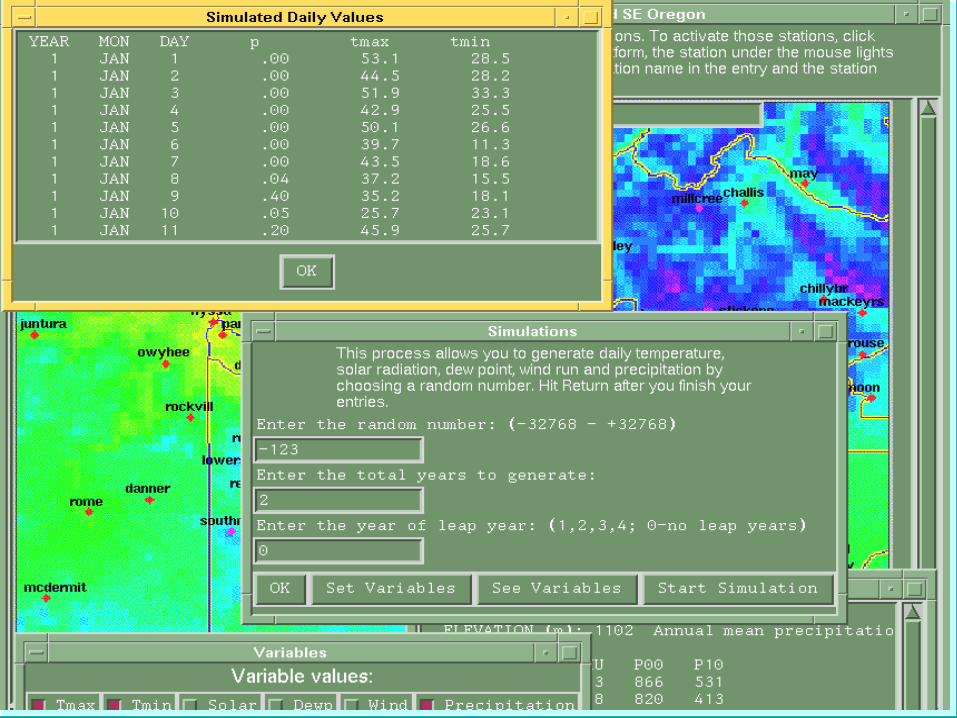
Time Series Development:Time Series Development:Serially Complete Dataset Serially Complete Dataset
ProjectProject
To produce accurate historical To produce accurate historical climate time series, with no climate time series, with no missing records, from NOAA missing records, from NOAA climate stations nationwide climate stations nationwide
(precipitation and (precipitation and temperature)temperature)
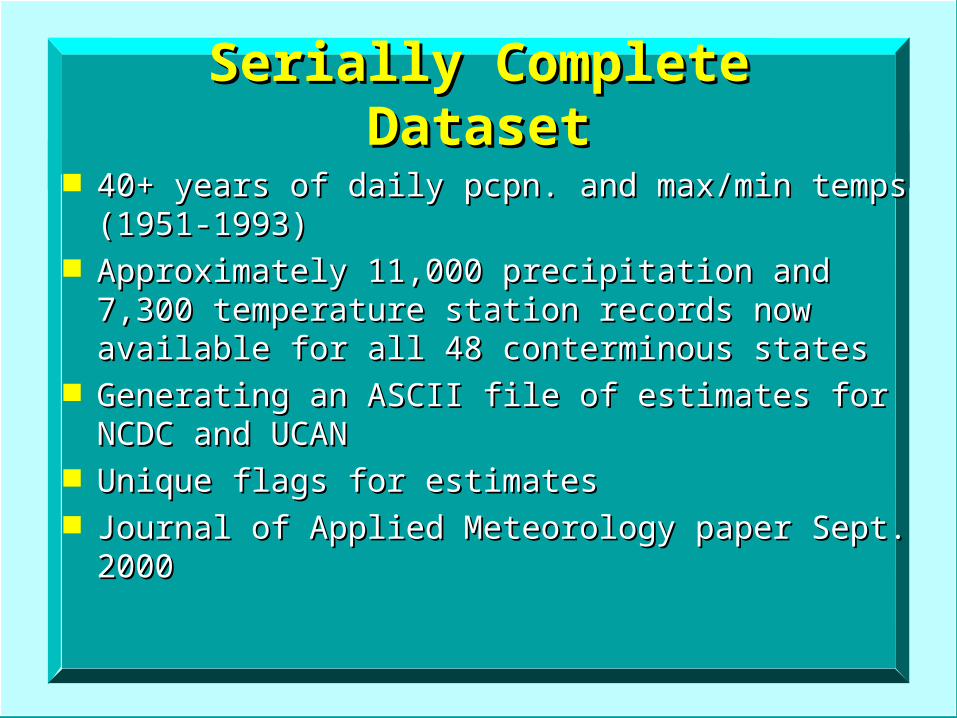
Serially Complete DatasetSerially Complete Dataset
40+ years of daily pcpn. and max/min temps (1951-40+ years of daily pcpn. and max/min temps (1951-1993)1993)
Approximately 11,000 precipitation and 7,300 Approximately 11,000 precipitation and 7,300 temperature station records now available for all 48 temperature station records now available for all 48 conterminous statesconterminous states
Generating an ASCII file of estimates for NCDC and Generating an ASCII file of estimates for NCDC and UCANUCAN
Unique flags for estimatesUnique flags for estimates Journal of Applied Meteorology paper Sept. 2000Journal of Applied Meteorology paper Sept. 2000
Snow Climate Monitoring & Snow Climate Monitoring & Analysis: SNOTELAnalysis: SNOTEL
Large Automated Climate NetworkLarge Automated Climate Network– Began in 1978Began in 1978– Over 650 remote siteOver 650 remote site– Generally in high elevation areasGenerally in high elevation areas– Located in the 12 Western States and Located in the 12 Western States and
AlaskaAlaska– Utilizes meteor burst communication Utilizes meteor burst communication
technology to telemeter datatechnology to telemeter data
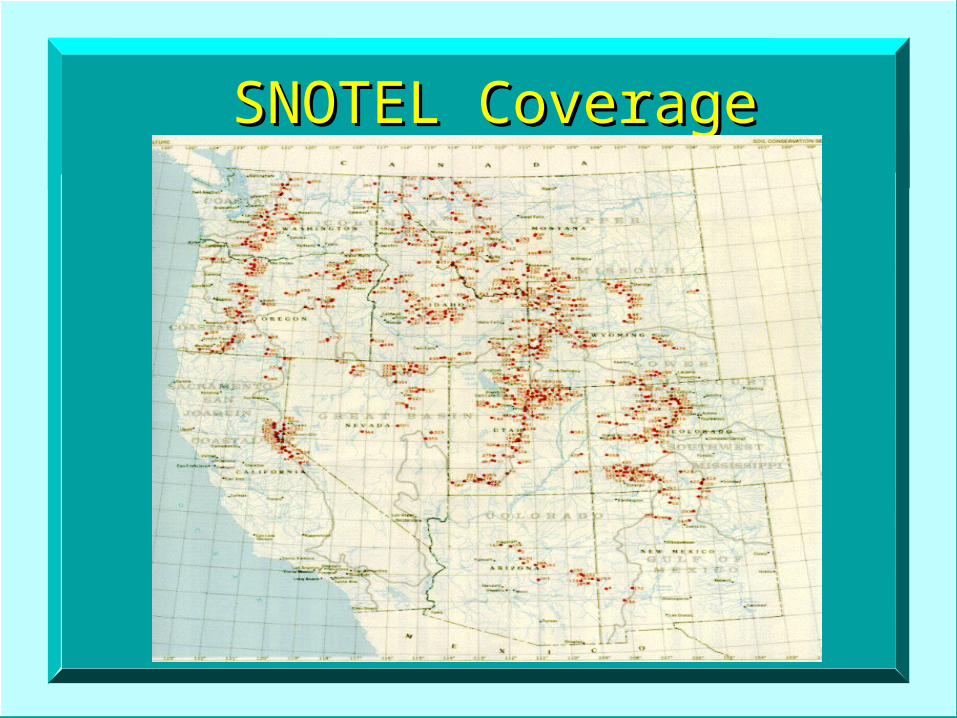
SNOTEL CoverageSNOTEL Coverage
SNOTELSNOTEL
Typical Remote Site Sensor ArrayTypical Remote Site Sensor Array– Snow Pillow used to measure snow Snow Pillow used to measure snow
water contentwater content– Snow DepthSnow Depth– All Season Precipitation GageAll Season Precipitation Gage– Air TemperatureAir Temperature
• Includes current, 24 hour: maximum, Includes current, 24 hour: maximum, minimum, and average minimum, and average
SNOTELSNOTEL
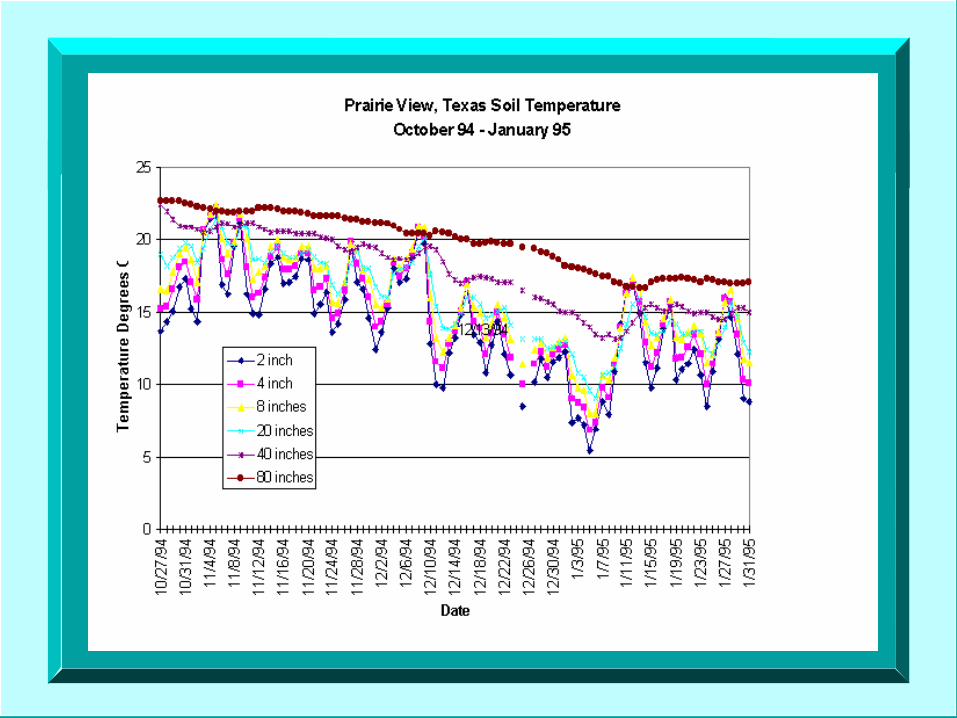
Other SensorOther Sensor– Relative HumidityRelative Humidity– Solar RadiationSolar Radiation– Wind Speed and DirectionWind Speed and Direction– Barometric PressureBarometric Pressure– Water LevelWater Level– Soil Moisture and TemperatureSoil Moisture and Temperature
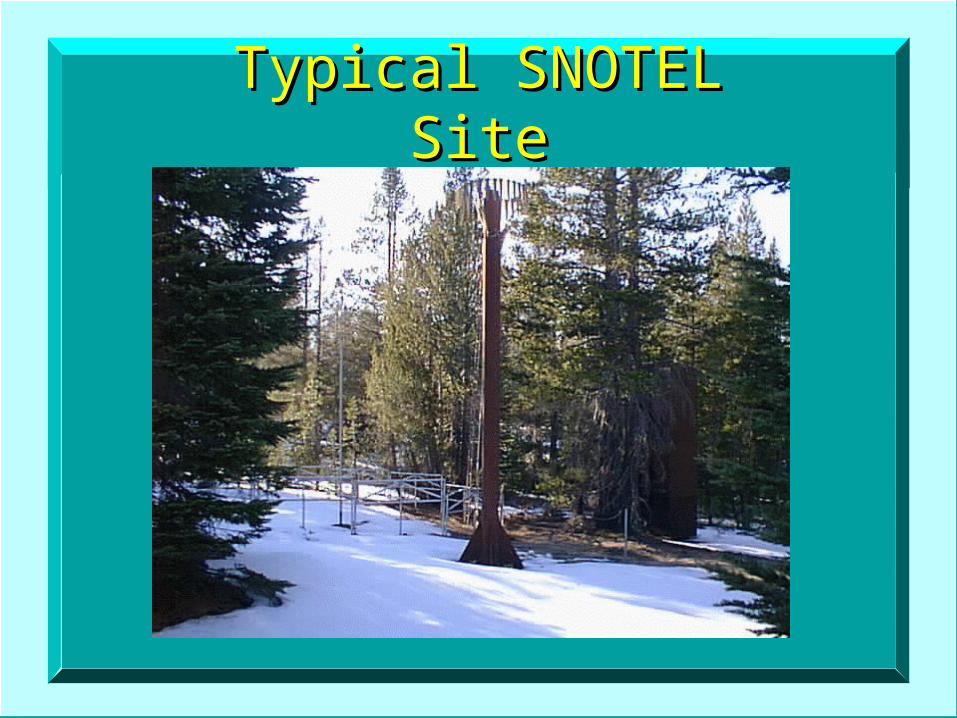
Typical SNOTEL SiteTypical SNOTEL Site
Soil Climate Monitoring and Soil Climate Monitoring and Analysis: SCANAnalysis: SCAN
SCAN (Soil Climate and SCAN (Soil Climate and Analysis Network)Analysis Network)
Nationwide Soil Moisture & Nationwide Soil Moisture & Temperature NetworkTemperature Network– BackgroundBackground
• A pilot project was started in 1991A pilot project was started in 1991• Pilot project objectives were to:Pilot project objectives were to:
– Develop technical expertise in monitoring Develop technical expertise in monitoring Soil-Climate interfaceSoil-Climate interface
– Demonstrate the technical feasibility for a Demonstrate the technical feasibility for a nationwide systemnationwide system
– Precursor to SCANPrecursor to SCAN
SCANSCAN
Currently 42 SCAN sites, located in 30 Currently 42 SCAN sites, located in 30 statesstates
Uses meteor burst or cellular telephone Uses meteor burst or cellular telephone technology to transmit datatechnology to transmit data
Data are delivered to the National Water Data are delivered to the National Water and Climate Center in Portland, Oregonand Climate Center in Portland, Oregon
Real-time data validationReal-time data validation Data are computer accessible in near real-Data are computer accessible in near real-
timetime Danger of losing 20+ SCAN sites without Danger of losing 20+ SCAN sites without
additional fundingadditional funding
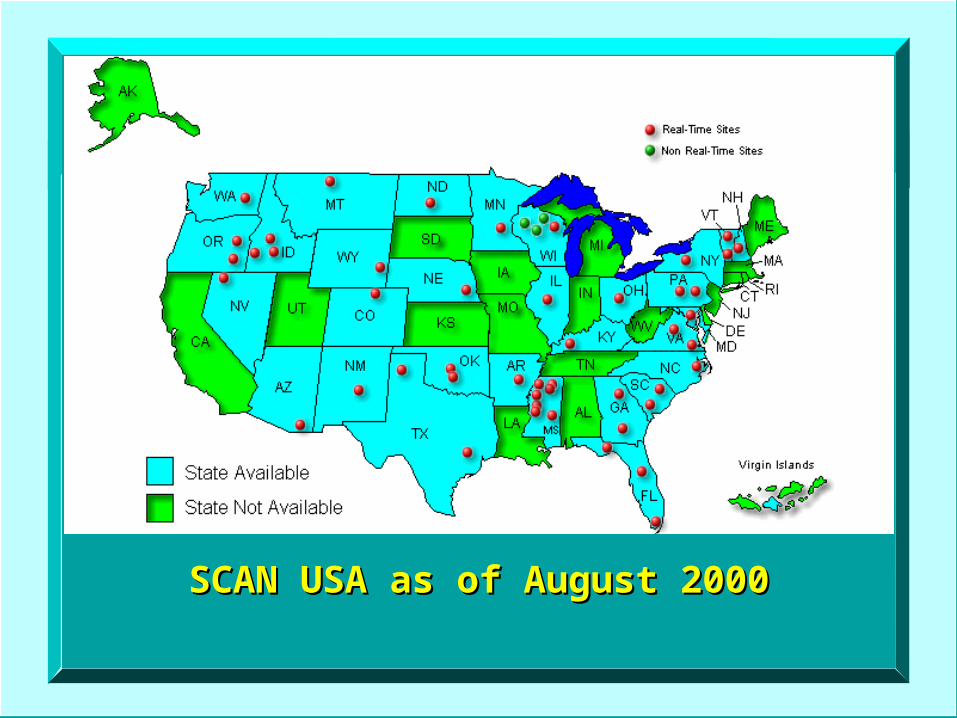
SCAN USA as of August 2000SCAN USA as of August 2000
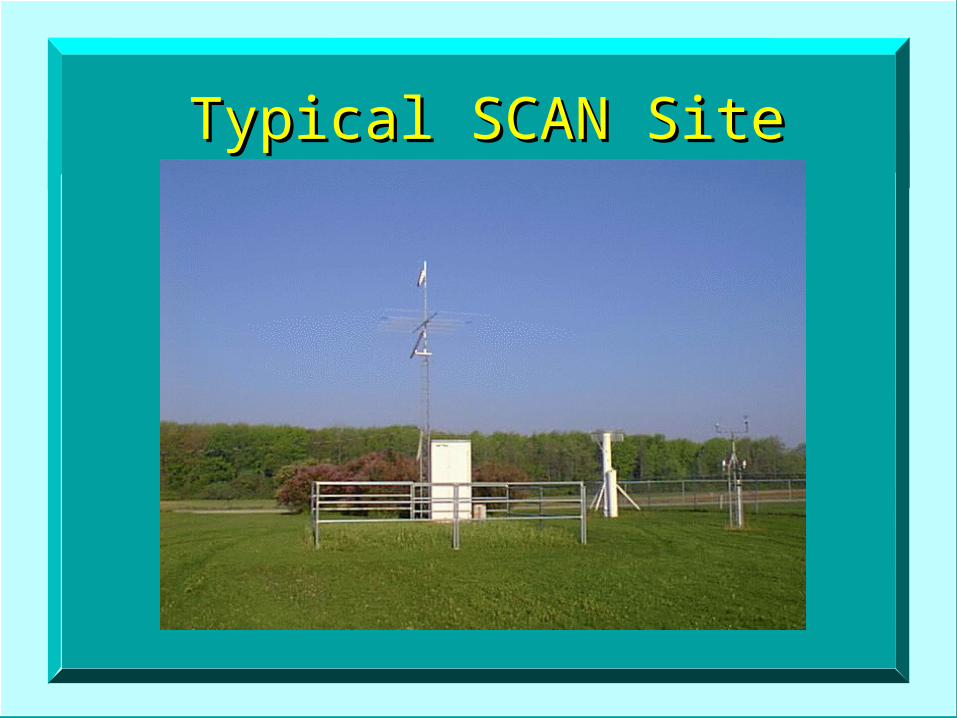
Typical SCAN SiteTypical SCAN Site
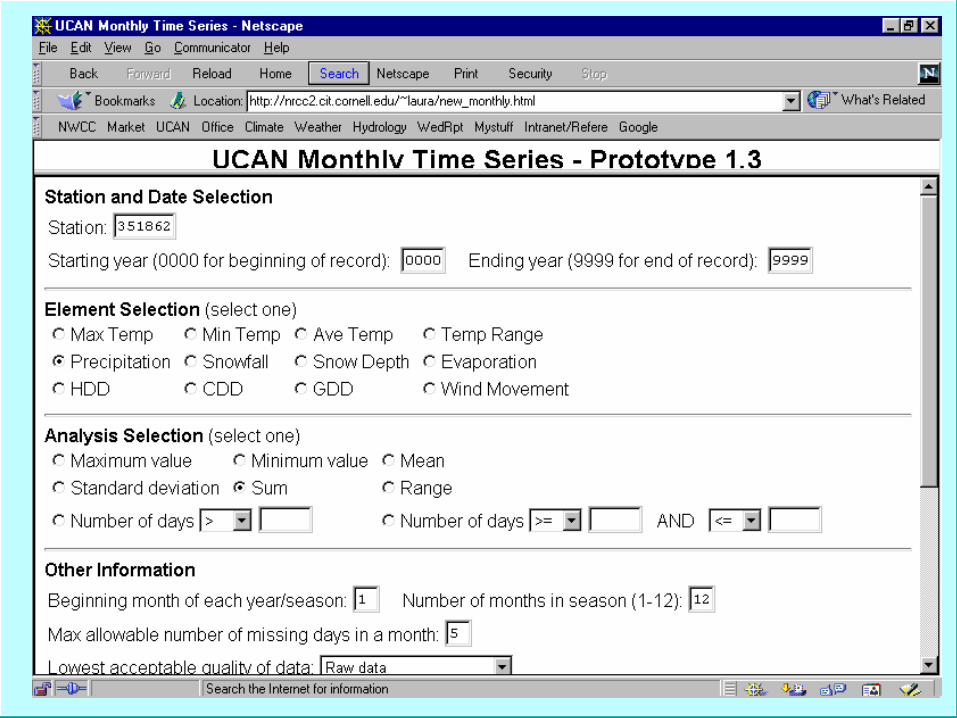
Internet Technologies forInternet Technologies forClimate Delivery Climate Delivery
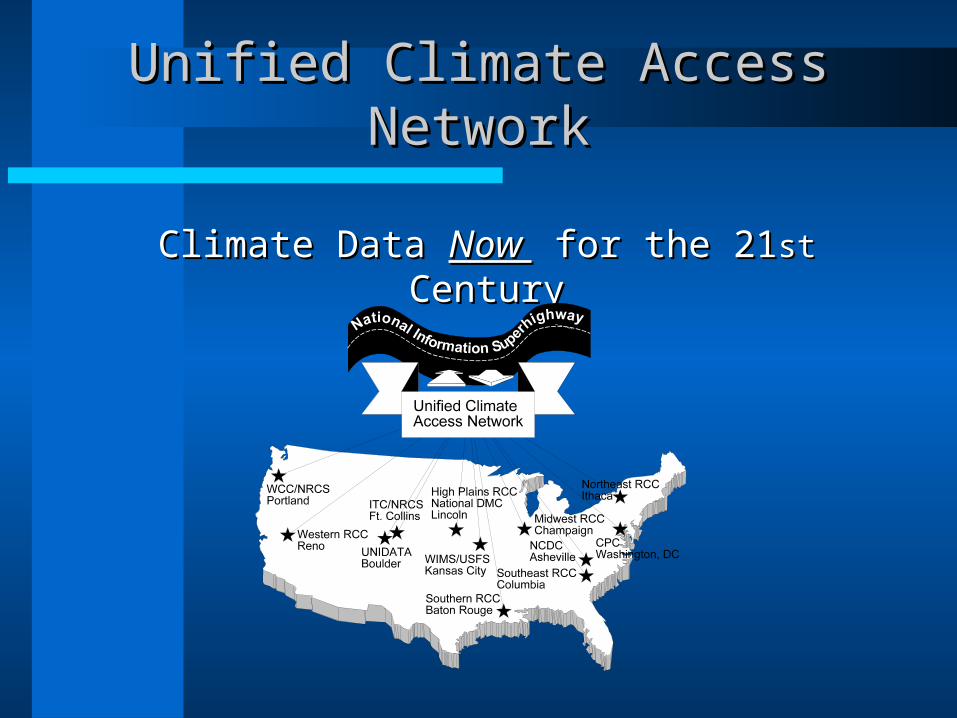
Unified Climate Access NetworkUnified Climate Access Network
Climate Data Climate Data Now Now for the 21 for the 21stst Century Century
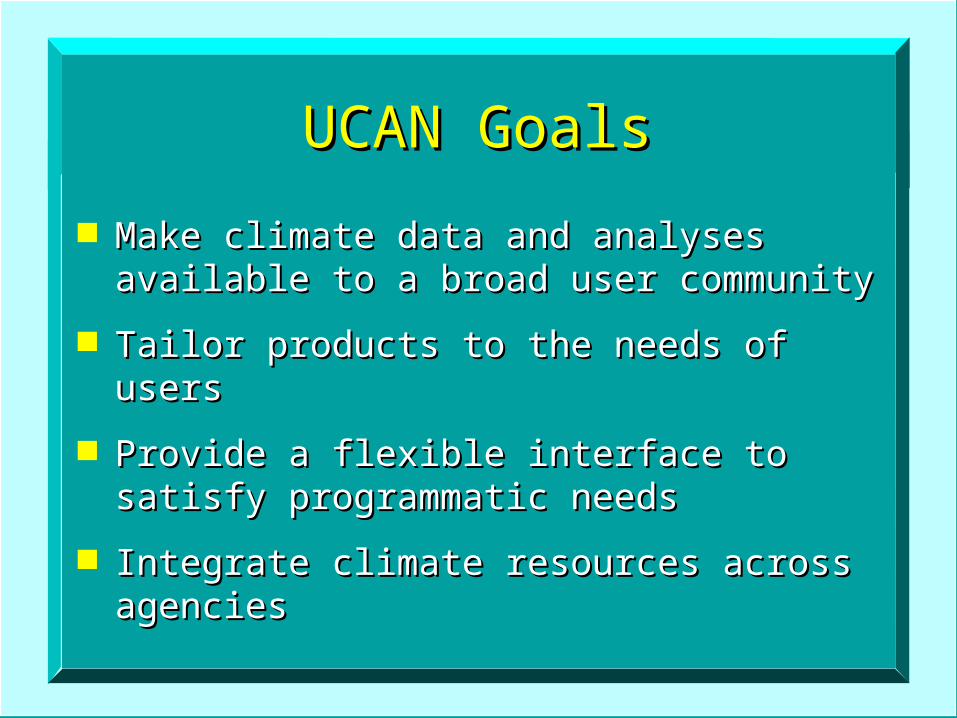
UCAN GoalsUCAN Goals
Make climate data and analyses Make climate data and analyses available to a broad user communityavailable to a broad user community
Tailor products to the needs of usersTailor products to the needs of users
Provide a flexible interface to satisfy Provide a flexible interface to satisfy programmatic needsprogrammatic needs
Integrate climate resources across Integrate climate resources across agenciesagencies