Click to edit Master text styles - World Bankpubdocs.worldbank.org/en/714131505498172091/... ·...
24
Click to edit Master text styles • Second level • Third level • Fourth level • Fifth level
Transcript of Click to edit Master text styles - World Bankpubdocs.worldbank.org/en/714131505498172091/... ·...

Click to edit Master text styles
• Second level
• Third level
• Fourth level
• Fifth level
Click to edit Master text styles
• Second level
• Third level
• Fourth level
• Fifth level
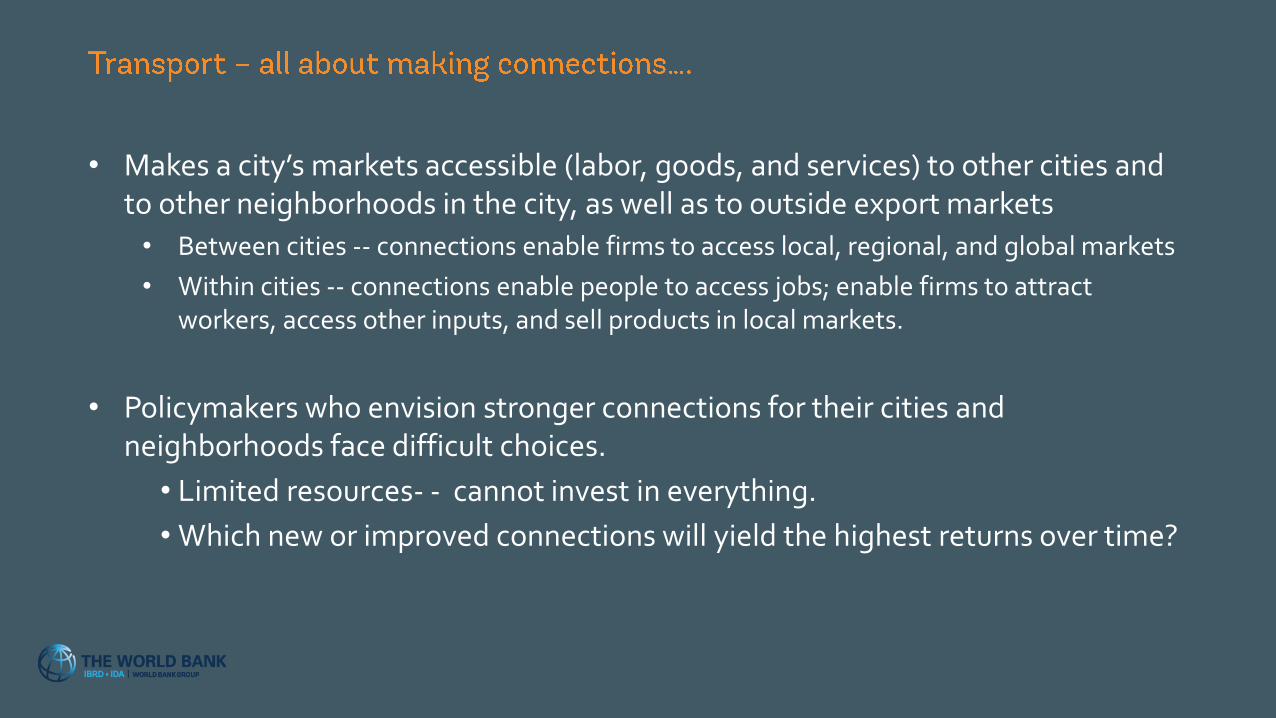
• Makes a city’s markets accessible (labor, goods, and services) to other cities and to other neighborhoods in the city, as well as to outside export markets
• Between cities -- connections enable firms to access local, regional, and global markets
• Within cities -- connections enable people to access jobs; enable firms to attract workers, access other inputs, and sell products in local markets.
• Policymakers who envision stronger connections for their cities and neighborhoods face difficult choices.
• Limited resources- - cannot invest in everything.
• Which new or improved connections will yield the highest returns over time?

Click to edit Master text styles
• Second level
• Third level
• Fourth level
• Fifth level
Untangle Transport vs mobility vs Accessibility – focus is often on ‘movement and speed’ whilst the challenge is one of accessibility
‘Transport': focus on vehicle movement and speed dealing with challenges of congestion or inadequate roads
'Mobility': Efficient movement of people and goods is beneficial ; supportive of collective modes of transport (eg buses, rail).
'Accessibility' : Ability to REACH opportunities is beneficial, not movement itself.
In some contexts gaining access to opportunities can require lots of mobility.
In some context gaining access might involve very short trips and lower mobility

Click to edit Master text styles
• Second level
• Third level
• Fourth level
• Fifth level
0.0
0.5
1.0
1.5
2.0
2.5
3.0
3.5
4.0
0 5,000 10,000 15,000 20,000 25,000 30,000 35,000
Trav
el T
ime
Bu
dg
et, h
/cap
/day
GDP per capital, US$(2000)
Cities
Countries
African villages in Ghanaand Tanzania
Average per capita daily travel times for a
roundtrip is about 1 hour
Source: Schafer and Victor 2000; Schäfer and others 2009.

Click to edit Master text styles
• Second level
• Third level
• Fourth level
• Fifth level
In Nairobi,
42% walk to work…
Access 11% of jobs 11%

Click to edit Master text styles
• Second level
• Third level
• Fourth level
• Fifth level
In Nairobi, 70% walk or take the matatu to work…
…limiting access to opportunities
% of jobs within 60 minutes
11%
20%
In London, a central resident can reach 54% of all jobs within 45
minutes using public transit, in Nairobi, the corresponding share is 20%

Click to edit Master text styles
• Second level
• Third level
• Fourth level
• Fifth level
Mixed land use/ random land use
Monocentric
Polycentric
Decline in transport cost:
Further reduction in transport cost: e.g. interstate highways, suburban rail
high cost of commute, limited agglomeration externalities
Low cost of commute, stronger agglomeration economies,
Moderate cost of commute, spatially localized agglomeration externalities

Click to edit Master text styles
• Second level
• Third level
• Fourth level
• Fifth level
8

Click to edit Master text styles
• Second level
• Third level
• Fourth level
• Fifth level
Tokyo Beijing

Click to edit Master text styles
• Second level
• Third level
• Fourth level
• Fifth level

Click to edit Master text styles
• Second level
• Third level
• Fourth level
• Fifth level

Click to edit Master text styles
• Second level
• Third level
• Fourth level
• Fifth level
Don’t neglect land use
Policymakers worried a lot about congestion -- separates people from opportunity ..
• Nairobi – sitting in traffic costs US$4 million per workday (World Bank 2014)
• Kigali worried about it; so are London and Los Angeles
What can policymakers do?
• Pricing ? Ring roads? – all good …-- but are these the sharpest solutions?
• India, Colombia – Duranton’s work show that travel speed variance between the fastest and slowest hours is not high- - travel delays caused by traffic don’t have a major role in explaining mobility difference across Indian cities
• Useful to think of how land is organized, zoned and used == need for density and better linkages between land use and transport plans

Click to edit Master text styles
• Second level
• Third level
• Fourth level
• Fifth level
Chaotic use of land?

Click to edit Master text styles
• Second level
• Third level
• Fourth level
• Fifth level
Source: Data from Antos, Lall, and Lozano-Gracia 2016 and Felkner, Lall, and Lee 2016.

Click to edit Master text styles
• Second level
• Third level
• Fourth level
• Fifth level
Short run: travel behavior – ++policies
Long run: location decisions of residents – complementary policies
• Densification
• Sorting and Suburbanization
• Induce investment in structures
• Examples: Subways; Chinese ring roads, Kampala ring roads

Click to edit Master text styles
• Second level
• Third level
• Fourth level
• Fifth level
Connecting settlements to integrate product markets
Rural – urban linkages – farm diversification and non-farm activities (Wang and Dorosh)
Connecting cities – integrating domestic markets – often in the context of external market integration..

Click to edit Master text styles
• Second level
• Third level
• Fourth level
• Fifth level
• High domestic transport costs pose a major challenge to the economic integration of sub national regions, and limits their potential for cities to support economic diversification.
• Roads -- building a road will increase the number of journeys and possibly the associated time savings (reduction in transport costs)
• Long term – can also make a place a more attractive location for investment and economic activity.
• Induced changes in the location of activity and in productivity.

Click to edit Master text styles
• Second level
• Third level
• Fourth level
• Fifth level

Click to edit Master text styles
• Second level
• Third level
• Fourth level
• Fifth level
• Non-competitive market structures of service providers (Lall, Munthali, & Wang, 2009) or excessive regulations (Combes & Lafourcade, 2005) can drive up user costs – reducing the benefits from investment.
• Barriers to entry in the transport industry
• Atkin and Donaldson -- cost of distance (per unit) is 3.5 times higher in Ethiopia compared to the US. This difference is bigger in Nigeria, where the costs are 5.3 times bigger than in the US.
• While the poor quality of the roads explains part of the difference, low wages should reduce this difference in the labor intensive sector.
• intermediaries capture the majority of the gains from falling international trade barriers
• Finding in line with Teravaninthorn and Raballand (2009) pointing at barriers to entry affecting logistic and transport costs on the main African corridors.
• Complementary policies beyond the expansion of transport infrastructure

Click to edit Master text styles
• Second level
• Third level
• Fourth level
• Fifth level
Big data for better insights…• e.g Satellite image analysis and “Big Pixel “ (Hanson)
• e.g Amazon cloud processing of mobility data – Duranton
• e.g Call Detail Records (Lozano Gracia @WBG)
Surveys of freight and passenger movement• Example from Cape Town
Analytic framework compatible with market distortions in developing countries
Systematic assessment of complementary policies – understand wider economic benefits

Click to edit Master text styles
• Second level
• Third level
• Fourth level
• Fifth level

Click to edit Master text styles
• Second level
• Third level
• Fourth level
• Fifth level
Avner and Lozano, 2017

Click to edit Master text styles
• Second level
• Third level
• Fourth level
• Fifth level
Lots of trips coming to and goingfrom downtown
But people use downtown astransit hubs not as places of work
Source Joubert

Click to edit Master text styles
• Second level
• Third level
• Fourth level
• Fifth level
Big data for better insights…• e.g Satellite image analysis and “Big Pixel “ (Hanson)
• e.g Amazon cloud processing of mobility data – Duranton
• e.g Call Detail Records (Lozano Gracia @WBG)
Surveys of freight and passenger movement• Example from Cape Town
Analytic framework compatible with market distortions in developing countries
Systematic assessment of complementary policies – understand wider economic benefits