Clean Development Mechanism · 2015-04-27 · Page 6 Clean Development Mechanism – An Experience...
93
Clean Development Mechanism - An Experience from Yemen Lia Carol Sieghart Ministry of Water and Environment Republic of Yemen
Transcript of Clean Development Mechanism · 2015-04-27 · Page 6 Clean Development Mechanism – An Experience...

Clean Development Mechanism -
An Experience from Yemen
Lia Carol SieghartMinistry of Water and EnvironmentRepublic of Yemen


Page 3
CClleeaann DDeevveellooppmmeenntt MMeecchhaanniissmm ––
AAnn EExxppeerriieennccee ffrroomm YYeemmeenn
Lia Carol Sieghart Ministry of Water and Environment
Republic of Yemen

Page 4 Clean Development Mechanism – An Experience from Yemen
Ministry of Water and Environment Environment Protection Authority DNA Secretariat Sana’a, Republic of Yemen www.cdm‐yemen.org Copyright © 2008, Ministry of Water and Environment, Republic of Yemen Author: Lia Carol Sieghart – Ministry of Water and Environment, Republic of Yemen Acknowledgment ‐ support and guidance provided by: HE Abdul‐Rahman F. Al‐Eryani, Dr. Hussien Al‐Gunied, Eng. Mahmoud Shidiwah, Anwar Noaman MSc, Mohammed Shamsan MSc. Photo credits – Ministry of Water and Environment, Environment Protection Authority, Socotra Conservation Development Programme, Peter Speyrer, Eva Sieghart, Lia Sieghart, Mohammed Shamsan, Doris Reiling, Michael Reiling. Cover design by Visioncraft. Offsetprint Layout by MEDIA DESIGN. Questions and comments shall be addressed directly to the author at: [email protected] Whilst advice and information in this book is believed to be true and accurate at the date of going public, neither the author nor the Ministry nor the supporting int./bilateral organisations can accept any legal responsibility or liability for any errors or omissions that may be encountered. Sana’a, March 2008

Page 5
Forewords Climate change is not solely an environmental issue, but rather part of the larger challenge of sustainable development. It is one of the most serious threats to poverty eradication. Developing countries, and the poorest people who live in them, are the most vulnerable to climate change. These countries are least equipped to respond to its impacts and therefore most vulnerable to its raising risk. In our region freshwater availability is projected to decrease, coastal areas will be at greater danger due to increased flooding, and climate change is projected to compound pressures on natural resources and public health. In such a setting our tasks become even more complex given the inextricable link between sustainable development and climate change. We are living with the consequences of actions and decisions of the last generations, and future generations will live with the consequences of ours. Addressing climate change is our responsibility. The Kyoto Protocol and its provisions for flexible mechanisms have provided one tool for an effective and equitable global response. Among these instruments, the Clean Development Mechanism using the market as its driving force has the potential to not only contribute to the ultimate objective of the UN Framework Convention on Climate Change, but also to encourage developing countries to move their economic growth to a less carbon‐intensive development path. Ideally, it will encourage additional capital flows into developing countries, accelerate environment‐sound technology transfer, create new job opportunities and enable developing countries to leapfrog to cleaner technologies. Within the last 12 months the Government of Yemen has been intensely working on developing the relevant environment for providing an attractive CDM destination. In January 2007 the Cabinet approved the Prime Minister’s Resolution No. (238) regarding the establishment of a Designated National Authority (DNA) for approval of projects under the Clean Development Mechanism (CDM) of the Kyoto Protocol. A Ministerial Decree outlining the country specific CDM approval procedures was endorsed, thereby recognizing the importance of global cooperation for climate change abatement and its implications on national objectives for sustainable development. More than 20 CDM workshops aiming at improving the capacity of Government representatives, the private sector, NGOs and local experts were implemented. Potential developers were assisted in identifying CDM projects within their operational activities. This process resulted in a sound framework for Yemen to operate as a CDM host country. I would like to use the opportunity to express my gratitude to the Cabinet for providing full support and for being actively engaged in the steps taken. I would like to thank for the support provided by the United Nations Development Programme, Centrum für internationale Migration und Entwicklung and the Carbon Finance Assist Programme of the World Bank. Important is also to note the support and dedication provided by the colleagues of the Ministry of Water and Environment and the Environment Protection Authority. This report outlines the experiences and lessons learned from the establishment of the DNA, the promotion of the CDM, to the sectoral assessments carried out in our country. Capacity building was a key element in this process. An in‐depth understanding is crucial for the ability of Yemen to deliver high quality emission reductions of greenhouse gases. The report aims to increase the awareness and capacity of project developers and to provide investors with some country‐specific information. There is still a strong need for capacity building through actual CDM project development and in transferring expertise to the local Governments where CDM activities could be implemented. We are determined to further embark on this process for the benefit of our present and future generations. Abdul‐Rahman F. Al‐Eryani Minister of Water and Environment Chair – DNA Board

Page 6 Clean Development Mechanism – An Experience from Yemen
Climate change is one of the most serious threats facing the global community in the 21st century. For least developed countries, like Yemen, the impacts of climate change could significantly undermine the progress towards achieving the Millennium Development Goals (MDGs) and exacerbate many poverty and environment issues the country is already facing. Confronted with a problem as daunting as this, resigned pessimism might seem a justified response. However, resigned pessimism is a luxury that the world’s poor and future generations cannot afford, and there is an alternative. There is cause for optimism. Five years ago, the world was still engaged in debating whether or not climate change was taking place, and whether or not it was human‐induced. Climate change scepticism was a flourishing industry. Today, the debate is over and climate scepticism is an increasingly fringe activity. The Fourth Assessment Report by the Intergovernmental Panel on Climate Change has established an overwhelming scientific consensus that climate change is both real and man‐made. In short, Climate Change has become a priority! Assisting developing countries with their efforts to cope with the impacts of global climate change and to create more sustainable, less greenhouse gas intensive development paths is an important focus for the United Nations Development Programme. A range of market‐based instruments to address environmental issues has emerged in the past decade, including the use of compliance and voluntary emission offsets in the area of climate change. In the compliance sector, for example the Clean Development Mechanism (“CDM”) which is one of the three flexibility mechanisms in the Kyoto Protocol is designed to engage the marketplace in meeting the commitments of the developed countries, and is the only one that involves developing countries. The purpose of the Clean Development Mechanism is to assist Parties not included in Annex I of the Kyoto Protocol, like Yemen, in achieving sustainable development, and to assist Parties included in Annex I in achieving compliance with their quantified emission limitation and reduction commitments. UNDP promotes the human, institutional and system‐wide capacity development component of the CDM and works to bring the financial and technological benefits of the CDM to less advantaged participants. UNDP, as a knowledge‐based capacity development and facilitating agent, uses its expertise to enhance national CDM capacity development needs and works with private sector entrepreneurs, host country governments and the civil society to create an effective and efficient enabling environment and a CDM management regime that not only reduces transaction costs but also assists the developing countries achieve sustainable development as an intrinsic component of their national development priorities. The Government of Yemen and UNDP have been working closely to establish an effective institutional set up and clear operational procedures for management and promotion of CDM projects. To help leverage the potentially significant benefits of carbon finance for the developing world, UNDP has established the MDG Carbon Facility, an innovative mechanism for the development and commercialization of emission reduction projects. We have to raise our efforts together to fight climate change. Yes, Climate Change is an urgent matter today, but do we need it to become an emergency tomorrow? Selva Ramachandran Resident Representative a.i. United Nations Development Programme

Page 7
Table of Contents
Acronyms 9
1. Introduction 12
2. Social, Economical and Political Information 13
2.1. Country Profile 13
2.1.1. Geographical information 13
2.1.2. Climate 13
2.1.3. Political History 14
2.1.4. Social Profile 15
2.1.5. Economic Profile 16
2.1.6. Political Profile 18
3. The Kyoto Protocol 19
3.1. The Clean Development Mechanism 20
3.2. Eligible project activities 21
3.3. The CDM Project Cycle 21
3.4. The Baseline 27
3.5. Additionality 29
3.6. Baseline and monitoring methodologies for the different types 31
of CDM project activities
3.6.1. CDM project activities – large scale 31
3.6.2. Small‐scale CDM Projects 31
3.6.3. Afforestation and Reforestation 32
3.7. Programme of Activities 34

Page 8 Clean Development Mechanism – An Experience from Yemen
4. Structure of Yemen’s DNA 37
4.1. Background – Process of Establishment 37
4.2. The DNA Secretariat 42
4.3. The DNA Board 43
5. CDM Project Approval and the relevant requirements 44
5.1. Background to the Process 44
5.2. CDM Project Evaluation and Approval Procedures 44
5.3. Sustainable Development Criteria and Indicators (including the 48
underlying policy document)
5.3.1: Criteria and indicators 48
5.4. Environmental Impact Assessment 49
5.4.1. Introduction to Environmental Impact Assessment 49
5.4.2. The EIA Process in Yemen 53
6. Scope for CDM Projects in Yemen 55
6.1. Overview of existing CDM project portfolio 55
6.2. Greenhouse gas emissions in Yemen 59
6.3. Potential CDM projects in Yemen 60
6.3.1. Energy 62
6.3.1.1. Overview – Electricity 62
6.3.2. Industrial processes 75
6.3.3. Waste 76
Annex 1 78
Annex 2 81
Annex 3 88

Page 9
Acronyms AAU Assigned Amount Unit ACM Approved Consolidated Methodology AM Approved Methodology A/R Afforestation and Reforestation BAU Business as Usual CDM Clean Development Mechanism CDM EB CDM Executive Board CER Certified Emission Reduction CH4 Methane CO2 Carbon dioxide CO2e Carbon dioxide equivalent DNA Designated National Authority DOE Designated Operational Entity COP Conference of the Parties CPA CDM project activity EB Executive Board of the CDM EIA Environmental Impact Assessment EPA Environment Protection Authority ERU Emission Reduction Unit GDP Gross domestic product GHG Greenhouse Gas GWP Global Warming Potential GOY Government of Yemen HFCs Hydrofluorocarbons IET International Emission Trading

Page 10 Clean Development Mechanism – An Experience from Yemen
JI Joint Implementation KP Kyoto Protocol LDC Least Developed Country LoA Letter of Approval LoE Letter of Endorsement LULUCF Land use, land‐use change and forestry MENA Region Middle East and North Africa Region MOP Meeting of Parties to the Kyoto Protocol MP Monitoring Plan MWE Ministry of Water and Environment N2O Nitrous oxide NGO Non‐Governmental Organization NWRA National Water Resources Authority ODA Official Development Assistance PDD Project Design Document PFCs Perfluoro‐carbons PIN Project Idea Note PoA Programme of Activities RIT Registration and Issuance Team RMU Removal Units SSC Small‐scale methodology SF6 Sulphur hexafluoride tCO2e tons of carbon dioxide equivalent UNFCCC United Nations Framework Convention on Climate Change YR Yemeni Rial

Page 11

Page 12 Clean Development Mechanism – An Experience from Yemen
1. Introduction The Kyoto Protocol addresses mitigation of the six gases believed to be the main contributors to the climate change effect, which is associated with an increase in global temperature and disturbed climatic patterns. The Clean Development Mechanism (CDM), an innovative cooperative mechanism under the Kyoto Protocol, is designed with the dual purpose of supporting developing countries in achieving sustainable development and of assisting industrialized countries in achieving compliance with their greenhouse gas emission reduction commitments. For each ton of CO2 equivalent that is reduced as a result of a CDM project activity, a certified emission reduction unit (CER) is issued and can be utilized by industrialized countries for the fulfillment of their commitments. Ideally, the CDM will encourage additional capital flows into developing countries, accelerate technology transfer, create new job opportunities and enable developing countries to leapfrog to cleaner technologies. Despite the high demand to utilize the CDM and witnessing a rapidly increasing number of registered projects, the number of host countries playing a vital role is still very limited. Many developing countries find it difficult to digest the complex rules and to manoeuvre within the regulatory framework of the Marrakech Accords. There are many factors pinned upon the CDM for by far not having reached its full potential. Many of those are country‐specific but also numerous are repeatedly reported alike from various countries. In specific, least developed countries have been facing difficulties to embark on this process. Bilateral donors and international organizations have been playing a catalytic role to kick‐start the momentum in many countries. For host countries, like Yemen, to fully embrace the CDM as an instrument for sustainable development, they must be empowered to be equal partners in negotiations with developed countries and the private sector. A critical element lies in capacity development and institutional strengthening to address limitations. An effective national institutional structure is necessary to attract investors and harness the potential. The countries are facing a steep learning curve. Core questions to be addressed, as perceived during various intergovernmental meetings, remain the same for many of the countries. In order for Yemen to take a pro‐active approach to participate as a reliable partner in the CDM the Ministry of Water and Environment and the Environment Protection Authority have been intensively working over the last 12 months to prepare the relevant legal and institutional framework. This process resulted in several tangible outputs. In January 2007 the Cabinet approved the Prime Minister’s Resolution No. (238) regarding the establishment of a Designated National Authority (DNA) for approval of projects under the Clean Development Mechanism (CDM) of the Kyoto Protocol. A Ministerial Decree outlining the country specific CDM approval procedures was endorsed. More than 20 CDM workshops aiming at improving the capacity of Government representatives, the private sector, NGOs and local experts were implemented. Potential project developers were assisted in identifying CDM projects within their operational activities. This process included face‐to‐face discussions and technical training workshops with decision‐makers of companies and public entities. In the spirit of South‐South cooperation this report outlines the experiences and lessons learned from the establishment of the DNA, the promotion of the CDM to the sectoral assessments in the Republic of Yemen. These experiences may assist when similar measures are implemented in other countries. The report also aims to increase the awareness and capacity for the CDM of project developers and further to provide investors with some country‐specific information.

Page 13
2. Social, Economical and Political Information 2.1. Country Profile
2.1.1. Geographical information
The Republic of Yemen is located in the South of Arabia (The Arabian Peninsula), south‐west of Asia, between latitudes 12 and 20 degrees to the north of the equator, and between longitudes 41and 54 degrees to the south of Greenwich, bordered in the North by Saudi Arabia, in the south by the Arab Sea and the Gulf of Aden, in the east by the Sultanate of Oman and in the west by the Red Sea. The country is characterized by five major land systems:
1. a hot and humid coastal Tihama plain, 30‐60 km wide, along the Red Sea and the Gulf of Aden;
2. the Yemeni Highlands, a volcanic region with elevations from 1,000 to 3,600 m, parallel to the coast of the Red Sea, and experiencing monsoon rains;
3. the dissected region of the Yemen High Plateaus and the Hadramawt ‐ Mahra Uplands, with altitudes up to 1,000 m;
4. the Al‐Rub Al‐Khali desert interior, with a hot and dry climate; and
5. the Yemeni islands, including the Socotra Archipelago in the Arabian Sea and more than 112 islands in the Red Sea. Yemen's coastal and marine ecosystems which include extensive mangroves, coral reefs, and sea grass areas are of major economic importance for fisheries and tourism.
The extreme differences in elevation are largely responsible for the great variations in temperature and climate over the country.
2.1.2. Climate
Yemen is characterized by a diverse physical and topographical feature, which is composed of mountain chains, plateaus, plains and wadis1. This variation leads to wide differences in climatic conditions and consequently to a formation of different agro‐climatic zones. Extreme humidity combines with high temperatures—as high as 54°C in the shade— producing a stiflingly hot climate. Winds blowing north‐west in summer and south‐west in winter bring little rain but cause severe sandstorms. During January and February, however, the temperature averages around 20°C.
1 Wadi = A valley, gully, or streambed in northern Africa and southwest Asia that remains dry except during the rainy season.

Page 14 Clean Development Mechanism – An Experience from Yemen
Most of Yemen lies in the border zone between two main weather patterns: the regular northerly winds (from the Mediterranean basin) and the south‐western monsoon winds. This creates a fairly well‐defined seasonal rhythm; the northerly winds predominate during the winter, while in the summer, the south‐west monsoon brings the primary rains. Cut off from this pattern by the central mountains, the southern fringe areas in the Gulf of Aden experience a markedly tropical climate. In Al‐Hudaydah and Aden, temperatures often exceed 38° C with high humidity, whereas in the
capital Sana’a, the daytime temperature averages around 21° C, with a very low humidity. The higher northern elevations of the central massif experience frequent frosts during the winter months.2
2.1.3. Political History
The oil boom of the 1970s in the Gulf Countries provided new economic opportunities for rural settlers who left in large numbers to these countries. They sent much needed remittances to rural communities at a time when Government investment was limited, accounting for $1.5 billion per year. The people back home used this budget to invest in local infrastructure, such as roads, schools, housing and irrigation systems. They also invested in local economic activities, introducing more water‐intensive cash crops such as qat3, new kinds of vegetables and fruit trees using expanded tubewell irrigation. Others invested in local businesses, shops and restaurants. Up until 1990 the market‐oriented private sector economy was supplemented in large part by this transfer of funds from Yemenis working abroad, accounting for almost a third of the labor force.4 In this time, 90 % of the population in North Yemen living in rural areas relied on a traditional subsistence farming economy. Growing imports of basic commodities such as wheat, sold to consumers at subsidized prices until 1999‐2000, meant that local cereal farmers were no longer competitive. During the late 1980s oil was discovered in both southern and northern Yemen which up to present accounts for the majority of the Government’s revenue. In the South much of it became a British colony centered in Aden. An anti‐colonial movement succeeded in establishing a socialist state in 1967. The national economy during the socialist regime (1970‐1990) was stimulated by the strategic importance of Aden, until 1958, the second largest port in the world after New York. Nevertheless,
2 Library of Congress – Federal Research Division Country Profile: Yemen, December 2006 3 Qat = the leaves of the shrub Catha edulis cultivated in Yemen, which are chewed and has the effect of a euphoric stimulant 4 World Bank, 2001: “Yemen: Country Assistance Evaluation,” Operations and Evaluation Department.

Page 15
Aden’s international economic importance declined during the socialist era as did employment in the port sector. Under the centrally‐planned economy, large state factories (e.g. canning, beer, shoe manufacturing, etc.) were established and offered new employment opportunities, especially for women. On 22 May 1990 for the first time in many centuries, North and South Yemen politically united and the Republic of Yemen was declared. In May 1991 a unity constitution was ratified, affirming Yemen’s commitment to free elections, a political system consisting of several parties, the right to ownership of private property, equality under the law and the respect of basic human rights. After unification of North and South Yemen, the collapse of state industries led to massive layoffs. In the mid‐1990s, with international assistance, Yemen launched a substantial programme of economic and administrative reform. Yemen enjoyed three Paris Club debt cancellations/reschedulings that reduced the debt burden by half, serving as incentives to carry out reforms. These include reduction of tariff barriers, unification of exchange rates, and improvement in the financial sector, prudential regulation and control of monetary expansion. The economic policies of unified Yemen are oriented to a private sector market economy.5
2.1.4 Social Profile
The 2004 census reported a population of 19.72 million, reflecting an average annual population growth rate of 3.2 %, one of the highest birth rates in the MENA6 Region. The population has more than doubled since 1975 and has grown approximately 35 % since the 1994 census, making Yemen the second most populous country in the Arabian Peninsula. The country’s fertility rate was almost 6.6 children per woman in 2006.7 Adding to the growth of the native population is the influx of Somali refugees which amounted in 2005 an average of 1,000 per month. According to the United Nations, the population in 2005 was 26.3 % urban and 73.7 % rural; population density was 40 persons per km2. The rate of urbanization has been steadily increasing over the last two decades. The population is predominantly young with approximately 46 % under the age of 15, slightly more than 50 % are in the age range of 15‐64 and only 3 % are 65 years and older.8 Despite an increase of 14 years in the last decade, life expectancy at birth in
Yemen has remained low compared with other developing countries, 60 years for males and 64 years for females, or 62.1 years overall. Yemen has improved its score on the human development index since 1990, but the country remains trapped in the group of low human development countries. While the population growth rate decreased from 3.7% in 1994 to 3.2% in 2004, high population growth remains an underlying cause of many of the problems Yemen faces. Population dynamics have negatively impacted improvements in water management, economic growth, education and primary health care. The
5 Source: Report No.: 34008‐YE ‐ Republic of Yemen ‐ Country Social Analysis ‐ January 11, 2006 ‐ Water, Environment, Social and Rural Development Department, Middle East and North Africa Region – World Bank 6 Middle East and Northern Africa 7 Library of Congress – Federal Research Division Country Profile: Yemen, December 2006 8 Central Statistics Office

Page 16 Clean Development Mechanism – An Experience from Yemen
country has even regressed on child malnutrition where the rate worsened from 1992 to 1997, with the situation remaining unchanged through 2003. At the current annual rate of population growth, the population will double in 23 years time, implying the need for rapid expansion of social services and job opportunities.9
2.1.5 Economic Profile Yemen’s GNI per capita is US$ 760, compared to for example US$ 12,510 in Saudi Arabia, US$ 23,990 in the United Arab Emirates and US$ 9,070 in Oman.10 According to the Country Social Analysis (2006) by the World Bank the GDP growth rate has steadily been falling over the last years. Inflation has been averaging at almost 12 % since 2002 rapidly increasing the cost of living. Oil income accounts for an estimated 67 % of the Government’s revenue. However, Yemen is the smallest oil producer in the Middle East.11,12 More information on the oil sector in the final chapter. Figure 2.1: GDP Growth Rate in Yemen Source: World Bank, Yemen Economic Monitoring Report, September 2005
9 Source: UNDAF 2007‐2011 10 World Development Indicators database, World Bank, 1 July 2007 11 Report No.: 34008‐YE ‐ Republic of Yemen ‐ Country Social Analysis ‐ January 11, 2006 ‐ Water, Environment, Social and Rural Development Department, Middle East and North Africa Region 12 Figures provided by the Ministry of Oil and Minerals are reflected in Chapter 6
-8
-6
-4
-2
0
2
4
6
2001 2002 2003(est)
2004(est)
2005(proj)
GDP GrowthOilNon-Oil

Page 17
Yemen is a least developed country, with about 40% of the population living below the poverty level. Though its Human Development Index has been rising, the country still ranks 151st out of 177 countries. Following the stresses of unification and civil war, the country embarked on a period of rapid development in the mid 1990s, with GDP growth averaging around 7%. Starting in the late 1990s, a combination of external and internal factors negatively affected the country’s performance. Factors responsible for this include a decline in private investment, a slowdown in the implementation of structural reforms and modest external assistance. This occurred against the backdrop of terrorist incidents in Yemen, the events of 9/11 and the war in Iraq, which affected investor confidence. The situation has been improving since 2005 with the resumption of reforms in the areas of macroeconomic management, public finance management and civil service. The recently completed 3rd Five‐Year‐Plan was prepared as part of the effort to regain the development momentum.13 Table 2.1: Investment ‐ Figures
Indicator 2004 2005 No. of Investment Projects Licensed 362 333Industrial Projects 194 182Agricultural Projects 23 25Fishery Projects 9 8Service Projects 81 71Tourism Projects 55 47Total Inv. Value (Million YR)
114175 116060
Labor Force 10893 8866Source: Central Statistical Organization – Yemen in Figures, 2005 – published 2006 For more information on agriculture and fisheries, industry, energy and the GDP, reference is made to Annex 2.
13 Public Investment Program 2007‐2010, October 2006 – Ministry of Planning and International Cooperation (Working Document)

Page 18 Clean Development Mechanism – An Experience from Yemen
2.1.6. Political Profile The Republic of Yemen was established on May 22, 1990, when pro‐Western Yemen and the Marxist Yemen Arab Republic merged after 300 years of separation to form a new nation. The Republic is governed under the Constitution of 1991, amended in 1994 and 2001. The President is the Head of State and is elected by popular vote for a seven‐year term. The bicameral national legislature
consists of the House of Representatives, with 301 members who are popularly elected to six‐year terms, and the Shoura Council, with 111 members who are appointed by the President. The main political parties are the General People's Congress and the Islamic Reform Grouping or Islah Party (Yemeni Congregation for Reform). Differences over power sharing and the pace of integration between the North and the South came to surface in 1994, resulting in a civil war. The North's superior forces quickly overwhelmed the South in May and early June
despite the South's brief declaration of succession. The victorious North presented a reconciliation plan providing for a general amnesty and pledges to protect political democracy. The President, Ali Abdullah Saleh, was elected by the parliaments of both countries. He became Yemen's first directly elected President, winning more than 96% of the vote. Ali Abdullah Saleh has been President of modern Yemen ever since the date of reunification.14 On 20 September 2006 he was re‐elected with 77% of the vote. The President appointed the former Minister of Electricity, Ali Muhammad Mujawar as Prime Minister, under whom the new Cabinet was formed. The forming of the Cabinet is manifested in the Republican Decree No. 105/2007. 14 Wikipedia 11/2007

Page 19
3. The Kyoto Protocol The UN Framework Convention on Climate Change (UNFCCC), adopted in 1992 and entered into force on 21 March 1994, established an overall framework for intergovernmental efforts to address global climate change. The 191 Parties to the Convention agreed on the following:
‐ To gather and share information on greenhouse gas emissions, national policies and best practices;
‐ To launch national strategies for addressing greenhouse gas emissions and adapting to expected impacts, including the provision of financial and technological support to developing countries;
‐ To cooperate in preparing for adaptation to the impacts of climate change.15 At the 3rd Conference of the Parties (COP 3 ‐ in 1997), held in Kyoto, Japan, the parties adopted the Kyoto Protocol, which commits industrialized countries (defined as Annex I countries16) to attain legally binding GHG reduction targets during the period 2008 to 2012. The Kyoto Protocol shares the Convention’s objective, principles and institutions, but significantly strengthens the Convention by committing Annex I Parties17 to individual, legally‐binding targets to limit or reduce their greenhouse gas emissions. In 2001, at the COP 7 in Marrakech, Morocco, the Marrakech Accords were adopted, outlining detailed rules for the implementation of the Kyoto Protocol. The Kyoto Protocol entered into force on 16 February 2005. As of 23 October 2007, 175 countries and 1 regional economic integration organization (the EEC) have deposited instruments of ratification, accession, approval or acceptance. Table 3.1: The six greenhouse gases (GHGs) addressed under the Kyoto Protocol:
GHG Global Warming Potential CO2 1 CH4 21 N2O 310 HFCs 140‐11,700 PFCs 6,500‐9,200 SF6 23,900 These greenhouse gases are not equivalent in terms of their global warming potential (GWP), which measures the relative radiative effect of GHGs compared to CO2. For example, one ton of CH4 has a GWP as powerful as 21 tons of CO2. The quantified emission reduction commitments can either be achieved by domestic reductions or by the three innovative mechanisms under the Kyoto Protocol:
‐ Joint Implementation (JI): An Annex I Party may implement a project that reduces emissions or increases removals by sinks in the terrain of another Annex I Party, and count the resulting “emission reduction units” (ERUs) against its own reduction target.
15 www.unfccc.int 16 Reference is made to the Annex B of the Kyoto Protocol 17 Reference is made to the Annex B of the Kyoto Protocol

Page 20 Clean Development Mechanism – An Experience from Yemen
‐ Clean Development Mechanism (CDM): Annex I Parties may implement projects in non‐Annex I Parties that reduce emissions and use the resulting “certified emission reductions” (CERs) to help meet their own targets. The CDM also aims to help non‐Annex I Parties achieve sustainable development and contribute to the ultimate objective of the Convention.18
‐ International Emissions Trading (IET):19 An Annex I Party may transfer some of the emissions under its assigned amount, known as “assigned amount units” (AAUs), to another Annex I Party that finds it relatively more difficult to meet its emissions target. It may also transfer CERs, ERUs20 or RMUs21 that it has acquired through the CDM, joint implementation or sink activities in the same way. In order to address the concern that some countries could “over‐sell” and then be unable to meet their own targets, the Protocol rulebook requires Annex I Parties to hold a minimum level of AAUs, CERs, ERUs and/or RMUs in a “commitment period reserve” that cannot be traded.2
While the cost of limiting emissions varies considerably from region to region, the global benefit remains the same, independently where the action has been implemented. One of the aims of these outlined mechanisms is to lower the overall costs of achieving the respective emissions targets. The Marrakesh Accords provide for businesses, non‐governmental organizations and other entities to participate in the three mechanisms. 3.1. The Clean Development Mechanism Out of these three mechanisms, only the Clean Development Mechanism as defined in Article 12 of the Kyoto Protocol allows developed countries and developing countries (Annex I and non‐Annex I Parties) to work jointly in GHG emission reduction. The certified emission reductions generated by such project activities can be used by Annex I Parties to help meet their emissions targets under the Kyoto Protocol. The developing country will benefit through the sustainable development achieved through implementation of the project and in contributing to the ultimate objective of the Convention. It enables Annex I Parties to access cost‐effective opportunities to reduce emissions or to remove carbon from the atmosphere in developing countries. Non‐Annex I countries could gain access to significant additional flows of technology and finance to assist in achieving a more sustainable, less greenhouse‐intensive pathway of development. In summary the objective is to generate vital benefits in terms of foreign capital flows, technology transfer, and sustainable development as well as cost‐effective emission reduction credits. The current modalities and procedures for the CDM centre on activities reducing emissions. CDM project activities are required to reduce emissions below those emissions that would have occurred in the absence of the CDM project activity.22
18 www.unfccc.int 19 http://unfccc.int/kyoto_mechanisms/items/1673.php 20 Emission Reduction Unit 21 Removal Units 22 www.unfccc.int – Concept of Additionality

Page 21
3.2. Eligible project activities “The project activity is expected to result in a reduction in anthropogenic emissions by sources of greenhouse gases that are additional to any that would occur in the absence of the proposed project activity, […]23”, in other terms, CDM project activities must result in reducing or absorbing greenhouse gases that are real and measurable and should be additional to any that would occur in the absence of the project activity. An important element is that the CDM project activity contributes to environmental integrity and to the host country’s sustainable development goals. The participation in a proposed CDM project activity has to be voluntary. For the CDM to be a dynamo for promoting host countries’ sustainable development, the importance is to ensure synergies with other policies and programmes as part of the overall sustainable development process of the country. Several host countries provide information on their requirements – often referred to as “sustainable development criteria”. Reference is made to Chapter 4 for more information. Overview on exclusions from admission to the CDM:
‐ CDM activities shall not result in a diversion of official development assistance (ODA); ‐ Emission reductions from nuclear facilities; ‐ Type of sequestration activities other than afforestation and reforestation; ‐ Creating an infrastructure (e.g. testing labs, creating of an enforcement agency) or capacity
to enforce the policy or standard – only eligible when these directly attribute to measurable emission reduction.
3.3. The CDM Project Cycle To ensure that CDM project activities lead to real, measurable and long‐term emission reductions, a complex system of rules and institutions has been set up, which is unique in its degree of scrutiny.24 Emission credits generated by CDM projects, as already outlined above, are called certified emission reductions (CERs). One ton of CO2 reduction equals one certified emission reduction. These CERs only build up after independent verification through so‐called “Designated Operational Entities” (DOEs),25 which are mostly commercial certification companies. These DOEs have two functions; (i) validation and subsequently requesting registration of a proposed CDM project activity which will be considered valid after 8 weeks if no request for review was made, and (ii) verification of emission reduction of a registered CDM project activity, verification as appropriate and requesting the CDM Executive Board (CDM EB26) to issue CERs accordingly. An elaborate “project cycle” is overseen by the CDM EB, whose 10 members and 10 alternates are elected by the UNFCCC Conference of the Parties (COP). The role of the CDM EB is outlined in the Decision 3/CMP.1.27 The CDM Executive Board supervises the CDM under the Kyoto Protocol and prepares decisions for the COP/MOP28. It
23 FCCC/CP/2001/13/Add.2 24 The complete set of rules is available at the official CDM website of the United Nations: http://cdm.unfccc.int 25 An up‐to‐date list of accredited DOEs is available at: http://cdm.unfccc. int/DOE 26 In context also often shortened to EB 27 http://cdm.unfccc.int/EB/background.html 28 MOP = Meeting of Parties to the Kyoto Protocol

Page 22 Clean Development Mechanism – An Experience from Yemen
undertakes a variety of tasks relating to the day‐to‐day operation of the CDM. The EB sets the definitions of CDM rules, which have to be often confirmed by the COP, like decision on baseline methodologies, definition of terminology, fees of registration and issuance of CERs. The EB may establish committees, panels or working groups to assist in the performance of its functions (in operation: Accreditation Panel, Methodologies Panel, Afforestation and Reforestation Working Group, Small Scale Working Group, CDM Registration and Issuance Team). For an outline of CDM related bodies reference is made to Annex 1. The EB has to ensure that projects conform to the rules and formally register them.29 The tasks of the CDM EB are further the accreditation of validators and verifiers, registration of projects and issuance of CERs, and the administration of the CDM website. The last months have seen an increased level of scrutiny executed by the CDM EB. Thereby the EB wants to ensure that the high level of environmental integrity remains standard. Any institutional arrangement is applicable for CDM projects. Buyers of CERs can be as diverse as multilateral funds, bilateral funds, brokers and private entities. CERs can be generated through activities undertaken jointly by developed and developing countries; or through unilateral efforts by developing countries that generate CERs available for sale on the open market. This is helped by the full inter‐changeability of CERs with other types of emission rights under the Kyoto Protocol. All countries wishing to undertake CDM activities ‐ both host and investor countries ‐ are required to appoint a Designated National Authority (DNA). One of the key tasks of the DNA is to establish an efficient and transparent national CDM project approval procedure for the evaluation of project ideas submitted to the authority and in particular to verify whether the project contributes to the host country’s sustainable development goals. The Marrakech Accords (Decision 4/CP.7) state:” […] it is the host Party’s prerogative to confirm whether a clean development mechanism project activity assists in achieving sustainable development.” The definition of these criteria which lead to an approval or a rejection of a project is the responsibility of the host country. In accordance with provisions of paragraphs 37 (a) and 40 (a) of the CDM modalities and procedures, the registration of a proposed CDM project activity can, however, only take place once approval letters are obtained from Parties to the Convention that have ratified the Kyoto Protocol through their respective DNAs.30 Projects can have a lifetime (“crediting period”) of ten or three times seven years. Project participants have to choose the starting date of a crediting period to be after the date the first emission reductions are generated by the CDM project activity. A crediting period shall not extend beyond the operational lifetime of the project activity.31 32 The CDM project cycle involves a series of eight major steps, before certified emission reductions can be issued.
o Step 1: CDM project formulation: To facilitate the process and the discussion project developers outline their idea in a simplified format, commonly known as project idea note (PIN). A PIN provides a brief overview on the envisaged CDM activity. It provides information on the estimated CERs, baseline and monitoring
29 The meeting reports of the EB are available at http://cdm.unfccc. int/EB 30 For more details refer to www.unfccc.int 31 www.icontec.org.co/Contents/MDL/Glosarioingles.pdf 32 CDM Programme of Activities (PoA) is not outlined here and suggestion is made to the relevant section of the UNFCCC web page.

Page 23
methodologies to be employed and an estimation of costs required for investment. Some host country governments provide specific templates for outlining the project idea. Importance shall be given to seek information of relevance from the concerned DNAs on their specific requirements and procedures of approval. This should be taken into consideration when developing the PIN. It is important for a developer to consider whether the planned project activity will assist the sustainable development of the Non‐Annex I country and that the planned project is additional. Some DNAs offer to assess the developed PIN and when it passes, a Letter of Endorsement (Letter of No Objection) will be issued. It may also be the first entry point in the project approval process as required by the host country. This letter provides the project developers with a first judgment whether the project would fulfill the requirements as set by the host country and thereby assists in limiting the project risks.
o Step 2: Development of the Project Design Document: The Project Design Document (PDD) is the document required for validation, registration and verification of the project and provides a detailed description and specification of the proposed CDM activity. It includes in‐depth information of the project, baseline methodology, justification of additionality, duration of the project, the monitoring methodology and plan, calculation of GHG by sources, environmental impacts and the comments provided by stakeholders. The PDD‐format has to be downloaded from the website of the UNFCCC CDM33. The PDD needs to be filled following the guidelines provided by the CDM EB. At present several different formats are available for download subsequently to project categories34:
‐ CDM Project Design Document (CDM‐PDD) ‐ AR: CDM Project Design Document for AR (CDM‐AR‐PDD) ‐ SSC: CDM project design document for small‐scale activities (CDM‐SSC‐PDD) ‐ SSC AR: Project Design Document Form for small‐scale afforestation and reforestation
project activities (CDM‐SSC‐AR‐PDD) Often also an environment impact assessment (EIA) is required by the host country.
o Step 3: Host Country Approval (and DNA approval of Annex I country) A host country approval is an important prerequisite for project registration with the CDM EB. The project developer needs to obtain from the DNA of the host country a Letter of Approval (LoA). In the LoA the country confirms having ratified the Kyoto protocol, the participation of the entity requesting approval is voluntary and the project meets the national sustainable development criteria. The host country DNAs have different approval processes and requirements to be followed. If an Annex I Party is involved in the CDM activity, the respective DNA must also issue a LoA. A list of DNAs, its focal points and when available the DNA websites can be found under: http://cdm.unfccc.int/DNA/index.html.
o Step 4: Validation Validation is an independent third party evaluation by a Designated Operational Entity (DOE) of the project design. The objective of which is to assess: “In particular, the project's baseline, the monitoring plan (MP), and the project’s compliance with relevant UNFCCC and host party criteria shall be validated in order to confirm that the project design as documented is sound and reasonable and meets the identified criteria. Validation is a requirement for all CDM projects and is
33 http://cdm.unfccc.int 34 http://cdm.unfccc.int/Reference/PDDs_Forms/PDDs/index.html

Page 24 Clean Development Mechanism – An Experience from Yemen
seen as necessary to provide assurance to stakeholders of the quality of the project and its intended generation of certified emission reductions (CERs).”35 A DOE is either a domestic legal entity or an international organization accredited and designated, on a provisional basis until confirmed by the COP/MOP, by the EB.36 The project developer needs to engage one of the accredited DOEs. A list of accredited DOEs as well as their sectoral scopes37 can be obtained from: http://cdm.unfccc.int/DOE/list/index.html. The DOE will charge for the services provided. The DOE assesses whether the project meets the requirements of the CDM as set out in decision 17/CP.7, the present annex and relevant decisions of the COP/MOP, on the basis of the PDD.38 The DOE will be using the “Validation and Verification Manual”39 to evaluate the PDD. Particularly the DOE will assess the following:
‐ The PDD follows the CDM requirements; ‐ The methodology used is suitable and applied correctly; ‐ The GHG emission reduction proofs to be additional; ‐ The calculations are accurate and assumptions correct and conservative; ‐ EIA has been implemented in accordance to the requirements of the host country; ‐ The LoA(s) and relevant documentation have been issued.40
The tasks accomplished by the DOE are normally in form of a desk review; however the DOE can also visit the project site. The PDD is made available for public consultation on the UNFCCC web page over a period of 30 days by the DOE. If comments arise, the DOE has to describe in detail how the comments were taken into account in the validation process. As a next step the DOE issues either a pre‐validation report through which the project developer is requested to look into outstanding issues needed to be accomplished before the final validation report is prepared for submission to the EB or the validation report.
o Step 5: Registration The DOE submits the final PDD, the validation report, the LoA(s) and a justification how the comments received were taken into consideration, to the EB for registration of the project. A project is registered within four weeks (for large scale projects: eight weeks) upon submission if no objections from EB members are raised. The EB may approve the project for registration, may request a review of the project or reject the project. Three or more EB members can call for a review, which has to be completed by the EB within 30 days. The CDM Registration and Issuance Team (RIT) assists the EB by appraising requests for registration. For registration an administrative fee has to be paid based on the estimated annual CO2e emission reductions. EB 23 Report Annex 35 shows the revised registration fee as follows: “[…]. The revised registration fee shall be the share of proceeds applied to the expected average annual emission reduction for the project activity over its crediting period. [..] The maximum registration fee payable based on this calculation shall be USD 350,000. [..] No registration fee has to be paid for CDM project
35 IETA/PCF (2004): VVM Working Group: Validation and Verif ication Manual V4 36 http://cdm.unfccc.int/DOE/index.html 37 List of sectoral scopes: Energy industries (RE/non‐RE), energy distribution, energy demand, manufacturing industries chemical industry, construction, transport, mining/ mineral production, metal production, fugitive fugitive emissions from production and consumption of halocarbons and sulphur hexafluoride, solvents use, waste handling and disposal, afforestation and reforestation, agriculture 38 http://cdm.unfccc.int/Projects/pac/howto/CDMProjectActivity/index.html 39 www.vv‐manual.org 40 UNDP (2006): An Assessment of Progress with establishing the Clean Development Mechanism

Page 25
activities with expected average annual emission reduction over the crediting period below 15,000 t CO2 equivalent. [..] The registration fee shall be deducted from the share of proceeds for administrative expenses. In effect, the registration fee is an advance payment of the SOP‐Admin for the emission reductions achieved during the first year. If an activity is not registered, any registration fee above USD 30,000 shall be reimbursed.”41 Further are project participants requested to submit a statement signed by all project participants providing the modalities of communicating with the EB. The information of a contact person has to be provided as all communication will be channeled through the contact person.
o Step 6: Implementation & Monitoring The necessary data to quantify for the actual emission reductions achieved by the project has to be collected by the project participants. Relevant data necessary for estimating/measuring/calculating anthropogenic emissions by sources of GHG occurring within the project boundary during the crediting period has to be collected and archived. The monitoring has to follow the monitoring plan as outlined in the PDD. The monitoring reports will be submitted to a DOE according to a time schedule as also specified in the PDD.42
o Step 7: Verification and Certification Verification is the independent review of the monitoring and reporting of the actual GHG reductions by a DOE. The developer is free in its choice of the verification intervals. The DOE certifies the authenticity of the report provided. The DOE develops the verification and certification reports for submission to the EB. In the latter the verified amount of GHGs emission reductions is stated. For small‐scale projects, the same DOE can be chosen which was engaged for the validation (Step 4).
o Step 8: Issuance of CERs Once the EB receives the certification report the CERs are issued within 15 days unless a review is required. The CERs will be transferred into the accounts of the projects participants as outlined in the PDD. The net amount (CERs – adaptation fee, which amounts to 2% of the CERs issued and administrative expenses) is placed in the account of the CDM registry under the supervision of the EB. The administration fee is calculated as follows: US$ 0.10 per CER for the first 15.000 CERs per year and US$ 0.20 for additional CERs issued for that period. Least Developed Countries are exempted from the adaptation fee.
41 EB 23 Report Annex 35 42 UNDP (2006): An Assessment of Progress with establishing the Clean Development Mechanism

Page 26 Clean Development Mechanism – An Experience from Yemen
Figure 3.1: Flow Chart – CDM Project Cycle
CDM Project Formulation Project Idea Note (PIN)
Development of the Project Design Document (PDD)
DNA Approval
Validation
Registration
Implementation & Monitoring
Verification and Certification
Issuance of CERs
Responsibility of Project Proponent
Responsibility of Project Proponent
Responsibility of Project Proponent & DNA
Responsibility of DOE
Responsibility of EB
Responsibility of Project Proponent
Responsibility of DOE
Responsibility of EB

Page 27
3.4. The Baseline To calculate the amount of CERs of a project, a baseline for a CDM project activity has to be defined. The establishment of the baseline of a project is a central component when designing a CDM project. The baseline sets the level that reasonably represents the anthropogenic emissions by source of GHG that would occur in the absence of the proposed project activity. It shall cover emissions from all gases, sectors and source categories listed in Annex A of the Kyoto Protocol within the project boundary. One key element is to verify whether the project is “additional”, e.g. the project would not have happened anyway. If business‐as‐usual projects would be approved, the CERs will create fictitious emission reductions. The project developer also needs to assess whether there is a “leakage” in the proposed CDM activity. Leakage is defined as the net change of anthropogenic emissions by sources of greenhouse gases which occurs outside the project boundary, and which is measurable and attributable to the CDM project activity.43
43 UNFCCC‐EB: Glossary of CDM terms (Version 02)
INFOBOX: Further, the CDM EB outlines the following: Leakage (SSC): Leakage is defined as the net change of anthropogenic emissions by sources of greenhouse gases (GHG) which occurs outside the project boundary, and which is measurable and attributable to the CDM project activity. Reductions in anthropogenic emissions by sources shall be adjusted for leakage in accordance with the provisions of Appendix B for the relevant project categories. The Executive Board shall consider simplification of the leakage calculation for any other project categories added to Appendix B. See “Appendix B”. In the cases where leakage is to be considered, it shall be considered only within the boundaries of non‐Annex I Parties. Leakage for A/R project activities (A/R ‐ SSC A/R): Leakage is the increase in GHG emissions by sources which occurs outside the boundary of an A/R CDM project activity which is measurable and attributable to the A/R CDM project activity; To be applied mutatis mutandis to SSC A/R ‐ Leakage for SSC A/R project activities. Long‐term certified emission reductions (lCERs) (A/R ‐ SSC A/R) A long‐term certified emission reduction or lCER is a unit issued pursuant to Article 12 of the Kyoto Protocol for an A/R CDM project activity, which expires at the end of the crediting period of the A/R CDM project activity under the CDM for which it was issued. It is equal to one metric ton of carbon dioxide equivalent. Where project participants have chosen the lCER approach to address non‐permanence, a request to the Executive Board has to be made for issuance of lCERs equal to the verified amount of net anthropogenic GHG removals by sinks achieved by the A/R CDM project activity since the previous certification. To be applied mutatis mutandis to SSC A/R ‐ Long‐term certified emission reductions (lCERs).30/43

Page 28 Clean Development Mechanism – An Experience from Yemen
Figure 3.2: The principle of CDM
Source: Modified from www.iges.org
Baseline scenario
Non‐Annex I Country
CERs
Proposed project scenario
CERs
Annex I Country
A total emission cap of Annex I Party

Page 29
There are several methods to define the baseline scenario. One can i) propose a new methodology to establish the baseline scenario, ii) use a standardized methodology (consolidated methodologies) or iii) already approved methodologies as outlined in 3.6. If a new methodology is proposed, the project developers have to submit a baseline methodology proposal to the EB. The Methodology Panel will evaluate the proposed methodology with the assistance of independent experts. 3.5. Additionality As already outlined above, additionality is a crucial aspect in the CDM. Additionality is the justification of a CDM project activity not being the baseline scenario. It is recommended to refer to the tool for the demonstration and assessment of additionality (version 03) EB 2944.
44 http://cdm.unfccc.int/Reference/Guidclarif/index.html

Page 30 Clean Development Mechanism – An Experience from Yemen
Figure 3.3: Project Assessment
Source: Tool for the demonstration and assessment of additionality (version 03) – EB 29 (www.cdm.unfccc.int)

Page 31
3.6. Baseline and monitoring methodologies for the different types of CDM project activities As of today 107 methodologies have been approved45. It is up to the project developer to use an already existing methodology, to modify an existing methodology or to develop a new methodology. The latter two may be time consuming, and when developing a new methodology also quite some financial investment needs to be taken. Hence it can be time consuming, costly and there is a risk whether approval will be provided at the end. The following provides an overview of the methodologies for establishing baseline and emissions and monitoring emission reductions achieved by CDM projects.
3.6.1. CDM project activities – large scale As can be seen in Annex 3, 51 methodologies have been approved46 for large scale projects. Also several more are under consideration or have been either not approved or have been withdrawn. To date there are 12 approved consolidated methodologies47 (Annex 3)
3.6.2. Small‐scale CDM Projects In order to facilitate and encourage the development of small‐scale CDM project activities the EB has established simplified procedures aiming at minimizing transaction costs associated with the preparation and implementation of a CDM project activity. As per Decision ‐/CMP.2 these are as follows:
‐ The usage of a simplified project design document; ‐ Simplified methodologies for baseline determination and monitoring plans; ‐ Project activities may be bundled or portfolio bundled at these stages within the project
cycle: the PDD, validation, registration, monitoring, verification and certification; ‐ Simplified provisions for environmental impact analysis; ‐ Revised registration fee calculation; ‐ A shorter review period for the registration of SSC CDM project activities (4 weeks instead of
8 weeks, unless there is a request for review); ‐ The same DOE can validate as well as verify and certify emission reduction for a specific SSC
CDM project activity.48 A project activity qualifies under small‐scale CDM when it meets one of the three following conditions:49 Type (i) project activities: renewable energy project activities with a maximum output capacity equivalent to up to 15 megawatts (or an appropriate equivalent); Type (ii) project activities: energy efficiency improvement project activities which reduce energy consumption, on the supply and/or demand side, with a maximum output of 60GWh per year (or an appropriate equivalent);
45 Status: November 2007 46 Status: November 2007 47 Status: 01.12.2007 48 www.cdm.unfccc.int 49 www.cdm.unfccc.int ‐ Decision‐/CMP.2

Page 32 Clean Development Mechanism – An Experience from Yemen
Type (iii) project activities: otherwise known as other project activities, shall be limited to those that result in emission reductions of less than or equal to 60 ktCO2 equivalent annually. Attractive features which can be considered under small scale are bundling and debundling. When a small‐scale project is too small in order to be attractive for investment, a number of small‐scale projects can be aggregated (=bundled). A bundle is defined as: “Bringing together of several small‐scale CDM project activities, to form a single CDM project activity or portfolio without the loss of distinctive characteristics of each project activity. Project activities within a bundle can be arranged in one or more sub‐bundles50, with each project activities retaining its distinctive characteristics. Such characteristics include its: technology/measure; location; application of simplified baseline methodology. Project activities within a sub‐bundle belong to the same type. The sum of the output capacity of project activities within a sub‐bundle shall not exceed the maximum output capacity limit for its type.”51 Several small‐scale CDM project activities may be bundled for the purpose of validation. An overall monitoring plan that monitors performance of the constituent project activities on a sample basis may be proposed for bundled project activities. If bundled project activities are registered with an overall monitoring plan, this monitoring plan shall be implemented and each verification/certification of the emission reductions achieved shall cover all of the bundled project activities. Further, it needs to be noted that a single DOE can implement validation and verification and certification for a small‐scale CDM activity or bundled small‐scale CDM project activities. There is no limit to the number of projects bundled, however the total size of each sub‐bundle must not exceed the limit as provided for its small‐scale project type. Small‐scale projects can be bundled but one cannot debundle a large scale project into smaller size projects in order to take advantage of the specific rules for small scale projects. Reference is made to Annex 3 for a list of approved small‐scale methodologies.
3.6.3. Afforestation and Reforestation Afforestation and reforestation (A/R) qualify as CDM projects when removing carbon from the atmosphere. However, in the first commitment period, sequestration in agricultural crops and soils is not eligible under the CDM. The project developer needs to provide evidence: i) that the land being utilized was not forested for at least 50 years (“afforestation”) through planting, seeding, and/or the human‐induced promotion of natural seed sources; or ii) was converted to other uses before 31.12.1989 (“reforestation”). For A/R CDM projects, “forests” consist of trees with at least a height of 2 to 5 m, crown density from 10 to 30%, and an area from 0.05 to 1 ha. Countries must choose values for these parameters and determine a minimum width of a “forest”. Since the Protocol does not provide a definition for “tree”52; fruit trees, bamboos, and palms may qualify. A/R can consist of assisted natural succession to trees, productive and protective plantations, agroforestry, and urban forests. For the purpose of CDM, trees in a landscape may or may not reach the chosen threshold for crown density of a
50 As per definition a subbundle is a cluster of project activities within a bundle having the characteristics that all project activities within a sub‐bundle belong to the same type (Type I, ii or iii). 51 FCCC/CP/2002/7/Add.3 – Annex II 52 Tree according to FAO‐GFRA 2000: A woody perennial with a single main stem, or in the case of coppice with several stems, having a more or less definite crown”. “Woody” is used although some monocotyledons do not contain “wood”.

Page 33
“forest”, depending on crown cover and project boundaries. Enrichment planting in degraded forests or forest rehabilitation does not qualify as “reforestation”.53 Special small‐scale A/R projects with simplified rules are set to meet the needs of low‐income communities and individuals, and are defined as “those that are expected to result in net anthropogenic greenhouse gas removals by sinks of less than 8 kilotons of CO2 per year and are developed or implemented by low‐income communities and individuals as determined by the host Party.”54 However if the net anthropogenic GHG removals by sinks are greater than 8 kilotons of CO2/year, the issuance of credits will not be approved. Up to date 10 methodologies have been approved by the EB (Annex 3)55. For small‐scale reference is made to Annex 3.
53 FAO – Fact Sheet: Afforestation and Reforestation Projects under the Clean Development Mechanism of the Kyoto Protocol: www.fao.org/forestry/webview/media?mediaId=8953&langId=1 54 www.unfccc.int ‐ FCCC/SBSTA/2007/MISC.1 55 Status: 02.12.2007

Page 34 Clean Development Mechanism – An Experience from Yemen
3.7. Programme of Activities Reality has shown that many project activities which are small in size and comparatively high in transaction costs, geographically dispersed or with several different owners have been unable to enter the project pipeline as single projects. Since 2007 corresponding rules and procedures are in place for what is referred to as Programme of Activities (PoA). The PoA is a new instrument aiming to open a path for a greater variety of projects. It is broadening the scope of the CDM within the existing regulatory framework of the Marrakech Accords. A PoA coordinates and implements policies, measures or stated goals that direct to a reduction of GHG emissions. The PoA serves as umbrella under which individual CDM project activities (CPAs) may be developed. Figure 3.4: PoA – CPAs Project activities under a PoA can be registered as a single CDM project activity provided that approved baseline and monitoring methodologies are used to, inter alia, define the appropriate boundary, avoid double counting, account for leakage, and ensure that the emission reductions or net anthropogenic removals by sinks are real, measurable and verifiable and additional to any that would occur in the absence of the project activity.56 The physical boundary can be extended beyond the political boarders of a country. Every PoA requires a coordinating entity – public or private – which ensures the compliance of CPAs under the overall PoA. In the terms of additionality it needs to be demonstrated that in the absence of the CDM, the proposed voluntary measure would not be implemented, or the mandatory policy/regulation would be systematically not enforced and that noncompliance with those requirements is widespread in the country/region in the case of crossing borders. Or else that the PoA will lead to a greater level of enforcement of the existing mandatory policy/regulation.
56 In accordance with paragraph 20 of decision 7/CMP.1 and the guidance provided by the CDM Executive Board at its thirty‐second meeting (Annex 38 of EB 32 Report).
PoA: implements any policy, measure or stated goal
CPA CPA CPA
CPA
… CPA – operational level

Page 35
One methodology will be used and applied at the CPA level. Any approved methodology can be utilized or a new methodology can be developed. The duration of a PoA is 28 years for non‐forestry and 60 years for forestry projects. The baseline and methodology will be checked every 7 years and the changes apply to all CPAs at the first renewal. For registration of a PoA the coordinating entity has to develop a design document which sets the structure of the PoA. Figure 3.5 provides an overview of potential “prototype” CPAs. Figure 3.5: Potential CPAs
Single technology in a
single location
CPA
or
Several measures in a
single location
CPA
Several measures inside an area
CPA
Single technology inside an area
CPA
PoA: implements any policy, measure or stated goal
CPA CPA CPA
CPA
… CPA – operational level

Page 36 Clean Development Mechanism – An Experience from Yemen
The CPAs can be implemented by many entities/owners and a new CPA can be added at any time to the umbrella PoA. However, when the PoA ends all CPAs must terminate. The CPAs are all identical to one another, based on one methodology and are monitored as per the monitoring plan of the chosen methodology. Therefore, the definition of the PoA is critical as it defines the further process and remains in place also when along the way more CPAs are added. When going for registration one needs to develop the Programme of Activities Design Document (CDM‐PoA‐DD) as the umbrella, hence setting a framework for the implementation of the PoA, further, the Project Activity Design Document (CDM‐CPA‐DD) which is specific for the PoA and acts as a blueprint, and one completed CDM‐CPA‐DD which is based on the first real case project activity. When a subsequent CPA is added and the CDM‐CPA‐DD is submitted it will be automatically included in the registered PoA. No additional validation and registration is needed. However, if a
DNA involved in the PoA or a Member of the EB identifies any error that disqualifies a CPA from inclusion in the PoA, the CPA has to be excluded and cannot be taken again into consideration whether for this PoA, a different PoA or as a single CDM project. The DOE having included this CPA, has to transfer an amount of reduced tons of CO2 in equivalence to the amount of CERs issued to the PoA as a result of the CPA having been erroneously included, to a cancellation account operated by the EB.57
57 The relevant formats and guidance documents can be obtained from: http://cdm.unfccc.int/ProgrammeOfActivities/index.html

Page 37
4. Structure of Yemen’s DNA 4.1. Background – Process of Establishment On June 12, 1992 Yemen signed the Framework Convention of UNFCCC which was ratified 4 years later, on February 21, 1996. The Republic was the first of the oil exporting countries of the Arabian Peninsula to ratify the Kyoto Protocol (September 15, 2004). The Yemeni DNA was established by a Ministerial Decree in August 2003. In accordance with the modalities and procedures of the Clean Development Mechanism (CDM) (Decision 3/CMP.1) Yemen has designated the national authority for the CDM and registered it with the UNFCCC. Despite the early notification of the DNA to the UNFCCC Secretariat, even before its ratification of the Kyoto Protocol, a mix of factors, including lack of understanding of the requirements of the CDM, limited financial resources for training and allocating Government personnel for project review, and an absence of technical assistance from the donor community prevented the development of the institutional framework, definition of approval criteria or allocation of staff. Therefore, regardless of its early involvement on the international level, the CDM in Yemen had been progressing at a very slow pace. Relatively little emphasis had been given, to effectively access the CDM and to realize the full potential development benefits for Yemen as a host country. The underlying causes can be recaptured as follows:
• Lack of understanding of CDM procedures and rules; • Lack of a full‐time champion to govern the day‐to‐day activities; • Lack of financial sustainability to govern day‐to‐day operations; • Lack of awareness at stakeholder level; • Insufficient capacity; • Inadequate level of resources available to perform its functions efficiently and effectively.
However, in order for host countries, like Yemen, to fully embrace the CDM as a tool for sustainable development, they must be empowered to be equal partners in negotiations with developed countries and the private sector. A critical element of the solution lies in capacity development and institutional strengthening to address limitations. An effective national institutional structure is necessary to attract investors and harness the CDM’s potential. Since mid‐2006, the country is facing a steep learning curve. This was triggered by the following factors: a) Full political support; b) The involvement of a half time champion actively engaged in cooperation with the Head of the Climate Change Unit; c) Capacity building assistance provided by the United Nations Development Programme (Project: Institutional Capacity Development for the Clean Development Mechanism (CDM) in Yemen, duration: February 2006 – November 2007); d) Capacity building assistance provided by the Centrum für internationale Migration und Entwicklung by supporting an international expert; e) The support provided through the capacity building programme by the World Bank under CF Assist Program (from May 2007).

Page 38 Clean Development Mechanism – An Experience from Yemen
First key issue for the Government of Yemen was the establishment of a proper functioning DNA as a prerequisite for participation in the CDM. Procedures and sustainability criteria for the assessment and approval of proposed CDM activities were needed to be developed and approved. Within 12 months the following steps were taken to ensure the establishment of the relevant institutional framework guiding the DNA and to build up relevant national capacity to direct the CDM process in Yemen: ‐ Step: Development of an institutional and organizational framework for the DNA to be fully
operational: For the purpose of establishing the DNA, as a first step CDM capacity‐building activities were carried out, bilaterally with the line‐ministries and through workshops which were attended by representatives of the Government, the private sector and NGOs. Here the focus was to engage a wide variety of different stakeholder groups and to make this process as transparent as possible. The inclusion of a broad range of stakeholders facilitated greater participation and support for the development of the institutional framework for the CDM. The bilateral meetings with the main stakeholders had the dual aim: i) to establish local capacity; and ii) to perceive how and where they see their role in the CDM process and how this can be interpreted into the institutional and organizational structure.
The consultations have resulted in the preference for a slim DNA structure, consisting of an inter‐ministerial “DNA committee”, the DNA Board, responsible for final decision‐making and the DNA Secretariat, the “operational unit” conducting day‐to‐day activities, including project evaluation. Further the conclusion was that the board should consist of 9 officials at the higher political level (deputy ministers/CEOs). The preference was for the board to be chaired by the Minister of Water and Environment and to have one vice chair – the Chairman of the Environment Protection Authority. During this process it was agreed upon to have ministries/entities represented in the Board which are mandated with sectors having a relevant CDM project potential (see short assessment of project potential in Chapter 6). This allows for an informed evaluation of projects submitted to the DNA. The following entities were called upon: the Ministry of Planning and International Cooperation, the Ministry of Oil and Minerals, the Ministry of Electricity, the Ministry of Industry and Trade, the Ministry of Public Health and Population and the Ministry of Local

Page 39
Administration as well as the General Investment Authority and on an ad‐hoc basis the representative(s) of the Government(s) where the project is located.
The conclusions achieved during the workshops and various meetings58 were reflected in a first draft of the Prime Minister’s Resolution, entitled: “Regarding the establishment of a Designated National Authority (DNA) for approval of projects under the Clean Development Mechanism (CDM) of the Kyoto Protocol.”
This draft was broadly circulated to all Ministries, several NGOs and the private sector for comments. The comments received were reflected in the draft version. A local lawyer ensured its coherency with the Yemeni legal system. In the next step the Ministers and Deputy Ministers of the line Ministries were invited and the draft resolution was presented. Comments received were again reflected in the resolution. This version was sent once again to all parties involved for approval before it was presented to the
Cabinet. The aim of this intense process was to ensure the acceptance of all parties involved and thereby building up ownership. The Cabinet approved on 24 January 2007 the Prime Minister’s Resolution No. (238) regarding the establishment of a Designated National Authority (DNA) for approval of projects under the Clean Development Mechanism (CDM) of the Kyoto Protocol.
58 A full list of workshops and bilateral meetings can be obtained from the Yemeni CDM web page – www.cdm‐yemen.org

Page 40 Clean Development Mechanism – An Experience from Yemen
The time period from the submission to and until the approval was given by the Cabinet was two months, a record breaking approval process, which represents the high level of interest the Government is showing in this subject.
This Prime Minister’s Resolution provides for the institutional and legal frame for the DNA. It regulates elements like the composition and tasks of the DNA Board and the requirements for the DNA Secretariat. ‐ Step: Development of national rules for project eligibility, submission and approval. As the Prime Minister’s Resolution provides for the regulative frame and defines the bodies involved it was requested to develop a Ministerial Decree regulating in detail the evaluation and approval process. Several workshops and bilateral meetings were held to define the structure. The endeavor was to ensure its coherency with the existing legal system, to call for an effective and transparent environment for fulfilling the role of a host country and being broadly accepted. The conclusions achieved in the course of this process were reflected in a first draft of a Ministerial Decree, entitled: “Regarding the Rules and Procedure of the Designated National Authority for approval of projects under the Clean Development Mechanism of the Kyoto Protocol of the Republic of Yemen.” The draft was broadly circulated to all Ministries, several NGOs and the private sector for comments. The comments received were reflected in the draft version. A local lawyer ensured its coherency with the Yemeni legal system. In the next step the Ministers and Deputy Ministers of the Ministries represented in the DNA Board were invited and the draft decree was presented. The decree was endorsed by the representatives. It was signed by the Chair of the DNA Board. The Ministerial Decree regulates elements like the decision on criteria and indicators for sustainable development, process of endorsement, the format of the Project Idea Note, the timeline for the approval process, voting procedures, invitation for public comments, issuance and content of the approval letter and the location of the DNA Secretariat. The Chair of the DNA Board invited the Board Members to nominate CDM focal points within their entities. These focal points facilitate information transfer and are on a technical working level the direct counterparts to the DNA Secretariat. To facilitate their operation, specific capacity building was provided.

Page 41
‐ Step: Definition of sustainable development goals. The definition of the national sustainable development criteria are an important prerequisite for the project’s eligibility to the CDM. Guidance is given by the purpose of the CDM as defined in Article 12 of the Kyoto Protocol. Which is: ‐
i. to assist developing country Parties to the Kyoto Protocol (non‐Annex I Parties) in achieving sustainable development, thereby contributing to the ultimate objective of the Convention; and
ii. to assist developed country Parties to the Kyoto Protocol (Annex I Parties) in achieving compliance with part of their quantified emission limitation and reduction commitments under Article 3.
The established way of measuring the sustainability of CDM interventions is through the use of sustainability indicators. The criteria are operationalised by using quantitative and qualitative indicators which allow a clear evaluation of potential CDM projects. The challenge was to transfer this definition into a national idiom without creating alien parallel structures. Yemen’s medium‐ and long‐term economic development depends to a large extend on the appropriate and sustainable management of the natural resources in the country. Parallel to environmental destruction environmental concerns have risen and the Government of Yemen has taken an increasingly active management role, in particular since the unification in 1990. Over the past decade, the protection of the environment has been given a priority attention by the Government. A reality which is also manifested in Article 35 of the Constitution: “The protection of the environment is the responsibility of the state and society, and it is a national and religious obligation for every citizen.” Domestically there is general agreement that sustainable development requires the effective integration of three key elements: the economic, social and environmental dimensions of development. Generally speaking any policy pursuing sustainable development needs to:
o ensure economic development; o improve rational use of natural resources; o preserve the ecosystem’s functions; o enhance social well‐being.

Page 42 Clean Development Mechanism – An Experience from Yemen
A number of inter‐ministerial meetings and workshops were held within the course of 12 months with the aim of determining a relevant set of national sustainable development criteria and indicators. The incorporation of NGOs, academia, lending institutions, and business groups proved to be a vital instrument. The stakeholders in the process were aware of the need to have clearly defined sustainable development criteria. It was helpful to categorize the criteria based on the three key elements of development; and to operationalise their assessment by the means of indicators which allow for an
objective evaluation. The consensus was that the dimensions of development are strictly dependent on the country’s own definition and interpretation of sustainable development. The approach was to the derive the criteria from the relevant policy documents such as Yemen’s Strategic Vision 2025, the Five‐Year Plan (FYP), the Poverty Reduction Strategy Paper (PRSP), the National Environmental Action Plan (NEAP), the National Strategy for Environmental Sustainability (draft: Status: October 2007) and the National Water Sector Strategy and Investment Program (2005‐2009). The result was the definition of Yemen specific criteria and indicators for assessing the contribution of a CDM project to sustainable development. The draft was circulated to all Board Members for comments and approval. Comments received were fully reflected and the indicators and criteria were endorsed. Details are outlined in Chapter 5. 4.2. The DNA Secretariat The DNA Secretariat is associated with the Department of Climate Change and thereby also with the National Focal Point of the United Nations Framework Convention on Climate Change. The DNA Secretariat is the national contact point for CDM activities in Yemen. The office is located within the premises of the Environment Protection Authority (EPA), which is a subordinate body to the Ministry of Water and Environment. The DNA Secretariat is assigned with the following tasks:
• Day‐to‐day activities of the DNA including constituting committees or sub‐groups to coordinate and examine the proposals or to get detailed examination of the project proposals.
• Coordinates the work of the DNA Board. • Provides an assessment whether documentation submitted by project developer fulfils the
criteria for SD as defined by the DNA Board. • Liaises with stakeholders. • Maintains the Yemeni CDM website: www.cdm‐yemen.org.
The DNA Secretariat has no approval authority, as this authority is with the DNA Board.

Page 43
4.3. The DNA Board Table 4.1: The Yemeni DNA Board constitutes of the following members: 1 Minister of Water and Environment Chair 2 Chairman of the Environment Protection Authority Vice Chair 3 Representative of the Ministry of Planning and International Cooperation Member 4 Representative of the Ministry of Public Health & Population Member 5 Representative of the Ministry of Oil and Mineral Resources Member 6 Representative of the Ministry of Electricity Member 7 Representative of the Ministry of Local Administration Member 8 Representative of the Ministry of Industry and Trade Member 9 President of the General Investment Authority Member 10 Representative of the Governorate where the project is located. Member The DNA Board has within the approval process the following tasks:
‐ Assesses proposed CDM projects for Yemen; ‐ Issues the official approval letter, signed by the Chair, confirming voluntary participation and
project’s contribution to sustainable development of the Republic. Decision of the board concerning proposed CDM projects requires that more than half of the members of the Board cast in favour of the proposal. In case of an equal number of votes in favour and against, the Chair casts the decisive vote.

Page 44 Clean Development Mechanism – An Experience from Yemen
5. CDM Project Approval and the relevant requirements
5.1. Background to the Process As outlined in the previous chapter the intensive process to establish the relevant requirements was undertaken in a period of 12 months. During this time a number of workshops and bilateral meetings were implemented to ensure broad stakeholder participation. For the Government of Yemen it was important to establish clear and consistent requirements and approval procedures in order to encourage CDM investors to participate in developing projects. Further, importance was given to develop procedures which are transparent and easy to understand. Before the evaluation and approval procedures were officially approved, the procedures were tested during a workshop to assess the functionality.
The evaluation and approval procedures were finally endorsed and approved by a Ministerial Decree, entitled: Rules and Procedures of the Designated National Authority for Approval of Projects under the Clean Development Mechanism of the Kyoto Protocol of the Republic of Yemen. 5.2. CDM Project Evaluation and Approval Procedures The DNA Secretariat operates as a one‐stop focal point in the CDM project approval process, although the approval decision is taken by the DNA Board, which consists of seven Ministries, the Environment Protection Authority, the General Investment Authority and an ad‐hoc member of the Governorate where the proposed project is located. The approval letter is signed by the Chair of the DNA Board, the Minister of Water and Environment. The application process begins with the submission of the required documentation to the DNA Secretariat, and it ends with an approval or rejection letter from the DNA. During the process, the DNA may request that the applicant submits additional information. The process to appeal for CDM project approval consists of the following elements as delineated in Figure 5.1:
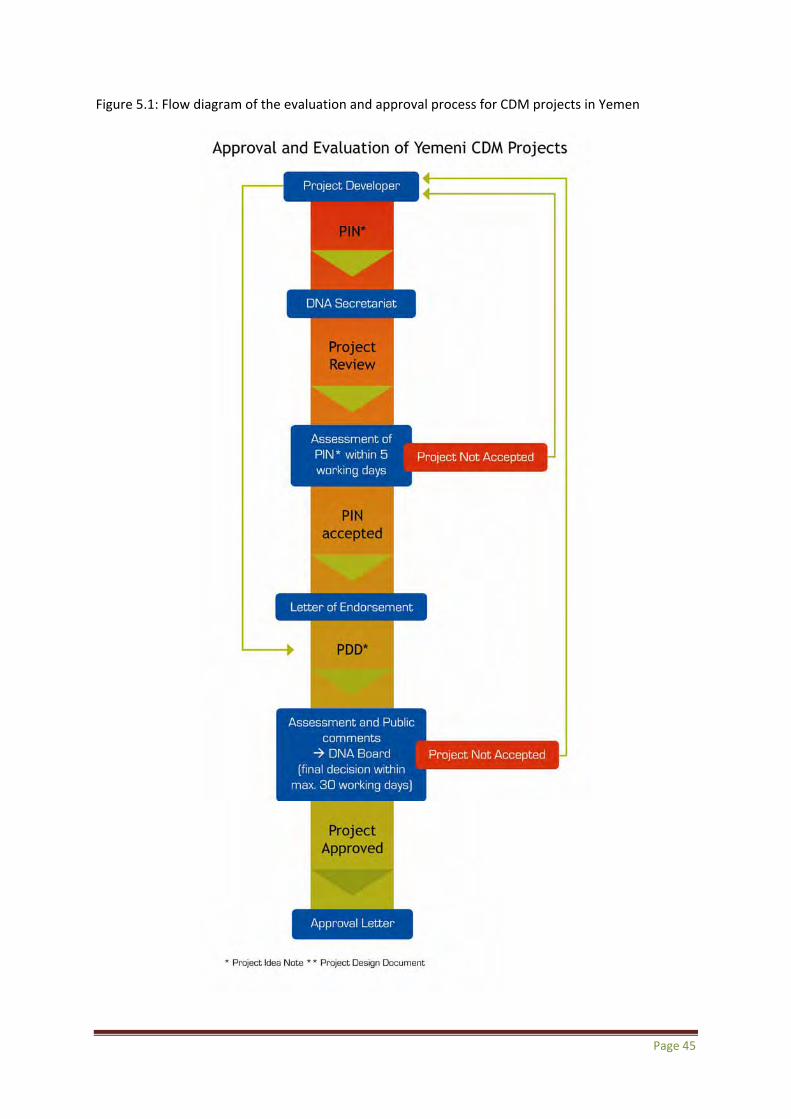
Page 45
Figure 5.1: Flow diagram of the evaluation and approval process for CDM projects in Yemen

Page 46 Clean Development Mechanism – An Experience from Yemen
The evaluation and approval procedures are reflected in three major steps: Step 1: Any CDM project developer who wants to get a letter of endorsement by the Yemeni DNA has to submit to the DNA Secretariat a Project Idea Note (PIN) in English language. The PIN has to be written in accordance to the template as published on the DNA website59. The template is structured into the following sub‐headings: project overview, project participants and stakeholders, project location, project design and technology, schedule of implementation, financial data, emissions information, and environment and sustainable development. Step 2: The PIN is evaluated by the DNA Secretariat within five working days. The DNA Secretariat determines whether a project meets the relevant sustainable development criteria, and then takes its decision. If the project is deemed acceptable at this stage, it issues a Letter of Endorsement. The Letter of Endorsement is signed by the Co‐Chair of the DNA Board. The format of the Letter of Endorsement is provided for in the Ministerial Decree regulating in detail the evaluation and approval procedures. This letter, however, only indicates that, based on the information provided in the PIN, the DNA Secretariat confirms that the proposed project meets the relevant eligibility requirements. It is provided only to facilitate negotiations and to lay a foundation for the next steps, but is in no way a commitment on the part of the Yemeni DNA that the project will receive the required Approval Letter as the final step in the approval process. 59 www.cdm‐yemen.org

Page 47
Step 3:
The project developer has to submit a Project Design Document (PDD) to the DNA Secretariat. The PDD has to be written in English and in accordance to the international CDM rules. The project developer has to submit the PDD both in electronic and in the form of 12 hardcopies. Within two days of receiving the PDD, the DNA Secretariats requests the Governorate(s) where the proposed project is located to nominate a representative as temporary member(s) in the DNA Board. The Governorate(s) needs to provide its nomination within 10 working days. Within 10 working days of receiving the PDD,
the DNA Secretariat assesses the PDD according to the sustainable development criteria and previews the PDD for completeness. If the information received is incomplete the DNA Secretariat asks the developer to re‐submit the PDD containing the required information. Within three working days of receiving the PDD, the PDD in English language is published on the DNA webpage and as an outline of ¼ pages in Arabic language in two local newspapers. In the latter, specifying the name of the project, the technology used, the exact location of the proposed project and inviting for stakeholder comments. Interested stakeholders can also review the PDD at the DNA Secretariat’s office during working hours. The stakeholders’ comments can be submitted in Arabic or in English, electronically or on paper to the DNA Secretariat within 10 working days after publication of the PDD. The DNA Secretariat carries out an assessment which may serve as a basis for the decision of the DNA Board. On the 11th working day after receiving the PDD, the DNA Secretariat sends the PDD, the assessment of the PDD and all received comments to the members of the DNA Board. Within 10 working days of receiving these documents, the DNA Board members provide their vote, hence their decision on the project. If a DNA Board Member does not submit the vote until the provided deadline, it is deemed that the Member is in favor of the project. If the majority of DNA Board Members votes in favor of the project, the project is approved. However, if less than the majority is in favor of the project, the project is rejected. The detailed voting procedures are outlined in the mentioned Ministerial Decree. If the project has been approved, within 7 working days after the decision has been taken a Letter of Approval will be issued. The Letter of Approval is signed by the Chair of the DNA Board, the Minister of Water and Environment. The format of which is provided for in the Ministerial Decree defining the evaluation and approval procedures. The Letter of Approval confirms that the project activity is implemented voluntarily and contributes to the sustainable development of the country. If the project has not been approved the project developer will be informed by the DNA Secretariat accordingly.

Page 48 Clean Development Mechanism – An Experience from Yemen
5.3. Sustainable Development Criteria and Indicators (including the underlying policy document) In Yemen the criteria for sustainability in the CDM process have been based on the three pillars of economic, social and environmental sustainability. By following this approach the Government wants to provide on one hand clear guidance for project developers and thereby enhancing their predictability for project approval, and on the other for the evaluators to provide a homogenous approach by minimizing the scope for subjective interpretation.
5.3.1: Criteria and indicators (along with the underlying policy document) ‐ Economic criteria and indicators
• Contribution to economic diversification (Strategic Vision 2025) o Investment also outside the oil and agricultural sector o Additionality of project
• Improvement in food security (Strategic Vision 2025) o Direct or indirect increase in food availability if possible (e.g. through expansion of
agricultural land or increased availability of agricultural inputs) o Documentation of offset if agricultural land is used for project purposes
• Improvement in water security (Strategic Vision 2025, NEAP, NWSSIP) o Direct or indirect increase in water availability (e.g. through efficiency of water use)
• Increase in foreign investment (Strategic Vision 2025, FYP) o Volume of FDI
• Contribution to technology transfer (Strategic Vision 2025) o Technology not commonly used in the country o Documented measures taken by project developers to train local employees
• Expanding role of private sector (Strategic Vision 2025, FYP) o Private company is project participant as preference
‐ Social criteria and indicators
• Poverty reduction (Strategic Vision 2025, PRSP) o Direct or indirect increase in resource availability to local population o Documented measures to counteract decreases in income in vulnerable groups
• Provision of employment (PRSP, FYP) o Number of jobs with above‐average qualification created (directly and indirectly)
• Improvement in public health (Strategic Vision 2025) o Documented compliance with work safety regulation
‐ Environmental criteria and indicators
• Reduction in water, air and soil pollution (NEAP) o Completed Environmental Impact Assessment, if required for project type o Documentation of changes in pollution in case no EIA is required
• No net impact on biosphere o Documentation of development of an equal amount of agricultural / forest land
elsewhere if project destroys agricultural /forest land

Page 49
The DNA Secretariat and the DNA Board are mandated to review a potential CDM project as to whether it fulfills the relevant national sustainable development criteria, the prerequisite of public participation and any other national legal requirements such as environmental impact assessments. 5.4. Environmental Impact Assessment The intended implementation of a CDM project activity does not rule out domestic laws and regulation which affect project implementation. Developers need to be fully aware of their obligations under all laws and guidelines applicable to their situation. An environmental impact assessment (EIA) is mandatory when applicable for project type before project implementation and subject to approval by the Environment Protection Authority.
5.4.1. Introduction to Environmental Impact Assessment Environmental Impact Assessment can be defined as: “The process of identifying, predicting, evaluating and mitigating the biophysical, social, and other relevant effects of proposals prior to major decisions being taken and commitments being made.”60 The EIA is a tried and tested instrument for analyzing the effects of projects on the environment and to mitigate their potential adverse impact. The EIA is a tool:
o To bring environmental concern into the decision making process; o To provide a legal framework and an information basis for decision making on activities
affecting the environment.
The role and objectives of the EIA The EIA helps to answer in general the following core question: will the proposed project have more negative impacts or more positive benefits? The EIA assists to evaluate the possible impacts of a project. It helps to decide, if and how to proceed with a proposed project. The objectives of the EIA can be summarized as follows:
- To identify and to predict the impacts of projects.
- To identify key impacts and measures for mitigating them: to identify the most important impacts and measures how to mitigate them.
- To interpret and communicate information about impacts: the responsible staff needs to
transform it into a ‘language’ which everybody can understand and to communicate this information to all concerned parties. This may be done through public meetings, the TV, the newspaper or a possible mix. However the right methodology is case specific.61
60 www.iaia.org 61 Conversation with Prof. Dr. Michael Schmidt (University of Cottbus, Germany)

Page 50 Clean Development Mechanism – An Experience from Yemen
- To deal with all possible impacts on the biophysical environment and on human health and well‐being: EIAs are not limited to the environment but include human health and well‐being.
- To avoid serious and irreversible damage to the environment: e.g. Soil erosion may be an
irreversible damage to the environment. It is recommended to look a generation ahead when predicting serious and irreversible damage to the environment.
- To anticipate problems and prevent them before they appear: this includes the identification
of solutions so that problems will not appear in the first place.
- To ensure efficient resource use: all stakeholders are requested to cooperate.
- To enhance social impacts.
- To protect human health and safety.
- To promote development that is sustainable and optimizes resource use and management opportunities.
The operating principles of the EIA The EIA process should be applied:
- As early as possible in decision making and throughout the life cycle of the proposed activity;
- To all proposals that may cause potentially significant effects;
- To biophysical impacts and relevant socio‐economic factors, including health, culture, gender, lifestyle, age, and cumulative effects consistent with the concept and principles of sustainable development;
- To provide for the involvement and input of communities and industries affected by a
proposal, as well as the interested public;
- In accordance with internationally agreed measures and activities.
The guiding principles of the EIA
o purposive – having identified tasks: upfront tasks and responsibilities should be defined. o focused – concentrating on the project and its environment: one should concentrate on the
environment and not to lose focus within all the available information. o adaptive – making instruments suitable for application: to identify the most appropriate
methodology suitable for the project in question and in relation to the availability of date. o participative – involving local population and asking for external feedback. o transparent – easy for external monitoring and evaluation: the available information should
be simple so that external evaluation can be done. One should find a way in order to explain complex situations to the general public. People who don’t understand – won’t accept!

Page 51
o rigorous – employing ‘best practice’ methodology: based on the project and the availability if data the most suitable methodology has to be identified.
o practical – establishing mitigation measures which will work o credible – carried out with objectivity and professionalism: never to influence or push the
public, this may lead to lose the credibility. One should not know the result of an EIA before doing the EIA.
o efficient – imposing least cost burden on proponents: try to avoid delays, every project costs money, time is money for the developer, therefore by causing delays one is rising to lose the project.
The advantages/benefits of and why EIAs
o improved project design/location; o more informed decision‐making (with improved opportunities for public involvement in
decision‐making; o more environmentally sensitive decisions; o increased accountability and transparency during the development process; o improved integration of projects into their environmental and social setting; o reduced environmental damage; o more effective projects in terms of meeting their financial and/or socio‐economic objectives,
and o a positive contribution towards achieving sustainability.62
The EIA Process
The EIA process should proceed logically through a number of steps at two levels:
1. Technical work undertaken by specialist contributors to the assessment;
2. A guiding principle for the EIA overall, providing a structure for the EIA report and coordinating the technical contributions.
Each step in the EIA process requires consultation to ensure that all relevant views are being taken into account throughout the EIA process. Ideally consultation should be maintained throughout the EIA process with the developer and designer of the proposed scheme, so that modifications to the design to reduce potential environmental impacts may be introduced before completion of the final design. Consultation with the regulatory authorities, and also with the public, should be initiated at the scoping stage of the EIA, and thereafter carried out as appropriate. The developer is ultimately responsible for ensuring compliance with statutory requirements for EIA preparation. A developer may employ a firm of consultants to carry out the EIA, and should verify the competence of the firm recruited to prepare the EIA. The EIA should be prepared by a team with expertise appropriate to the study of the different aspects of the development site. The team should be headed by a project manager, whose ultimate responsibility is to coordinate the inputs of individual specialists and to provide an overview. Some team members may fulfill several of the above roles if suitably qualified and experienced. 62 www.iaia.org

Page 52 Clean Development Mechanism – An Experience from Yemen
The following sections outline the basic steps in the EIA process. Specifically the EIA process should provide for: 1. Description of the project: What type of project is it?
2. Screening ‐ Is an EIA required? ‐ and, if so, at what level of detail?
3. Scoping ‐ What has to be covered and in what detail? ‐ to identify the issues and impacts that
are likely to be important and to establish terms of reference for EIA. 4. Examination of alternatives ‐ to establish the preferred or most environmentally sound and
benign option for achieving proposal objectives. 5. Impact analysis ‐ to identify and predict the likely environmental, social and other related
effects of the proposal. 6. Mitigation and impact management ‐ to establish the measures that are necessary to avoid,
minimize or offset predicted adverse impacts and, where appropriate, to incorporate these into an environmental management plan or system. Can significant negative effects be avoided or made acceptable.
7. Evaluation of significance ‐ to determine the relative importance and acceptability of residual
impacts (i.e., impacts that cannot be mitigated). How significant are the predicted effects. 8. Preparation of environmental impact report ‐ to document clearly and impartially impacts of
the proposal, the proposed measures for mitigation, the significance of effects, and the concerns of the interested public and the communities affected by the proposal.
9. Review of the environmental impact report ‐ to determine whether the report meets its terms
of reference, provides a satisfactory assessment of the proposal(s) and contains the information required for decision making.
10. Decision making ‐ to approve or reject the proposal and to establish the terms and conditions
for its implementation. 11. Follow up ‐ to ensure that the terms and condition of approval are met; to monitor the
impacts of development and the effectiveness of mitigation measures; to strengthen future EIA applications and mitigation measures.
12. Environmental audit and process evaluation to optimize environmental management.*
* It is desirable, whenever possible, that monitoring, evaluation and management plan indicators are designed to contribute to local, national and global monitoring of the state of the environment and sustainable development.63
63 Conversation with Prof. Dr. Michael Schmidt (University of Cottbus, Germany)

Page 53
5.4.2. The EIA Process in Yemen
Legal Framework In 1993 the Decree No (89) was issued by the Cabinet of Ministers by which the EIA was established as a mandatory process, and development projects require EIA studies. Within the same Decree the EPA was instructed to develop national EIA policy and relevant regulations. In 1995 the Environmental Protection Law (EPL) No. (26) was issued. Chapter three of the EPL defines the legal framework for licensing of projects and the EIA. Also of importance in this respect are the EPL Executive Regulations (By‐law 148 of 2000). The competent bodies for EIA defined in Chapter 1 Article 2 (33) of the EP Law are those government bodies with powers under other legislation to approve development activities (e.g. line ministries). The EPA has the responsibility of coordinating the activities of the competent bodies, and providing advice to them. In order to make the updating of EIA guidelines and the environmental standards easier, these guidelines and standards have been issued as annexes to the executive regulations, (By‐law 148 of 2000). Therefore, in case there is a need of technical amendments or updating there is no requirement to go through the Cabinet.
Institutional Framework The Cabinet of Ministers the Decree No. (89) from 1993 and the Chapter 3 (Environmental Damaging Activities) of the Environment Protection Law No. (26) regulate that the EPA administers the EIA process; any other requirements and procedures are included in the EIA legislations. This does not only involve the responsibility for the drafting of regulations, guidelines and standards but also a central position in the Terms of Reference (TOR) preparation, review of EIA reports, and the monitoring process. Within the EPA, the responsibility for EIA rests with the Directorate General for Monitoring and Environmental Assessment, which liaises with and provides advice to the competent bodies. The Directorate General makes use of any technical staff within EPA or any specialized person from universities or line ministries if needed. Role of the EPA: According to the existing legislation, the EPA is the lead agency in the following activities of the EIA process:
1. Processes joint screening and scoping, together with competent bodies. 2. Develops the EIA TOR for development projects. 3. EPA and line ministries jointly review EIA reports and provide necessary comments or
amendments according to alternatives, mitigation measures or needs for further studies.

Page 54 Clean Development Mechanism – An Experience from Yemen
4. Approves EIA statement, including the mitigation measurement and monitoring system. The EPA usually consults with the line ministries in this process.
5. Follows the implementation of EIA studies together with line ministries and funding agencies.
6. Monitors the implementation of EIA condition and mitigation measures together with line ministries.
It has to be noted, that the Environment Protection Law and the EIA Process in Yemen are at present under re‐consideration and may be modified in the near future.

Page 55
6. Scope for CDM Projects in Yemen 6.1. Overview of existing CDM project portfolio In total 852 CDM project activities are registered with the EB as of 2nd December 2007.64 The annual average CERs are assumed to mount up to 174,753,126. The forecasted volume is > 1,080,000,000 CERs until the end of 2012.65 Table 6.1: Distribution of registered project activities by scope
Sectoral Scope Registered Projects
Energy industries (renewable ‐ / non‐renewable sources) 591
Energy distribution 0
Energy demand 14
Manufacturing industries 66
Chemical industries 16
Construction 0
Transport 1
Mining/mineral production 6
Metal production 1
Fugitive emissions from fuels (solid, oil and gas) 86
Fugitive emissions from production and consumption of halocarbons and sulphur hexafluoride
16
Solvent use 0
Waste handling and disposal 229
Afforestation and reforestation 1
Agriculture 82
Source: www.cdm.unfccc.int ‐ Status: 27.11.2007
64 Updated information can be received: http://cdm.unfccc.int/Statistics/index.html 65 Status: 02.12.2007

Page 56 Clean Development Mechanism – An Experience from Yemen
Table 6.2: Registered project activities by host party
Country Number Of Projects
Argentina 10
Armenia 2
Bangladesh 2
Bhutan 1
Bolivia 2
Brazil 113
Cambodia 1
Chile 21
China 133
Colombia 6
Costa Rica 4
Cuba 1
Cyprus 2
Dominican Republic 1
Ecuador 9
Egypt 3
El Salvador 3
Fiji 1
Georgia 1
Guatemala 5
Honduras 12
India 294
Indonesia 11
Israel 7
Jamaica 1
Lao People's Democratic Republic 1

Page 57
Malaysia 20
Mexico 97
Mongolia 3
Morocco 3
Nepal 2
Nicaragua 3
Nigeria 1
Pakistan 1
Panama 5
Papua New Guinea 1
Peru 7
Philippines 14
Qatar 1
Republic of Korea 16
Republic of Moldova 3
South Africa 12
Sri Lanka 4
Thailand 5
Tunisia 2
Uganda 1
United Republic of Tanzania 1
Uruguay 1
Viet Nam 2
Source: www.cdm.unfccc.int – Status: 27.11.2007

Page 58 Clean Development Mechanism – An Experience from Yemen
Table 6.3: Registered projects by region
Region Number of projects
NAI‐Africa 23
NAI‐Asia and the Pacific 522
NAI‐Other 6
NAI‐Latin America and the Caribbean 301
Source: www.cdm.unfccc.int – Status: 30.11.2007 Table 6.4: CERs issued by host party
Country CERs
Argentina 30,919
Bhutan 474
Brazil 14,492,568
Chile 2,088,741
China 23,403,461
Colombia 152,949
Ecuador 186,969
Egypt 1,223,921
El Salvador 98,155
Fiji 18,176
Guatemala 197,928
Honduras 50,281
India 31,963,858
Jamaica 80,916
Malaysia 463,736
Mexico 1,910,664
Morocco 26,213

Page 59
Nicaragua 262,645
Papua New Guinea 52,388
Peru 74,081
Philippines 27,807
Republic of Korea 16,606,236
Sri Lanka 173,107
Source: www.cdm.unfccc.int – Status: 30.11.2007 6.2. Greenhouse gas emissions in Yemen The 2001 First National Communication to the United Nations Framework Convention on Climate Change (UNFCCC) used 1995 as a reference year for Yemen's Greenhouse gas emissions inventory due to the high uncertainty of 1994's information as a result of the April‐July 1994 civil war. The total greenhouse gas emissions (CO2, CH4, N2O) of the Republic of Yemen, in 1995, amounted to 18,709 Gg CO2e, (CO2=11,359, CH4=128.31 and NO2=15.02). Taking CO2 removal into account, the total net emission of CO2 is 845 Gg. These figures are exclusive of the emission from the international bunker (114.35 Gg CO2) and from combustion of biomass (353.29 Gg CO2).
66 Figure 6.1: Total Yemen's GHG emission in Gg CO2e by sector, 1995
Source: 2001 First National Communication to the United Nations Framework Convention on Climate Change Yemen's emission profile by gas type for 1995 shows that CO2 accounts for 61% of the total national GHG emissions (11358 Gg CO2), N2O 25% (4657 Gg CO2e) and CH4 14% (2694 Gg CO2‐eq). Table 6.1 provides the details of emission by gas of various sectors. 66 2001 First National Communication to the United Nations Framework Convention on Climate Change
10132
547
6294844
893
18709
-10514
8196
-15,000
-10,000
-5,000
0
5,000
10,000
15,000
20,000
Gg CO2-eq
Ener
gy
Indu
s.Pr
oces
ses
Agr
icul
ture
For
estr
y
Was
te
Tota
l
Sink Net

Page 60 Clean Development Mechanism – An Experience from Yemen
Table 6.5: Sectoral Breakdown of GHG emission, 1995
Gas Source Emission Gg67 Emission Gg CO2e
Energy 9968 9968Industrial processes 547 547Forestry 843 843
CO2
Subtotal 11358 11358Energy 6.02 126Agriculture 91.22 1916
Land use change and forestry
0.02 0.34
Waste 31.06 652
CH4
Subtotal 128.31 2694Energy 0.12 37Agriculture 14.13 4379Land use change and forestry
.0001 0.03
Waste 0.78 240
N2O
Subtotal 4657 Source: 2001 First National Communication to the United Nations Framework Convention on Climate Change 6.3. Potential CDM projects in Yemen This chapter provides an overview of potential CDM project activities in Yemen. However, it is crucial to note it is not set to be conclusive. Information used has been obtained through project identification work carried out by the Ministry of Water and Environment and the Environment Protection Authority/Yemeni DNA Secretariat from September 2006 to October 2007 in cooperation with the United Nations Development Organisation, the Centrum für internationale Migration und Entwicklung and the Carbon Finance Assist Programme of the World Bank. There is still scope for more project identification tasks, e.g. in the oil industry, the cement industry and for gas. It would also be viable to move into the various Governments as this first identification work, due to finance and time constraints focused mainly on the Governorates of Sana’a, Ta’izz and Aden. Numerous meetings with potential project developers and the DNA Secretariat provided the basis, and assisted developers in identifying CDM projects within their operational activities. The process included face‐to‐face discussions and technical training workshops with decision‐makers of companies and public entities. The aim was to support those in evaluating their CDM potential realistically and in drafting PINs on the basis of existing baseline and monitoring methodologies. A number of promising CDM project types for Yemen were identified, including: methane capture from waste waters, renewable energy projects, reduced flaring and venting in the oil and gas sector, energy efficiency, landfill management and fuel switch to less carbon intensive fuels. To promote the development of CDM projects, several CDM training events were organised to increase the capacity of local consultants in preparing PINs/PDDs and in applying the criteria and indicators for national approval by the DNA. The workshops included in‐depth discussion of project
67 Gg = Greenhouse gas

Page 61
proposals primarily from the Middle East and North Africa Region (MENA Region68), the estimated emission reductions they are to bring about, methodological challenges and the chances of them being positively assessed by the Yemeni DNA and further validated and registered. The workshops were also held to increase the awareness and capacity of CDM amongst potential project developers. Successful international CDM consultants were invited in form of skill‐share workshops, to share their experiences. List of workshops:
- Workshop: CDM Projects in the Renewable Energy Sector; - Workshop: CDM Projects in the Oil and Gas Sector; - Workshop: CDM Projects in the Waste Sector; - Workshop: Internal Training Session on CDM for MWE/EPA; - Bilateral CDM Training Session – Public Electricity Corporation; - Bilateral CDM Training Session – Yemen Gas Company; - Bilateral CDM Session – Cleaning Fund, Sana’a; - Bilateral CDM Session – Private Sector, Hayel Saeed; - Bilateral CDM Session – Yemen Economic Corporation; - Bilateral CDM Session – Yemen Cooperation for Cement Industry and Marketing; - Bilateral CDM Session – Petroleum Exploration Authority; - Bilateral CDM Session – Marib Refinery; - Bilateral CDM Sessions with various oil companies operating in Yemen
(e.g. Safer, Total, Nexen); - Bilateral CDM Session with YLNG; - Bilateral CDM Session with OMV; - Training Workshop on CDM; - Training Workshop on CER Calculation; - Training Workshop on CDM.
As Embassies are important links to the industrial sector in their countries and with their DNAs, bilateral CDM Sessions were held with the Economic Officers of various Embassies represented in Yemen, like Germany, the Netherlands and Japan. The characters of CDM projects can be quite diverse. The following chapter is structured based on the list of sectors and sources contained in Annex A of the Kyoto Protocol and adjusted to the local circumstances:69
68 The MENA region includes, according to the WB definition, all the countries from Morocco to Iran ‐ excluding the sub‐Saharan countries of Sudan, Somalia and Mauritania. 69 The list of sectoral scopes as adopted by the CDM‐AP would include also Afforestation and Reforestation, solvent and other product use and agriculture.

Page 62 Clean Development Mechanism – An Experience from Yemen
6.3.1. Energy
6.3.1.1. Overview ‐ Electricity The electric power sector plays an important role for social and economic development in the United Nations Economic and Social Commission for Western Asia (UNESCWA) member countries70. This sector is one of the main sources of greenhouse gas emissions in addition to other pollutants. In accordance to UNESCWA, the GHG emissions from the region have been on the increase, estimated in 1999 at 225.6 million tons (around 4 per cent of global GHG emissions) and further increases are anticipated over the next two decades if no mitigation measures are adopted. Similar increases in electricity consumption have been recorded over the same period.71 As per definition of the Ministry of Planning and International Cooperation, energy is a strategic sector of the country’s economic infrastructure. The Ministry states:” The sector has witnessed increasing growth in the last ten years in power generation, transmission and distribution. Investment in the sector is quite high and relevant projects are carried out in accordance with priorities.”72 Yemen's 100% state‐owned Public Electricity Corporation (PEC) formed in 1991, under the Ministry of Electricity, is the sole public utility with the mandate for generation, transmission, distribution and sale of electricity in the country. The entity operates approximately 80% of the country's generating capacity as part of the national grid. The remainder is generated by small off‐grid suppliers and privately‐owned generators predominantly in rural areas.73
The PEC distributes electricity into the national grid through two 132Kv transmission systems. PEC’s transmission and distribution network is overstretched resulting in high losses and frequent interruptions in electricity supply.74 The Poverty Reduction Strategy Paper (PRSP) states the following: ”Indicators show the failure of electric power in Yemen in keeping pace with demand due to the aging of the power stations and the distribution networks, which is reflected in the high losses that are currently estimated at about 38%, well above the internationally prevailing levels. This situation prevents the full utilization of machinery and equipment in the different productive and service units, or burdens the private sector facilities with the cost of setting up their own generating plants, not to mention the inability to systematically fulfill domestic lighting requirements. This situation is expected to continue over the medium term due to the increase of demand at high rates, and thus increases the adverse aspects on investment opportunities and the growth of output, income and employment, clearly showing the importance of strategic investment by the private sector in this field.”75 The goal as set within the PRSP aims at a reduction of electricity losses to 25%. Yemen's electricity shortage is one of the major constraints for economic development ‐ limiting industrial production and is leading to depressing standards of living. Over the past decade, the Government has taken steps towards alleviating Yemen's electricity shortage, including reforms, expansion and integration of the country's power sector through the privatization of all domestic generators (5‐20 MW) small‐scale privatization and independent (private) power projects (IPPs). Plans to privatize the power stations have been slow in implementation.76 Currently, Yemen's two
70 Bahrain, Egypt, Iraq, Jordan, Kuwait, Lebanon, Oman, Palestine, Qatar, Saudi Arabia, Syria, UAE, Yemen 71 UNESCWA (2001): Options and Opportunities for the Greenhouse Gas Abatement in the Energy Sector of ESCWA Region – Volume II – Power Sector 72 www.mpic‐yemen.org 73 www.eia.doe.gov 74 www.eia.doe.gov 75 PRSP, Yemen – 2003‐2005 76 www.eia.doe.gov

Page 63
largest power plants are the 165‐MW power station at Ra's Kanatib, near Al Hodeidah, and the 160‐MW station in Al Mukha, south of Al Hodeidah.77 Consumer electricity in Yemen has been highly subsidized. Under conditions set by the International Monetary Fund (IMF) in its lending program, the Government has been required to reduce electricity subsidies that are estimated to be around US$ 50 million per year. Government attempts to raise tariffs have been unpopular and have led to conflicts.78 To date, most of Yemen's electricity infrastructure improvements have been funded by multilateral development organizations. For example, in May 2006, the World Bank approved a US$ 50 million credit to help finance the “Power Sector Project” (total project costs: US$ 75 million). The main objective of this project is to relieve critical power supply constraints and enhance the overall technical efficiency and quality of electricity supply by supporting the Government’s power sector reform initiatives and strengthening the sector’s corporate governance to improve the efficiency of PEC. In 1998, the World Bank and the International Development Foundation (IDF) granted Yemen a US$ 33 million loan for the "Sana’a Emergency Power Project," an upgrade of the Dhaban power plant to 50‐MW total capacity (completed in June 2004). The Kuwait‐based Arab Fund for Economic & Social Development (AFESD) provided the initial $ 54 million of the $ 64 million required for the national grid linkage (completed in July 1997). The AFESD and the Saudi Fund for Development (SFD) are also major backers of the first phase of the Marib power plant project.79
Yemen has the lowest population access to electricity in the region, with only 53%80 of the total population having access. Of the 72% of the Yemeni population living in rural areas, only 23% have any access to electricity, this compares unfavorably with 85% of the urban population that have access to electricity. Even for those connected to the grid, electricity supply is intermittent, with rolling blackout schedules occurring in most cities (see above). Out of this 23%, about 10‐14% is
connected to the national grid system and the remaining (11‐13%) is estimated to have some access from other sources, typically a diesel generator that operates only a few hours in the evening. With the 2005 increase in diesel prices, cost of diesel generation has become economically unsustainable making renewable energy based electrification extremely attractive. Poor families use a mixture of collected fuel‐wood, crop residues, dung, kerosene (probably as a starter fuel) and LPG.81/82 60% of households using firewood spend approximately 100 hours per
77 www.eia.doe.gov 78 www.eia.doe.gov 79 www.eia.doe.gov 80 World Bank and UNDP (2005): Household Energy Supply and Use in Yemen: Volume I, Main Report 81 Unless otherwise stated, references to “the poor” relate to the bottom 30% of households, i.e. the bottom three deciles or the poorest 900,000 households in Yemen. “Middle income households” relates to deciles four

Page 64 Clean Development Mechanism – An Experience from Yemen
month collecting it. Especially the poor depend on natural resources and contribute to the situation by unsustainable woodcutting thereby leading to deforestation, loss of vegetation cover, soil erosion (12 mill hectares), desertification (3‐5%) and land degradation. The National Environmental Action Plan (NEAP) outlines the following: “The natural wooded vegetation consisting of wadis and desert shrubs, savannahs, and mountain trees has largely degenerated into open woodland or low scattered shrubs due to fuel wood consumption, stock grazing, and clearance for agriculture. Currently, the forests are the country’s principal source of domestic fuel and account for 90 percent of rural household energy consumption. The widespread practice of cooking on stoves fuelled by wood is leading to the stripping of vegetation because the demand for fuel wood exceeds the reproduction rate of the trees. Further, rising fuel wood prices are key factors in increased deforestation.”83 Deforestation and the clear linkage to fuel‐wood as a major source of energy is also a key issue of concern in the National Biodiversity Strategy and Action Plan (NBSAP): “Fuel‐wood constitutes a major source of energy, particularly for the rural household in Yemen where there is a shortage of electric supply and oil products and people are highly dependent on fuel‐wood. This level of wood harvest poses serious threats to nearly 19 species of common trees and shrubs, which in turn results in drastic deterioration of rangelands and wood resources, leading to accelerated wind erosion, sand encroachment, and the subsequent desertification associated with notable
decline in agricultural productive lands in addition to the loss of nurseries of many mammals, reptiles and birds inhabiting harvested areas. Beside environmental problems, the removal of trees and burning of trees lead to the loss of carbon sinks and to increased emissions of greenhouse gasses. […] Given that Yemen enjoys a very diverse natural environment and diverse climate, this level of emission from fuel‐wood burning can be reduced and the country’s stock of wood can be conserved substantially
by shifting towards cleaner, renewable energy sources of fuels that are available to Yemen.” In order to counterbalance current trends of woodland depletion for energy purpose, this strategy calls for preparing and developing mitigation measures to further decrease fuel‐wood consumption and to minimize its effects on biodiversity and climate change. Table 6.6: Average Monthly Consumption of Electricity and Fuels by Households that Consume Electricity and Fuels – Household Level Urban Rural Total Lowest decile Highest
through seven, i.e. the middle 40%. “Relatively well off” relates to the top 30%. These are all relative rather than absolute terms. References to ‘the very poor” relate to the bottom income decile, i.e., the poorest 300,000 households in Yemen.5 82 World Bank and UNDP (2005): Household Energy Supply and Use in Yemen: Volume I, Main Report 83 Current consumption of fuel wood is estimated at 6 million cubic meters annually, with a value of YR 10 million, and is increasing rapidly as Yemen's population grows by over 3 percent annually.

Page 65
decile Electricity PEC grid consumers (kWh)
273 101 183 94 237
Electricity PEC isolated system customers
NA 74 74 56 154
Electricity coop customers
91 44 44 32 68
Electricity private suppliers
NA 45 45 40 53
LPG (kg) 25 26 26 20 36Diesel (litre) 139 167 164 55 214Kerosene (litre) 8 11 10 10 10Fuelwood (kg) 72 125 113 145 100Charcoal (kg) 7 25 15 8 24Crop residue 66 77 76 16 148 Source: World Bank and UNDP (2005): Household Energy Supply and Use in Yemen: Volume I, Main Report The Government is exploring ways to meet the increasing energy demand by other indigenous energy sources. As Yemen is on one hand endowed with renewable energy (RE) resources that could vastly support the development process, such as: solar, wind and geothermal energy and on the other hand offers the potential for promising sustainable energy projects in the area of biomass, energy efficiency and to a limited extend small hydropower. The Ministry of Water and Environment (MWE) in collaboration with the Ministry of Electricity (MOE) hosted in April 2004 the Middle East and North Africa Regional Renewable Energy Conference (MENAREC), a milestone for the promotion of renewable energy in the region, out of which, the Sana’a Declaration84 originated. In June 2004, the GOY played a major role in the Bonn conference on “Renewables 2004”, during which several partnership agreements were initiated (Johannesburg Renewable Energy Coalition, JREC; Renewable Energy and Energy Efficiency Partnership, REEP). In the course of MENAREC 2 (2005, Jordan) Yemen expressed the importance for the implementation of a comprehensive national RE strategy including clear targets to promote renewable energy in the country, through increasing access to affordable and sustainable sources of energy in rural Yemen. Also the promotion of RE is stated clearly as a key mitigation measure recommended by the 1st National Communication of Yemen to the UNFCCC.
a) Solar Energy
Yemen enjoys high availability of solar radiation at an utilizable level. The annual average of solar irradiation in Yemen ranges from 5.2‐6.8 kWh/m2/day. High insolation85 levels are experienced in the Highlands with the highest average of 6.8 kWh/m2/day, occurring in the Governorates of Al Beida and Dhamar. Other areas like the Governorates of Sana’a, Ibb, Al‐Dhale and the South of Amran and Marib have also very high irradiation levels ranging from 6.6‐6.7 kWh/m2/day.7
84 Sana’a final statement on renewable energy and sustainable development 85 Insolation: Intensity of incoming solar radiation incident on a unit horizontal surface at a specific level

Page 66 Clean Development Mechanism – An Experience from Yemen
In the coastal areas irradiation levels with the lowest average are ranging from 5.1‐5.2 kWh/m2/day amounting around the southern part of the Governorate of Hajjah. Most of the Governorates like Al Hodeidah, Taiz, Lahej, Abyan, Shabwa, Hadramout and Al Mahara have average insolation levels ranging from 5.4‐5.8 kWh/m2/day. Insolation levels from Al Jowf, down to Marib, to the central part of Shabwa, and to the central part of Hadramout range from 6.0‐6.3 kWh/m2/day. The Archipelago of Socotra has, on average, very high annual average insolation at
around 6.6 kWh/m2/day.86 The availability of solar energy is also high in Yemen. According to the Civil Aviation and Meteorological Authority (CAMA) the sunshine hours on average, range from 7.3 hours per day in Sa’dah to 9.1 hours per day in the Archipelago of Socotra. The daily average sunshine hours in the capital are 7.7. Longer average sunshine hours indicate high energy production from solar energy technologies. Also during the coldest period of the year, the average sunshine hours are over 8 hours per day. The high availability of solar energy during this period represents an important opportunity for thermal (e.g. to heat water) and electrical (e.g. direct conversion of sunlight to electricity) application in the country.86
b) Wind Energy During the last ten years, global wind power capacity has continued to grow at an average cumulative rate of over 32 %. 15,000 MW (Megawatts) of new capacity were installed globally in 2006. By the end of 2006 the capacity reached a level of more than 74,000 MW, meeting the electricity needs of 25 million households worldwide. Approximately 70 countries around the world contribute to this figure, and the number of people employed by the industry worldwide is estimated to be up to 200,000. Europe still holds a share of 65 % of this global wind power capacity; however the recent trend shows that also other regions are beginning to emerge as substantial markets for the wind industry.88
86 Ministry of Electricity (Lahmeyer International) ‐ (February,2007): Renewable Energy Strategy and Action Plan ‐ Task 2: Renewable Energy Development Strategy – Final Report

Page 67
Figure 6.2: Global Wind Power Growth 1994‐2006 (Cumulative MW Growth [‘000])
0
10.000
20.000
30.000
40.000
50.000
60.000
70.000
80.000
1994 1996 1998 2000 2002 2004 2006
MW
Source: Global Wind Energy Council In accordance to the Global Wind Energy Council the MENA87 region to date, has built several hundred MW, with expansion coming mainly from North Africa. The leading countries here are Morocco, Egypt, Tunisia and Iran.88 Table 6.7: Range of annual wind speed at windy sites in ESCWA member countries Country Wind speed m/s Bahrain 5‐6 Egypt 4‐10 Iraq n.a. Jordan 5.5‐7.5 Kuwait 5‐6.5 Lebanon 3‐5 Oman 4‐6 Palestine 3‐5 Qatar 5‐7 Saudi Arabia 2.5‐4.5 Syrian Arab Republic 4.5‐11 United Arab Emirates 3.5‐4.5 Yemen 4‐6.6 Source: UNSCWA ‐ Potential and Prospects for Renewable Energy Electricity Generation in the ESCWA Region – Volume I – Overview of Wind and Biomass Systems – 2001 Attractive sites from a technical perspective are those with a capacity factor (CF) of more than 35 %. From the economic perspective attractive sites are those with a capacity factor of more than 39 %. Territories with factors like high capacity and high full load hours are along the coastal areas like in
87 MENA = Middle East and North Africa 88 Global Wind Energy Council

Page 68 Clean Development Mechanism – An Experience from Yemen
the south of the Governorate of Hudaydah. But also the Governorates of Aden, Taiz, Lahaj, and the mountainous regions in Sa’dah, some parts of Abyan, as well as mountain areas in Sa’dah and Amran, Sana’a, Dhamar, Al‐Beida, and Al‐Dhale are promising. The coastal plains from central Hudaydah up to Hajjah as well as Abyan and Shabwa would also offer a good potential.89
c) Small Hydro As the climate of Yemen is predominantly semi‐arid to arid the hydrological potential is very limited due to its low precipitation.
Figure 6.3: Spatial distribution of rainfall in Yemen Source: National Water Resources Authority (NWRA) The dams in Yemen are not sufficient for power generation as to its insufficient regular water volume. However, the country can be subdivided into four major drainage basins and from there split up into numerous smaller wadis. Wadis are streams with irregular floods, which are either dry or carry a minor base flow. A study carried out by the Ministry of Electricity in 200790 concludes that
89 Ministry of Electricity (Lahmeyer International) ‐ (February,2007): Renewable Energy Strategy and Action Plan ‐ Task 2: Renewable Energy Development Strategy – Final Report 90 Ministry of Electricity (Lahmeyer International) ‐ (February,2007): Renewable Energy Strategy and Action Plan ‐ Task 2: Renewable Energy Development Strategy – Final Report

Page 69
multiple wadis are technically feasible for hydrological power generation, in the range of 0.5‐7 MW. Table 6.8 provides a list of potential projects with the expected CERs.
Figure 6.4: Water Resources Management Regions
Source: National Water Resources Authority (NWRA) Table 6.8: Potential Hydro CDM in Yemen – a general overview Area (m2) Estimated
capacity Estimated days of
Expected power
Expected CER
Cost (million US$)

Page 70 Clean Development Mechanism – An Experience from Yemen
(kw) operation generation (MWh)
(CER/Year)
Wadi Mawr 7,910 2,000‐5,900 355 5,112‐20,107
3,732‐14,678
20,5
Wadi Zabid 4,450 1,170‐3,880 355 2,990‐13,223
2,183‐9,653 15,1
Wadi Surdud
2,700 1,650‐3,750 353 4,193‐12,708
3,061‐9,277 10,5
Wadi Tuban 5,060 2,100‐6,100 300 4,536‐17,568
3,311‐12,825
8,2
Wadi Bana 6,200 2,900‐7,100 350 7,308‐23,856
5,334‐17,415
7,8
Source: The CDM Potential of the Republic of Yemen prepared by Mitsubishi UFJ Securities for UNDP (March, 2007) &91
d) Geothermal Geothermal energy presents a high priority alternative to fossil fuels and is a proven resource for direct heat and power generation. Globally, geothermal resources provide a directly used heat capacity of 15,000 MWt in 58 countries and electric power generation capacity of over 8,000 MWe in
25 countries92. It meets a significant portion of the electrical power demand in several developing countries. The geology of Yemen is dominated by the major structures of the region, the Red Sea, the Gulf of Aden and the Eastern African Rift System. In early Miocene times (30 to 25 million years) the Arabo‐African continental crust made of Precambrian crystalline basement, ruptured along trending faults in the Red Sea region and trending faults in the Gulf of Aden region. The basement was uplifted and basaltic and rhyolitic intense activity took place building the Ethiopian and Yemenite plateaus. 12 million years ago, the propagation of Red Sea (N–S) and Gulf of Aden (E‐W) had totally separated the African and Arabian plates. These movements have affected the whole region by major events: Seismic, Tectonic and Volcanic. Yemen is located in one of the most active plate boundaries in the world, the triple junction made up by the Gulf of Aden, the Red Sea and the Eastern African Rift System. Setting aside some active volcanic islands in the southern Red Sea, abundant Oligocene‐to‐Quaternary flood alkaline basalt trap series (YTS) occupies the central‐western sector of Yemen, of about 50,000 km2. The rising of mantle basalts, still active in some Quaternary volcanic areas of continental Yemen, has certainly triggered the settling in crustal convective circulation of hydrothermal fluids. This convection is apparently the reason for the presence of the large number of thermal springs, as wells as fumaroles and CO2‐rich gas vents in several places of the country. Volcanic activity is present in several continental areas: i) along the tectonically active Gulf of Aden, ii) inside the central elevated areas of the Yemen Trap Plateau (YTP), from north of Sana’a to south of Taiz and iii) near Marib.93
91 Ministry of Electricity (Lahmeyer International) ‐ (February,2007): Renewable Energy Strategy and Action Plan ‐ Task 2: Renewable Energy Development Strategy – Final Report 92 2003 data; International Energy Association: Geothermal in the world data http://iga.igg.cnr.it/index.php 93 ELC‐Electroconsult (1981): Ministry of Oil and Minerals, Resources Corporation – YOMINCO, Yemen Arab Republic: The Dhamar‐Rada’a Geothermal Prospect; Geology and Volcanology of the Dhamar‐Rada’a Region. (YEM‐D‐5297)

Page 71
Geothermal investigations
The known geothermal prospects in Yemen occur within this triple junction made up by the Gulf of Aden, the Red Sea and the Eastern African Rift System. Here widespread volcanic activity and geothermal manifestations indicate the existence of a major indigenous source of environmentally clean energy. The power generation potential is yet to be quantified.
A series of preliminary geothermal investigations have been carried out for three decades both already in the Southern and Northern part of the country. Starting in the early 1980’s, carefully implemented regional reconnaissance surveys have lead to a sound prioritization of target areas in Yemen by the filtering out less promising prospects (ELC‐Electroconsult, 1982; Bureau de Recherche Géologique et Minière, BRGM94, 1985; Dowgiallo, 1986, Hazaea Mohammed, 200595). This has led to the definition of preliminary working hypotheses and thereby to the selection of one or more preferential areas. Samples were taken and the mineralogical assemblages verified. Thermal springs and gas vents were subject of chemical analyses of major components, trace elements, rare earth elements, oxygen and hydrogen isotopes and furthermore the geothermometric characters were qualified. This has resulted in a sound collection of geological and geochemical data (Fara et al., 199996; Minissale et al., 200797). However, particularly prior unification of North and South Yemen in 1990, coordination of research groups was lacking. The division of the country in two parts was not compatible with the flux of information to coordinate their conclusions and recommendations. In that context, different authors tried, separately, to conclude by a selection of high priority geothermal zones. Accordingly, several zones have been proposed as first class geothermal targets:
Studies of geothermal potential sites
Low‐enthalpy resources (70°‐75°) with good potential exist in the Mayfa’ah depression and in the plain of Mukalla (Addis, Al Hami, Tabalah, etc.) in the Southern part of Yemen. Medium‐enthalpy resources (80°‐ 130°) in Kirsh (north of Aden, southern part of the country), but reservoir potential remains to be demonstrated. High‐enthalpy resources (> 180°): On the base of high enthalpy methodology, the most favourable site should benefit of the superposition off all criteria: Thermal, Volcanic, Seismic and Tectonic activities.
Utilizing these results and by the means of preliminary studies both in North and South Yemen, the BRGM94 recommended already in 1980 the “Dhamar‐Rada’a geothermal field” as a first priority of high enthalpy geothermal exploration and also suggested other zones in the Southern part of Yemen (low and medium enthalpy). In 1981, the Italian ELC‐Electroconsult has contributed with a geological survey, an assessment of the local stratography, the structural and volcanological evolution; and reinforced the earlier conclusion by BRGM and signified the presence of heat source aquifers and reservoirs.
94 Bureau de Recherche Géologique et Minière, BRGM (1985): Geothermal Reconnaissance of People's Democratic Republic of Yemen 95 Hazaea Mohammed (2005): A geochemical survey of thermal springs in western part of Republic of Yemen and their geothermometric characteristics 96 Fara, M., et al. (1999): Hydrogeochemistry of Damt thermal springs, Yemen Republic. Geothermics, 28, 241‐252. 97 Minissale et al. (2007): Thermal springs, fumaroles and gas vents of continental Yemen: Their relation with active tectonics, regional hydrology and the country’s geothermal potential

Page 72 Clean Development Mechanism – An Experience from Yemen
The physical convective anomaly beneath the Yemen volcanic province was also detected by space imaginary (USGS, 1994)98, and classified as one of the most important in the whole region of the Afro‐Arabian rift system. As a result of volcanism, anomalous heat flow and related hydrothermal circulation, relatively large epithermal alteration haloes are present in many places, such as the opalitic alteration around the Quaternary Al Lisi volcano (Dhamar‐Rada’a geothermal field). This opalitic alteration along the Dhamar‐Al Lisi trend is seen as the surface expression of a
preserved epithermal vent and thus provides a valid target for geothermal resource exploration.95‐99
Such preserved haloes, especially if associated with gas and steam emission or thermal springs, as illustrated in the figure below, are surface expressions of a persistent epithermal episode, thus providing a valid reason for geothermal exploration.95‐99 Figure 6.5: Map of Yemen
98 U. S. Department of the Interior Geological Survey Open‐File Report 97‐470B: Map Showing Geology, oil and gas fields and geologic provinces of the Arabian Peninsula by Pollastro R., et al.

Page 73
Source: Minissale et al. (2007): Thermal springs, fumaroles and gas vents of continental Yemen: Their relation with active tectonics, regional hydrology and the country’s geothermal potential. The Dhamar‐Rada’a geothermal field was subject of further scientific studies (e.g.: Dowgiallo, 1986; Fara et al., 199999; Hazaea, 2004100; Minissale et al., 2007101; Mattash et al., 2005102). The resulting gas‐geothermometry and geological investigations have demonstrated that there are at least three areas (Al Lisi, Al Makhaya and Damt) within the Yemen volcanic plateau (Dhamar‐Rada’a geothermal field) with promising perspectives for the development of geothermal energy. In 2005, this was verified by the Yemeni Geological Survey and Minerals Resources Board in cooperation with the Institute of Geosciences and Earth Resources of Florence (Italy) by the means of a detailed scientific research. During which 65 emergences at 48 sampling sites were used, and the following was concluded: “According to this further evidence, besides the measured values of the 3He/4He and 13C/12C‐CO2 isotopic ratios, the areas Al Lisi, Al Makhaya and Damt can be considered of very high geothermal potentiality […].”103
e) Bioenergy
99 Fara, M., et al. (1999): Hydrogeochemistry of Damt thermal springs, Yemen Republic. Geothermics, 28, 241‐252. 100 Hazaea Mohammed (2004): A geochemical survey of thermal springs in western part of Republic of Yemen and their geothermometric characteristics 101 Minissale et al. (2007): Thermal springs, fumaroles and gas vents of continental Yemen: Their relation with active tectonics, regional hydrology and the country’s geothermal potential 102 Mattash et al. (2005): The First Geothermal Resources Map of Yemen, at a 1:125000 scale; Ministry of Oil and Mineral Resources, Sana’a (Republic of Yemen) 103 Minissale et al. (2007): Thermal springs, fumaroles and gas vents of continental Yemen: Their relation with active tectonics, regional hydrology and the country’s geothermal potential

Page 74 Clean Development Mechanism – An Experience from Yemen
Classic sources span from areas like biomass residues from agricultural processes, forestry and municipal waste to sewerage. Yemen uses some of its bioengery resources already for various applications such as cooking (small scale biodigester), animal feed and fertilizers. Given the limited availability of arable land and the scarcity of precipitation present quantity of crop residues are limited. Residues from animal farming offer some potential for energy generation. Due to limited industrial scale of animal farming the generation of CERs may be small. For example the Yemen Economic Corporation (YECO) operates two dairy farms which could provide potential for methane capture.
f) Oil and Natural Gas 1984 is marked as the onset of the oil area with the first commercial discovery of oil in the country. Oil was discovered in Block 18, Mareb/Al‐Jawaf. Two years later the production and export of the first oil shipment started from Block 18. Following the discovery of commercial amounts of oil in the eastern and mid areas of Yemen, the number of international oil companies working in oil exploration and production increased rapidly.104 As of today, oil is still the major force shaping macroeconomic performance, policies, and exchange rate developments. In 2005 the oil sector accounted for 13 % of the real GDP, contributed to 67 % of government budgetary revenue and 88 % of exports.105 In the first half of 2007 the production amounted to 360,000b/d. Output sustained, despite earlier prognosis of reduction in oil production, due to the discovery of smaller fields.106 Concerns are being raised on the sustainability as production of Marib and Masila oilfields are declining. The country’s present overall output is around 24% lower compared to the year before.107 However, the Ministry of Oil and Minerals sees in the opening of a raft of new exploratory blocks and improvement of extraction technologies scope for recovery with a targeted production of 500,000b/d in 2009.108 The Ministry provides an estimation of 9,718 billion barrels of oil reserves, with future exploration activities targeting offshore in the Gulf of Aden and in the Red Sea. A recent global study, prepared by the US National Oceanic and Atmospheric Administration (Noaa) at the request of the World Bank's Global Gas Flaring Reduction (GGFR) initiative, based on using satellite images provided an assessment on gas flaring being in the range of 150 billion‐170 billion m3/a between 1995 and 2006. It is further stated: “If sold last year in the US, the market value of the world's flared gas would have been $69 billion. The volume equates to 6% of global gas use, the size of the combined markets of Japan, China and Australia.”109 Figures on current flaring practices are sensitive and not readily available. The DNA Secretariat, however, has been recently seeing an increased recognition by the market on the economic value of associated gas linked to utilization. Yemen has an integrated network of pipelines to transport crude oil to the export terminals. On the downstream side there is a crude refining capacity from two refineries (Marib: start of operation in 1986; and Aden: start of operation 1954) of 90,000 ‐ 130,000 bbl/d. There are plans to upgrade these refineries and to expand the capacity. Plans are for the construction of a hydro‐cracking unit
104 Ministry of Oil and Minerals ‐ Yemen 105 Chami, S. et al. (IMF: WP/2007/5) Yemen: Exchange Rate Policy in the Face of Dwindling Oil Exports 106 The Economist Intelligence Unit (August, 2007): Country Report ‐ Yemen 107 The Economist Intelligence Unit (August, 2007): Country Report ‐ Yemen 108 The Economist Intelligence Unit (August, 2007): Country Report ‐ Yemen 109 Smedley, M., World Gas Intelligence (8 August 2007): Global Satellite‐Based Report Names And Blames Flarers

Page 75
and the modernization of both distillation units. At a planning stage is the construction of new refineries, like the Al‐ Dhaba Refinery Project. With the 2005 decision to launch the Yemen Liquefied Natural Gas (YLNG) Project, the GOY and its shareholders of Yemen LNG Company Ltd. have initiated the country’s largest‐ever planned investment, budgeted at US$ 3,7 billion.110 Yemen LNG Company Ltd. states the following: “The reserves within the Marib area which are currently dedicated to the project include 9.15 trillion cubic feet (TCF) of proven reserves with 1 TCF allocated for use in the domestic market, and an additional 0.7 TCF of probable reserves.111 The Yemen LNG chain will comprise new and existing upstream gas processing facilities including a transfer line linking the two gas processing units, a new main pipeline, which will connect the gas processing facilities to the new liquefaction facilities in Balhaf, and a spur line to transport domestic gas to the Ma’bar area.”112
6.3.2. Industrial processes
Yemen is likely to witness some improvement in the non‐oil industrial sector benefiting from some present investments.113 The cement industry is considered as one of the players in the industrial sector. Commercial production started back in 1973 with the launching of the first production line of the Bajil Cement Factory. The Yemen Corporation for Cement Industry and Marketing amounts the annual profit in 2006 at 3.996.719.5932 YR.114 High cement demand leads to rapid increase in production. With limestone in its vicinity, existing production lines like in Amran are
being improved, extension projects as at the Al‐Barh Cement Factory are planned and new cement industries are being built like the Al‐Muscainer Cement Factory.115
6.3.3. Waste
110 www.yemenlng.com 111 www.yemenlng.com 112 Yemen LNG Company Ltd – www.yemenlng.com 113 The World Bank Group, Sana’a Office, 2007 – Yemen Economic Update, 40441 114 Yemen Corporation for Cement Industry and Marketing (2007): Cement Industry in the Republic of Yemen – Effective efforts & wide ambitions. 115 Yemen Corporation for Cement Industry and Marketing (2007): Cement Industry in the Republic of Yemen – Effective efforts & wide ambitions.

Page 76 Clean Development Mechanism – An Experience from Yemen
Municipal waste deposited in landfills generate methane due to the anaerobic decomposition of the waste. Like in other countries in the South the waste generated contains significantly higher levels of organic (biodegradable) material. 1.000 tons of municipal wastes are daily disposed of at the Al – Azraqain landfill in the North of Sana’a. The landfill is more than 25 years in operation under the Sana’a Cleaning Fund and occupies around 350.000 m2 of land. The system is operating all year round and from approximately 80% of the municipal waste generated in the capital and parts of Amran are disposed of at this landfill. The Sana’a Cleaning Fund estimates the organic content around 60% of the total waste landfilled. Paper fraction is 10%, plastic 15%, metal 13% whereas glass is around 2%.116 A potential CDM activity at the Sana’a landfill would be targeting at biogas recovering and flaring. The main objective would be GHG reduction and thereby to assist in cleaner air quality in the area. The scope for commercial power generation would need a detailed assessment. A recent study provides that the landfill site in Sana’a could potentially generate 3 MW of power while those in Aden, Taiz and Al‐Hodeidah, at around 1 MW each.117
According to the Kyoto Protocol, investments in wastewater handling in non‐Annex I countries may qualify for CDM credits. Wastewater containing organic material and treated through an anaerobic decomposition process generates as one of its by‐products methane gas. Methane can be used as a source of energy and, as seen in many parts of the world, is helping to reduce overall energy costs. Biogas when collected can be used – for example ‐ as fuel in a combined heat and power (CHP)
installation to generate thermal heat and electricity. On average, Yemeni treatment plants have a process rate of 14 million m3/a. Assessments of the potential for producing methane gas resulted in a generation capacity for Aden of approximately 0.53 MW, for Sana’a 0.29 MW and for Al‐Hodeidah up to 0.22 MW of power.118 Table 6.9: Potential wastewater CDM activities in Yemen ‐ calculations
116 Interview with the Manager of the Landfill (2007) 117 Ministry of Electricity (Lahmeyer International) ‐ (February, 2007): Renewable Energy Strategy and Action Plan ‐ Task 2: Renewable Energy Development Strategy – Final Report 118 Ministry of Electricity (Lahmeyer International) ‐ (February, 2007): Renewable Energy Strategy and Action Plan ‐ Task 2: Renewable Energy Development Strategy – Final Report

Page 77
Treatment capacity (m3/day)
Total waste water (m3/year)
Methane potential
(t CH4/year)
CER potential (CER/year)
Aden (Ash Shaab) 41,000 14,965,000 4,412 92,658Aden (Al Arish) 70,000 25,550,000 7,533 158,196Amran 1,480 540,200 159 3,345Bait El Faqih 2,544 928,560 274 5,749Bajil 4,151 1,515,115 447 9,381Hodeidah 63,500 23,177,500 6,834 143,507Mukalla 14,000 5,110,000 1,507 31,639Rada 1,880 686,200 202 4,249Yarim 1,771 646,415 191 4,002 Source: The CDM Potential of the Republic of Yemen prepared by Mitsubishi UFJ Securities for UNDP (March, 2007) & 119 Assumptions: COD = 1,95kg/m3; Methane rate: 0,21kg CH4/kg COD Annex 1
119 Ministry of Water and Environment, Environment Protection Authority, Kreditanstalt für Wiederaufbau (2003): Feasibility Study for Effluent and Sludge Reuse in Aden, Amran, Hajjah, Ibb and Yarim – Concept Report

Page 78 Clean Development Mechanism – An Experience from Yemen
CDM related bodies ‐ Conference of the Parties serving as the meeting of the Parties to the Kyoto Protocol
(COP/MOP) The CDM is subject to the authority and guidance of the COP/MOP. The rules and procedures can be outlined as follows:
• Has authority over the CDM and provides guidance to it;
• Decides on the recommendations made by the CDM EB on its rules of procedure;
• Decides on the designation of DOEs accredited by the CDM EB;
• Reviews the annual reports of the EB;
• Reviews the regional and sub‐regional distribution of DOEs and CDM project activities;
• Assists in arranging funding of CDM project activities, as deemed necessary. The COP/MOP ensures that a share of the proceeds from certified project activities is used to cover administrative expenses as well as to assist developing country Parties that are particularly vulnerable to the adverse effects of climate change to meet the costs of adaptation.120 ‐ Designated National Authority (DNA) Parties participating in the CDM have to designate a national authority for the CDM.121 The DNA issues a written approval of voluntary participation to the CDM project participants. This approval letter needs to include confirmation that the project activity assists in achieving sustainable development in the host country. The details of the approval procedure and the definition of sustainable development are with the authority of the host country. The definition is, therefore, left to the sovereignty of the country. ‐ The CDM Executive Board (EB) The EB supervises the CDM and operates under the authority of the COP/MOP. The EB is fully accountable to the COP/MOP. It consists of 10 members122 and 10 alternates, drawn from all constituencies of Parties, elected by the COP/MOP and acting in their personal capacities. The roles and services of the EB are as follows123:
120 Kyoto Protocol to the United Nations Framework on Climate Change: Article 12 121 CMP/2005/8/Ad1 122 One member from each of the 5 UN regional groups, two other members from the Annex I Parties, two other members from the non‐Annex I Parties, and one representative of the small island developing states. 123 FCCC/KP/CMP/2005/8/Add.1

Page 79
• makes recommendations to the COP/MOP on further modalities and procedures for the
CDM and/or any amendments or additions to rules of procedure for the EB, as deemed appropriate;
• reports on its activities to each session of the COP/MOP;
• approves new methodologies relating to, inter alia, baselines, monitoring plans and project boundaries;
• reviews provisions with regard to simplified modalities, procedures and the definitions
of small‐scale project activities and make recommendations to the COP/MOP;
• is responsible for the accreditation of operational entities, and makes recommendations to the COP/MOP for the designation of operational entities;
• makes any technical reports commissioned available to the public and provide a period of at least eight weeks for public comments on draft methodologies and guidance before documents are finalized and any recommendations are submitted to the COP/MOP for their consideration;
• develops and maintains the CDM registry;
• registers a validated project as a CDM project activity124;
• instructs to issue CERs for a CDM project activity to the CDM registry administrator, working under the authority of the Executive Board.
‐ Panels, Working Groups and Teams The EB has established so far five panels, working groups and teams. The aim of the following, are to provide expertise to the EB:
o Accreditation Panel (AP) The responsibility of the AP is to provide recommendations to the EB on the accreditation of an applicant OE125 but also on the suspension, withdrawal and/or re‐accreditation of a DOE. The AP consists of 7 members in addition to the designated EB members acting as chair and vice‐chair.
o Methodologies Panel (Meth Panel) The task of the Meth Panel is to develop recommendations to the EB on guidelines for methodologies for baselines and monitoring plans. It also prepares recommendations on submitted proposals for new baselines and monitoring methodologies. Further, it elaborates on recommendations for revisions to the project design document and drafts decision trees and
124 CMP/2005/8/Add1, p19 para66 125 Applicant OE – status before the DOE is designated by the COP/MOP

Page 80 Clean Development Mechanism – An Experience from Yemen
methodological tools to guide methodology selection.126 The Meth panel consists of 16 members in addition to the designated EB members.
o CDM Registration and Issuance Team (RIT) The RIT assists to prepare appraisals of requests for registration and issuance of CERs assessing whether their requirements are met and/or appropriately dealt with by DOEs for consideration by the EB. The RIT is composed of not less than twenty (20) members.127
o Afforestation and reforestation working group (AR‐WG) The responsibility of the AR‐WG is to make recommendations to the EB on baseline and monitoring methodologies for A/R CDM project activities.128 It works in cooperation with the Meth panel. The working groups consist of 8 members in addition to two members of the EB acting as Chair and Vice‐Chair.
o Small scale working group (SSC‐WG) The SSC‐WG) is responsible for preparing recommendations on submitted proposals for new baseline and monitoring methodologies for CDM small scale project activities. In addition to the Chair and Vice‐Chair from the EB, the working group consists of 5 members, 2 of whom are members from the Meth Panel.
o Project Participants (PP) A PP is (i) a Party involved, and/or (ii) a private and/or public entity authorized by a Party involved participating in a CDM project activity. ‐ Designated Operational Entities (DOE) A designated entity is either a domestic legal entity or an international organization accredited and designated, on a provisional basis until confirmed by the COP/MOP, by the EB. The DOE is often referred to as the prolonged arm of the EB. The two key tasks of a DOE can be summarized as follows:
• To validate and subsequently request registration of a proposed CDM project activity; • To verify emission reduction of a registered project activity, certifies as appropriate and
requests the Board to issue the CERs accordingly. This needs to be done on the basis of:
o Voluntary participation approved by each Party involved; o Real measurable, and long‐term benefits related to the mitigation of climate change;
and o Reductions in emissions that are additional to any that would occur in the absence
of the certified project activity.129 Annex 2
126 EB 30 Report Annex 3 page 1 127 EB 29 Report Annex 14 page 1 128 EB 23 Report Annex 14 page 1 129 www.unfccc.int

Page 81
Table: Agriculture and Fisheries 1
Indicator 2004 2005 No of Agri. Holdings (Holder) 1180105 1180105Cultivable Area (Hectare) 1452437 1452437Cultivated Area (Hectare) 1188888 1202113
Products Agricultural Crops (ton) Wheat 103265 112963Other Cereal 439636 442459Vegetables 833416 882053Cash crops 68345 68961Fruits 742408 764790Qat 118207 121399Fodder 1505204 1541288
Products Value (million Y.R.) Wheat 5886 8896Other Cereals 27078 33481Vegetables 50286 56971Cash crops 16279 21137Fruits 75858 83858Qat 137226 152456Fodder 14724 19019 Source: Central Statistical Organization – Yemen in Figures, 2005 – published 2006 Table: Agriculture and Fisheries 2

Page 82 Clean Development Mechanism – An Experience from Yemen
Indicator 2004 2005
Count of livestock (000) Sheep 7899 7980Goats 7785 7864Cattle 1433 1447Camels 353 357
Value of Product of livest. (ton) Meat 70931 72627Milk 212501 216608Poultry Meat 110976 113195Honey 759 807Leather (Hides) 9515 9715Wool 3501 3573 Source: Central Statistical Organization – Yemen in Figures, 2005 – published 2006
Table: Agriculture and Fisheries 3
Indicator 2004 2005 Prod. Quantity of Fisheries (ton)
Surface Fish 228246 216263Deep Water Fish 2447 1547Other Aquatic Catch 25673 21035Total 256366 23
Prod. Quant. Of Fisheries (Mill.Y.R.) Surface Fish 36747.6 44117.7Deep Water Fish 276.1 178.7Other Aquatic Catch 7527.7 6654.2Total 44551.4 50950.6No. of Fishing co‐operatives 113 114Fishermen 65198 65198Boats 16890 16890 Source: Central Statistical Organization – Yemen in Figures, 2005 – published 2006 Figure: Production Quantity of Fish (ton) 2005

Page 83
0%10%20%30%40%50%60%70%80%90%
2005
Deep Water Fish
Other Aquatic Catch
Surface Fish
Source: Central Statistical Organization – Yemen in Figures, 2005 – published 2006 Table: Industry and Energy
Indicator 2004 2005 Total No. of Workers 162750 175749Gross value output (mio YR) 391607 548250Gross value added (mio YR) 140835 197169
Production of main commodities Oil (Mio Barrel) 147.5 146.00Canned Fish (000 cans) 24499 29644Soft drinks (M.lt) 127 154Cigarettes (M. packed) 90 109Assorted Textiles (000 m) 1435 1736Cement (000 ton) 111 134 Source: Central Statistical Organization – Yemen in Figures, 2005 – published 2006 Figure: Quantity of Petroleum Production 2004‐2005 (in Barrel 000)

Page 84 Clean Development Mechanism – An Experience from Yemen
145
145.5
146
146.5
147
147.5
2004 2005
2004
2005
Source: Central Statistical Organization – Yemen in Figures, 2005 – published 2006 Table: Industry and Energy
Indicator 2004 2005 Indicators for Electricity and Water
Electricity Production Total (GWH)
4365.86 4767.28
Total Electricity Output (GWH) 3918 4369Electricity sold (GWH) 2941 3294Electricity Loss (%) 25.01 25Number of Consumers (000) 1058 1121.6Consumption per Capita (KWH) 2780 2937Fuel Consumption (M.L) 1344 1416Consumed Water sold (000 m3) 79774 83633No. of Subscribers 468456 491699No. of Beneficiaries 3281992 3441451 Source: Central Statistical Organization – Yemen in Figures, 2005 – published 2006 Figure: Distributed electric power and consumed 2004‐2005

Page 85
Source: Central Statistical Organization – Yemen in Figures, 2005 – published 2006 Table: National Account
Indicator 2004 2005
GDP at Current Price (MYR) 2563490 3206976
GDP at Market Prices at constant Price 283032 295469
Growth Rates of GDP at current prices (%) 18.65 25.10
Growth rates of GDP at constant prices (%) 3.82 4.39
The Structure of the GDP by Economic Activity at current prices (%)
Agriculture, Fisheries and Forestry 11.73 10.54
Mining 31.07 35.72
Manufacture 7.37 7.13
Electricity, water and gas 0.83 0.72
Construction 5.90 5.44
Wholesale and retail trade, rest. & hotels 13.96 12.82
Transport, storage & comm. 11.36 10.97
Financial Inst. & real estate 7.14 6.37
Community, social & personal services 1.35 1.32
B‐producers of Gov. services 9.63 9.61
Source: Central Statistical Organization – Yemen in Figures, 2005 – published 2006

Page 86 Clean Development Mechanism – An Experience from Yemen
Table: National Account
Indicator 2004 2005 The structure of the GDP by economic activity at current prices (%)
C‐Household Sector (household services)
0.02 0.02
D‐Producers of private non‐profit services
0.05 0.05
E‐Import Duties 2.02 1.59Imputed Bank Service Charge ‐2.44 ‐2.31GDP at market prices 100 100Non‐oil GDP 69.04 64.37
The structure of GDP by economic activity at constant prices (%) Agriculture, Forestry and Fisheries
21.16 20.69
Mining 13.95 13.29Manufacture 9.58 9.91Electricity, water and gas 1.31 1.34Construction 2.13 2.13Wholesale and retail, trade, rest. & hotels
9.19 9.11
Transport, storage & communications
13.26 13.86
Financial institutions & real estate
8.36 8.33
Community, Social & Personal serv.
1.89 2.12
B‐producers of Government services
20.17 20.60
C‐Household Sector (house service)
0.11 0.11
D‐producer of private non‐profit services
0.06 0.06
E‐import duties 1.80 1.41Imputed Bank Service Charge ‐2.96 ‐2.96GDP at Market prices 100 100Non‐oil GDP 86.55 87.22
Source: Central Statistical Organization – Yemen in Figures, 2005 – published 2006

Page 87
Table: National Account
Indicator 2004 2005 Structure of Expenditure on GDP at current prices (%) Final consumption expenditure 78.80 76.35Public final consumption 12.56 13.33Private final consumption 66.24 63.02Gross investment 20.28 18.58Gross fixed capital formation 21.00 18.04Change in stock 0.72 0.54Exports of goods and services 36.37 40.88Exports of goods 33.71 38.32Exports of services 2.66 2.56Imports of goods and services 35.45 35.81Imports of goods 27.81 28.12Imports of services 7.64 7.69GDP at Market Prices 100.00 100.00 Source: Central Statistical Organization – Yemen in Figures, 2005 – published 2006 Table: Foreign Trade
Indicator 2005 Top exporting countries (MYR)
UAE 173561Saudi Arabia 81841Switzerland 78619Kuwait 61154China 56517USA 41399Brazil 28730
Top importing countries (MYR) China 378023India 173886Thailand 127593Japan 67730South Korea 67525Switzerland 56462USA 34154 Source: Central Statistical Organization – Yemen in Figures, 2005 – published 2006

Page 88 Clean Development Mechanism – An Experience from Yemen
Annex 3 Table: Approved methodologies – large scale
Methodology Number
Methodology Title (including baseline and monitoring methodologies)
AM0001 Incineration of HFC 23 waste streams AM0002 Greenhouse gas emission reductions through landfill gas capture and flaring
where the baseline is established by a public concession contract AM0003 Simplified financial analysis for landfill gas capture project AM0007 Analysis of the least‐cost fuel option for seasonally‐operating
biomass cogeneration plants” AM0009 Recovery and utilization of gas from oil wells that would otherwise be flared AM0010 Landfill gas capture and electricity generation projects where landfill gas
capture is not mandated by law AM0011 Landfill gas recovery with electricity generation and no capture or
destruction of methane in the baseline scenario AM0013 Avoided methane emissions from organic waste‐water treatment AM0014 Natural gas‐based package cogeneration AM0017 Steam system efficiency improvements by replacing steam traps and
returning condensate AM0018 Baseline methodology for steam optimization systems AM0019 Renewable energy projects replacing part of the electricity production of
one single fossil fuel fired power plant that stands alone or supplies to a grid, excluding biomass projects
AM0020 Baseline methodology for water pumping efficiency improvements AM0021 Baseline Methodology for decomposition of N2O from existing adipic acid
production plants AM0022 Avoided Wastewater and On‐site Energy Use Emissions in the Industrial
Sector AM0023 Leak reduction from natural gas pipeline compressor or gate stations AM0024 Baseline methodology for greenhouse gas reductions through waste heat
recovery and utilization for power generation at cement plants AM0025 Avoided emissions from organic waste through alternative waste treatment
processes AM0026 Methodology for zero‐emissions grid‐connected electricity generation from
renewable sources in Chile or in countries with merit order based dispatch grid
AM0027 Substitution of CO2 from fossil or mineral origin by CO2 from renewable sources in the production of inorganic compounds
AM0028 Catalytic N2O destruction in the tail gas of Nitric Acid or Caprolactam Production Plants
AM00 29 Baseline Methodology for Grid Connected Electricity Generation Plants using Natural Gas
AM0030 PFC emission reductions from anode effect mitigation at primary aluminium smelting facilities
AM0031 Baseline Methodology for Bus Rapid Transit Projects AM0033 Use of non‐carbonated calcium sources in the raw mix for cement
processing AM0034 Catalytic reduction of N2O inside the ammonia burner of nitric acid plants

Page 89
AM0035 SF6 Emission Reductions in Electrical Grids AM0036 Fuel switch from fossil fuels to biomass residues in boilers for heat
generation AM0037 Flare reduction and gas utilization at oil and gas processing facilities AM0038 Methodology for improved electrical energy efficiency of an existing
submerged electric arc furnace used for the production of SiMn AM0039 Methane emissions reduction from organic waste water and bioorganic solid
waste using composting AM0040 Baseline and monitoring methodology for project activities using alternative
raw materials that contain carbonates in clinker manufacturing in cement kilns
AM0041 Mitigation of Methane Emissions in the Wood Carbonization Activity for Charcoal Production
AM0042 Grid‐connected electricity generation using biomass from newly developed dedicated plantations
AM0043 Leak reduction from a natural gas distribution grid by replacing old cast iron pipes with polyethylene pipes
AM0044 Energy efficiency improvement projects: boiler rehabilitation or replacement in industrial and district heating sectors
AM0045 Grid connection of isolated electricity systems AM0046 Distribution of efficient light bulbs to households AM0047 Production of biodiesel based on waste oils and/or waste fats
from biogenic origin for use as fuel AM0048 New cogeneration facilities supplying electricity and/or steam to multiple
customers and displacing grid/off‐grid steam and electricity generation with more carbon‐intensive fuels
AM0049 Methodology for gas based energy generation in an industrial facility AM0050 Feed switch in integrated Ammonia‐urea manufacturing industry AM0051 Secondary catalytic N2O destruction in nitric acid plants AM0052 Increased electricity generation from existing hydropower stations through
Decision Support System optimization AM0053 Biogenic methane injection to a natural gas distribution grid AM0054 Energy efficiency improvement of a boiler by introducing oil/water emulsion
technology AM0055 Baseline and Monitoring Methodology for the recovery and utilization of
waste gas in refinery facilities AM0056 Efficiency improvement by boiler replacement or rehabilitation and optional
fuel switch in fossil fuel‐fired steam boiler systems AM0057 Avoided emissions from biomass wastes through use as feed stock in pulp
and paper production AM0058 Introduction of a new primary district heating system AM0059 Reduction in GHGs emission from primary aluminium smelters Source: www.cdm.unfccc.int – Status: 01.12.2007130 130 The readers are encouraged to refer to www.unfccc.int for the full text and most updated version.

Page 90 Clean Development Mechanism – An Experience from Yemen
Table: Approved Consolidated Methodologies
Methodology Number
Methodology Title (including baseline and monitoring methodologies)
ACM0001 Consolidated baseline methodology for landfill gas project activities” ACM0002 Consolidated baseline methodology for grid‐connected electricity
generation from renewable sources ACM0003 Emissions reduction through partial substitution of fossil fuels with
alternative fuels or less carbon intensive fuels in cement manufacture ACM0005 Consolidated Baseline Methodology for Increasing the Blend in Cement
Production ACM0006 Consolidated methodology electricity generation from biomass residues ACM0007 Baseline methodology for conversion from single cycle to combined cycle
power generation ACM0008 Consolidated baseline methodology for coal bed methane and coal mine
methane capture and use for power (electrical or motive) and heat and/or destruction by flaring
ACM0009 Consolidated baseline methodology for fuel switching from coal or petroleum fuel to natural gas
ACM0010 Consolidated baseline methodology for GHG emission reductions from manure management systems
ACM0011 Consolidated baseline methodology for fuel switching from coal and/or petroleum fuels to natural gas in existing power plants for electricity generation
ACM0012 Consolidated baseline methodology for GHG emission reductions for waste gas or waste heat or waste pressure based energy system
ACM0013 Consolidated baseline and monitoring methodology for new grid connected fossil fuel fired power plants using a less GHG intensive technology”
Source: http://cdm.unfccc.int/methodologies/PAmethodologies/approved.html131 Status: 01.12.2007 Table: Approved small‐scale methodologies132 Reference Methodologies Title
(including baseline and monitoring methodologies) AMS‐I.A. Electricity Generation by User AMS‐I.B. Mechanical energy for the user with or without electrical energy AMS‐I.C. Thermal energy for the user with or without electricity AMS‐I.D. Grid connected renewable electricity generation AMS‐II.A. Supply side energy efficiency improvements – transmission and distribution AMS‐II.B. Supply side energy efficiency improvements ‐ generation AMS‐II.C. Demand‐side energy efficiency activities for specific technologies AMS‐II.D. Energy efficiency and fuel switching measures for industrial facilities AMS‐II.E. Energy efficiency and fuel switching measures for buildings
131 The readers are encouraged to refer to www.unfccc.int for the full text and most updated version. 132 The readers are encouraged to refer to www.unfccc.int for the full text and most updated version.

Page 91
AMS‐II.F. Energy efficiency and fuel switching measures for agricultural facilities and
activities AMS‐III.A. Agriculture AMS‐III.B. Switching fossil fuels AMS‐III.C. Emission reduction by low‐greenhouse gas emitting vehicles AMS‐III.D. Methane recovery in agricultural and agro industrial activities AMS‐III.E. Avoidance of methane production from biomass decay through controlled
combustion AMS‐III.F. Avoidance of methane production from decay of biomass through
composting AMS‐III.G. Landfill methane recovery AMS‐III.H. Methane recovery in wastewater treatment AMS‐III.I. Avoidance of methane production in wastewater treatment through
replacement of anaerobic lagoons by aerobic systems AMS‐III.J. Avoidance of fossil fuel combustion for carbon dioxide production to be used
as raw material for industrial processes AMS‐III.K. Avoidance of methane release from charcoal production by shifting from pit
method to mechanized charcoaling process AMS‐III.L. Avoidance of methane production from biomass decay through controlled
pyrolysis AMS‐III.M. Reduction in consumption of electricity by recovering soda from paper
manufacturing process AMS‐III.N. Avoidance of HFC emissions in rigid Poly Urethane Foam (PUF) manufacturingAMS‐III.O. Hydrogen production using methane extracted from biogas AMS‐III.P Recovery and utilization of waste gas in refinery facilities AMS‐III.Q Waste gas based energy systems AMS‐III.R. Methane recovery in agricultural activities at household/small farm level Source: www.cdm.unfccc.int – Status: 03.12.2007

Page 92 Clean Development Mechanism – An Experience from Yemen
Table: Approved methodologies ‐ AR
Methodology Number
Methodology Title (including baseline and monitoring methodologies)
AR‐AM0001 Reforestation of degraded land AR‐AM0002 Restoration of degraded lands through afforestation/reforestation AR‐AM0003 Afforestation and reforestation of degraded land through tree planting,
assisted natural regeneration and control of animal grazing AR‐AM0004 Reforestation or afforestation of land currently under agricultural use AR‐AM0005 Afforestation and reforestation project activities implemented for industrial
and/or commercial uses AR‐AM0006 Afforestation/Reforestation with Trees Supported by Shrubs on Degraded
Land AR‐AM0007 Afforestation and Reforestation of Land Currently Under Agricultural or
Pastoral Use AR‐AM0008 Afforestation or reforestation on degraded land for sustainable wood
production AR‐AM0009 Afforestation or reforestation on degraded land allowing for silvopastoral
activities AR‐AM0010 Afforestation and reforestation project activities implemented on
unmanaged grassland in reserve/protected areas Source: www.cdm.unfccc.int Status: 02.12.2007133 Table: Approved small‐scale afforestation and reforestation SSC‐A/R methodologies
Methodology Number
Methodology Title (including baseline and monitoring methodologies)
AR‐AMS0001
Simplified baseline and monitoring methodologies for small‐scale afforestation and reforestation project activities under the clean development mechanism implemented on grasslands or croplands
Source: www.cdm.unfccc.int Status: 02.12.2007134
133 The readers are encouraged to refer to www.unfccc.int for the full text and most updated version. 134 The readers are encouraged to refer to www.unfccc.int for the full text and most updated version.

Ministry of Water and EnvironmentEnvironment Protection AuthorityDNA SecretariatSana’a, Republic of Yemenwww.cdm-yemen.org
Copyright © 2008, Ministry of Water and Environment, Republic of Yemen
Author: Lia Carol Sieghart – Ministry of Water and Environment, Republic of Yemen
CDM Yemen