CLASSROOM OBSERVATIONS OF INSTRUCTIONAL …
112
CLASSROOM OBSERVATIONS OF INSTRUCTIONAL PRACTICES AND TECHNOLOGY USE BY ELEMENTARY SCHOOL TEACHERS AND STUDENTS IN AN ETHNICALLY-AND ECONOMICALLY- DIVERSE SCHOOL DISTRICT A Dissertation by KAYLA BRAZIEL ROLLINS Submitted to the Office of Graduate Studies of Texas A&M University in partial fulfillment of the requirements for the degree of DOCTOR OF PHILOSOPHY August 2011 Major Subject: Curriculum and Instruction
Transcript of CLASSROOM OBSERVATIONS OF INSTRUCTIONAL …
iii
CLASSROOM OBSERVATIONS OF INSTRUCTIONAL PRACTICES AND
TECHNOLOGY USE BY ELEMENTARY SCHOOL TEACHERS AND
STUDENTS IN AN ETHNICALLY-AND ECONOMICALLY-
DIVERSE SCHOOL DISTRICT
A Dissertation
by
KAYLA BRAZIEL ROLLINS
Submitted to the Office of Graduate Studies of Texas A&M University
in partial fulfillment of the requirements for the degree of
DOCTOR OF PHILOSOPHY
August 2011
Major Subject: Curriculum and Instruction

iv
Classroom Observations of Instructional Practices and Technology Use by Elementary
School Teachers and Students in an Ethnically-and Economically-Diverse
School District
Copyright 2011 Kayla Braziel Rollins

v
CLASSROOM OBSERVATIONS OF INSTRUCTIONAL PRACTICES AND
TECHNOLOGY USE BY ELEMENTARY SCHOOL TEACHERS AND
STUDENTS IN AN ETHNICALLY-AND ECONOMICALLY-
DIVERSE SCHOOL DISTRICT
A Dissertation
by
KAYLA BRAZIEL ROLLINS
Submitted to the Office of Graduate Studies of Texas A&M University
in partial fulfillment of the requirements for the degree of
DOCTOR OF PHILOSOPHY
Approved by:
Chair of Committee, Hersh Waxman
Committee Members, Tracy Collins Yolanda Padrón Dennie Smith Head of Department, Dennie Smith
August 2011
Major Subject: Curriculum and Instruction

iii
iii
ABSTRACT
Classroom Observations of Instructional Practices and Technology Use by Elementary
School Teachers and Students in an Ethnically-and Economically-Diverse
School District. (August 2011)
Kayla Braziel Rollins, B.S., Texas Christian University;
M.Ed., Texas Christian University
Chair of Advisory Committee: Dr. Hersh Waxman
The purpose of this study was to observe pre-kindergarten through fifth-grade
public school classrooms to examine differences among instructional practices and
technology use by teachers, students and the overall classroom. The current study
differed from and built upon previous classroom observational research in a number of
major ways. First, the observational data examined both student and teacher technology
use and the availability of technology in the classroom. Second, authentic classroom
behaviors were examined in relation to technology use; specifically, behaviors related to
the impact of technology use on student engagement as well as differences among
technology use in classrooms and differences by student socio-economic status. Finally,
unlike previous studies, this study focused specifically on pre-kindergarten through fifth-
grade classrooms from the same large public school district that was diverse by both
socio-economic status (SES) and by student ethnicity.

iv
iv
Overall, the results of this study suggest that technology has not been adequately
implemented into the observed classrooms. Technology was available but was not used
to a great extent. When technology was implemented, teachers were primarily observed
using it to present material and students were observed using it almost exclusively for
basic skills activities. This low-level of technology integration occurred in elementary
schools of a high performing school district which had a technology plan in place, a low
student to computer ratio, and 100% of the classrooms had Internet access.
Furthermore, only 15% of teachers were observed integrating technology to a
great extent; however, students in these classrooms were observed on task significantly
more frequently than students in classrooms where technology was observed less or not
at all. On the other hand, students were observed off task significantly more in
classrooms where either no technology integration was observed or where it was only
observed a moderate amount. These findings support and build upon previous
observational studies. There is still a need, however, for strong, empirical research to be
conducted to further examine the use of technology in elementary classrooms.

v
v
ACKNOWLEDGEMENTS
Most importantly, I would like to express my utmost appreciation to my
committee chair, Dr. Hersh Waxman. Your constant support, guidance, and expertise
have been invaluable. Thank you for always providing that extra push that I often
needed. It has been an honor working with you.
Thank you to Dr. Tracy Collins for always being there to talk to (and share
Gracie and Addie adventures!) Thank you to Dr. Yolanda Padrón for inviting me to be a
part of this project and helping to guide my research. Thank you to Dr. Dennie Smith for
being such an integral part of my doctoral journey from the very beginning.
Thank you to my colleagues at the State of Texas Education Research Center
(ERC) at Texas A&M University and the staff in the Department of Teaching, Learning,
& Culture (TLAC) at Texas A&M University for all of your help and support.
Beverly and Danielle, words cannot describe how grateful I am to both of you for
the support and friendship that you have provided. I look forward to continued
collaboration throughout our careers. Cheers!
Thank you to Mom and Dad, John and Addie, Granny, and Grandma for all of
your prayers and constant encouragement. This would not have been possible without
you. Finally, thank you to my husband, Matt, for loving and supporting me throughout
this process. I love you all dearly.

vi
vi
TABLE OF CONTENTS
Page
ABSTRACT .............................................................................................................. iii
ACKNOWLEDGEMENTS ...................................................................................... v
TABLE OF CONTENTS .......................................................................................... vi
LIST OF TABLES .................................................................................................... viii
CHAPTER
I INTRODUCTION ................................................................................ 1 Concerns with Previous Technology Research .............................. 4 Purpose of the Study ...................................................................... 5 Research Questions ........................................................................ 6 II REVIEW OF RESEARCH .................................................................. 8
Technology and Young Children ................................................... 8 Instruction and Technology ............................................................ 19 Classroom Observation Studies of Technology Use ...................... 29 Summary ........................................................................................ 41 III METHODS ........................................................................................... 43
Setting ............................................................................................. 43 Participants ..................................................................................... 45 Instruments ..................................................................................... 46 Data Analysis ................................................................................. 48
IV RESULTS ............................................................................................. 51 Results Related to Type of Technology in Classrooms ................. 51 Results Related to Teacher and Student Technology Use .............. 54 Results Related to Differences in Technology Use by Socio- Economic Status ............................................................................. 61

vii
vii
CHAPTER Page Results Related to Technology Use and Instructional Practices .... 62 Results Related to Technology Use and Student Engagement ...... 67 Summary ........................................................................................ 71
V DISCUSSION, IMPLICATIONS, AND CONCLUSION ................... 74
Discussion of Results ..................................................................... 74 Implications for Research ............................................................... 79 Implications for Practice ................................................................ 84 Study Limitations ........................................................................... 87 Conclusion ...................................................................................... 88 REFERENCES .......................................................................................................... 90
APPENDIX A ........................................................................................................... 99
APPENDIX B ........................................................................................................... 100
APPENDIX C ........................................................................................................... 101
VITA ......................................................................................................................... 102
viii
viii
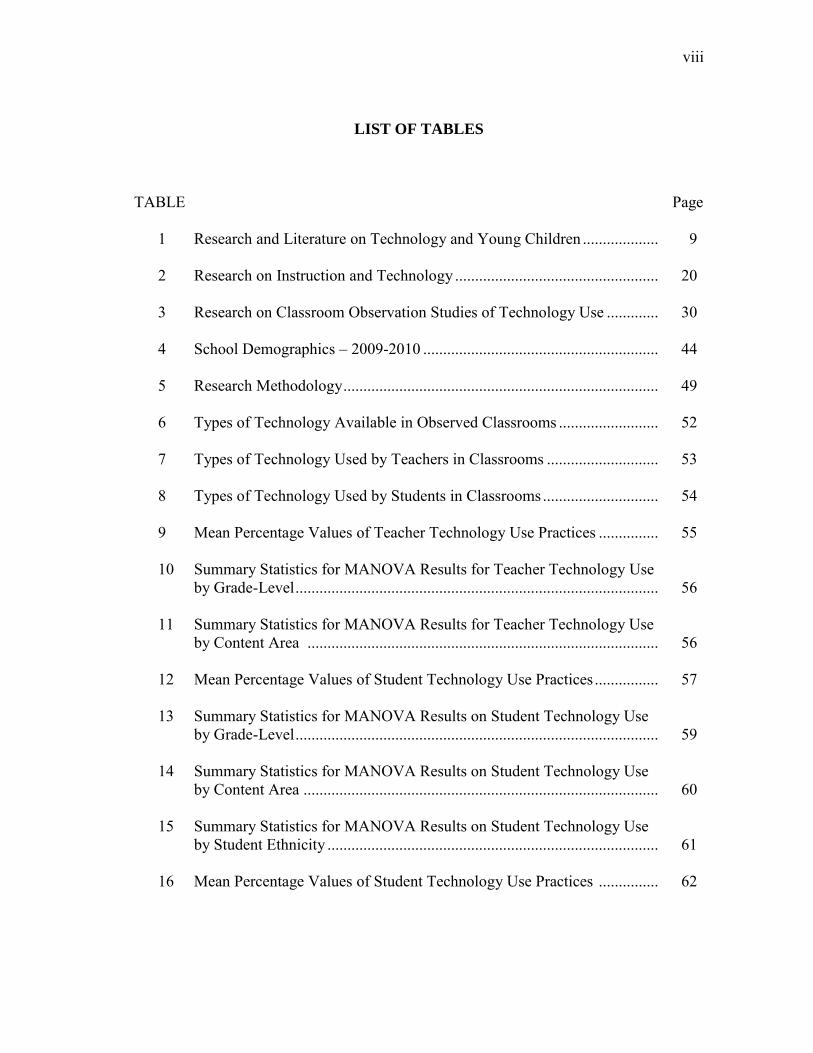
LIST OF TABLES
TABLE Page 1 Research and Literature on Technology and Young Children ................... 9 2 Research on Instruction and Technology ................................................... 20 3 Research on Classroom Observation Studies of Technology Use ............. 30 4 School Demographics – 2009-2010 ........................................................... 44 5 Research Methodology ............................................................................... 49 6 Types of Technology Available in Observed Classrooms ......................... 52 7 Types of Technology Used by Teachers in Classrooms ............................ 53 8 Types of Technology Used by Students in Classrooms ............................. 54 9 Mean Percentage Values of Teacher Technology Use Practices ............... 55 10 Summary Statistics for MANOVA Results for Teacher Technology Use by Grade-Level ........................................................................................... 56 11 Summary Statistics for MANOVA Results for Teacher Technology Use by Content Area ........................................................................................ 56 12 Mean Percentage Values of Student Technology Use Practices ................ 57 13 Summary Statistics for MANOVA Results on Student Technology Use by Grade-Level ........................................................................................... 59 14 Summary Statistics for MANOVA Results on Student Technology Use by Content Area ......................................................................................... 60 15 Summary Statistics for MANOVA Results on Student Technology Use by Student Ethnicity ................................................................................... 61 16 Mean Percentage Values of Student Technology Use Practices ............... 62

ix
iv
TABLE Page 17 Summary Statistics for MANOVA Results for Classroom Technology Use by Socio-Economic Status .................................................................. 62 18 Mean Percentage Values of Classroom Setting ......................................... 63 19 Summary Statistics for MANOVA Results for Classroom Setting by Level of Teacher Technology Use ............................................................. 64 20 Mean Percentage Values of Instructional Orientation ............................... 64 21 Summary Statistics for MANOVA Results for Instructional Orientation by Level of Teacher Technology Use ........................................................ 65 22 Mean Percentage Values of Teacher Purpose of Interaction ..................... 66 23 Summary Statistics for MANOVA Results for Purpose of Interaction by Level of Teacher Technology Use ............................................................. 67 24 Summary Statistics for MANOVA Results for Students‟ Academic Engagement by Level of Student Technology Use .................................... 67 25 Summary Statistics for MANOVA Results on Student Activity Types by Level of Student Technology Use .............................................................. 70 26 Summary Statistics for MANOVA Results for Students‟ Academic Engagement by Level of Teacher Technology Use ................................... 71
1
CHAPTER I
INTRODUCTION
Technology influences our lives every day, and it has become increasingly
common to see numerous computers along with other forms of technology in P-12
classrooms. This is due in part to large financial investments by a number of school
districts as well as grants from the state and federal government in order to implement
technology into classrooms. The State Educational Technology Directors Association
(SETDA), the International Society for Technology in Education (ISTE) and the
Partnership for 21st Century Skills pushed for a renewed importance on technology in
education in a recent national report (SETDA, 2007).
As part of No Child Left Behind (NCLB), the Department of Education stated
that the primary goal of the Enhancing Education through Technology Act of 2001 was
“to improve student academic achievement through the use of technology in elementary
schools and secondary schools” (U.S. DOE, 2001). Almost a decade later, the federal
government continues to mandate that “we must leverage [technology] to provide
engaging and powerful learning experiences, content, and resources and assessments that
measure student achievement in more complete, authentic, and meaningful ways” (U.S
DOE, 2010, p. 3).
_____________ This dissertation follows the style of American Educational Research Journal.

2
2
A recent National Center for Education Statistics (NCES) study looked at the
availability and use of technology in elementary and secondary public schools and found
that this national sample of teachers reported a 5.3 to 1, student to computer ratio overall
and a 5.4 to 1 student to computer ratio at the elementary level (Gray, Thomas, & Lewis,
2010). In the same study, 75% of teachers at the elementary level also reported that they
or their students used computers often or sometimes during instructional time.
Today‟s elementary classrooms, however, are equipped with more than just
computers. Elementary teachers reported having: a liquid crystal display (LCD) or a
digital light processing (DLP) projector (81%), digital camera (81%), interactive
whiteboard (54%), document camera (42%), classroom response system or “clickers”
(28%), video conference unit (20%), MP3 player/iPod (18%), and/or handheld devices
(13%) available as needed or present in their classrooms every day (Gray, Thomas, &
Lewis, 2010). Also, 88% of teachers at the elementary level reported attending
professional development for educational technology in the last 12 months.
Despite the large percentage of teachers who are attending professional
development for educational technology, a high degree of technology immersion in the
classroom is not always the result. In a recent four-year study, for example, 21 middle
schools were immersed with technology and professional development for teachers; yet,
only 6 of the 21 treatment schools reached substantial levels of technology
implementation by the fourth year (Shapely, Sheehan, Maloney, & Caranikas-Walker,
2010). In addition to professional development being a high priority, the six successful

3
3
schools had strong administrator and teacher support for the technology program and a
collegial atmosphere at the schools.
With such an array of technology in elementary classrooms, there is a need to
examine how the technology is being used, who is using it, and what instructional
practices are taking place in these classrooms. Findings from a national survey of
teachers showed a reported increase in teachers professional use of technology (e.g.,
lesson planning) from 2004 – 2007, but during that same time period, the frequency of
students use of technology for school work did not increase (Bakia, Means, Gallagher,
Chen, & Jones, 2009). Other studies have suggested that teachers are more likely to
implement learner-centered instructional approaches when students are using
technology, specifically research or production software (Inan, Lowther, Ross, & Strahl,
2009; Lowther, Ross, & Strahl, 2006). Wozney, Venkatesh, and Abrami (2006) found
that teachers who favored student-centered instructional approaches also reported that
they were more likely to implement computer use and rated their own computer skills
and knowledge at a higher level than their more teacher-centered colleagues.
The use of technology with young children has previously been a controversial
issue for many in the field of early childhood and elementary education. Critics felt that
an emphasis on technology in early childhood classrooms may decrease, and in some
cases, eliminate time for imaginative play that is necessary to promote social and
emotional learning (Miller, 2005). Many, however, view technology as a way to enhance
learning in early childhood when used in developmentally appropriate ways (Boyd,
2008; Rosen & Jaruszewicz, 2009). More than a decade ago, the National Association

4
4
for the Education of Young Children (NAEYC, 1996) stated in their position statement
on technology, “Technology plays a significant role in all aspects of American life
today, and this role will only increase in the future” (p. 1). NAEYC is currently revising
their technology position statement; however, they were accurate in 1996, the role of
technology has and will continue to increase.
Judge, Puckett, and Bell (2006) used data from the Early Childhood Longitudinal
Study – Kindergarten (ECLS-K) cohort to examine the movement toward equitable
technology access for children in their first four years of school, kindergarten to third-
grade. At the time of their study, kindergarten to third-grade classes averaged about one
computer for every five students. They also reported that differences in school computer
access between children attending high-poverty and low-poverty schools are greatly
decreasing. Other studies that have focused on technology use in high-poverty schools as
well as with Hispanic, English Language Learners have indicated that technology-
enhanced instruction is particularly beneficial for this population (Padrón & Waxman,
1996; Park, 2008; Waxman, Padrón, & Garcia, 2007).
Concerns with Previous Technology Research
Numerous studies have been conducted on the availability and use of technology
in schools (Judge et al., 2006; Vannatta & Fordham, 2004; Wozney et al., 2006). These
studies, however, have primarily used self-report data from administrators, teachers,
students, and parents. Such data are frequently unreliable since actual technology use
may be over-represented when using self-report measures (Cuban, 2001). Of the

5
5
technology observation studies that have been conducted, many of the observations have
taken place during preplanned lessons where technology is to be implemented (Grant,
Ross, Wang, & Potter, 2005; Inan et al., 2010; Judson, 2006; Means, 2010). These
studies provide a valuable look at how technology can be used in the classroom, but they
are not representative of actual regular technology use. Very few studies have used
systematic observations to examine the extent to which technology is used in the
classroom (Lowther, Ross, & Strahl, 2006; Waxman & Huang, 1996) specifically in
elementary classrooms. The present study extends previous technology research by
conducting systematic classroom observations in pre-kindergarten to fifth-grade
classrooms.
Purpose of the Study
A number of studies have been conducted on technology use in schools. The
majority of these studies, however, have relied on self-report survey data from
administrators, teachers, students, and parents (e.g., Judge et al., 2006; Vannatta &
Fordham, 2004; Wozney et al., 2006). While these studies incorporate multiple views on
technology, actual technology use may not be accurately represented with the self-report
measures (Cuban, 2001). Although previous research has also included classroom
observations of technology use, many of the observations have taken place during
preplanned technology lessons instead of a more authentic classroom environment
(Grant et al., 2005; Inan et al., 2010; Means, 2010). Additional studies have used both
survey and observational data to address the connections between teachers‟ technology

6
6
beliefs and their instructional practices with very small sample sizes (Judson, 2006;
Mama & Hennessy, 2010).
Very few studies have involved classroom observations on a large-scale (Inan et
al., 2010; Lowther et al., 2006). Additionally, these studies have focused on the general
K-12 population and not specifically on the elementary grades. Previous research has
also addressed the digital divide among high and low SES schools from comprehensive
national and statewide samples with the absence of observational data (Hohlfeld et al.,
2008; Judge et al., 2006).
The purpose of the present study is to examine the use of technology with
teachers, students, and in the overall classrooms through observations of pre-
kindergarten through fifth-grade public school classrooms. The current study differs
from and builds upon previous research in a number of major ways. First, the
observational data examines both student and teacher technology use and the availability
of technology in the classroom. Second, this study examines authentic classroom
behaviors and how they relate to technology use. Third, unlike previous studies, this
study focuses specifically on pre-kindergarten through fifth-grade classrooms from the
same large public school district that is diverse by both socio-economic status (SES) and
by student ethnicity. Finally, this study looks at differences of technology use by SES,
student sex and ethnicity.
Research Questions
The research questions that guide the present study are:

7
7
1. What types of technology are teachers using in their classrooms?
2. What types of technology are students using in their classrooms?
3. Are there significant (p<.05) differences among technology use for teachers by
grade-level and content area?
4. Are there significant (p<.05) differences among technology use for students by
grade-level, content area, and student ethnicity?
5. Are there significant (p<.05) differences among technology use in classrooms by
socio-economic status?
6. Are there significant (p<.05) differences on technology use by type of
instructional practices?
7. How does technology use in classrooms relate to students‟ academic
engagement?

8
8
CHAPTER II
REVIEW OF RESEARCH
This chapter presents a review of research and literature on classroom technology
use, specifically addressing issues related to the use of technology with young children,
the impact of technology on classroom instructional practices, and classroom
observation research that focuses on technology use. The research is presented in three
tables, which include the purpose, the study sample and methods used, and the
overall/significant results for each study. Within the tables, articles are listed
alphabetically by author.
Technology and Young Children
Developmentally appropriate practice (DAP) is a common phrase in early
childhood education and not one that is generally associated with technology.
Developmentally Appropriate Technology Use (DATU) is a new phrase recently created
by Rosen and Jaruszewicz (2009), however, the discussion surrounding appropriate use
of technology has been around for a while. Table 1, Research and Literature on
Technology and Young Children, provides an outline of eight articles that examine the
use of technology with young children. These articles were published between 1996 to
2010.

Table 1
Research and Literature on Technology and Young Children
Study Purpose Sample/Method Results
Fish, et al. (2008)
To investigate the association between home computer experience and cognitive development among preschool children in inner-city Head Start programs
208 children enrolled in four Head Start centers in Detroit, Michigan
Assessed for cognitive development (McCarthy Scales of Children‟s Abilities
[MSCA]) and school readiness (Boehm-3 Test of Basic Concepts)
60-question Family Survey (included questions on computer experience)
Children with access to computers scored higher on many cognitive test and school readiness measures
Frequency of computer use significantly related to child cognitive scores and school readiness (children who used a computer on a weekly basis out performed daily and monthly users)
Harlow, Cowie, & Heazlewood (2010)
To illustrate how features of the interactive whiteboard (IWB) support teaching actions and provides structure for children to develop knowledge, skills, and aptitudes for learning also referred to as „key
competencies‟
One teacher and a classroom of five to six year old children
Small rural school in New Zealand
Case study approach over a five day period
Digital camera, video and audiotape recorders were used in data collection
Findings indicated that it was the teacher‟s active role in the organization of the learning environment including the integration of the IWB that allowed for student-centered learning and the potential for students to develop key competencies
9

10
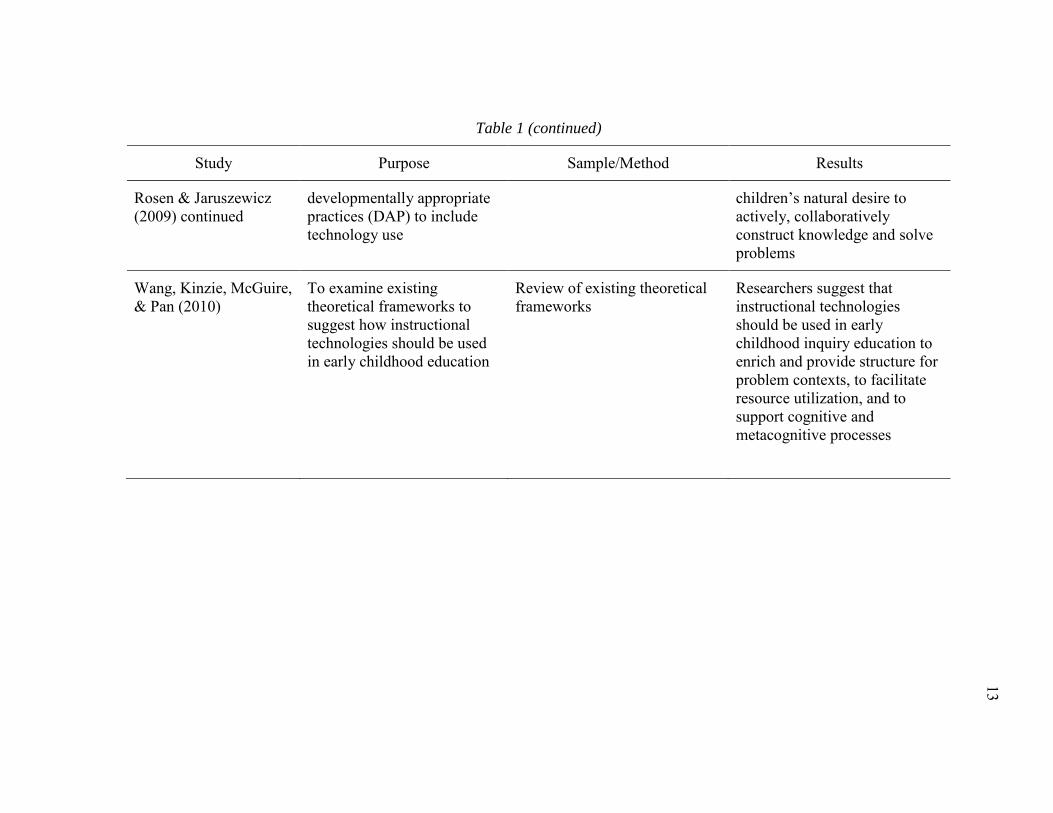
Table 1 (continued)
Study Purpose Sample/Method Results
Ihmeideh (2009)
To investigate the barriers to the use of technology in Jordanian preschool education
15 kindergartens were randomly selected
30 preschool teachers (two from each kindergarten) and 15 principals
All teachers and principals were female (all staff in Jordanian preschools are female)
Semi-structured interviews were conducted
Each interview took approximately 30 minutes and was audio recorded for later transcription
Findings revealed that the lack of developmentally appropriate software, funds, time, and technology skills were the main barriers to technology use
Most preschool teachers saw value in using technology for teaching and learning with preschool students
Principals were not certain about the benefit of technology for children
Morgan (2010) To gain an understanding about how IWB are currently being used in the teaching and learning of young children
30 classroom settings with three to seven year old children
Class size ranged from 18 to 30 children
Located across four local education authorities in South Wales in the United Kingdom
IWB are used most often for whole class, teacher-centered instruction
Group work was the second most frequent use of IWB but the group work was described as repetitive and undemanding with no higher-order thinking

11
Table 1 (continued)
Study Purpose Sample/Method Results
Morgan (2010) continued
Semi-structured interviews with the classroom teacher, observations/field notes of lessons (during two half-day sessions), video recordings of lessons, and informal dialogues with the children
Teacher interviews revealed that all teachers described their teaching as interactive and valued play as a vehicle for learning but observations revealed little interactive learning and only three IWB activities were described by the students as playing
NAEYC (1996) To present the technology position statement of the National Association for the Education of Young Children (NAEYC) which was created in order to state their position on an issue related to early childhood for which there are controversial or critical opinions
NAEYC position statements are developed through a consensus-building approach that seeks to convene diverse perspectives and areas of expertise related to the issue and provide opportunities for members and others to provide input and feedback
Seven primary issues are addressed
The teacher must play an active role in order to appropriately implement technology in early childhood classrooms

12
Table 1 (continued)
Study Purpose Sample/Method Results
Plowman & Stephen (2005)
To use a case study approach to describe the use of information and communication technologies (ICT) in seven pre-school settings in terms of what is available and how it is used by adults and children
Seven case study settings in Scotland – three were local authority nursery schools, two were private sector nurseries, and two were voluntary sector playgroups
Both urban and rural settings
Interviews (at least one practitioner and the manager at each site)
Observations throughout two half-day sessions at each site (episodes of computer use were recorded ranging from 30 seconds to 30 minutes)
Brief conversations with children
Computers were present at all settings
Practitioners generally referred to children “playing with
computers”
Few examples of peer support
Adults rarely intervened or offered guidance and the most common form of intervention was reactive supervision
Computer interaction was a limited experience for most children
Rosen & Jaruszewicz (2009)
To introduce a new educational term, developmentally appropriate technology use (DATU) which extends
Two contrasting classroom scenarios are provided to illustrate DATU
DATU is defined as use that both respects the unique challenges presented by children‟s levels of
development and capitalizes on
13
Table 1 (continued)
Study Purpose Sample/Method Results
Rosen & Jaruszewicz (2009) continued
developmentally appropriate practices (DAP) to include technology use
children‟s natural desire to
actively, collaboratively construct knowledge and solve problems
Wang, Kinzie, McGuire, & Pan (2010)
To examine existing theoretical frameworks to suggest how instructional technologies should be used in early childhood education
Review of existing theoretical frameworks
Researchers suggest that instructional technologies should be used in early childhood inquiry education to enrich and provide structure for problem contexts, to facilitate resource utilization, and to support cognitive and metacognitive processes

14
The eight articles discussed in this section include five research studies, two
conceptual/theoretical articles, and one position statement. Of the five research studies,
two utilized case study methodology while the other three utilized surveys and
interviews to examine larger populations. One of the conceptual/theoretical articles
introduced a new educational concept and the other compared existing theoretical
frameworks in order to suggest how instructional technology should be used with young
children. Additionally, the position statement from NAEYC, an influential early
childhood association, provided their position on technology use with young children.
In NAEYC‟s (1996) position statement on the appropriateness of technology and
young children, seven issues were addressed:
1. In any given situation, a professional judgment by the teacher is required to
determine if a specific use of technology is age appropriate, individually
appropriate, and culturally appropriate.
2. Used appropriately, technology can enhance children‟s cognitive and social
abilities.
3. Appropriate technology is integrated into the regular learning environment
and used as one of many options to support children‟s learning.
4. Early childhood educators should promote equitable access to technology for
all children and their families. Children with special needs should have
increased access when this is helpful.

15
15
5. The power of technology to influence children‟s learning and development
requires that attention be paid to eliminating stereotyping of any group and
eliminating exposure to violence, especially as a problem solving strategy.
6. Teachers, in collaboration with parents, should advocate for more appropriate
technology applications for all children.
7. The appropriate use of technology has many implications for early childhood
professional development.
The theme resonating through the seven issues is the active role the teacher must portray
in order to appropriately implement technology into the classroom. NAEYC is currently
in the process of revising their position statement to include current research and input
from early childhood educators (Rosen & Jaruszewicz, 2009).
In order to prepare future elementary education teachers for DATU, Rosen and
Jaruszewicz (2009) set up a framework to inform teachers and teacher educators. First,
teachers need to become technologically literate themselves. Second, teachers must
understand the needs and interests of the children in their class as they relate to
technology. Third, teachers have to be informed about the hardware, software, and
Internet choices that they are making for their class. Fourth, teachers should scaffold the
children‟s technology experiences with appropriate expectations. Finally, teachers
should take into account the potential for technology as an assessment tool. Technology
is here to stay, therefore, it is vital for elementary teachers to be informed about
appropriate uses of technology in the classroom.

16
16
Wang, Kinzie, Mcguire, and Pan (2010) provide a similar theoretical perspective
as Rosen and Jaruszewicz (2009) about technology use in early childhood education.
Wang and colleagues, however, focus entirely on applying technology to inquiry-based
learning in order to: enrich and structure problem contexts (i.e., present problems in a
real life context, increase motivation and engagement levels), facilitate utilization of
resources (i.e., provide access to resources with various perspectives, help children
search and assess various resources), and support cognitive and metacognitive processes
(i.e., differentiate learning, facilitate peer collaboration). While the researchers note that
inquiry-based learning activities integrated with technology are complex, they believe it
could greatly benefit children‟s thinking.
Harlow, Cowie, and Heazlewood (2010) conducted a case study in a classroom
of five-and six-year old children to examine how the interactive whiteboard (IWB) can
help children to develop knowledge, skills, and aptitudes for learning. Findings indicated
that the use of the IWB allowed student-centered learning to take place and the potential
for key competencies to be developed. Similar to the theme of the NAEYC position
statement on technology, researchers noted that the active role the teacher played in
creating the learning environment and orienting the IWB to meet student needs and
interests was essential.
Morgan (2010) also examined the use of IWB with young children in order to
assess their use for teaching and learning with three to seven-year old children.
Researchers gathered data from 30 classroom teachers through semi-structured
interviews, conducted two observations (i.e., field notes of lessons) of each of the 30

17
17
classrooms, took video recordings of the lessons, and had informal conversations with
the children. Contrasting the findings of Harlow and colleagues (2010), findings
revealed that IWB were used most frequently for whole class, teacher-centered
instruction. Teacher interviews, however, indicated that all teachers described their
teaching as interactive and valued play as a vehicle for learning but observations, for the
most part, did not reflect this type of instruction with IWB.
Plowman and Stephen (2005) used a case study approach to investigate the
availability and use of information and communication technologies (ICT) in seven
preschool settings in Scotland. Researchers interviewed at least one teacher and the
manager at each site, observed computer use during two half-day sessions at each site,
and engaged in brief conversations with children. Teachers generally referred to children
“playing with computers,” also noting that computer skills and knowledge of technology
is important for children for later schooling and employment but not necessarily great
educational significance. Findings also revealed that while computers were present at all
settings, there were few examples of peer support and teachers rarely provided guidance
except in the form of reactive supervision.
In 2009, Ihmeideh investigated the barriers to the use of technology in preschools
in Jordan. Preschool teachers (n=30) and principals (n=15) were interviewed at 15
different schools. Findings revealed the most frequently cited barriers to technology use
were a lack of developmentally appropriate software, funding issues, time constraints,
and inadequate technology skills. For the most part, preschool teachers saw value in the

18
18
use of technology for teaching and learning, yet, principals were uncertain about the
benefit of technology for young children.
Technology use with young children has shown to significantly relate to
children‟s cognitive scores and school readiness (Fish, et al., 2008). Approximately 200
families of children enrolled in urban Head Start programs were surveyed about their
children‟s home computer use. Almost half of the families surveyed had home
computers. Children who were reported using computers at home on a weekly basis
performed better than those who were reported using computers on a daily or monthly
basis. These findings suggest that a moderate use of computers could have positive
cognitive outcomes for young children in urban areas.
The research and literature reviewed in Table 1 examined technology use with
young children from various perspectives including conceptual/theoretical models, a
position statement, case studies, principal and teacher interviews, classroom
observations, surveys, and student assessments. Each of these articles, while different in
methodology, helped to expand upon the somewhat limited research on the use of
technology with young children. A common theme throughout much of the literature
was the need for the teacher to portray an active role in the formation of an effective
technology-enhanced learning environment. It was clear that having a certain type of
technology equipment (e.g., IWB) does not automatically create student-centered
learning environments. Additionally, the presence of technology in the classroom does
not prevent the possible barriers (e.g., lack of time and inadequate technology skills) to
technology use.

19
19
Overall, the current research on technology use with young children is based on
self-report, survey and interview data if conducted on a larger scale. Observations have
been used in small case studies but need to be implemented systematically in large-scale
studies as well. There is a need for strong, empirical research to be conducted to examine
the use of technology with young children.
Instruction and Technology
Stipek and Byler (2004) found that elementary education teachers‟ beliefs and
goals were closely related to their instructional practices in the classroom. Research has
shown that teachers who believe in student-centered, constructivist instructional
approaches are more likely to integrate technology into their lessons and use technology
in their classrooms than teachers with teacher-centered instructional approaches
(Hermans, Tondeur, van Braak, & Valcke, 2008; Rakes, Fields, & Cox, 2006; Smeets,
2005; Wozney, et al., 2006). For the most part, these studies relied on self-report, survey
data, which do not take into account observations of actual classroom practices. Table 2,
Research on Instruction and Technology, summarizes nine studies that examined
instruction and technology. These articles were published between 2005 to 2010.

Table 2
Research on Instruction and Technology
Study Purpose Sample/Method Results
Fletcher (2006) To investigate technology integration practices on two elementary campuses through the use of a self-report survey
Two elementary campuses in a suburban, small-town independent school district, which resides outside of a large southeastern metropolitan city
45 teachers at the Pre-K to 5th grade-level
Student population at both schools is primarily Hispanic
Teachers at both schools are primarily Caucasian and female
Technology Integration Survey for Faculty – targeted to assess if teachers integrate technology into their teaching and if teachers ask students to use technology in their learning
Results indicated that teachers were not implementing technology within their classroom learning environment at the teacher-centered level (with the exception of lesson planning)
Results also indicated that teachers were not implementing technology within the classroom learning environment at the student-centered level
Hermans, Tondeur, van Braak, & Valcke (2007)
To investigate the relationship between teachers‟ educational beliefs
and their computer use, while
525 primary school teachers from 68 schools in Belgium
Participants were distributed evenly across grades and 81%
Constructivist teacher beliefs were found to be a strong predictor of classroom technology use
20

21
Table 2 (continued)
Study Purpose Sample/Method Results
Hermans, Tondeur, van Braak, & Valcke (2007) continued
controlling for the impact of technology-related determinants (computer experience, supportive computer use, general computer attitudes) and teacher-related demographic variables (gender and age)
were female and 19% were male with ages ranging from 22 to 64 years old
Survey – included questions about computer experience, the extent to which computer are used to support classroom practices, and the General Attitudes Towards Computers instrument
Traditional teacher beliefs seem to have a negative impact on the integrated classroom use of computers
Hohlfeld, Ritzhaupt, Barron, & Kemker (2008)
To examine the trends in technology integration in Florida‟s public schools with a focus on examining relationships to SES
2,345 public elementary, middle, and high schools who participated in the Florida Innovates survey for all four school years
Statewide datasets – the Florida School Indicators Report and the Measuring Adequate Yearly Progress (AYP) Reports
Based on percentage of economically disadvantaged students, the top 30% of schools (at each school level)
Students at high SES schools had greater access to production software
Low SES schools were provided with significantly more technology support
A larger percentage of teachers at high SES schools were reported using technology for lessons and for administrative purposes
Students at low SES elementary

22
Table 2 (continued)
Study Purpose Sample/Method Results
Hohlfeld, Ritzhaupt, Barron, & Kemker (2008) continued
were classified as low SES and the bottom 30% were classified as high SES for data analysis
and middle schools used significantly more content software and students at all levels of high SES schools used significantly more production software
Judge, Puckett, & Bell (2006)
To use data from the Early Childhood Longitudinal Study – Kindergarten (ECLS-K) Class of 1998-1999 to examine the progress toward equitable technology access and use over children‟s first 4
years of school
ECLS-K secondary data (which included adaptive, individually administered child assessments, parent interviews, and teacher and school administrator questionnaires)
8,283 children in their 4th year of school – 53.5% White, 18.6% Hispanic, 14.8% African American, and 8.5% Asian/Pacific Islander
63.1% of children attended low-poverty schools and 36.9% attended high-poverty schools
Differences in technology access between high- and low-poverty schools have decreased, except in home computer access (children attending high-poverty schools had less access to home computers)
Third-grade teachers at high-poverty schools rated themselves more prepared to use computers with their classes than third-grade teachers from low-poverty schools
Students attending high-poverty schools used the computer most frequently for reading and students attending low-poverty schools used the computer most frequently for Internet purposes

23
Table 2 (continued)
Study Purpose Sample/Method Results
Judge, Puckett, & Bell (2006) continued
Frequent use of reading software was negatively correlated with reading and mathematics achievement
Mama & Hennessy (2010)
To explore the link between the level of technology integration, teacher attitudes, and student engagement
11 primary school teachers
A multi-case design was conducted, involving thematic analysis of pre- and post-lesson interviews and unstructured lesson observations
Findings showed that a teacher‟s perception of the role
of technology in fulfilling the lesson objectives influenced the degree of technology integration
The level of technology integration appeared to influence student engagement during the lesson
Rakes, Fields, & Cox (2006)
To investigate the relationship between technology use and skills and the use of constructivist instructional practices among teachers in rural schools
123 teachers (71 fourth-grade teachers and 52 eighth-grade teachers) from 11 rural school districts in a southern state
All schools received funding from the Delta Rural Systemic Initiative and the Technology
Findings indicate a significant, positive relationship between both levels of classroom technology use and personal computer use and the use of constructivist instructional practices, with personal

24
Table 2 (continued)
Study Purpose Sample/Method Results
Rakes, Fields, & Cox (2006) continued
Literacy Challenge grant
Schools ranged from 54% to 91% free and reduced lunches
Survey – the Level of Technology Implementation (LoTi)
computer use being the strongest predictor
Smeets (2005) To investigate the characteristics of learning environments and the contribution of ICT to learning environments
331 grade 8 primary teachers in the Netherlands
84% of the teachers were male
Average years of experience in education was nearly 21 (ranged from 1 to 44)
Survey – included teacher and class variables, characteristics of the learning environment, and the use of ICT
Use of ICT generally showed traditional approaches to learning
Use of open-ended ICT applications was greater with teachers who created powerful learning environments for their students and when more computers were available
Wozney, Venkatesh, & Abrami (2006)
To examine the relationship between motivational, instructional, and school factors that impact the nature
764 elementary and secondary teachers in Quebec
Both private and public schools
Findings indicated that teachers who prefer more student-centered approaches towards instruction are more likely to
25
Table 2 (continued)
Study Purpose Sample/Method Results
Wozney, Venkatesh, & Abrami (2006) continued
and frequency of computer technology integration in schools
Survey – the Technology Implementation Questionnaire (TIQ)
integrate computers more frequently, perceive themselves as having a higher computer proficiency, and report themselves as being at a higher level of computer integration in the classroom
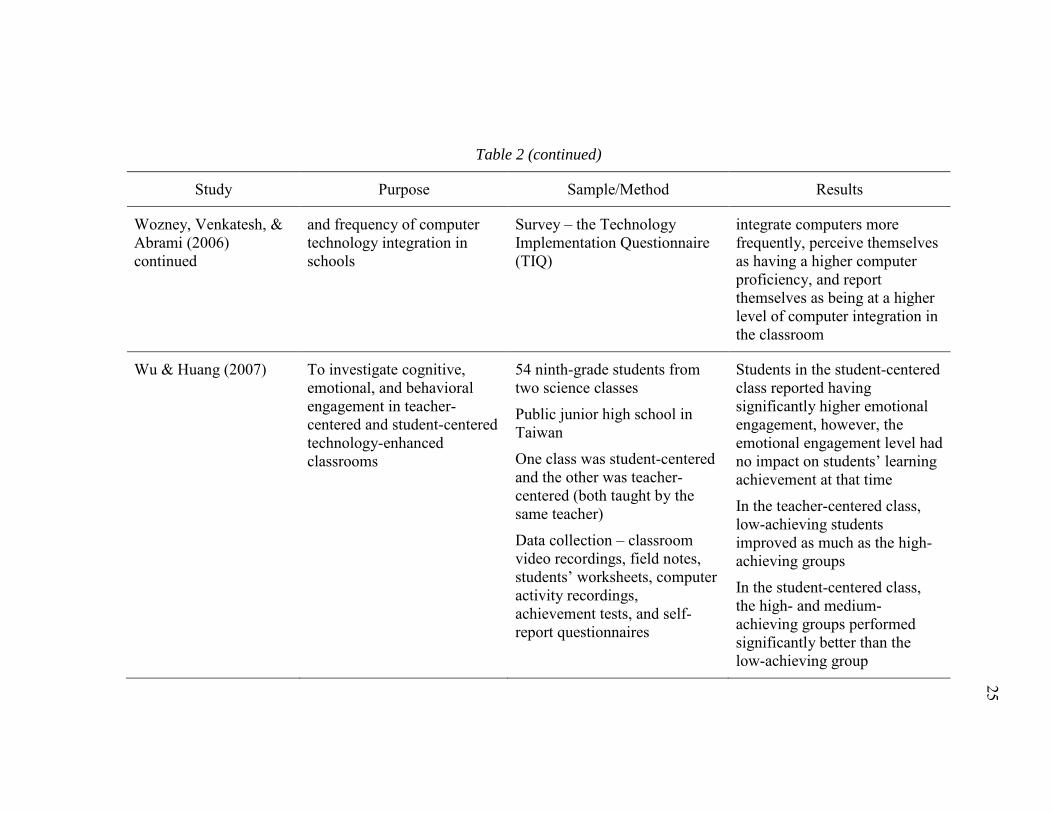
Wu & Huang (2007) To investigate cognitive, emotional, and behavioral engagement in teacher-centered and student-centered technology-enhanced classrooms
54 ninth-grade students from two science classes
Public junior high school in Taiwan
One class was student-centered and the other was teacher-centered (both taught by the same teacher)
Data collection – classroom video recordings, field notes, students‟ worksheets, computer activity recordings, achievement tests, and self-report questionnaires
Students in the student-centered class reported having significantly higher emotional engagement, however, the emotional engagement level had no impact on students‟ learning
achievement at that time
In the teacher-centered class, low-achieving students improved as much as the high-achieving groups
In the student-centered class, the high- and medium-achieving groups performed significantly better than the low-achieving group

26
The nine studies summarized in this section included five studies based on self-
report data from teacher surveys, two studies comprised of secondary data analyses with
longitudinal data, one included a multi-case design with teacher interviews and
unstructured observations, and one integrated multiple forms of data collection to closely
examine two classrooms. Teacher surveys were utilized in five studies to provide
teachers‟ views on technology, how they use technology in and out of their classrooms,
and the way in which technology use relates to certain self-reported instructional
practices. One of the secondary data analyses studies used a statewide dataset from the
public school system and the other was from a national study sample. Additionally, a
multi-case design study compared data reported in teacher interviews with data collected
in unstructured observations. Finally, multiple forms of data collection were utilized in
two technology-enhanced classrooms to examine the differences between student-
centered and teacher-centered instruction.
Mama and Hennessy (2010) suggest that teachers‟ classroom practices as they
relate to technology integration do reflect their beliefs. As part of a multi-case design
study, 11 teachers were interviewed and observed in order to assess the level of
technology integration in the classroom. The researchers concluded that the level of
technology integration depended on the teachers‟ perception of the usefulness of
technology in fulfilling the lesson‟s objective. Additionally, researchers determined that
the level of technology integration influenced student engagement during the lesson.
Wu and Huang (2007) investigated cognitive, emotional, and behavioral
engagement in one teacher-centered and one student-centered, ninth-grade classroom

27
27
where technology was integrated to a great extent. Data collection occurred through
video recordings, field notes, examining student work, computer activity recordings,
achievement tests, and surveys. Results indicated that students in the student-centered
class reported having significantly higher emotional engagement; however, emotional
engagement had no impact on student achievement. Interestingly, in the teacher-centered
class, low-achieving students improved as much as the high-achieving students did. Yet,
in the student-centered class, the high- and medium- achieving groups performed
significantly better than the low-achieving group. These findings suggest that different
modes of instruction might be beneficial for students of varying achievement levels;
however, the sample size is too small for broad conclusions to be drawn.
Fletcher (2006) found almost no technology integration in two elementary
schools after surveying 45 teachers about their technology integration practices. Results
indicated that teachers were not implementing technology within their classroom-
learning environment at the teacher-centered or student-centered level. Teachers did
indicate, however, that technology was used when gathering information for lesson
planning.
Judge et al. (2006) analyzed ECLS-K data and examined the frequency of
computer use for instructional purposes for kindergarten to third-grade students from
schools categorized as low and high poverty. Also, third-grade teachers at high-poverty
schools rated themselves as being more prepared to use computers with their classes than
did teachers at low-poverty schools. Findings revealed that the computer was most
frequently used for reading at high-poverty schools and for Internet purposes at low-

28
28
poverty schools. Additional findings indicated that there were significant negative
correlations between the frequency of use of reading software and reading and
mathematics achievement for third-grade. These findings suggest that while the gap is
closing for equitable access to computers, there is still a difference in the type of
instruction used with computers for students at low and high poverty schools.
Hohlfeld, Ritzhaupt, Barron, and Kemker (2008) used statewide data from the
state of Florida to examine the digital divide in K-12 public schools. Their findings
indicated that students at high socio-economic status (SES) schools had greater access to
production software which helps to provide what is needed to develop 21st Century
Skills. Low SES schools, on the other hand, were provided with significantly more
technology support. However, a larger percentage of teachers at high SES schools were
reported using technology for their lessons and for administrative purposes. Finally,
similar to the findings of Judge and colleagues (2006), students in low SES elementary
and middle schools used significantly more content software and students at all levels in
high SES schools used significantly more production software.
Each of these studies further adds to the research on the use of technology in the
classroom by helping to describe how teachers might choose to integrate technology and
to examine differences in instructional practices with technology by SES. However, even
with access to technology increasing across the board, observers of technology use in the
classroom have generally found it to be underutilized (Cuban, 2001). The studies
summarized in Table 2, vary from large-scale studies where longitudinal, secondary
datasets were used to case studies involving a small number of participants. All findings
29
29
were based on self-report forms of data with the exception of the two case studies, which
involved some form of observation (e.g., field notes and video recordings). Large-scale
classroom observational studies examining technology use are necessary to understand
the potential impact of technology integration with teachers and students in the
classroom.
Classroom Observation Studies of Technology Use
Several observational studies have been conducted examining the classroom
practices of elementary teachers (McCaslin et al., 2006; Maxwell, McWilliam,
Hemmeter, Ault, & Shuster, 2001; Stipek & Byler, 2004). Observational studies are
important in order to link actual instructional techniques and behaviors to student
outcomes. Although there have been a few large-scale observational studies conducted
with a focus on instruction and technology (e.g., Inan et al., 2010; Lowther et al., 2006;
Huang & Waxman, 1995), these studies do not primarily focus on elementary grade-
levels. Table 3, Research on Classroom Observation Studies of Technology Use,
summarizes nine studies that examine technology use in the classroom through methods
of observation. These studies were published from 1995 to 2010.

Table 3
Research on Classroom Observation Studies of Technology Use
Study Purpose Sample/Method Results
Grant, Ross, Wang, & Potter (2005)
To evaluate the use of mobile laptop carts by focusing on classroom practices, degree and type of technology use, academically focused time, student engagement, teacher technology skills, teacher attitudes towards technology as well as student and teacher reactions to the laptop program
Four fifth-grade classes at an elementary school in a suburban city outside a large urban city in the southeast United States
Two Apple iBook laptop carts
23 to 27 students per class
9 pre-arranged classroom observations were conducted using three instruments – School Observation Measure (SOM), Survey of Computer Use (SCU), and Rubric for Student-Centered Activities (RSCA)
4 teachers completed two different surveys – Teacher Technology Questionnaire (TTQ) and Technology Skills Assessment (TSA)
Focus groups – all four fifth-grade teachers and eight to ten fifth-grade students
Results indicated that teachers had positive technology competence and confidence
Technology used with over 40% of the observed student-centered instructional strategies
Technology was used in every instance that project-based learning was observed
Overall, teacher technological knowledge and efficacy, pedagogical knowledge, and a supportive school community appear to be indicators that impact technology integration
30

31
Table 3 (continued)
Study Purpose Sample/Method Results
Huang & Waxman (1996)
To examine the amount of technology used by middle school students in mathematics and to investigate whether there are significant differences by grade-level, sex, and ethnicity
1,315 students from 220 classrooms in five middle schools in a multi-ethnic school district were observed
Student demographics – 49.4% female and 50.6% male; 32% Caucasian, 26% African American, 23% Asian, and 20% Hispanic; 38% sixth-graders, 32% seventh-graders, and 30% eighth-graders
School district received a grant to integrate calculators into mathematics instruction (every middle school student received a calculator)
Observation instrument – Classroom Observation Schedule (COS)
Approximately 50-minute systematic observation period
Descriptive results indicate that students used calculators about 25% of the time and computers < 1% of the time in their mathematics classes
There were no significant differences in calculator use by student sex or ethnicity
Students in seventh-grade used calculators significantly more than students in sixth- or eighth-grade

32
Table 3 (continued)
Study Purpose Sample/Method Results
Inan, Lowther, Ross, & Strahl (2010)
To identify instructional strategies used by teachers to support technology integration and to examine relations between types of computer applications and teachers‟ classroom practices.
143 classroom observations of full (45-60 minutes) pre-schedules technology integration lessons at 39 participating schools
Schools had received federal funding to implement school-wide technology initiatives
Observation instruments – the School Observation Measure (SOM) and the Survey of Computer Use (SCU)
Findings revealed that classroom practices tend to be more student-centered when students use the computer as a learning tool such as the Internet, word processing, and presentation software
Drill-and-practice activities revealed a negative relationship with student-centered learning
Judson (2006)
To observe teachers integrating technology and to correlate these observations with stated beliefs and attitudes of the teachers
32 K-12 classroom teachers volunteered from various school settings
Teachers‟ beliefs and attitudes
were measured with the Conditions that Support Constructivist Uses of Technology (CSCUT) survey
To measure constructivist teaching when technology is
Survey findings revealed that most teachers identified strongly with constructivist teaching practices
Analysis revealed that there were no significant relationships between classroom practices and teacher beliefs
33
Table 3 (continued)
Study Purpose Sample/Method Results
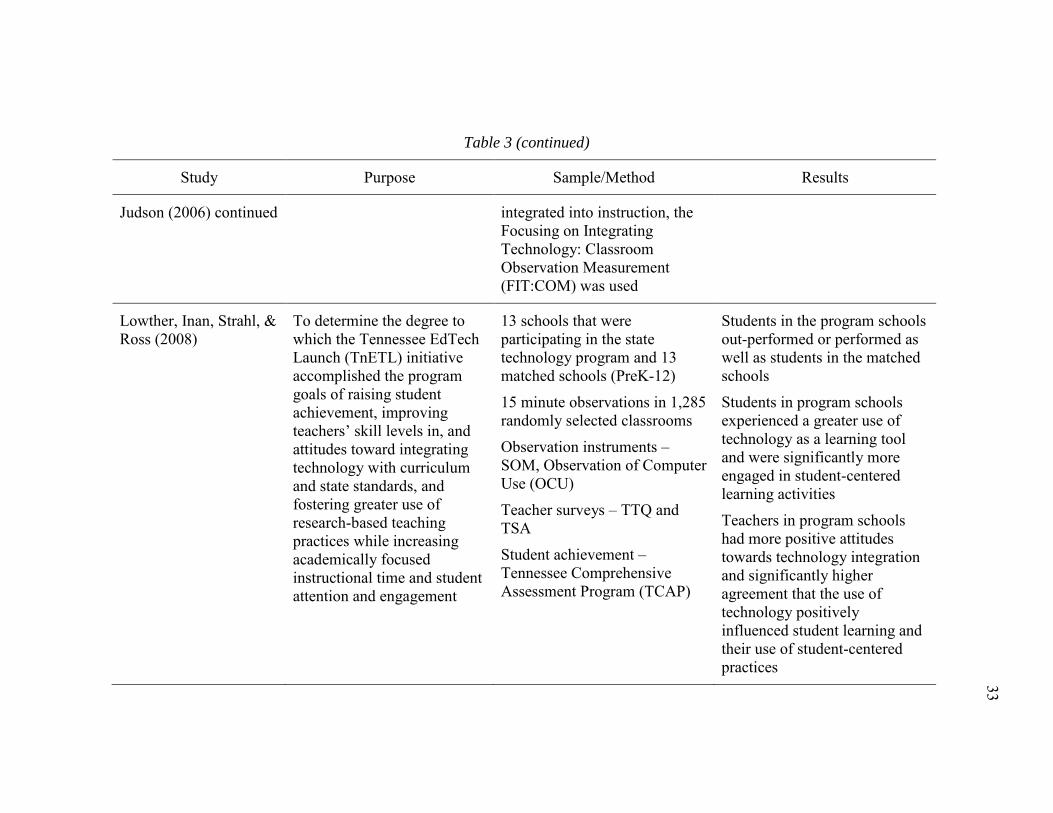
Judson (2006) continued integrated into instruction, the Focusing on Integrating Technology: Classroom Observation Measurement (FIT:COM) was used
Lowther, Inan, Strahl, & Ross (2008)
To determine the degree to which the Tennessee EdTech Launch (TnETL) initiative accomplished the program goals of raising student achievement, improving teachers‟ skill levels in, and
attitudes toward integrating technology with curriculum and state standards, and fostering greater use of research-based teaching practices while increasing academically focused instructional time and student attention and engagement
13 schools that were participating in the state technology program and 13 matched schools (PreK-12)
15 minute observations in 1,285 randomly selected classrooms
Observation instruments – SOM, Observation of Computer Use (OCU)
Teacher surveys – TTQ and TSA
Student achievement – Tennessee Comprehensive Assessment Program (TCAP)
Students in the program schools out-performed or performed as well as students in the matched schools
Students in program schools experienced a greater use of technology as a learning tool and were significantly more engaged in student-centered learning activities
Teachers in program schools had more positive attitudes towards technology integration and significantly higher agreement that the use of technology positively influenced student learning and their use of student-centered practices

34
Table 3 (continued)
Study Purpose Sample/Method Results
Lowther, Ross, & Strahl (2006)
To examine the degree to which instructional practices, use of technology, academically focused instructional time, and student attention and engagement differ on the basis of participation in a statewide technology program
13 schools that were participating in the state technology program and 13 matched schools
1,210 randomly selected classrooms from the program and matched schools
Observation instruments – SOM, SCU, and RSCA
Findings indicated that when student use of technology was put into practice, the teacher employed more student-centered instructional practices
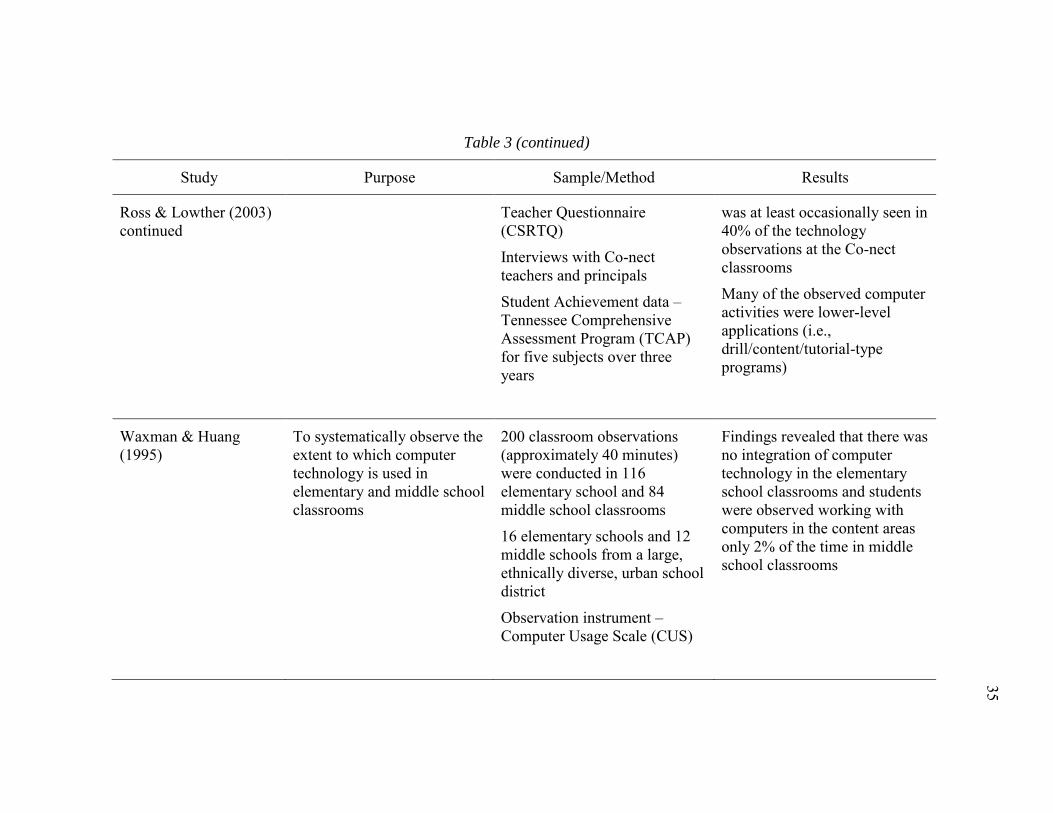
Ross & Lowther (2003) To examine Co-nect schools on process and outcome measures consisting of the following: school climate, teaching methods, teacher buy-in, level of design implementation, and student achievement
Five elementary schools that were part of the Co-nect school reform design and four elementary comparison schools
Observation instruments – SOM and SCU (SCU was only used when technology was being used - total of 98 classrooms)
388 Co-nect classrooms and 322 comparison classroom were observed
School Climate Inventory (SCI)
Comprehensive School Reform
Findings focusing on technology revealed that 22% of the Co-nect classrooms and 3% of the comparison classes were observed using technology
Co-nect and comparison classrooms were similar in the quality and quantity of available computers (generally 1 to 6 per classroom)
At the low SES comparison schools, computer use was never observed
“Meaningful use” of computers
35
Table 3 (continued)
Study Purpose Sample/Method Results
Ross & Lowther (2003) continued
Teacher Questionnaire (CSRTQ)
Interviews with Co-nect teachers and principals
Student Achievement data – Tennessee Comprehensive Assessment Program (TCAP) for five subjects over three years
was at least occasionally seen in 40% of the technology observations at the Co-nect classrooms
Many of the observed computer activities were lower-level applications (i.e., drill/content/tutorial-type programs)
Waxman & Huang (1995)
To systematically observe the extent to which computer technology is used in elementary and middle school classrooms
200 classroom observations (approximately 40 minutes) were conducted in 116 elementary school and 84 middle school classrooms
16 elementary schools and 12 middle schools from a large, ethnically diverse, urban school district
Observation instrument – Computer Usage Scale (CUS)
Findings revealed that there was no integration of computer technology in the elementary school classrooms and students were observed working with computers in the content areas only 2% of the time in middle school classrooms

36
Table 3 (continued)
Study Purpose Sample/Method Results
Waxman & Huang (1996-1997)
To examine whether classroom interaction, selection of activities, instructional activities, organizational setting of the classroom, and student on task and off task behaviors in the classroom are significantly different according to the degree of implementation of technology in mathematics classrooms
2,189 students were randomly chosen and observed from 5 middle schools
Student demographics – 49.4% female and 50.6% male; 32% Caucasian, 26% African American, 23% Asian, and 20% Hispanic; 38% sixth-graders, 32% seventh-graders, and 30% eighth-graders
School district received a grant to integrate calculators into mathematics instruction
Observation instrument – Classroom Observation Schedule (COS)
Approximately 50-minute systematic observation period
Findings revealed that there are significant differences in classroom instruction by the amount of technology used
Instruction in classrooms where technology was not frequently used tended to be whole-class approaches where students listened to or watched the teacher
Instruction in classroom settings where technology was moderately used had much less whole-class instruction and much more independent work; students were also found to be on task significantly more in these classrooms than students in classrooms where technology was not used as frequently

37
The nine studies summarized in this section all used systematic classroom
observation instruments for a large portion of their data collection. Five of the nine
studies used the School Observation Measure (SOM) (Ross, Smith, & Alberg, 1999) and
the Survey of Computer Use (SCU) (Lowther & Ross, 2000) now referred to as the
Observation of Computer Use (OCU) (Lowther & Ross, 2001). Two of those five studies
used the Rubric for Student-Centered Activities (RSCA) as well. Additionally, two other
studies used the Classroom Observation Schedule (COS) (Waxman, Wang, Lindvall, &
Anderson, 1983). Furthermore, the Computer Usage Scale (CUS) (Waxman & Huang,
1995) was used in one study while the Focusing on Integrating Technology: Classroom
Observation Measurement (FIT:COM) (Judson, 2006) was used in another study. The
number of classroom observations conducted for each of the nine studies ranged from
nine to 1,285. Additionally, teacher questionnaires were also used in three of the studies.
Judson (2006) surveyed and observed 32, K-12 classroom teachers about their
beliefs about instructional practices and technology use. Survey findings were consistent
with previous research; however, classroom observations showed that there was no
significant correlation between teachers‟ instructional beliefs and their approach of
incorporating technology. Despite teachers beliefs in the importance of having a
constructivist-based, student-centered classroom along with positive views towards
technology, pre-scheduled observations of technology integrated lessons did not reflect
those beliefs.
In 1995, Waxman and Huang observed 116 elementary school and 84 middle
school classrooms using the Computer Usage Scale (CUS) observation instrument in

38
38
order to examine the extent to which computers were used. Findings revealed that there
was no integration of computers in the elementary school classrooms, and students were
observed working with computers only 2% of the time in middle school classrooms.
Even though minimal technology use was observed, it is worth noting, that the district
was selected for this study because of the abundance of available technology in the
schools and classrooms.
Huang and Waxman (1996) used the Classroom Observation Schedule (COS) to
observe 1,315 middle school students in order to examine the amount of calculator and
computer use in mathematics classrooms. Findings indicated that middle school students
used calculators about 25% of the time and computers less than one percent of the time.
Additionally, while there were no significant differences by student sex or ethnicity,
students in seventh-grade were observed using calculators significantly more than
students in sixth- or eighth-grade.
In another study, Waxman and Huang (1996-1997) used the COS to observe
2,189 middle school students in order to examine instructional differences by level of
technology use in mathematics classrooms. Findings revealed that teacher-centered
instruction tended to take place in classrooms where technology was not frequently used;
however, more independent student work took place in classrooms where a moderate
amount of technology was used. Additionally, students were found to be on task
significantly more in classrooms where more technology was used.
Inan et al. (2010) conducted observations of pre-scheduled technology
integration lessons in 143 classrooms at the K-12 level. They examined the relationship
39
39
between certain instructional strategies and different types of computer applications by
using the School Observation Measure (SOM) and the Survey of Computer Use (SCU)
to collect the observation data. Their overall findings showed that when applications
such as word processors, the Internet, and presentation software were used, instructional
practices were more likely to be student-centered. Conversely, drill-and-practice
activities revealed a negative relationship with student-centered learning.
Direct observations were conducted in 1,210 PreK-12 classrooms, at 13 schools
that had received a state technology grant along with extensive professional development
and 13 matched schools (Lowther et al., 2006). Similar to Inan et al. (2006), Lowther et
al. used the SOM and SCU observation instruments to collect data. The Rubric for
Student-Centered Activities (RSCA) instrument was also used in this study. Again,
similar to Inan et al. (2006), findings indicated that when student use of technology was
put into practice, the classroom teacher employed more student-centered instructional
practices. Additionally, classrooms at the schools that received the state technology grant
were observed using technology more frequently and students more frequently had a
high level of interest and attention in these schools (Lowther et al., 2006).
In 2008, Lowther, Inan, Strahl, and Ross reported additional findings from the
previously discussed study, yet now with 1,285 classroom observations. The SOM and
OCU (formerly referred to as the SCU) observation instruments were used for data
collection. Findings revealed that students in the schools that participated in the
technology program out-performed or performed as well on achievement tests as
students in the matched schools. Additionally, similar to the previous study, students in

40
40
program schools experienced a greater use of technology as a learning tool and were
significantly more engaged in student-centered learning activities. Furthermore, teachers
in program schools felt that the use of technology positively influenced student learning
and their use of student-centered practices.
Grant, Ross, Wang, and Potter (2005) also used the SOM, SCU, and RSCA to
conduct nine pre-arranged classroom observations in four fifth-grade classes in order to
examine the use of two Apple iBook laptop carts. Findings indicated that technology
was used over 40% of the time when student-centered instructional strategies were
observed and 100% of the time when project-based learning was observed.
Ross and Lowther (2003) also used the SOM to observe 710 elementary
classrooms and the SCU to observe 98 classrooms where technology was being used.
The observations were part of a larger study evaluating five schools that were part of the
Co-nect school reform design. In the study, observations took place at four comparison
schools as well. While technology was not the primary focus in this study, findings
revealed that 40% of the time that technology was observed in the Co-nect classrooms
“meaningful use” of computers was at least occasionally seen. Many of the observed
computer activities were lower-level applications (i.e., drill/content/tutorial-type
programs).
In summary, this section addressed nine studies that used systematic classroom
observations to examine technology use in classrooms. Of the nine studies, seven were
conducted in order to evaluate various state and federally funded technology initiatives.
These studies help to identify the type of instructional practices (e.g., student-centered or

41
41
teacher centered) that often occur when certain types of technology are used in the
classroom. Since many of these observations were conducted, however, during pre-
planned technology integrated lessons, it is still difficult to conclude whether or not
these same findings would occur in a natural setting.
Summary
This chapter reviewed the literature and research on technology use with young
learners, technology and instruction, and classroom observation studies of technology
use. These previous studies have provided a firm foundation for research on technology
use in classrooms. Many of the studies reviewed, however, have primarily relied on self-
report data or consisted of small samples that cannot be generalized to larger
populations. Furthermore, the research, particularly in the area of classroom observations
of technology use, is very limited. Currently, the research consists of a small number of
both large- and small-scale studies that are almost exclusively focused on the evaluation
of specific technology initiatives.
Overall, the studies reviewed in this chapter provided strong support for the
present study, which builds upon the area of observational research by examining
authentic classroom behaviors as they relate to technology use by teachers and students.
This study focuses specifically on pre-kindergarten to fifth-grade classrooms from the
same large public school district that is diverse by both SES and by student ethnicity.
Additionally, differences by technology use and types of instructional practices are

42
42
examined extensively. Finally, this study attempts to connect technology use in
classrooms to students‟ academic engagement.
43
43
CHAPTER III
METHODS
Setting
The data used for this research was part of a larger study that focused on
effective teaching and learning in the district. The study was conducted at 18 elementary
schools located within a sizeable school district that encompassed 345 square miles and
served 23,864 students in 2009-2010. The district was located in a metropolitan area in
the south central region in the U.S. The ethnic breakdown of the district‟s students was:
44.4% Hispanic, 30.6% White, 19.1% African-American, 5.5% Asian, and 0.3% Native
American. Additionally, 47.5% of the students were classified as coming from
economically disadvantaged families; 41.5% are at-risk; and 13.9% have limited English
proficiency (AEIS, 2010).
The district was home to 21 elementary schools, and the current study included
classroom observations from 18 (86%) of those schools. The state in which data these
schools are located annually assigns an overall campus achievement rating based on how
the school collectively performed on the statewide standardized test of knowledge and
skills. Out of the 18 elementary schools, 14 of the schools received campus achievement
ratings of Exemplary (the highest achievement rating) and four received campus
achievement ratings of Recognized (the second highest achievement rating) for the 2009-
10 academic year (AEIS, 2010). Furthermore, for the purpose of this study, the 18
schools were categorized as either low SES, mid SES, or high SES. Schools with greater

44
44
than 80% of their students classified as coming from economically disadvantaged
families were considered low SES; between 30% and 80% were considered mid SES;
and less than 30% were considered high SES. The percent of students considered
economically disadvantaged and the campus achievement ratings are shown in Table 4.
Table 4
School Demographics – 2009-2010
School Economically disadvantaged Campus achievement rating J 3.2% Exemplary I 4.8% Exemplary D 7.6% Exemplary A 24.6% Exemplary B 28.5% Exemplary H 29.3% Exemplary C 32.0% Exemplary M 32.5% Exemplary L 52.8% Exemplary K 60.1% Exemplary F 76.1% Exemplary G 77.3% Exemplary E 80.3% Exemplary R 80.5% Exemplary P 81.5% Recognized Q 92.1% Recognized N 93.3% Recognized O 94.5% Recognized
Overall District 47.5% Recognized
Note. From 2009-2010 Academic Excellence Indicator System (AEIS).
The district has recently composed a series of Strategic Plans for technology
implementation within the district. The most recent plan, Technology Plan 2004-05, was
the third in the series. The plan mandated that 100% of classrooms have Internet
connection, a 4 to 1 student to computer ratio, and a 1 to 1 teacher to computer ratio. The

45
45
goal for the plan was to build upon achievements of prior technology plans (e.g., the
previous plans were so effective that the district became a leader in technology among
public school districts in Texas), to integrate technology in curriculum and instruction, to
provide greater staff development, to increase their own productivity, and to begin to
provide access to the greater district community.
Participants
The participants were 710 students and 141 classroom teachers from 18
elementary schools. Of the 710 students, 369 were female (52.0%) and 341 (48.0%)
were male. Student ethnicity in the current study sample (53.4% Hispanic, 14.4% White,
20.6% African-American, and 11.7% Asian) was generally reflective of the overall
district population, with the exception of Asian students being slightly oversampled and
White students slightly under represented. All student participants were enrolled in pre-
kindergarten or kindergarten (n=177), first-grade (n=140), second-grade (n=134), third-
grade (n=122), fourth-grade (n=70), and fifth-grade (n=67). (Note: pre-kindergarten and
kindergarten classes were combined, due to small sample size). Of the 141 teachers, 136
were female and five were male. The distribution of grades taught was: 24.8% pre-
kindergarten or kindergarten (n=35), 20.6% first-grade (n=29), 19.1% second-grade
(n=27), 16.3% third-grade (n=23), 9.9% fourth-grade (n=14), and 9.2% fifth-grade
(n=13). Classes averaged 17.2 students per class.

46
46
Instruments
Three observational instruments based on types of technology and technology
use in elementary classrooms, as well as on previous classroom observation research
(Waxman, 2003; Waxman & Padrón, 2004; Waxman, Tharp, & Hilberg, 2004), were
specifically developed for this study (see Appendices A. B. and C). The Student
Behavior and Technology Use Observation Schedule, adapted from the Student Behavior
Observation Schedule (Waxman, Wang, Lindvall, & Anderson, 1988), was designed to
systematically obtain information on students' classroom behaviors and technology use.
It served as an instrument for documenting observed student behaviors in the context of
ongoing classroom instructional-learning processes. Individual students were observed
with reference to: (a) the setting in which the observed behavior occurred; (b) whether
the student was on- or off-task, waiting for the teacher, or distracted; (c) the student‟s
interactions with teachers or other students; (d) the type of activity on which the student
was working; (e) the nature of the student‟s interaction with others; (f) the student‟s use
of specific types of technology items; (g) the educational use of the available
technology; and (h) whether the language the student uses was either English, Spanish,
or another language. Approximately five students were observed in each classroom for
six to ten 30-second intervals during each 30-minute data collection period.
The Teacher Roles and Technology Observation Schedule was used to
systematically obtain information on teachers‟ classroom behaviors. It was adapted from
the Teacher Roles Observation Schedule (TROS) (Waxman, Wang, Lindvall, &
Anderson, 1990) and was a systematic observation instrument designed to document

47
47
observed teacher behaviors in the context of ongoing classroom instructional-learning
processes. Teachers were observed with reference to (a) their interactions with students;
(b) the instructional setting in which the observed behavior occurred, (c) whether the
instruction was of a direct, seatwork, or learner-centered orientation; (d) the nature of the
interaction; (e) the purpose of the interaction; (f) the teacher‟s instructional practices
which included uses of technology; and (c) what language was used. Each teacher was
observed for six to ten 30-second intervals during each data collection period.
The Overall Classroom and Technology Observation Measure was a high-
inference instrument used to examine: (a) teachers‟ general instructional practices, (b)
student behaviors and activities, (c) the classroom environment/arrangement, and (d) the
available technology and the extent to which it was observed in the classrooms visited.
The Overall Classroom Observation tool was adapted from the Classroom Observation
Measure (COM) (Ross & Smith, 1996), which measured the extent to which certain
effective instructional processes or strategies were used or demonstrated during the class
period. The COM has been used in a number of studies and found to be reliable and
valid (Ross, Smith, Lohr, & McNelis, 1994; Ross, Troutman, Horgan, Maxwell,
Laitinen, & Lowther, 1997). The COM also has been adapted and used in many recent
studies (Waxman, Padrón, Franco-Fuenmayor, & Huang; 2009). The Overall Classroom
Observation tool was used at the end of the class visitation to measure, on a 3-point scale
(not at all, some, or great), the extent to which certain instructional processes or
strategies were used or demonstrated during the class period.

48
48
Highly-trained researchers conducted all classroom observations. The mean
inter-rater reliabilities across all observers for each observational instrument were:
Teacher Roles and Technology Use Observation Schedule (0.97); Student Behavior and
Technology Use Observation Schedule (0.98); and Overall Classroom and Technology
Observation Measure (0.91). Table 5 refers to the research questions that guided this
study along with the data sources, instruments, and data analysis that was used to
address each of the research questions.
Data Analysis
For the present quantitative study, variables from the observational data
(demographics, type and purpose of instruction, teacher and student technology use, etc.)
were coded and electronically entered for analysis using Statistical Package for the
Social Sciences (SPSS) software. Descriptive statistics were calculated and reported to
answer questions about the types of technology teachers and students were using in their
classrooms. Overall classroom counts for types of technology were also determined.

49
49
Table 5
Research Methodology
Research Questions Data Sources and Instruments Data Analyses
1. What types of technology are teachers using in their classrooms?
Teachers; Overall Classroom and Technology Observation Measure and Teacher Roles and Technology Use Observation Schedule
Descriptive statistics
2. What types of technology are students using in their classrooms?
Students; Student Behavior and Technology Use Observation Schedule
Descriptive statistics
3. Are there significant (p<.05) differences among technology use for teachers by grade-level and content area?
Teachers; Teacher Roles and Technology Use Observation Schedule
Multivariate analysis of variance (MANOVA)
4. Are there significant (p<.05) differences among technology use for students by grade-level, content area, and student ethnicity?
Students; Student Behavior and Technology Use Observation Schedule
MANOVA
5. Are there significant (p<.05) differences among technology use in classrooms by socio-economic status?
Classroom; Overall Classroom and Technology Observation Measure
MANOVA
6. Are there significant (p<.05) differences on technology use by type of instructional practices?
Teachers; Teacher Roles and Technology Use Observation Schedule
MANOVA
7. How does technology use in classrooms relate to students‟ academic engagement?
Students; Student Behavior and Technology Use Observation Schedule and Overall Classroom and Technology Observation Measure
Multiple regression analysis

50
50
Multivariate Analysis of Variance (MANOVA) was the primary data analysis
procedure used in this study. A two-way MANOVA was conducted to investigate
whether there were significant (p<.05) differences in technology use for teachers by
grade-level and content area. In addition, a three-way MANOVA was conducted to
investigate whether there were significant (p<.05) differences in technology use for
students by grade-level, content area, and student ethnicity. Furthermore, a MANOVA
was conducted to investigate whether there were significant (p<.05) differences in
technology use for classrooms by socio-economic status. Additionally, a two-way
MANOVA was conducted to investigate whether there were significant differences in
technology use by type of instructional practice (direct instruction and learner-centered
instruction). Post-hoc tests were performed to further examine significant main effects
and possible interactions.
Additionally, the extent to which technology use influenced students‟ academic
engagement was analyzed using multiple regression analyses. These procedures were
used to examine the effects of technology use on students‟ academic engagement.
Finally, field notes were recorded during observations in order to provide further
explanation for classroom occurrences. The field notes, however, were used to provide
examples but not included in the data analysis.

51
51
CHAPTER IV
RESULTS
The results are presented by the seven research questions posed for this study.
The first two questions addressed the types of technology used by teachers and students
in their classrooms. Next, the third and fourth questions examined significant differences
among technology use for teachers and students by grade-level, content area, and student
ethnicity. Question five explored significant differences among technology use in
classrooms by socio-economic status. Subsequently, question six investigated significant
differences on technology use by types of instructional practices. Finally, the last
question examined whether technology use in classrooms is related to students‟
academic engagement.
Results Related to Type of Technology in Classrooms
Two research questions looked at the types of technology that teachers and
students are using in their classrooms. Question one examines the types of technology
that teachers were using, and question two looked at the types of technology that
students were using. This section presents the types of technology that were available in
classrooms as well as the results of both research questions.
Table 6 shows the types of technology that were available in the observed
classrooms. The most frequently cited technology items were desktop computer (94.3%),
television (55.3%), document reader (39.7%), and interactive whiteboard (36.9%). The

52
52
least frequently cited items were Skype (0.7%), flip camera/video camera (0.7%), and
digital camera (1.4%).
Table 6
Types of Technology Available in Observed Classrooms (n=141)
Type of technology Percentage of classrooms
Desktop computer 94.3% Television 55.3% Document reader 39.7% Interactive whiteboard 36.9% Overhead projector (traditional) 30.5% Laptop computer 29.1% DVDs/CDs and headphones 19.9% Tape player/radio 14.9% Handheld game/device 4.3% MP3 player 2.1% Student timers 2.1% Digital camera 1.4% Flip camera/video camera 0.7% Skype 0.7% Source. Overall Classroom and Technology Observation Measure Research question one. The first question examined the types of technology that
teachers were using in their classrooms. Descriptive statistics from the Overall
Classroom and Technology Observation Measure were used to answer this question.
Table 7 shows the percentage of teachers who integrated specific types of technology
into their classrooms. Overall, 44% of the 141 teachers were observed integrating
technology at some point during the classroom observations. The most frequently
observed technology items used by teachers at some point during the classroom

53
53
observations were interactive whiteboard (23.4%) and desktop computer (20.1%). All
other technology items were observed being used by less than 9% of teachers while MP3
player and Skype were never observed being used by a teacher in the observed
classrooms.
Table 7
Types of Technology Used by Teachers in Classrooms (n=141)
Type of technology Percentage of teachers
Interactive whiteboard 23.4% Desktop computer 20.1% Document reader 8.5% Laptop computer 7.1% Tape player/radio 3.5% Television 3.5% Overhead projector (traditional) 2.8% DVDs/CDs and headphones 2.8% Handheld game/device 2.1% Student timers 0.7% Digital camera 0.7% Flip camera/video camera 0.7% MP3 player 0.0% Skype 0.0% Source. Overall Classroom and Technology Observation Measure Research question two. The second question asked what types of technology
were students observed using in their classrooms. This question was answered using
descriptive statistics from the Student Behavior and Technology Use Observation
Schedule. Table 8 shows the percentage of students who were observed using specific
types of technology in their classrooms. All technology items were observed being used
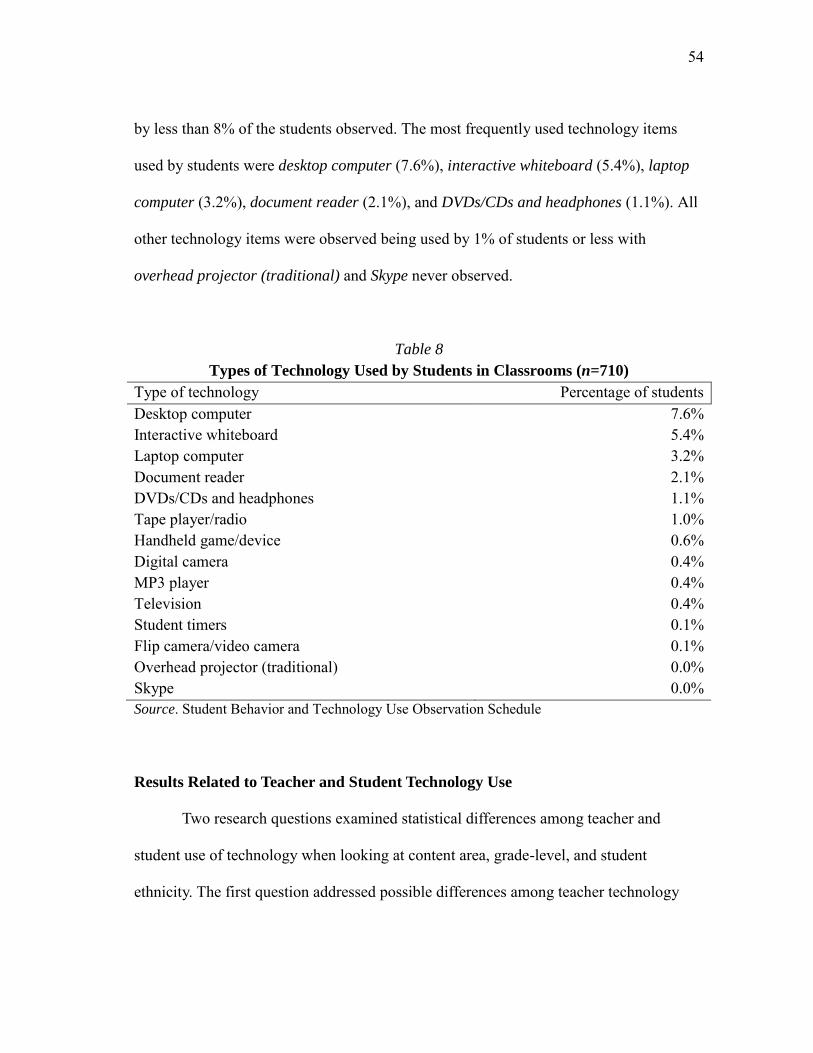
54
54
by less than 8% of the students observed. The most frequently used technology items
used by students were desktop computer (7.6%), interactive whiteboard (5.4%), laptop
computer (3.2%), document reader (2.1%), and DVDs/CDs and headphones (1.1%). All
other technology items were observed being used by 1% of students or less with
overhead projector (traditional) and Skype never observed.
Table 8
Types of Technology Used by Students in Classrooms (n=710)
Type of technology Percentage of students
Desktop computer 7.6% Interactive whiteboard 5.4% Laptop computer 3.2% Document reader 2.1% DVDs/CDs and headphones 1.1% Tape player/radio 1.0% Handheld game/device 0.6% Digital camera 0.4% MP3 player 0.4% Television 0.4% Student timers 0.1% Flip camera/video camera 0.1% Overhead projector (traditional) 0.0% Skype 0.0% Source. Student Behavior and Technology Use Observation Schedule
Results Related to Teacher and Student Technology Use
Two research questions examined statistical differences among teacher and
student use of technology when looking at content area, grade-level, and student
ethnicity. The first question addressed possible differences among teacher technology

55
55
use practices by grade-level and content area, while the second question looked at
possible differences among student technology use practices by grade-level, content
area, and student ethnicity. The results of both research questions are discussed in this
section.
Research question three. Question three asked whether there were significant
(p<.05) differences among technology use for teachers by grade-level and content area.
Differences were analyzed using data collected from the Teacher Roles and Technology
Use Observation Schedule. Table 9 shows the mean percentage values for the five
practices used to describe the ways in which teachers were observed using technology.
Overall, teachers in the observed classrooms did not frequently use technology; however,
the most frequently observed items were uses technology to present material (11.6%)
and assists students with technology (2.6%). All other technology use practices were
observed less than 1% of the time while uses technology to create was never observed.
Standard deviations for the observed variables were high, suggesting a great deal of
variation in the observed frequency of the teacher technology use practices from
classroom to classroom.
Table 9 Mean Percentage Values of Teacher Technology Use Practices (n=141)
Technology use practices Mean percentage SD
Uses technology to present material 11.6% 25.3 Assists students with technology 3.6% 14.0 Uses technology to access the Internet 0.3% 2.7 Uses technology as a communication tool 0.1% 0.8 Uses technology to create 0.0% 0.0 Source. Teacher Roles and Technology Use Observation Schedule.

56
56
Crosstabs were conducted, and due to empty data cells, a two-way MANOVA
examining technology use for teachers by grade-level and content area was not
conducted. Instead, two one-way MANOVAs were used to analyze teacher technology
use by grade-level and teacher technology use by content area. The first one-way
MANOVA was used to determine whether there were any significant differences (p<.05)
by grade-level. No statistically significant differences were found in teacher technology
use practices by grade-level (see Table 10).
Table 10
Summary Statistics for MANOVA Results for
Teacher Technology Use by Grade-Level
Effect Wilks‟ lambda F df p
Grade-level .891 .780 5, 135 .739
The four observed technology use practices were also examined in the second
one-way MANOVA to determine whether there were any significant differences (p<.05)
by content area. No statistically significant differences were found in teacher technology
use practices by content area (see Table 11).
Table 11
Summary Statistics for MANOVA Results for
Teacher Technology Use by Content Area
Effect Wilks‟ lambda F df p
Content area .850 1.393 4, 136 .141

57
57
Research question four. Question four asked whether there were significant
(p<.05) differences among technology use for students by grade-level, content area, and
student ethnicity. Differences were analyzed using data collected from the Student
Behavior and Technology Use Observation Schedule. Table 12 shows the mean
percentage values for the five practices used to describe the ways in which students were
observed using technology. Overall, students in the observed classrooms did not
frequently use technology; however, the most frequently observed item by far was basic
skills/drill/practice (15.2%). All other technology use practices were observed less than
2% of the time. Standard deviations for the observed variables were high, suggesting a
great deal of variation in the observed frequency of the student use of technology from
classroom to classroom.
Table 12 Mean Percentage Values of Student Technology Use Practices (n=710)
Technology use practices Mean percentage SD
Basic skills/drill/practice 15.2% 32.4 Individualized/tracked 1.5% 10.8 Word processing 1.4% 10.5 Creativity 0.7% 6.7 Problem solving 0.2% 2.9 Source. Student Behavior and Technology Use Observation Schedule.
Crosstabs were conducted, and due to empty data cells, a three-way MANOVA
examining technology use for students by grade-level, content area, and student ethnicity
was not conducted. Instead, three one-way MANOVAs were conducted to analyze
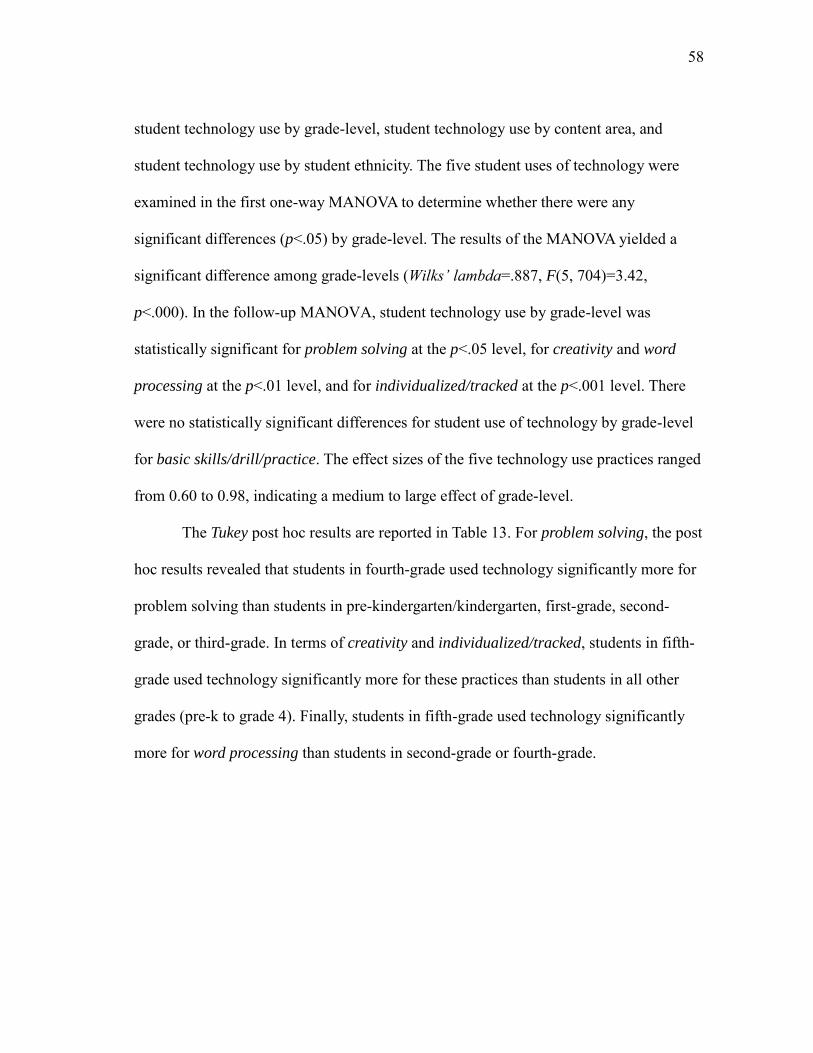
58
58
student technology use by grade-level, student technology use by content area, and
student technology use by student ethnicity. The five student uses of technology were
examined in the first one-way MANOVA to determine whether there were any
significant differences (p<.05) by grade-level. The results of the MANOVA yielded a
significant difference among grade-levels (Wilks’ lambda=.887, F(5, 704)=3.42,
p<.000). In the follow-up MANOVA, student technology use by grade-level was
statistically significant for problem solving at the p<.05 level, for creativity and word
processing at the p<.01 level, and for individualized/tracked at the p<.001 level. There
were no statistically significant differences for student use of technology by grade-level
for basic skills/drill/practice. The effect sizes of the five technology use practices ranged
from 0.60 to 0.98, indicating a medium to large effect of grade-level.
The Tukey post hoc results are reported in Table 13. For problem solving, the post
hoc results revealed that students in fourth-grade used technology significantly more for
problem solving than students in pre-kindergarten/kindergarten, first-grade, second-
grade, or third-grade. In terms of creativity and individualized/tracked, students in fifth-
grade used technology significantly more for these practices than students in all other
grades (pre-k to grade 4). Finally, students in fifth-grade used technology significantly
more for word processing than students in second-grade or fourth-grade.
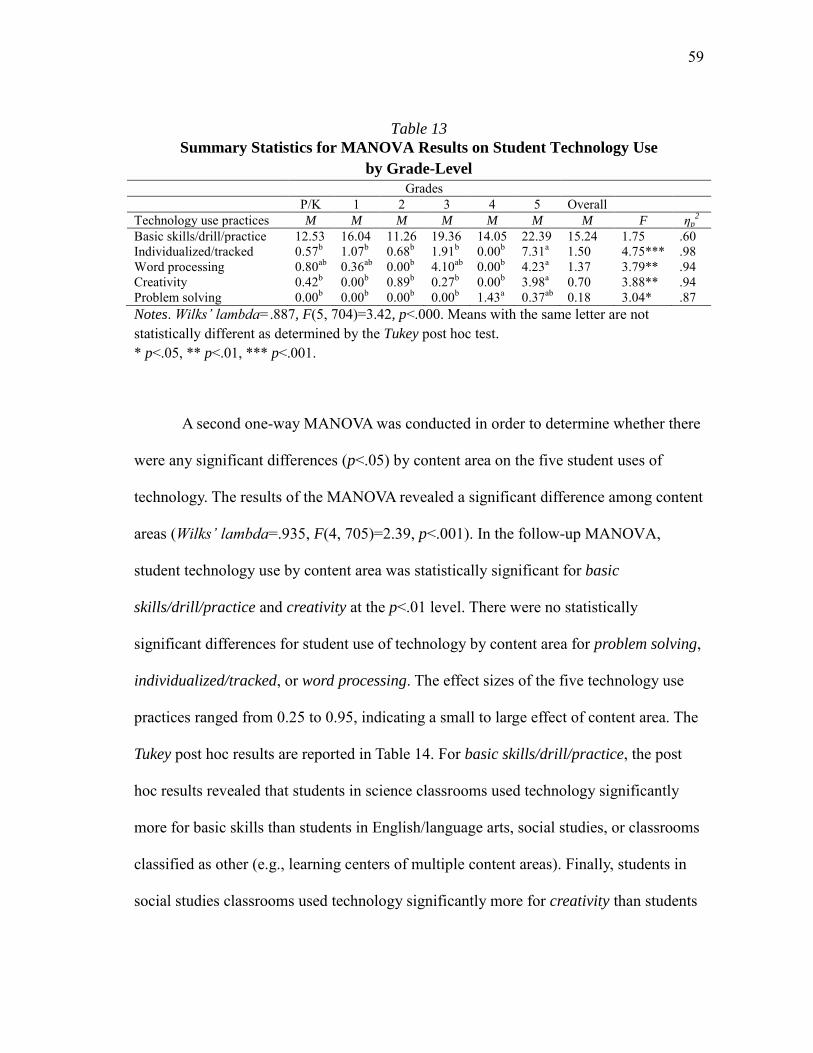
59
59
Table 13 Summary Statistics for MANOVA Results on Student Technology Use
by Grade-Level
Grades P/K 1 2 3 4 5 Overall
Technology use practices M M M M M M M F ηp2
Basic skills/drill/practice 12.53 16.04 11.26 19.36 14.05 22.39 15.24 1.75 .60 Individualized/tracked 0.57b 1.07b 0.68b 1.91b 0.00b 7.31a 1.50 4.75*** .98 Word processing 0.80ab 0.36ab 0.00b 4.10ab 0.00b 4.23a 1.37 3.79** .94 Creativity 0.42b 0.00b 0.89b 0.27b 0.00b 3.98a 0.70 3.88** .94 Problem solving 0.00b 0.00b 0.00b 0.00b 1.43a 0.37ab 0.18 3.04* .87 Notes. Wilks’ lambda=.887, F(5, 704)=3.42, p<.000. Means with the same letter are not statistically different as determined by the Tukey post hoc test. * p<.05, ** p<.01, *** p<.001.
A second one-way MANOVA was conducted in order to determine whether there
were any significant differences (p<.05) by content area on the five student uses of
technology. The results of the MANOVA revealed a significant difference among content
areas (Wilks’ lambda=.935, F(4, 705)=2.39, p<.001). In the follow-up MANOVA,
student technology use by content area was statistically significant for basic
skills/drill/practice and creativity at the p<.01 level. There were no statistically
significant differences for student use of technology by content area for problem solving,
individualized/tracked, or word processing. The effect sizes of the five technology use
practices ranged from 0.25 to 0.95, indicating a small to large effect of content area. The
Tukey post hoc results are reported in Table 14. For basic skills/drill/practice, the post
hoc results revealed that students in science classrooms used technology significantly
more for basic skills than students in English/language arts, social studies, or classrooms
classified as other (e.g., learning centers of multiple content areas). Finally, students in
social studies classrooms used technology significantly more for creativity than students

60
60
in English/language arts, mathematics, or classrooms classified as other.
Table 14 Summary Statistics for MANOVA Results on Student Technology Use
by Content Area
Content Areas ELA Math Science SS Other Overall
Technology use practices M M M M M M F ηp2
Basic skills/drill/practice 13.11b 18.07ab 29.86a 14.89b 9.81b 15.24 3.76** .89 Individualized/tracked 2.29 1.09 0.00 0.00 1.27 1.50 1.11 .35 Word processing 1.47 0.74 0.69 3.20 1.05 1.37 0.78 .25 Creativity 0.10b 0.70b 1.56ab 3.65a 0.00b 0.70 4.68** .95 Problem solving 0.07 0.59 0.00 0.00 0.00 0.18 1.12 .36 Notes. Wilks’ lambda=.935, F(4, 705)=2.39, p<.001. Means with the same letter are not statistically different as determined by the Tukey post hoc test. ** p<.01.
A final one-way MANOVA was conducted in order to determine whether there
were any significant differences (p<.05) by student ethnicity on the five student uses of
technology. The results of the MANOVA yielded a significant difference among student
ethnicities (Wilks’ lambda=.942, F(3, 706)=2.81, p<.000). In the follow-up MANOVA,
student technology use by student ethnicity was statistically significant for basic
skills/drill/practice and creativity at the p<.01 level. There were no statistically
significant differences for student use of technology by student ethnicity for problem
solving, individualized/tracked, or word processing. The effect sizes of the five
technology use practices ranged from 0.12 to 0.92, indicating a small to large effect of
student ethnicity. The Tukey post hoc results are reported in Table 15. In terms of basic
skills/drill/practice, the post hoc results revealed that Hispanic students used technology
significantly more for basic skills than White students. Finally, Asian students were
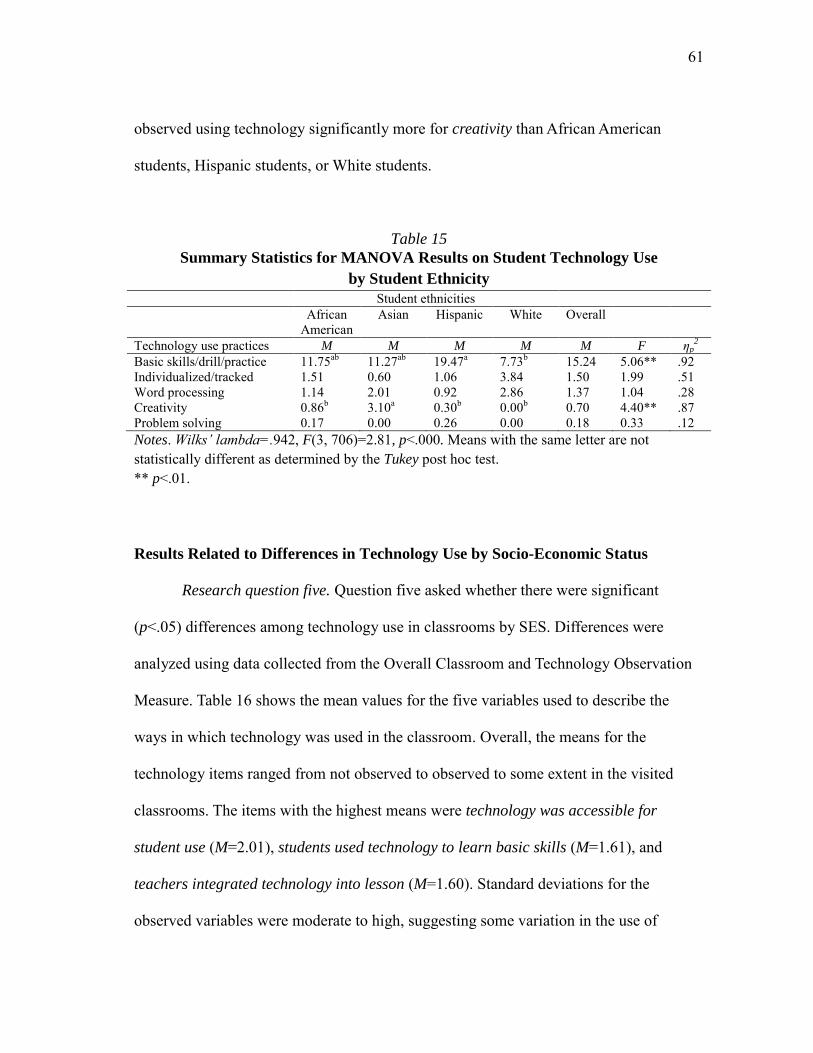
61
61
observed using technology significantly more for creativity than African American
students, Hispanic students, or White students.
Table 15 Summary Statistics for MANOVA Results on Student Technology Use
by Student Ethnicity
Student ethnicities African
American Asian Hispanic White Overall
Technology use practices M M M M M F ηp2
Basic skills/drill/practice 11.75ab 11.27ab 19.47a 7.73b 15.24 5.06** .92 Individualized/tracked 1.51 0.60 1.06 3.84 1.50 1.99 .51 Word processing 1.14 2.01 0.92 2.86 1.37 1.04 .28 Creativity 0.86b 3.10a 0.30b 0.00b 0.70 4.40** .87 Problem solving 0.17 0.00 0.26 0.00 0.18 0.33 .12 Notes. Wilks’ lambda=.942, F(3, 706)=2.81, p<.000. Means with the same letter are not statistically different as determined by the Tukey post hoc test. ** p<.01. Results Related to Differences in Technology Use by Socio-Economic Status
Research question five. Question five asked whether there were significant
(p<.05) differences among technology use in classrooms by SES. Differences were
analyzed using data collected from the Overall Classroom and Technology Observation
Measure. Table 16 shows the mean values for the five variables used to describe the
ways in which technology was used in the classroom. Overall, the means for the
technology items ranged from not observed to observed to some extent in the visited
classrooms. The items with the highest means were technology was accessible for
student use (M=2.01), students used technology to learn basic skills (M=1.61), and
teachers integrated technology into lesson (M=1.60). Standard deviations for the
observed variables were moderate to high, suggesting some variation in the use of

62
62
technology from classroom to classroom.
Table 16 Mean Percentage Values of Classroom Technology Use Practices (n=141)
Classroom technology use M SD
Technology was accessible for student use 2.01 .72 Students used technology to learn basic skills 1.61 .79 Teacher integrated technology into lesson 1.60 .75 Students used technology to enhance problem solving/creativity 1.13 .46 Students used technology to access the Internet 1.11 .41 Source. Overall Classroom and Technology Observation Measure. Notes. 1 = not observed, 2 = some extent, and 3 = great extent
The five classroom technology use variables were examined in a one-way
MANOVA to determine whether there were any significant differences (p<.05) by SES.
No statistically significant differences were found in classroom technology use by SES
(see Table 17).
Table 17
Summary Statistics for MANOVA Results for
Classroom Technology Use by Socio-Economic Status
Effect Wilks‟ lambda F Df p
Socio-economic status .957 .596 2, 138 .817
Results Related to Technology Use and Instructional Practices
Research question six. Question six asked whether there were significant (p<.05)
differences on technology use in classrooms by type of instructional practices. By using
the teacher integrated technology into lesson item from the Overall Classroom and

63
63
Technology Observation Measure, three levels of teacher technology use were
determined: 1 = no technology use (n=79), 2 = moderate technology use (n=40), and 3 =
great extent of technology use (n=22). Three one-way MANOVAs were conducted to
examine differences in setting by level of teacher technology use, differences in
instructional orientation by level of teacher technology use, and differences in the
purpose of interaction by level of teacher technology use.
Table 18 shows the mean percentage values for the five classroom instructional
setting variables. Classrooms were observed in whole class settings 55.5% of the time
while small groups (19.1%), students working individually (12.6%), and dyads (2.8%)
were seen much less frequently. Additionally, teachers were observed traveling among
students 8.0% of the time. Standard deviations for the observed variables were high,
indicating a great deal of variation in the observed settings from classroom to classroom.
Table 18 Mean Percentage Values of Classroom Setting (n=141)
Setting Mean percentage SD
Whole class 55.5% 42.0 Small group 19.1% 36.5 Individual 12.6% 26.8 Traveling 8.0% 19.5 Dyads 2.8% 12.9 Source. Teacher Roles and Technology Use Observation Schedule. The five setting variables were examined in a one-way MANOVA to determine
whether there were any significant differences (p<.05) by level of teacher technology
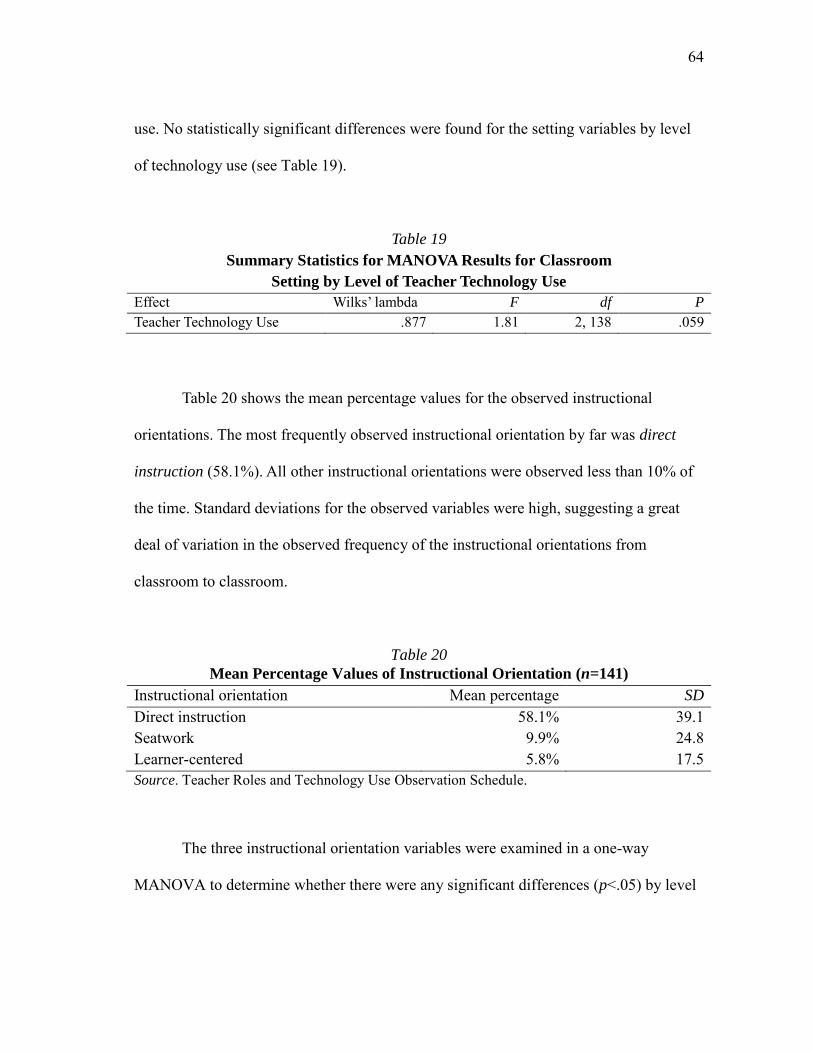
64
64
use. No statistically significant differences were found for the setting variables by level
of technology use (see Table 19).
Table 19
Summary Statistics for MANOVA Results for Classroom
Setting by Level of Teacher Technology Use
Effect Wilks‟ lambda F df P
Teacher Technology Use .877 1.81 2, 138 .059
Table 20 shows the mean percentage values for the observed instructional
orientations. The most frequently observed instructional orientation by far was direct
instruction (58.1%). All other instructional orientations were observed less than 10% of
the time. Standard deviations for the observed variables were high, suggesting a great
deal of variation in the observed frequency of the instructional orientations from
classroom to classroom.
Table 20 Mean Percentage Values of Instructional Orientation (n=141)
Instructional orientation Mean percentage SD
Direct instruction 58.1% 39.1 Seatwork 9.9% 24.8 Learner-centered 5.8% 17.5 Source. Teacher Roles and Technology Use Observation Schedule.
The three instructional orientation variables were examined in a one-way
MANOVA to determine whether there were any significant differences (p<.05) by level

65
65
of teacher technology use. No statistically significant differences were found for the
instructional orientation variables by level of technology use (see Table 21).
Table 21
Summary Statistics for MANOVA Results for Instructional
Orientation by Level of Teacher Technology Use
Effect Wilks‟ lambda F Df P
Teacher Technology Use .955 1.05 2, 138 .394
Table 22 shows the mean percentage values for the 19 practices used to describe
teachers‟ purpose of interaction with students during the observed period. The most
frequently observed items were focus on content (57.7%), focus on process (32.6%), and
focus on product (30.5%). Teachers were also observed praising student performance
(12.4%) and correcting student behavior (12.3%). All other classroom practices were
observed less than 5% of the time. Standard deviations for the observed variables were
high, suggesting a great deal of variation in the teachers‟ purpose of interaction from
classroom to classroom.

66
66
Table 22 Mean Percentage Values of Teacher Purpose of Interaction (n=141)
Purpose of interaction Mean percentage SD
Focus on content 57.7% 36.3 Focus on process 32.6% 34.6 Focus on product 30.5% 88.7 Praise student performance 12.4% 20.9 Correct student behavior 12.3% 21.9 Assessment 4.8% 18.4 Correct student performance 4.5% 13.6 Praise student behavior 4.5% 11.9 Encourage students to succeed 4.0% 12.8 Redirect student thinking 3.6% 10.2 Encourage extended student responses 2.7% 8.9 Show personal regard for student 2.5% 9.5 Show interest in student work 2.4% 8.0 Encourage student self-management 1.3% 6.0 Encourage students to help each other 1.0% 5.3 Present multiple perspectives on topic 0.9% 6.4 Encourage students to question 0.7% 4.6 Connect content to other disciplines 0.6% 3.9 Connect content to global communities 0.6% 3.7 Source. Teacher Roles and Technology Use Observation Schedule.
In order to group the 19 instructional practices into factors, a factor analysis
(using Varimax rotation) was conducted. The factor analysis revealed eight factors with
eigenvalues greater than 1.00, accounting for 63.16% of the variance. The factor
analysis, however, did not yield a meaningful, reduced number of factors. Consequently,
a one-way MANOVA was conducted using all 19 instructional practices to determine
whether there were any significant differences (p<.05) by level of teacher technology
use. No statistically significant differences were found for the 19 teacher instructional
practices by level of teacher technology use (see Table 23).

67
67
Table 23
Summary Statistics for MANOVA Results for
Purpose of Interaction by Level of Teacher Technology Use
Effect Wilks‟ lambda F df p
Teacher Technology Use .714 1.16 2, 138 .253
Results Related to Technology Use and Student Engagement
Research question seven. Question seven asked how technology use in
classrooms relates to student engagement (e.g., on task, off task). This question will first
be addressed by examining any significant differences in student engagement by level of
student technology use. Then, significant differences in student engagement will also be
examined by level of teacher technology use. By taking an average of the frequencies for
the student technology use items from the Student Behavior and Technology Use
Observation Schedule, three levels of student technology use were determined: 1 = no
technology use (n=518), 2 = low technology use, less than 15% (n=106), and 3 =
moderate technology use, greater than 15% (n=86). Next, a one-way MANOVA was
conducted to examine any significant differences (p<.05) in student engagement by level
of student technology use. No statistically significant differences were found for student
engagement by level of student technology use (see Table 24).
Table 24
Summary Statistics for MANOVA Results for
Students’ Academic Engagement by Level of Student Technology Use
Effect Wilks‟ lambda F df p
Student Technology Use .991 1.60 2, 707 .173

68
68
Additionally, differences in student activity types (e.g., discussing, reading,
questioning) by level of student technology use were also examined. In order to group
the 20 activity types into factors, a factor analysis (using Varimax rotation) was
conducted. The factor analysis revealed nine factors with eigenvalues greater than 1.00,
accounting for 56.95% of the variance. The factor analysis, however, did not yield a
meaningful, reduced number of factors. Consequently, a one-way MANOVA was
conducted using all 20 activity types to determine whether there were any significant
differences (p<.05) by level of student technology use. The results of the MANOVA
yielded a significant difference among the three levels of student technology use (Wilks’
lambda=.857, F(2, 707)=2.77, p<.000). In the follow-up MANOVA, student activity
types by level of technology use were statistically significant for written assignment,
distracted, answering teacher-posed questions, and learning/activity centers at the p<.01
level and for discussing, working kinesthetically, and free exploration/inquiry at the
p<.05 level. The effect sizes of the 20 student activity types ranged from 0.08 to 0.88,
indicating a small to large effect of level of student technology use.
The Tukey post hoc results are reported in Table 25. In terms of written
assignment, the post hoc results revealed that students who were not using technology
and students who moderately used technology were observed performing written
assignments significantly more frequently than students who had a low use of
technology. Students who were not using technology were distracted significantly more
of the time than students who had a low use of technology; however, students who were
not using technology were observed answering teacher-posed questions significantly

69
69
more than students who moderately used technology. Additionally, students who had a
low use of technology were observed in learning/activity centers significantly more
frequently than students who were not using technology. Students who used a
technology moderately were observed discussing significantly more frequently than
students had a low use of technology. Finally, students who used technology a moderate
amount of the time were observed engaging in free exploration/inquiry significantly
more than students who were not using technology. The post hoc results did not reveal
significant differences for students observed working kinesthetically.
A final one-way MANOVA was conducted to examine significant difference on
students‟ academic engagement by the level of teacher technology use (1 = no
technology use, 2 = moderate technology use, and 3 = great extent of technology use).
The results of the MANOVA yielded a significant difference among the three levels of
teacher technology use (Wilks’ lambda=.983, F(2, 707)=3.06, p<.05) on students‟
academic engagement. In the follow-up MANOVA, on task and off task variables were
statistically significant at the p<.01 level. The effect sizes of the two engagement
variables ranged from 0.80 to 0.88, indicating a large effect of level of teacher
technology use.

70
70
Table 25 Summary Statistics for MANOVA Results on Student Activity Types
by Level of Student Technology Use
Student Technology Use No tech
use (n=518)
Low tech use
(n=106)
Moderate tech use (n=86)
Overall
Student activity types M M M M F ηp2
Listening/watching 35.16 39.55 30.13 35.21 1.52 .32 Written assignment 33.58a 21.06b 33.82a 31.74 5.19** .83 Reading 9.86 6.78 7.36 9.10 1.00 .22 No activity/transition 6.74 9.38 6.24 7.07 1.37 .30 Distracted 7.08a 1.33b 2.40ab 5.65 6.00** .88 Answering teacher-posed questions 6.59a 4.05ab 1.05b 5.54 5.86** .87 Discussing 5.52ab 1.21b 7.11a 5.07 4.20* .74 Working kinesthetically 5.86 1.57 4.38 5.04 3.15* .61 Learning/activity centers 3.28b 9.20a 5.62ab 4.45 4.87** .80 Assessment 2.91 2.59 3.88 2.98 0.20 .08 Using concrete learning materials
that closely relate to daily life experiences
2.89 1.52 0.00 2.34 2.64 .53
Answering peer-posed questions 1.90 0.24 0.58 1.49 0.60 .15 Games/rule-based play 0.97 0.63 2.52 1.11 1.28 .28 Questioning 0.74 0.00 0.39 0.59 1.13 .25 Tutoring 0.69 0.47 0.00 0.58 0.70 .17 Dramatic play 0.46 0.94 0.00 0.47 0.69 .17 Free exploration/inquiry 0.25b 0.00b 1.94a 0.42 3.56* .66 Constructive play 0.29 0.94 0.00 0.35 1.76 .37 Acting-out 0.35 0.00 0.00 0.25 0.80 .19 Presenting 0.20 0.16 0.00 0.17 0.33 .10 Notes. Wilks’ lambda=.857, F(2, 707)=2.77, p<.000. Means with the same letter are not statistically different as determined by the Tukey post hoc test. * p<.05 and ** p<.01.
The Tukey post hoc results are reported in Table 26. Students observed in
classrooms where teachers used technology to a great extent were significantly more
likely to be on task than in classrooms where teachers only integrated technology
moderately or did not integrate it at all. Additionally, students in classrooms where
teachers moderately used technology or did not use technology at all were significantly
more likely to be observed off task than students in classrooms where teachers integrated
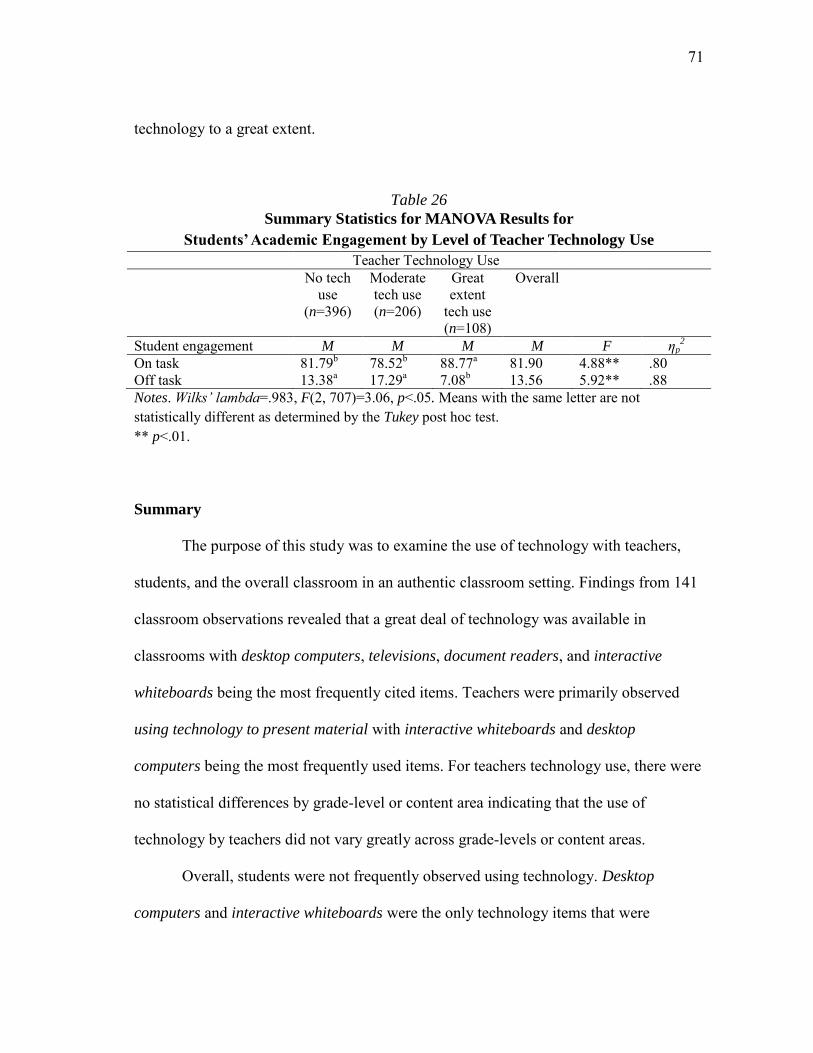
71
71
technology to a great extent.
Table 26 Summary Statistics for MANOVA Results for
Students’ Academic Engagement by Level of Teacher Technology Use
Teacher Technology Use No tech
use (n=396)
Moderate tech use (n=206)
Great extent
tech use (n=108)
Overall
Student engagement M M M M F ηp2
On task 81.79b 78.52b 88.77a 81.90 4.88** .80 Off task 13.38a 17.29a 7.08b 13.56 5.92** .88 Notes. Wilks’ lambda=.983, F(2, 707)=3.06, p<.05. Means with the same letter are not statistically different as determined by the Tukey post hoc test. ** p<.01. Summary
The purpose of this study was to examine the use of technology with teachers,
students, and the overall classroom in an authentic classroom setting. Findings from 141
classroom observations revealed that a great deal of technology was available in
classrooms with desktop computers, televisions, document readers, and interactive
whiteboards being the most frequently cited items. Teachers were primarily observed
using technology to present material with interactive whiteboards and desktop
computers being the most frequently used items. For teachers technology use, there were
no statistical differences by grade-level or content area indicating that the use of
technology by teachers did not vary greatly across grade-levels or content areas.
Overall, students were not frequently observed using technology. Desktop
computers and interactive whiteboards were the only technology items that were

72
72
observed being used by greater than 5% of students, and when students were using
technology, it was almost exclusively for basic skills/drill/practice. Student were rarely
observed using technology for problem solving, creativity, individualized/tracked, or
word processing, yet, numerous significant differences were found in relation to
students‟ use of technology by grade-level, content area, and student ethnicity.
Descriptive statistics revealed that a whole class setting and direct instruction
with a focus on content, process, and product were the most frequently observed
classroom instructional practices. Learner-centered instruction occurred less than 6% of
the time; however, unlike previous studies, no statistically significant differences were
found in relation to the extent of teacher technology use and classroom instructional
practices. On the other hand, students observed in classrooms where teachers used
technology to a great extent were found to be on task significantly more than students in
classrooms where technology was only used a moderate amount or not used at all. This
is a positive finding concerning technology use and its potential impact on student
engagement.
Students observed were found to be on task the majority of the time (81.9%);
however, no statistically significant differences were found for student engagement (e.g.,
on task, off task) by level of student technology use. Interestingly, students who were not
observed using technology were distracted significantly more of the time than students
who used technology to some extent. Also, students who used technology to some extent
were observed in learning/activity centers significantly more than students who were not
observed using any technology. Additionally, students who were observed using

73
73
technology at least a moderate amount were observed discussing and engaged in inquiry
significantly more than students who used technology only a small amount of the time.
Conversely, students who were not observed using technology answered teacher-posed
questions significantly more than students observed using technology at least a moderate
amount of the time.
The results of the present study suggest that technology, for the most part, has
not been adequately implemented into the observed classes. This is due to the overall
low frequency of technology integration and the lack of higher level strategies being
used with technology. Research suggests that classroom practices are more likely to be
student-centered when students are using technology as a learning tool (e.g., Internet,
word processing, presentation software) (Inan et al., 2010). The use of drill-and-practice
activities, the primary way technology was used by students in the present study, has
been shown to have a negative relationship with student-centered learning.
74
74
CHAPTER V
DISCUSSION, IMPLICATIONS, AND CONCLUSION
This chapter summarizes the results and discusses both implications and
conclusions derived from the current study. This chapter is presented in five sections.
Section one discusses the overall and significant findings in terms of teacher and student
technology use, classroom technology use as it relates to SES, technology use and
instructional practices, and technology use and student engagement. Section two
compares the results from this study to prior research, with particular attention paid to
the previous observational studies, as well as implications for future research. Section
three presents implications for practice based on the results of the current study. Section
four discusses study limitations. Finally, section five includes the overall study
conclusions.
Discussion of Results
Systematic classroom observations for this study took place within 18 elementary
schools of a high performing school district that was both ethnically and economically
diverse. The district had a series of technology plans in place which mandated that 100%
of classrooms have Internet connection, a 4 to 1 student to computer ratio, and a 1 to 1
teacher to computer ratio. This series of technology plans had in fact been so successful
that the district became a leader in technology among public school districts in the state

75
75
of Texas. Therefore, the purpose of this study was to examine the use of technology with
teachers, students, and the overall classroom in an authentic classroom setting.
Teacher and student technology use. The findings revealed that a great deal of
technology was available in the 141 observed classrooms with desktop computers,
televisions, document readers, and interactive whiteboards being the most frequently
cited items. Due to the observational nature of this study, it is possible that additional
technology items were present but not placed in an area of the classroom that was easily
visible to an observer (e.g., digital cameras, MP3 players, tablet devices). Overall,
teachers were observed using technology in the classroom to some extent. More
specifically, 44% of teachers were observed using technology at some point during the
observations and interactive whiteboards and desktop computers were the most
frequently used items. When teachers were using technology, they were almost entirely
using technology to present material. An example of a typical classroom as noted by one
observer, “The teacher used the interactive whiteboard to display a worksheet that the
students had already completed and had the students verbally assist her in making the
written corrections [on the interactive whiteboard] to the sentences.” Teachers were
almost never observed using technology to access the Internet, as a communication tool,
or to create. Additionally, there were no statistical differences for teachers technology
use by grade-level or content area indicating that the use of technology by teachers did
not vary greatly across grade-levels or content areas.
Overall, students were not frequently observed using technology. Desktop
computers and interactive whiteboards were the only technology items that were

76
76
observed being used by greater than 5% of students. When students were using
technology, they were almost always using it for basic skills/drill/practice. One observer
in a third-grade English/language arts class noted, for example, “Two students were at
the computers. One student was taking an AR [Accelerated Reader] and the other was
playing a word game.” Students were almost never observed using technology for
creativity or problem solving; however, while the overall use of technology for problem
solving was very low (0.2% of the time), students in fourth-grade used it significantly
more than students in pre-kindergarten/kindergarten, first-grade, second-grade, or third-
grade. Additionally, students in fifth-grade used technology for creativity and
individualized/tracked practices significantly more than students in all other grades.
Finally, students in fifth-grade were also observed using technology significantly more
for word processing than students in second-grade or fourth-grade. While these
differences were statistically significantly, it is difficult to draw generalizable
conclusions since these practices were not frequently observed (less than 2% of the
time).
Statistically significant differences were also found for student use of technology
in regard to content area. Science classrooms were observed using technology
significantly more for basic skills/drill/practice than students in English/language arts,
social studies, or classrooms labeled as other (e.g., learning centers, circle/calendar
time). This finding was somewhat surprising due to the prevalence of word/letter
computer games. Additionally, teachers at several of the elementary schools pointed out
the use of the Accelerated Reader program as well as drill-and-practice preparation for

77
77
the statewide standardized testing. An example of students using technology for basic
skills in a science classroom was noted by one observer in a pre-kindergarten classroom,
“Students were taking turns going up to the Promethean Board to name and point to the
farm animals.” Furthermore, the findings revealed that students in social studies
classrooms used technology significantly more for creativity than students in
English/language arts, mathematics, or classrooms classified as other. Again, while this
finding is significant, students were rarely observed using technology for creativity
(0.7% of the time) so major conclusions cannot be made.
Finally, statistically significant differences also occurred when examining student
use of technology and student ethnicity. Hispanic students were observed using
technology significantly more for basic skills/drill/practice than White students. While
using technology for basic skills is not generally viewed as the most effective use of
technology, prior research has revealed that individual technology usage can be
particularly beneficial for Hispanic, English language learners (ELLs) (Park, 2008;
Waxman et al., 2007). Additionally, Asian students were observed using technology for
creativity significantly more than African American students, Hispanic students, or
White students. Again, while this finding is statistically significant, students were
infrequently observed using technology for creativity (0.7% of the time) so generalizable
conclusions cannot be made.
Classroom technology use and SES. The schools visited in this study were very
diverse in terms of the percentage of students coming from families who were
economically disadvantaged. Therefore, each school was categorized as low SES, mid

78
78
SES, or high SES depending on percentage of students labeled economically
disadvantaged. Previous studies have found significant SES related differences
concerning how technology is used in the classroom (Judge et al., 2006; Hohlfeld et al.,
2008). This prior research revealed that students attending lower SES schools used
technology more frequently for basic skills instruction (e.g., content software, reading
software) and students attending higher SES schools used technology more for
production software or Internet purposes. In the current study, however, no statistically
significant differences were found in relation to classroom technology use and SES.
Technology use and instructional practices. Descriptive statistics revealed that a
whole class setting and direct instruction with a focus on content, process, and product
were the most frequently observed classroom instructional practices. Learner-centered
instruction occurred less than 6% of the time. Previous studies have concluded that
teachers who prefer constructivist, learner-centered instructional approaches are more
likely to integrate technology into their classrooms (Hermans et al., 2007; Wozney et al.,
2006). Other research, however, has also contradicted this finding indicating that there is
not a significant relationship between technology use and teacher beliefs (Judson, 2006).
Teacher beliefs about technology were not measured in the present study; however, no
statistically significant differences were found in relation to the extent of teacher
technology use and classroom instructional practices.
Technology use and student engagement. Students observed in the present study
were found to be on task the majority of the time (81.9%). Previous research has found
students to be on task significantly more in classrooms where technology was at least

79
79
moderately used (Waxman & Huang, 1996-1997). In the present study, no statistically
significant differences were found for student engagement (e.g., on task, off task) by
level of student technology use; however, students who were not observed using
technology were significantly more distracted than students who used technology to
some extent. Also, students who used technology to some extent were observed in
learning/activity centers significantly more than students who were not observed using
technology. One classroom observer in a fourth-grade math class noted, “The teacher
was working with a small group while other students rotated through different stations,
such as computer math drill, SMART Board, and workbooks.”
Additionally, students who were observed using technology at least a moderate
amount were observed discussing and engaged in inquiry significantly more than
students who used technology only a small amount of the time. Conversely, students
who were not observed using technology answered teacher-posed questions significantly
more than students observed using technology at least a moderate amount of the time.
Finally, students observed in classrooms where the teacher used technology to a great
extent were found to be on task significantly more than students in classrooms where
technology was only used a moderate amount or not used at all. This finding supports
the results of Waxman and Huang‟s (1996-1997) earlier study.
Implications for Research
Despite the fact that technology use in education has been an area of much
research, the number of systematic observation studies is actually quite limited. In

80
80
Chapter II (Tables 1-3), prior studies were discussed in relation to technology and young
children, classroom instructional practices and technology, and classroom observation
studies of technology use. This section will address how the findings from the present
study build upon previous studies as well as remark on implications for future research.
Waxman and Huang (1995) conducted classroom observations in elementary and
middle school classrooms in order to examine the extent to which computers were used.
At the time of their study, findings revealed that there was no integration of computers in
elementary school classrooms, and students were observed working with computers only
2% of the time in middle school classrooms. Interestingly, the district where the
observations took place was selected because of the abundance of available technology
in the schools and classrooms. While the findings for the present study show that
technology use in classrooms has increased over the past decade and a half, it is still not
being used to a great extent. Similar to Waxman and Huang‟s (1995) study, the district
where the observations took place in the current study has a great deal of technology
available.
In another study, Waxman and Huang (1996-1997) observed middle school
students in order to examine instructional differences by level of technology use,
specifically, in mathematics classrooms. The findings revealed that teacher-centered
instruction tended to take place in classrooms where technology was not frequently used;
however, more independent student work took place in classrooms where a moderate
amount of technology was used. In the present study, no statistically significant
differences were found when examining the extent to which teachers integrated
81
81
technology into the lesson and classroom instructional practices (e.g., teacher-centered,
student-centered). The findings from Waxman and Huang‟s (1996-1997) study also
showed that students were found to be on task significantly more in classrooms where
more technology was used. While the present study did not specifically focus on
mathematics classrooms or middle school grade-levels, students were found to be on
task significantly more when teachers were using technology to a great extent.
Direct observations were conducted in PreK-12 classrooms, at schools that
received a state technology grant along with extensive professional development and
matched schools (Lowther et al., 2006). The findings indicated that when students were
observed using technology, teachers employed more student-centered instructional
practices. Additionally, classrooms at the schools that received the state technology grant
were observed using technology more frequently and students more frequently had a
high level of interest and attention in these schools. In 2008, Lowther, Inan, Strahl, and
Ross reported additional findings from the previous Lowther et al. (2006) study. The
findings revealed that students in the schools that participated in the technology program
out-performed or performed as well on achievement tests as students in the matched
schools. Unlike these previous studies, the purpose of the present study was not to
examine or evaluate a specific grant or technology program but instead to observe
technology being used in an authentic classroom setting.
Inan et al. (2010) conducted observations of pre-scheduled technology
integration lessons in K-12 classrooms in order to examine the relationship between
certain instructional strategies and different types of computer applications. The findings

82
82
showed that when applications such as word processors, the Internet, and presentation
software were used, instructional practices were more likely to be student-centered.
Conversely, drill-and-practice activities revealed a negative relationship with student-
centered learning. In the current study, students used technology almost entirely for drill-
and-practice activities; however, students using technology to some extent were
significantly more likely to be in learning/activity centers than students who were not
observed using technology.
Grant, Ross, Wang, and Potter (2005) conducted a small number of pre-arranged
classroom observations in fifth-grade classes in order to examine the use of two laptop
carts. Findings indicated that technology was used over 40% of the time when student-
centered instructional strategies were observed and 100% of the time when project-based
learning was observed. The use of laptop carts was not specifically examined in the
present study, but observers noted the use of laptop carts in several classrooms. In one
fifth-grade social studies classroom, for example, “About half of the students in the class
are using mini-laptops from a laptop cart to research on the Internet and create brochures
about their research topics.”
Ross and Lowther (2003) observed elementary classrooms as part of a larger
study evaluating schools that were part of the Co-nect school reform design and
comparison schools. While technology was not the primary focus in this study, findings
revealed that 40% of the time that technology was observed in the Co-nect classrooms
“meaningful use” of computers was at least occasionally seen. Many of the observed
computer activities were lower-level applications (i.e., drill/content/tutorial-type

83
83
programs). Similarly, in the present study, students were observed using technology for
drill-and-practice activities the majority of the time.
Future research must continue to build upon this very limited area of
observational research. Currently, much of the research on technology use with early
childhood and elementary classrooms is based on self-report, survey and interview data
if conducted on a larger scale. Observations have been used in small case studies but
need to be implemented in more large-scale studies as well. Additionally, these studies
need to specifically focus on early childhood and elementary classrooms because a great
deal of the current research focuses on general K-12 environments. Observation
instruments need to be able to include specific best practices for using technology with
young learners.
Additionally, more systematic observation research needs to occur in natural,
authentic settings. Much of the current research involves the evaluation of certain state
and federally funded technology initiatives. Therefore, the observations have generally
taken place during pre-scheduled technology integration lessons. More research needs to
focus on how technology is typically used in the classroom and how it relates to certain
instructional practices, student engagement, and even student achievement.
Future observational research should also focus on the use of specific types of
technology. Judge and colleagues‟ (2006) research presented data that suggested that
frequent use of reading software had a significant negative correlation with reading
achievement. The current study did not focus on specific types of software but students
were observed using technology for basic skills the majority of the time. More
84
84
specifically, Hispanic students were observed using technology for basic skills
significantly more than White students. The use of technology and specific software
needs further investigation because certain uses of technology might enhance instruction
and learning, but there is always the possibility that certain uses will have the opposite
effect.
Implications for Practice
This section will discuss implications for practice as related to the findings from
the current study. Results from the present study suggest that technology has not been
adequately implemented, for the most part, into the observed classrooms. When
technology was implemented, teachers were primarily using it to present material and
students were using it almost entirely for basic skills activities. Additional research is
needed to identify the best ways to teach teachers how to effectively implement
technology. In the current study, an observer noted a brief conversation about
technology professional development with a second-grade teacher:
Teachers have to attend three hours of technology training a year. They are
allowed to choose which one they want to go to. [The teacher] attended the
SMART Board training because they just recently got one but other options
involve things like PowerPoint.
Hattie (2009) looked across numerous meta-analyses on technology use and found that
teachers need, at minimum, 10 hours of professional development training on technology

85
85
use over a concentrated time period (e.g., a few weeks) to have a substantial effect on
classroom technology use.
Professional development for in-service teachers and teacher preparation
programs need to integrate technology in order to adequately prepare teachers to use
technology in their classrooms (Gimbert & Cristol, 2004). Teachers are more likely to
take an active role in the use of technology, if they feel confident with their skills for
technology implementation. The need for teachers to play an active role in the formation
of an effective technology-enhanced learning environment was a common theme
throughout much of the literature on using technology with young children. It is clear
that having a certain type of technology equipment (e.g., IWB) does not automatically
create student-centered learning environments. Additionally, the presence of technology
in the classroom does not prevent the possible barriers (e.g., lack of time and inadequate
technology skills) to technology use.
Through further analysis of numerous meta-analyses of technology use in
schools, Hattie (2009) presents six areas that help to achieve effective technology use:
(a) diversity of teaching strategies; (b) professional development training in the use of
technology as a teaching and learning tool; (c) numerous opportunities for learning; (d)
the student, not teacher, is in “control” of learning; (e) peer learning is fully utilized; and
(f) feedback is fully utilized. In terms of diversity of teaching strategies, Hattie (2009)
found that technology was most effective when used as a “supplement” not a
“substitute” for teacher instruction. Additionally, technology can provide numerous
opportunities for learning. Computer tutorials were shown to have the greatest effect but

86
86
even basic skills activities, the primary way technology was used by students in the
present study, were shown to have a positive effect particularly when they were learner
controlled, worked towards a goal, and provided an instant response of “correctness”.
Finally, Hattie (2009) found peer learning to be the optimal setting for students using
technology. In the present study, students were only observed working with peers 2.8%
of the time.
Additionally, in the present study, findings revealed that students were found to
be on task significantly more frequently when teachers integrated technology to a great
extent; however, only 15% of teachers were observed integrating technology to a great
extent. Hattie (2009) found that well-managed classrooms where students were on task
had a positive effect on student engagement and student learning. Ertmer and Ottenbreit-
Leftwich (2010) stated that today in the 21st century, “effective teaching requires
effective technology use” (p. 256). They went on to say that teacher change is necessary
and after extensively reviewing the literature on technology use and professional
development the four suggested variables to accomplish teacher change include:
knowledge, self-efficacy, pedagogical beliefs, and subject and school culture.
In terms of knowledge, teachers need to have both knowledge of the technology
equipment and knowledge of using that equipment for planning, implementation, and
evaluation processes (Ertmer & Ottenbreit-Leftwich, 2010). Additionally, teachers need
self-efficacy in using technology for instructional purposes. Teachers primarily gain this
confidence by having successful experiences with the implementation of technology.
Furthermore, according to Ertmer and Ottenbreit-Leftwich (2010), it is necessary to take

87
87
into consideration teachers‟ pedagogical beliefs. The role that pedagogical beliefs plays
on technology use in classrooms has been a controversial issue in previous research;
however, Ertmer and Ottenbreit-Leftwich (2010) believe that teachers are more likely to
use technology in classrooms when they value the role technology has with student
learning outcomes. The final variable in terms of accomplishing teacher change with
technology integration is the school culture. The school culture is largely determined by
the school leadership; therefore, it is important for the school leadership to include
technology integration in their characterization of “good” teaching.
Study Limitations
All types of research have limitations to some extent. This section will discuss
limitations that are present in observational research as well as limitations that are
specific to this study. The first limitation is the obvious, intrusive nature of observational
research. When an observer enters a classroom, both students and the teacher are aware
that someone is watching and recording their behaviors. This presents a potential threat
to validity because the students and teacher might alter their behaviors when an observer
is present. Observers make every effort to be as unobtrusive as possible, but the issue
still exists.
Another study limitation is the limited amount of time that each classroom was
observed, and the fact that each classroom was only observed once. As a result, it is not
possible to make comparisons over time or to know if what were observed that day is
typical classroom technology use. Therefore, it is necessary to observe a large enough

88
88
number of classrooms in order to achieve reliable and valid measures of instruction and
in this case technology use (Waxman et al., 2004).
Additionally, Waxman and colleagues (2004) pointed out that critics of
systematic observational research have concerns about why certain items are selected for
observation and others are not. This leads to another potential limitation which is that
observers are limited, for the most part, to recording only those variables that are present
on the observation instrument. In the present study, observers were encouraged to record
field notes in order to provide further explanation for certain classroom occurrences. The
field notes, however, were used to provide examples but not included in the data
analysis.
Conclusion
The purpose of this study was to systematically observe pre-kindergarten to fifth-
grade classrooms to examine the use of technology with teachers, students, and the
overall classroom in an authentic classroom setting. Overall, the results of the present
study suggest that technology has not been adequately implemented into the observed
classes. Technology was available but was not used to a great extent. When technology
was implemented, teachers were primarily observed using it to present material and
students were observed using it almost exclusively for basic skills activities.
As previously stated, this low-level of technology integration occurred in
elementary schools of a high performing school district which had a technology plan in
place, a low student to computer ratio, and 100% of the classrooms had Internet access.

89
89
It was even noted that the series of technology plans in the district had been so
“successful” that the district became a leader in technology among public school districts
in the state of Texas.
The previous statement is somewhat concerning considering that only 15% of
teachers were observed integrating technology to a great extent. However, students in
these classrooms were observed on task more frequently than students in classrooms
where technology was observed less or not at all. On the other hand, students were
observed off task significantly more in classrooms where either no technology
integration was observed or where it was only observed a moderate amount. These
findings support and build upon previous observational studies. There is still a need,
however, for strong, empirical research to be conducted to further examine the use of
technology in elementary classrooms.

90
90
REFERENCES
Academic Excellence Indicator System (AEIS). (2010). AEIS 2009-2010 reports.
Austin, TX: Texas Education Agency website
http://ritter.tea.state.tx.us/perfreport/aeis/
Bakia, M., Means, B., Gallagher, L., Chen, E., & Jones, K. (2009). Evaluation of the
Enhancing Education through Technology Program: Final Report. Washington,
D.C.: U.S. Department of Education.
Boyd, B. (2008). Assistive technology for every child. Montessori Life, 1, 30-35.
Cuban, L. (2001). Oversold and underused: Computers in the classroom. Cambridge,
MA: Harvard University Press.
Ertmer, P. A., & Ottenbreit-Leftwich, A. T. (2010). Teacher technology change: How
knowledge, confidence, beliefs, and culture intersect. Journal of Research on
Technology in Education, 42(3), 255-284.
Fish, A. M., Li, X., McCarrick, K., Butler, S. T., Stanton, B., Brumitt, G. A., . . .
Partridge, T. (2008). Early childhood computer experience and cognitive
development among urban low-income preschoolers. Journal of Educational
Computing Research, 38(1), 97-113.
Fletcher, D. (2006). Technology integration: Do they or don‟t they? A self-report survey
from PreK through 5th grade professional educations. Association for the
Advancement of Computing in Education Journal, 14(3), 207-219.

91
91
Gimbert, B., & Cristol, D. (2004). Teaching curriculum with technology: Enhancing
children‟s technological competence during early childhood. Early Childhood
Education Journal, 31, 207-216.
Grant, M. M., Ross, S. M., Wang, W., & Potter, A. (2005). Computers on wheels: An
alternative to „each one has one.‟ British Journal of Educational Technology,
36(6), 1017-1034.
Gray, L., Thomas, N., & Lewis, L. (2010). Teachers’ use of educational technology in
U.S. public schools: 2009 (NCES 2010-040). National Center for Education
Statistics, Institute of Education Sciences, U.S. Department of Education.
Washington, DC.
Harlow, A., Cowie, B., & Heazlewood, M. (2010). Keeping in touch with learning: The
use of an interactive whiteboard in the junior school. Technology, Pedagogy, and
Education, 19(2), 237-243.
Hattie, J. (2009). Visible learning: A synthesis of over 800 meta-analyses relating to
achievement. London: Routledge.
Hermans, R., Tondeur, J., van Braak, J., & Valcke, M. (2008). The impact of primary
school teachers‟ educational beliefs on the classroom use of computers.
Computers & Education, 51, 1499-1509.
Hohlfeld, T. N., Ritzhaupt, A. D., Barron, A. E., & Kemker, K. (2008). Examining the
digital divide in K-12 public schools: Four-year trends for supporting ICT
literacy in Florida. Computers & Education, 51, 1648-1663.
92
92
Huang, S. L., & Waxman, H. C. (1996). Classroom observations of middle school
students' technology use in mathematics. School Science and Mathematics, 96(1),
28-34.
Ihmeideh, F. (2009). Barriers to the use of technology in Jordanian pre-school settings.
Technology, Pedagogy and Education, 18(3), 325-341.
doi:10.1080/14759390903255619
Inan, F. A., Lowther, D. L., Ross, S. M., & Strahl, D. (2010). Pattern of classroom
activities during students‟ use if computers: Relations between instructional
strategies and computer applications. Teaching and Teacher Education, 26, 540-
546.
Judge, S., Puckett, K., & Bell, S. M. (2006). Closing the digital divide: Update from the
early childhood longitudinal study. Journal of Educational Research, 100, 52-60.
Judson, E. (2006). How teachers integrate technology and their beliefs about learning: Is
there a connection? Journal of Technology and Teacher Education, 14(3), 581-
597.
Lowther, D. L., Inan, F. A., Strahl, J. D., & Ross, S. M. (2008). Does technology
integration “work” when key barriers are removed? Educational Media
International, 45(3), 195-213.
Lowther, D. L., & Ross, S. M. (2000). Survey of computer use (SCU). Memphis, TN:
The University of Memphis, Center for Research in Educational Policy.

93
93
Lowther, D. L., & Ross, S. M. (2001). Observation of computer use (OCU) (formerly
named Survey of computer use). Memphis, TN: The University of Memphis,
Center for Research in Educational Policy.
Lowther, D. L., Ross, S. M., & Strahl, J. D. (2006). The influence of technology on
instructional practices. The International Journal of Knowledge, Culture &
Change Management, 6, 1-15.
Mama, M., & Hennessy, S. (2010). Level of technology integration by primary teachers
in Cyprus and student engagement. Technology, Pedagogy and Education, 19(2),
269-275.
Maxwell, K. L., McWilliam, R. A., Hemmeter, M. L., Ault, M. J., & Schuster, J. W.
(2001). Predictors of developmentally appropriate classroom practices in
kindergarten through third grade. Early Childhood Research Quarterly, 16, 431-
452.
McCaslin, M., Good, T. L., Nichols, S., Zhang, J., Wiley, C. R. H., Bozack, A. R., et al.
(2006). Comprehensive school reform: An observational study of teaching in
grades 3 through 5. The Elementary School Journal, 106, 313-331.
Means, B. (2010). Technology and education change: Focus on student learning. Journal
of Research on Technology in Education, 42(3), 285-307.
Miller, E. (2005). More play time. Principal, 85, 36-39.
Morgan, A. (2010). Interactive whiteboards, interactivity and play in the classroom with
children aged three to seven years. European Early Childhood Education
Research Journal, 18(1), 93-104.

94
94
National Association of the Education of Young Children (NAEYC) position statement
on technology and young children – Ages 3 through 8. (1996). Washington, DC:
NAEYC.
Padrón, Y. N., & Waxman, H. C. (1996). Improving the teaching and learning of English
language learners through instructional technology. International Journal of
Instructional Media, 23, 1-13.
Park, H. S. (2008). The impact of technology use on Hispanic students‟ mathematics
achievement within family and school contexts: Subgroup analysis between
English and non-English speaking students. Journal of Educational Computing
Research, 38, 453-468.
Plowman, L., & Stephen, C. (2005). Children, play, and computers in pre-school
education. British Journal of Educational Technology, 36(2), 145-157.
Rakes, G. C., Fields, V. S., & Cox, K. E. (2006). The influence of teachers‟ technology
use on instructional practices. Journal of Research on Technology in Education,
38(4), 409-424.
Rosen, D. B., & Jaruszewicz, C. (2009). Developmentally appropriate technology use
and early childhood teacher education. Journal of Early Childhood Teacher
Education, 30, 162-171.
Ross, S. M., & Lowther, D. L. (2003) Impacts of the Co-nect school reform design on
classroom instruction, school climate, and student achievement in inner-city
schools. Journal of Education for Students Placed At Risk, 8(2), 215-246.

95
95
Ross, S. M., & Smith, L. J. (1996). Classroom observation measure observer’s manual.
Memphis, TN: The University of Memphis, Center for Research in Educational
Policy.
Ross, S. M., Smith, L. J., & Alberg, M. (1999). The school observation measure.
Memphis, TN: Center for Research in Educational Policy, The University of
Memphis.
Ross, S. M., Smith, L. J., Lohr, L., & McNelis, M. M. (1994). Math and reading
instruction in tracked first-grade classes. The Elementary School Journal, 95,
105-109.
Ross, S. M., Troutman, A., Horgan, P., Maxwell, S., Laitinen, R., & Lowther, D. (1997).
The success of schools in implementing eight restructuring designs: A synthesis
of first-year evaluation outcomes. School Effectiveness and School Improvement,
8, 95-124.
Shapley, K. S., Sheehan, D., Maloney, C., & Caranikas-Walker, F. (2010). Evaluating
the implementation fidelity of technology immersion and its relationship with
student achievement. Journal of Technology, Learning, and Assessment, 9(4).
Retrieved July 8, 2010 from http://www.jtla.org.
Smeets, E. (2005). Does ICT contribute to powerful learning environments in primary
education? Computers & Education, 44, 343-355.
doi:10.1016/j.compedu.2004.04.003

96
96
State Educational Technology Directors Association (SETDA). (2007). Maximizing the
impact: The pivotal role of technology in a 21st century education system.
Retrieved October 2, 2010, from http://www.setda.org.
Stipek, D., & Byler, P. (2004). The early childhood classroom observation measure.
Early Childhood Research Quarterly, 19, 375-397.
U.S. Department of Education. (2001). Enhancing Education through Technology Act.
Washington, DC.
U.S. Department of Education. (2010). Transforming American education: Learning
powered by technology. Washington, DC: Office of Educational Technology.
Vannatta, R. A., & Fordham, N. (2004). Teacher dispositions as predictors of classroom
technology use. Journal of Research on Technology in Education, 36, 253-271.
Wang, F., Kinzie, M. B., McGuire, P., & Pan, E. (2010). Applying technology to
inquiry-based learning in early childhood education. Early Childhood Education
Journal, 37, 381-389. doi: 10.1007/s10643-009-0364-6
Waxman, H. C. (2003). Systematic classroom observation. In J. W. Guthrie (Ed.),
Encyclopedia of education (2nd ed, pp. 303-310). New York: Macmillan.
Waxman, H. C., & Huang, S. L. (1995). An observational study of technology
integration in urban elementary and middle schools. International Journal of
Instructional Media, 22, 329-339.
Waxman, H. C., & Huang, S. L. (1996). Classroom instruction differences by level of
technology use in middle school mathematics. Journal of Educational
Computing Research, 14(2), 147-159.

97
97
Waxman, H. C., & Huang, S. L. (1996-1997). Differences by level of technology use on
students' motivation, anxiety, and classroom learning environment in
mathematics. Journal of Educational Technology Systems, 25(1), 67-77.
Waxman, H. C., & Padrón, Y. N. (2004). The uses of the Classroom Observation
Schedule to improve classroom instruction. In H. C. Waxman, R. G. Tharp, & R.
S. Hilberg (Eds.), Observational research in U. S. classrooms: New approaches
for understanding cultural and linguistic diversity (pp. 72-96). Cambridge,
United Kingdom: Cambridge University Press.
Waxman, H. C., Padrón, Y. N., Franco-Fuenmayor, S. E., & Huang, S-Y L. (2009).
Observing classroom instruction for ELLs from student, teacher, and classroom
perspectives. Texas Association for Bilingual Education Journal, 11(1), 63-95.
Waxman, H. C., Padrón, Y. N., & García, A. (2007). Educational issues and effective
practices for Hispanic students. In S. J. Paik & H. J. Walberg (Eds.), Narrowing
the achievement gap: Strategies for educating Latino, Black, and Asian students
(pp. 131–151). New York: Springer.
Waxman, H. C., Tharp, R., & Hilberg, R. S. (Eds.). (2004). Observational research in U.
S. classrooms: New approaches for understanding cultural and linguistic
diversity. Cambridge, United Kingdom: Cambridge University Press.
Waxman, H. C., Wang, M. C., Lindvall, C. M., & Anderson, K. A. (1988). Classroom
observation schedule technical manual (Rev. Ed.). Philadelphia: Temple
University, Center for Research in Human Development and Education.

98
98
Waxman, H. C., Wang, M. C., Lindvall, C. M., & Anderson, K. A. (1990). Teacher roles
observation schedule technical manual (Rev. Ed.). Philadelphia: Temple
University, Center for Research in Human Development and Education.
Wozney, L., Venkatesh, V., & Abrami, P. C. (2006). Implementing computer
technologies: Teachers‟ perceptions and practices. Journal of Technology and
Teacher Education, 14(1), 173-207.
Wu, H.-K., & Huang, Y.-L. (2007). Ninth-grade student engagement in teacher-centered
and student-centered technology-enhanced learning environments. Science
Education doi:10.1002/sce.2021

99
99
APPENDIX A
Note: Only those items used for analysis in the current study are included in this
instrument.

100
100
APPENDIX B
Note: Only those items used for analysis in the current study are included in this
instrument.
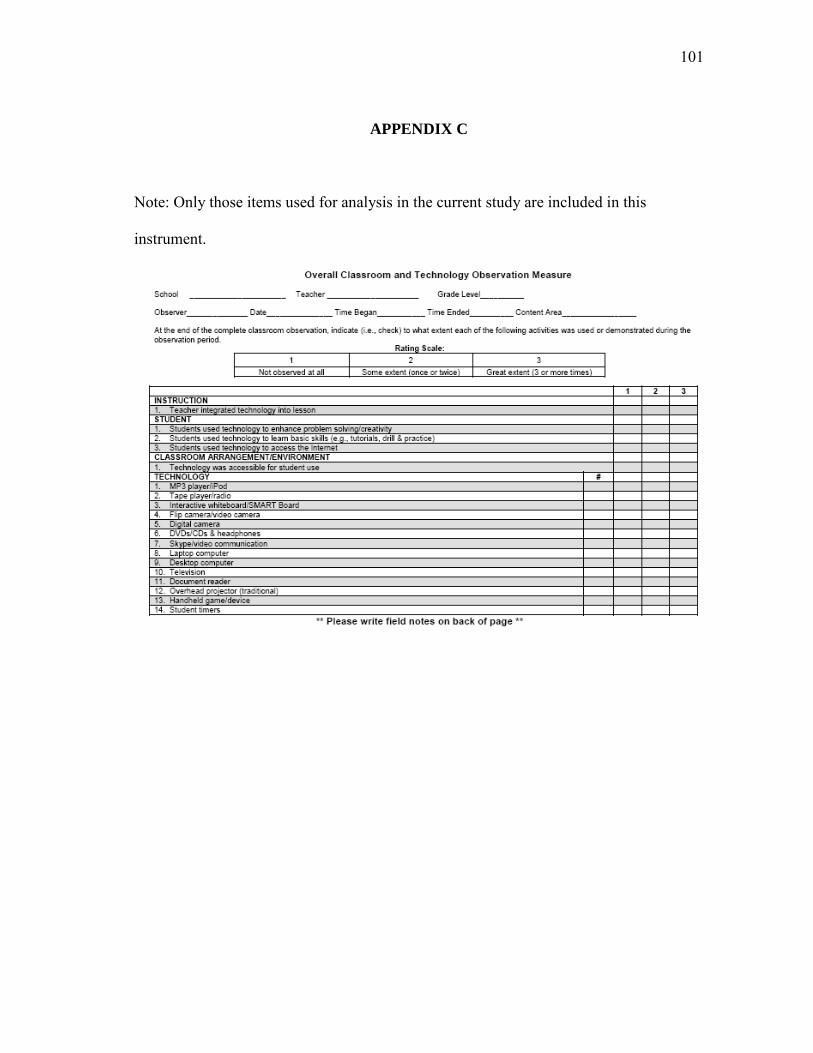
101
101
APPENDIX C
Note: Only those items used for analysis in the current study are included in this
instrument.

102
102
VITA
Name: Kayla Braziel Rollins
Address: c/o Dr. Hersh Waxman 111 Harrington Tower, 4232 TAMU College Station, TX 77843-4232 Email Address: [email protected] Education: Ph.D., Curriculum and Instruction Texas A&M University, 2011 M.Ed., Educational Administration Texas Christian University, 2005 B.S., Education Texas Christian University, 2004