Teacher Candidate Scores from Classroom Observations by ...
18
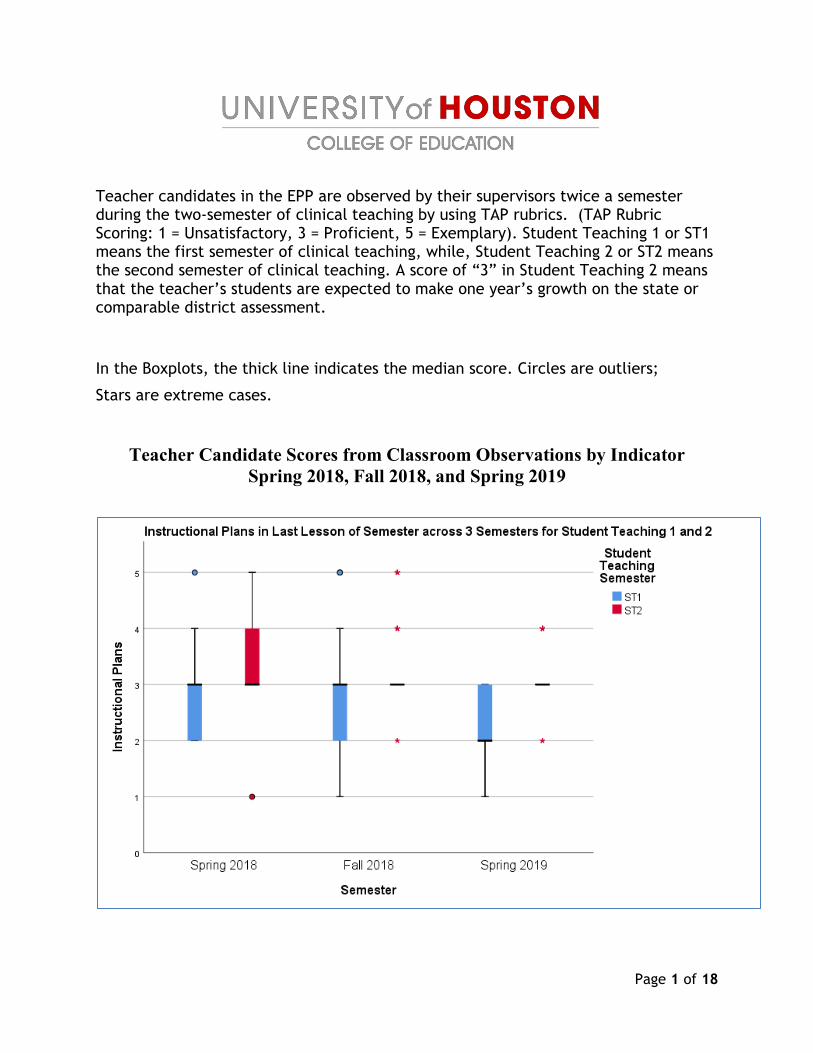
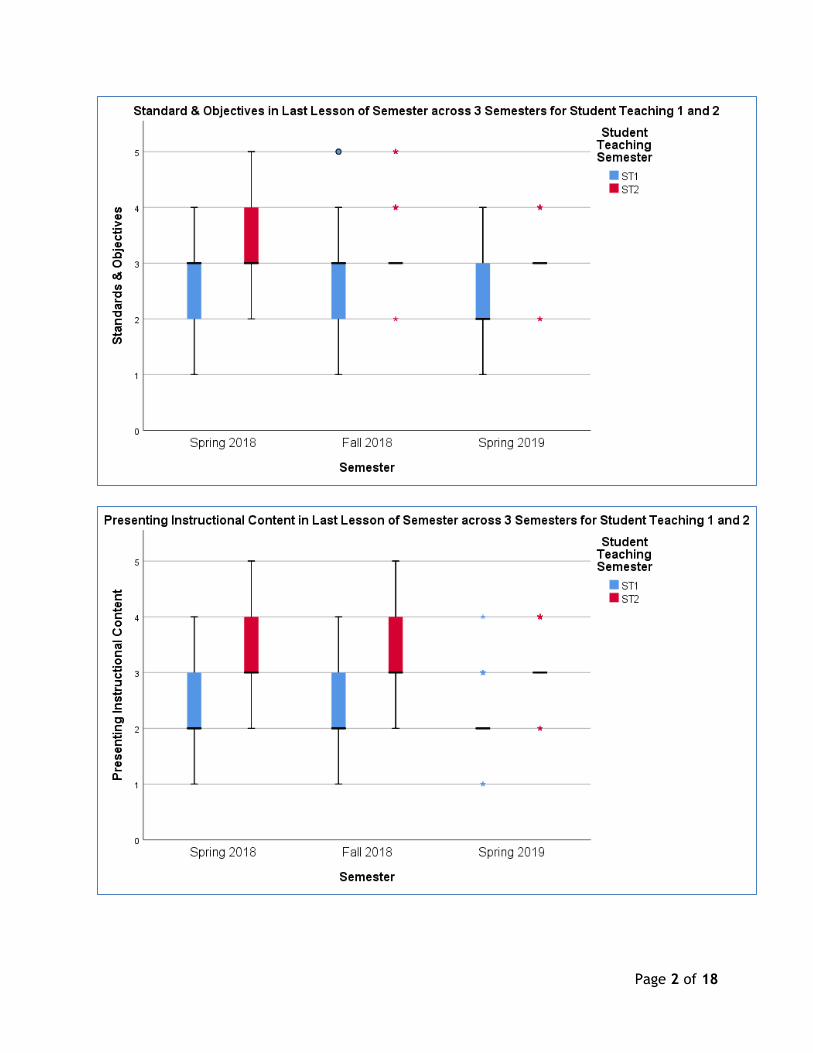
Page 1 of 18 Teacher candidates in the EPP are observed by their supervisors twice a semester during the two-semester of clinical teaching by using TAP rubrics. (TAP Rubric Scoring: 1 = Unsatisfactory, 3 = Proficient, 5 = Exemplary). Student Teaching 1 or ST1 means the first semester of clinical teaching, while, Student Teaching 2 or ST2 means the second semester of clinical teaching. A score of “3” in Student Teaching 2 means that the teacher’s students are expected to make one year’s growth on the state or comparable district assessment. In the Boxplots, the thick line indicates the median score. Circles are outliers; Stars are extreme cases. Teacher Candidate Scores from Classroom Observations by Indicator Spring 2018, Fall 2018, and Spring 2019
Transcript of Teacher Candidate Scores from Classroom Observations by ...
Page 1 of 18
Teacher candidates in the EPP are observed by their supervisors twice a semester during the two-semester of clinical teaching by using TAP rubrics. (TAP Rubric Scoring: 1 = Unsatisfactory, 3 = Proficient, 5 = Exemplary). Student Teaching 1 or ST1 means the first semester of clinical teaching, while, Student Teaching 2 or ST2 means the second semester of clinical teaching. A score of “3” in Student Teaching 2 means that the teacher’s students are expected to make one year’s growth on the state or comparable district assessment.
In the Boxplots, the thick line indicates the median score. Circles are outliers;
Stars are extreme cases.
Teacher Candidate Scores from Classroom Observations by Indicator Spring 2018, Fall 2018, and Spring 2019
Page 2 of 18
Page 3 of 18
Page 4 of 18
Page 5 of 18
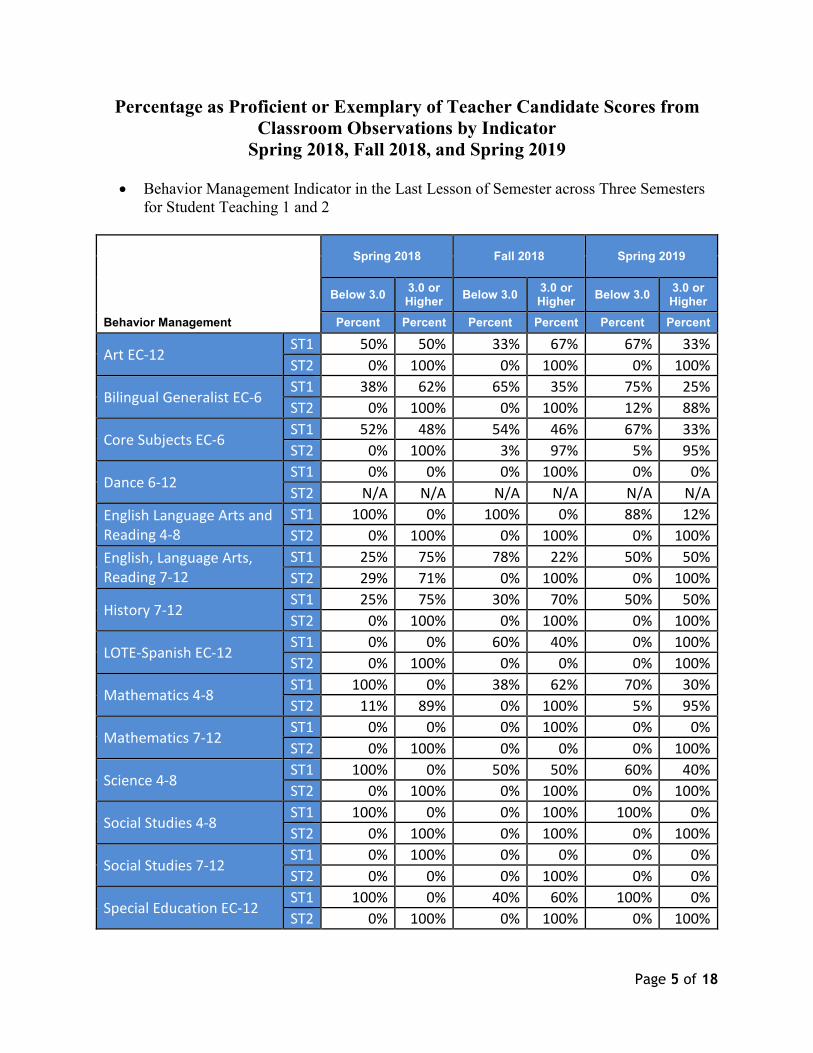
Percentage as Proficient or Exemplary of Teacher Candidate Scores from Classroom Observations by Indicator
Spring 2018, Fall 2018, and Spring 2019
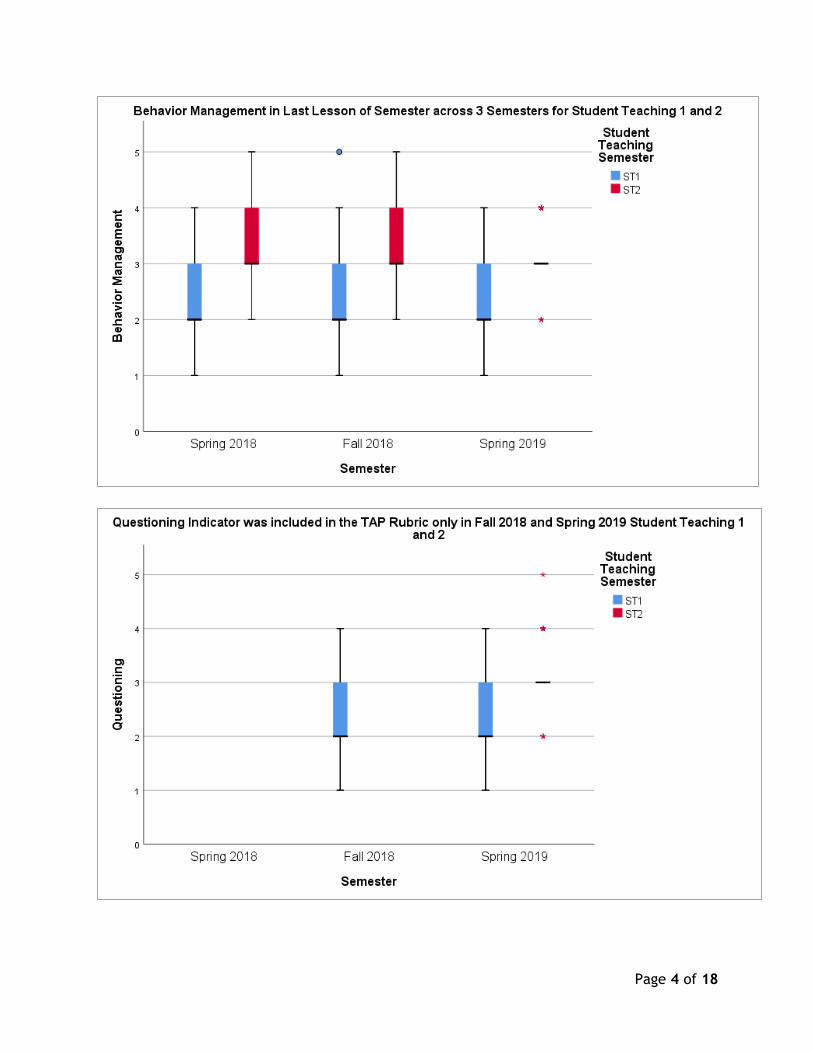
• Behavior Management Indicator in the Last Lesson of Semester across Three Semesters for Student Teaching 1 and 2
Spring 2018 Fall 2018 Spring 2019
Below 3.0 3.0 or Higher Below 3.0 3.0 or
Higher Below 3.0 3.0 or Higher
Behavior Management Percent Percent Percent Percent Percent Percent
Art EC-12 ST1 50% 50% 33% 67% 67% 33% ST2 0% 100% 0% 100% 0% 100%
Bilingual Generalist EC-6 ST1 38% 62% 65% 35% 75% 25% ST2 0% 100% 0% 100% 12% 88%
Core Subjects EC-6 ST1 52% 48% 54% 46% 67% 33% ST2 0% 100% 3% 97% 5% 95%
Dance 6-12 ST1 0% 0% 0% 100% 0% 0% ST2 N/A N/A N/A N/A N/A N/A
English Language Arts and Reading 4-8
ST1 100% 0% 100% 0% 88% 12% ST2 0% 100% 0% 100% 0% 100%
English, Language Arts, Reading 7-12
ST1 25% 75% 78% 22% 50% 50% ST2 29% 71% 0% 100% 0% 100%
History 7-12 ST1 25% 75% 30% 70% 50% 50% ST2 0% 100% 0% 100% 0% 100%
LOTE-Spanish EC-12 ST1 0% 0% 60% 40% 0% 100% ST2 0% 100% 0% 0% 0% 100%
Mathematics 4-8 ST1 100% 0% 38% 62% 70% 30% ST2 11% 89% 0% 100% 5% 95%
Mathematics 7-12 ST1 0% 0% 0% 100% 0% 0% ST2 0% 100% 0% 0% 0% 100%
Science 4-8 ST1 100% 0% 50% 50% 60% 40% ST2 0% 100% 0% 100% 0% 100%
Social Studies 4-8 ST1 100% 0% 0% 100% 100% 0% ST2 0% 100% 0% 100% 0% 100%
Social Studies 7-12 ST1 0% 100% 0% 0% 0% 0% ST2 0% 0% 0% 100% 0% 0%
Special Education EC-12 ST1 100% 0% 40% 60% 100% 0% ST2 0% 100% 0% 100% 0% 100%
Page 6 of 18
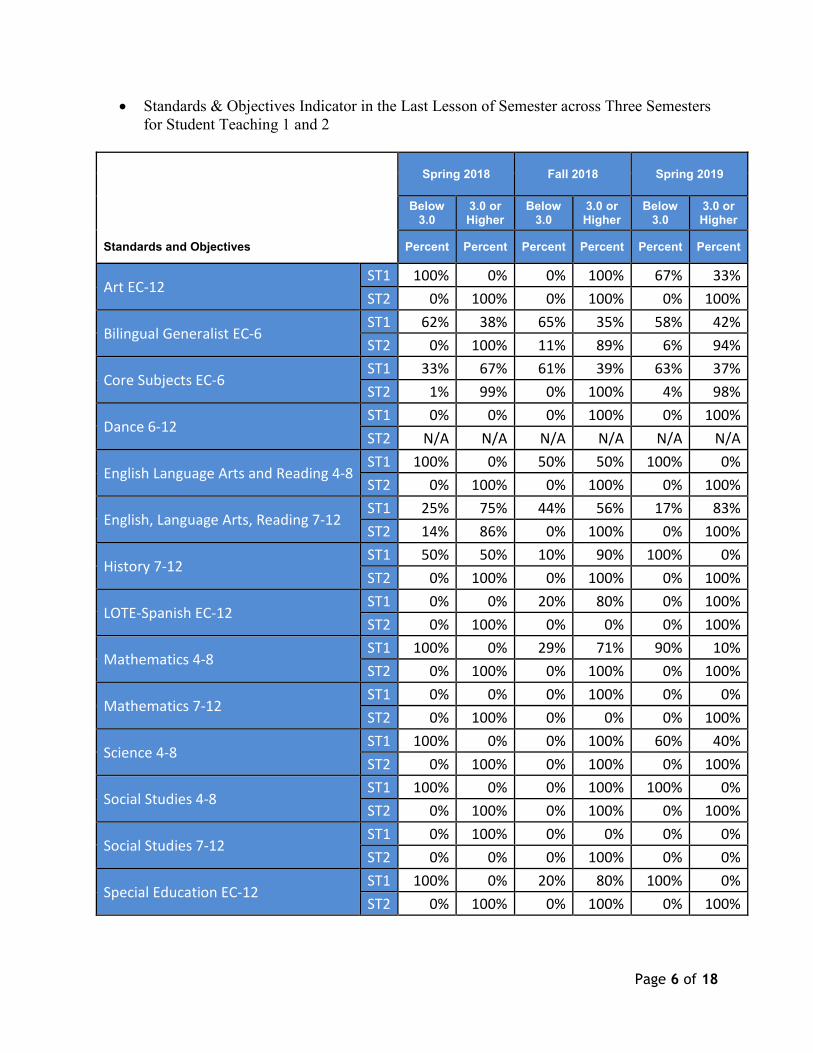
• Standards & Objectives Indicator in the Last Lesson of Semester across Three Semesters for Student Teaching 1 and 2
Spring 2018 Fall 2018 Spring 2019
Below 3.0
3.0 or Higher
Below 3.0
3.0 or Higher
Below 3.0
3.0 or Higher
Standards and Objectives Percent Percent Percent Percent Percent Percent
Art EC-12 ST1 100% 0% 0% 100% 67% 33% ST2 0% 100% 0% 100% 0% 100%
Bilingual Generalist EC-6 ST1 62% 38% 65% 35% 58% 42% ST2 0% 100% 11% 89% 6% 94%
Core Subjects EC-6 ST1 33% 67% 61% 39% 63% 37% ST2 1% 99% 0% 100% 4% 98%
Dance 6-12 ST1 0% 0% 0% 100% 0% 100% ST2 N/A N/A N/A N/A N/A N/A
English Language Arts and Reading 4-8 ST1 100% 0% 50% 50% 100% 0% ST2 0% 100% 0% 100% 0% 100%
English, Language Arts, Reading 7-12 ST1 25% 75% 44% 56% 17% 83% ST2 14% 86% 0% 100% 0% 100%
History 7-12 ST1 50% 50% 10% 90% 100% 0% ST2 0% 100% 0% 100% 0% 100%
LOTE-Spanish EC-12 ST1 0% 0% 20% 80% 0% 100% ST2 0% 100% 0% 0% 0% 100%
Mathematics 4-8 ST1 100% 0% 29% 71% 90% 10% ST2 0% 100% 0% 100% 0% 100%
Mathematics 7-12 ST1 0% 0% 0% 100% 0% 0% ST2 0% 100% 0% 0% 0% 100%
Science 4-8 ST1 100% 0% 0% 100% 60% 40% ST2 0% 100% 0% 100% 0% 100%
Social Studies 4-8 ST1 100% 0% 0% 100% 100% 0% ST2 0% 100% 0% 100% 0% 100%
Social Studies 7-12 ST1 0% 100% 0% 0% 0% 0% ST2 0% 0% 0% 100% 0% 0%
Special Education EC-12 ST1 100% 0% 20% 80% 100% 0% ST2 0% 100% 0% 100% 0% 100%
Page 7 of 18
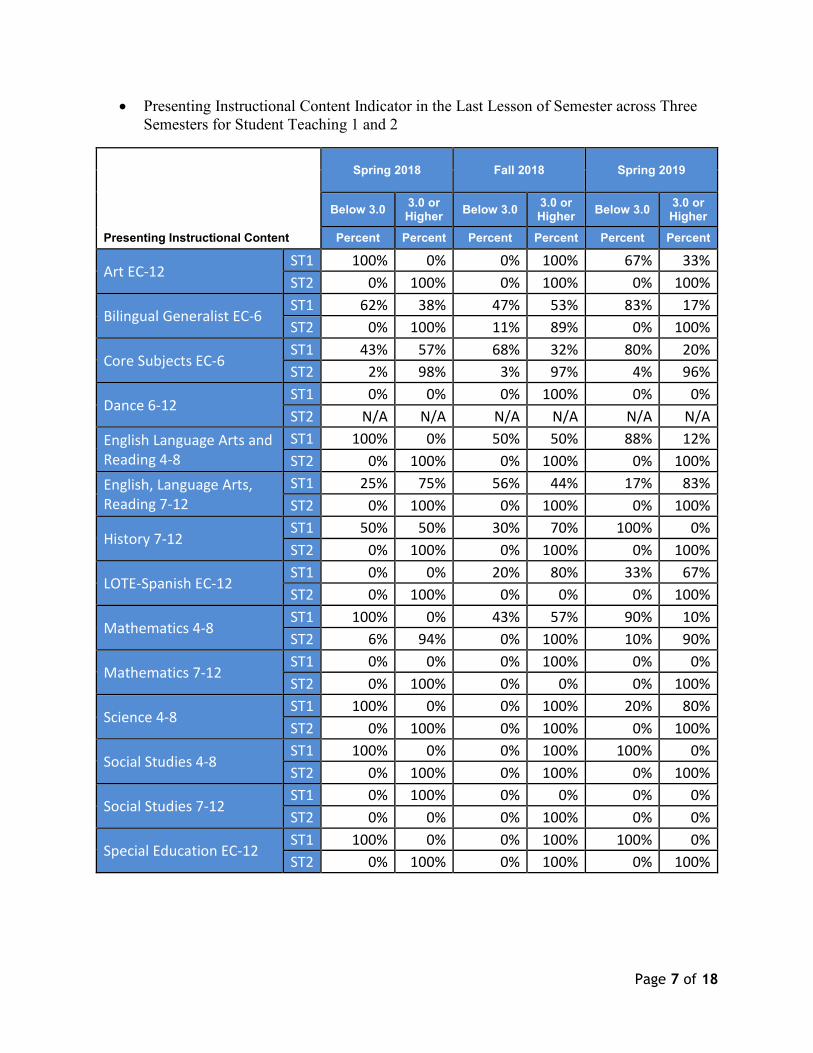
• Presenting Instructional Content Indicator in the Last Lesson of Semester across Three Semesters for Student Teaching 1 and 2
Spring 2018 Fall 2018 Spring 2019
Below 3.0 3.0 or Higher Below 3.0 3.0 or
Higher Below 3.0 3.0 or Higher
Presenting Instructional Content Percent Percent Percent Percent Percent Percent
Art EC-12 ST1 100% 0% 0% 100% 67% 33% ST2 0% 100% 0% 100% 0% 100%
Bilingual Generalist EC-6 ST1 62% 38% 47% 53% 83% 17% ST2 0% 100% 11% 89% 0% 100%
Core Subjects EC-6 ST1 43% 57% 68% 32% 80% 20% ST2 2% 98% 3% 97% 4% 96%
Dance 6-12 ST1 0% 0% 0% 100% 0% 0% ST2 N/A N/A N/A N/A N/A N/A
English Language Arts and Reading 4-8
ST1 100% 0% 50% 50% 88% 12% ST2 0% 100% 0% 100% 0% 100%
English, Language Arts, Reading 7-12
ST1 25% 75% 56% 44% 17% 83% ST2 0% 100% 0% 100% 0% 100%
History 7-12 ST1 50% 50% 30% 70% 100% 0% ST2 0% 100% 0% 100% 0% 100%
LOTE-Spanish EC-12 ST1 0% 0% 20% 80% 33% 67% ST2 0% 100% 0% 0% 0% 100%
Mathematics 4-8 ST1 100% 0% 43% 57% 90% 10% ST2 6% 94% 0% 100% 10% 90%
Mathematics 7-12 ST1 0% 0% 0% 100% 0% 0% ST2 0% 100% 0% 0% 0% 100%
Science 4-8 ST1 100% 0% 0% 100% 20% 80% ST2 0% 100% 0% 100% 0% 100%
Social Studies 4-8 ST1 100% 0% 0% 100% 100% 0% ST2 0% 100% 0% 100% 0% 100%
Social Studies 7-12 ST1 0% 100% 0% 0% 0% 0% ST2 0% 0% 0% 100% 0% 0%
Special Education EC-12 ST1 100% 0% 0% 100% 100% 0% ST2 0% 100% 0% 100% 0% 100%
Page 8 of 18
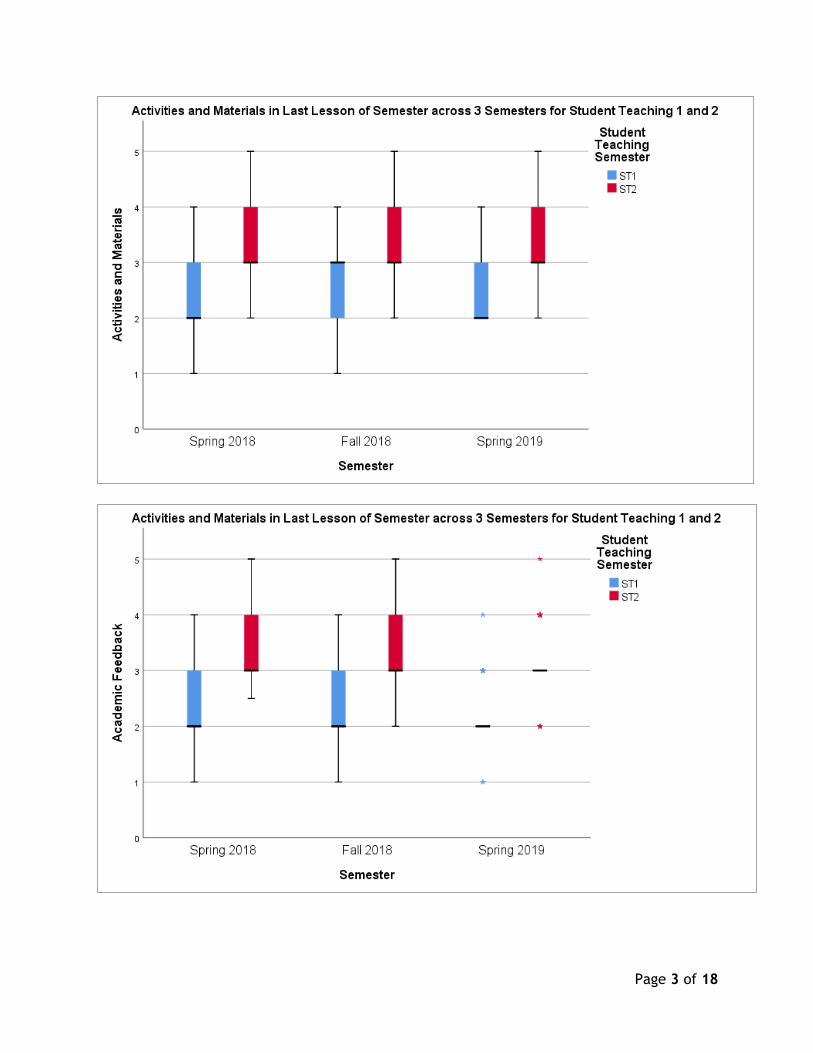
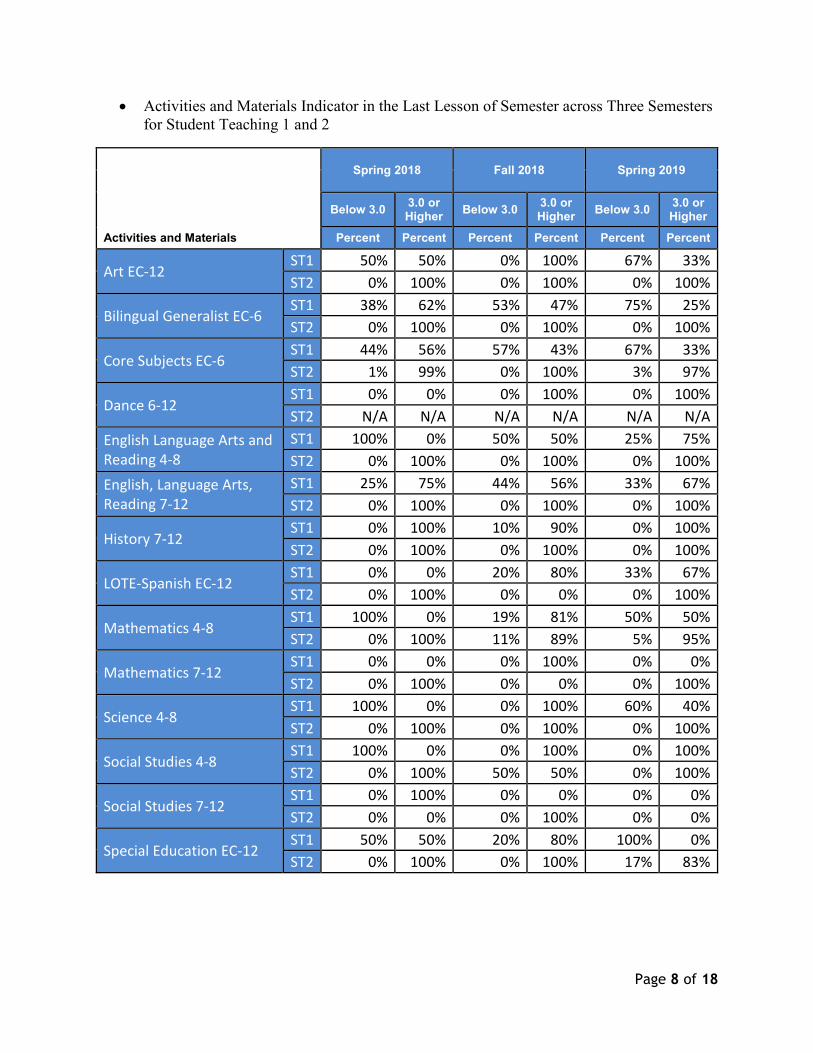
• Activities and Materials Indicator in the Last Lesson of Semester across Three Semesters for Student Teaching 1 and 2
Spring 2018 Fall 2018 Spring 2019
Below 3.0 3.0 or Higher Below 3.0 3.0 or
Higher Below 3.0 3.0 or Higher
Activities and Materials Percent Percent Percent Percent Percent Percent
Art EC-12 ST1 50% 50% 0% 100% 67% 33% ST2 0% 100% 0% 100% 0% 100%
Bilingual Generalist EC-6 ST1 38% 62% 53% 47% 75% 25% ST2 0% 100% 0% 100% 0% 100%
Core Subjects EC-6 ST1 44% 56% 57% 43% 67% 33% ST2 1% 99% 0% 100% 3% 97%
Dance 6-12 ST1 0% 0% 0% 100% 0% 100% ST2 N/A N/A N/A N/A N/A N/A
English Language Arts and Reading 4-8
ST1 100% 0% 50% 50% 25% 75% ST2 0% 100% 0% 100% 0% 100%
English, Language Arts, Reading 7-12
ST1 25% 75% 44% 56% 33% 67% ST2 0% 100% 0% 100% 0% 100%
History 7-12 ST1 0% 100% 10% 90% 0% 100% ST2 0% 100% 0% 100% 0% 100%
LOTE-Spanish EC-12 ST1 0% 0% 20% 80% 33% 67% ST2 0% 100% 0% 0% 0% 100%
Mathematics 4-8 ST1 100% 0% 19% 81% 50% 50% ST2 0% 100% 11% 89% 5% 95%
Mathematics 7-12 ST1 0% 0% 0% 100% 0% 0% ST2 0% 100% 0% 0% 0% 100%
Science 4-8 ST1 100% 0% 0% 100% 60% 40% ST2 0% 100% 0% 100% 0% 100%
Social Studies 4-8 ST1 100% 0% 0% 100% 0% 100% ST2 0% 100% 50% 50% 0% 100%
Social Studies 7-12 ST1 0% 100% 0% 0% 0% 0% ST2 0% 0% 0% 100% 0% 0%
Special Education EC-12 ST1 50% 50% 20% 80% 100% 0% ST2 0% 100% 0% 100% 17% 83%
Page 9 of 18
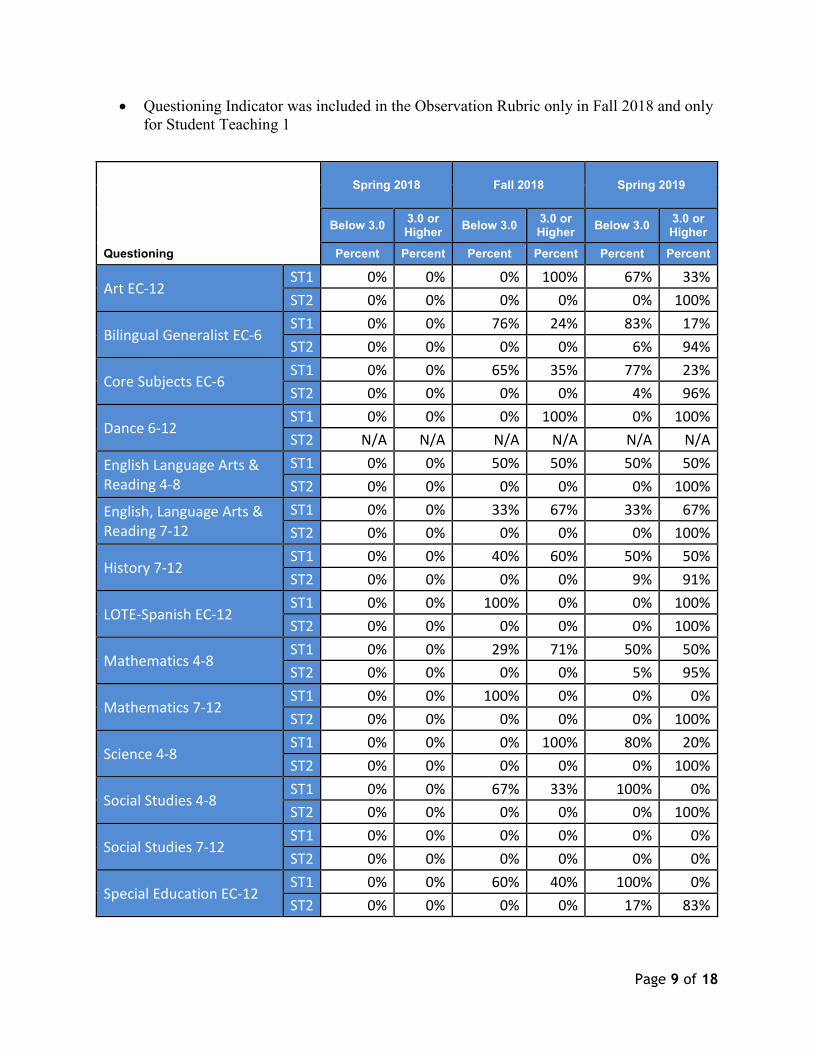
• Questioning Indicator was included in the Observation Rubric only in Fall 2018 and only for Student Teaching 1
Spring 2018 Fall 2018 Spring 2019
Below 3.0 3.0 or Higher Below 3.0 3.0 or
Higher Below 3.0 3.0 or Higher
Questioning Percent Percent Percent Percent Percent Percent
Art EC-12 ST1 0% 0% 0% 100% 67% 33% ST2 0% 0% 0% 0% 0% 100%
Bilingual Generalist EC-6 ST1 0% 0% 76% 24% 83% 17% ST2 0% 0% 0% 0% 6% 94%
Core Subjects EC-6 ST1 0% 0% 65% 35% 77% 23% ST2 0% 0% 0% 0% 4% 96%
Dance 6-12 ST1 0% 0% 0% 100% 0% 100% ST2 N/A N/A N/A N/A N/A N/A
English Language Arts & Reading 4-8
ST1 0% 0% 50% 50% 50% 50% ST2 0% 0% 0% 0% 0% 100%
English, Language Arts & Reading 7-12
ST1 0% 0% 33% 67% 33% 67% ST2 0% 0% 0% 0% 0% 100%
History 7-12 ST1 0% 0% 40% 60% 50% 50% ST2 0% 0% 0% 0% 9% 91%
LOTE-Spanish EC-12 ST1 0% 0% 100% 0% 0% 100% ST2 0% 0% 0% 0% 0% 100%
Mathematics 4-8 ST1 0% 0% 29% 71% 50% 50% ST2 0% 0% 0% 0% 5% 95%
Mathematics 7-12 ST1 0% 0% 100% 0% 0% 0% ST2 0% 0% 0% 0% 0% 100%
Science 4-8 ST1 0% 0% 0% 100% 80% 20% ST2 0% 0% 0% 0% 0% 100%
Social Studies 4-8 ST1 0% 0% 67% 33% 100% 0% ST2 0% 0% 0% 0% 0% 100%
Social Studies 7-12 ST1 0% 0% 0% 0% 0% 0% ST2 0% 0% 0% 0% 0% 0%
Special Education EC-12 ST1 0% 0% 60% 40% 100% 0% ST2 0% 0% 0% 0% 17% 83%
Page 10 of 18
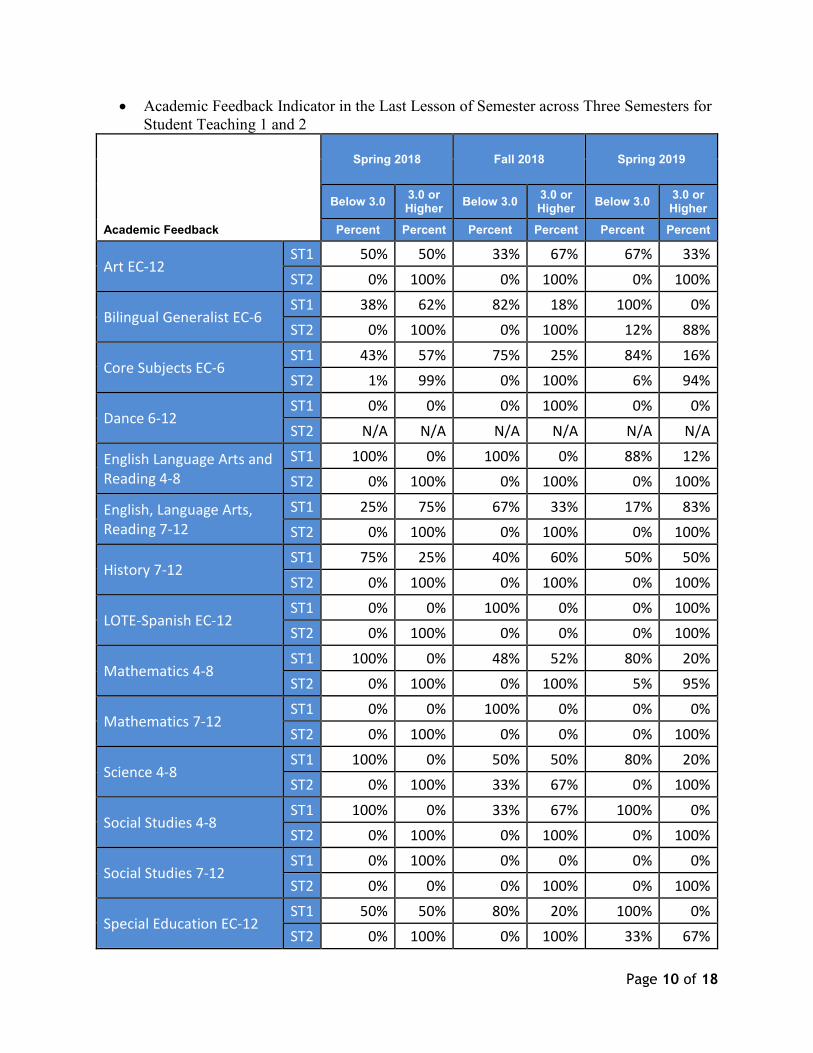
• Academic Feedback Indicator in the Last Lesson of Semester across Three Semesters for Student Teaching 1 and 2
Spring 2018 Fall 2018 Spring 2019
Below 3.0 3.0 or Higher Below 3.0 3.0 or
Higher Below 3.0 3.0 or Higher
Academic Feedback Percent Percent Percent Percent Percent Percent
Art EC-12 ST1 50% 50% 33% 67% 67% 33%
ST2 0% 100% 0% 100% 0% 100%
Bilingual Generalist EC-6 ST1 38% 62% 82% 18% 100% 0%
ST2 0% 100% 0% 100% 12% 88%
Core Subjects EC-6 ST1 43% 57% 75% 25% 84% 16% ST2 1% 99% 0% 100% 6% 94%
Dance 6-12 ST1 0% 0% 0% 100% 0% 0%
ST2 N/A N/A N/A N/A N/A N/A
English Language Arts and Reading 4-8
ST1 100% 0% 100% 0% 88% 12% ST2 0% 100% 0% 100% 0% 100%
English, Language Arts, Reading 7-12
ST1 25% 75% 67% 33% 17% 83%
ST2 0% 100% 0% 100% 0% 100%
History 7-12 ST1 75% 25% 40% 60% 50% 50%
ST2 0% 100% 0% 100% 0% 100%
LOTE-Spanish EC-12 ST1 0% 0% 100% 0% 0% 100% ST2 0% 100% 0% 0% 0% 100%
Mathematics 4-8 ST1 100% 0% 48% 52% 80% 20%
ST2 0% 100% 0% 100% 5% 95%
Mathematics 7-12 ST1 0% 0% 100% 0% 0% 0%
ST2 0% 100% 0% 0% 0% 100%
Science 4-8 ST1 100% 0% 50% 50% 80% 20%
ST2 0% 100% 33% 67% 0% 100%
Social Studies 4-8 ST1 100% 0% 33% 67% 100% 0% ST2 0% 100% 0% 100% 0% 100%
Social Studies 7-12 ST1 0% 100% 0% 0% 0% 0%
ST2 0% 0% 0% 100% 0% 100%
Special Education EC-12 ST1 50% 50% 80% 20% 100% 0%
ST2 0% 100% 0% 100% 33% 67%
Page 11 of 18
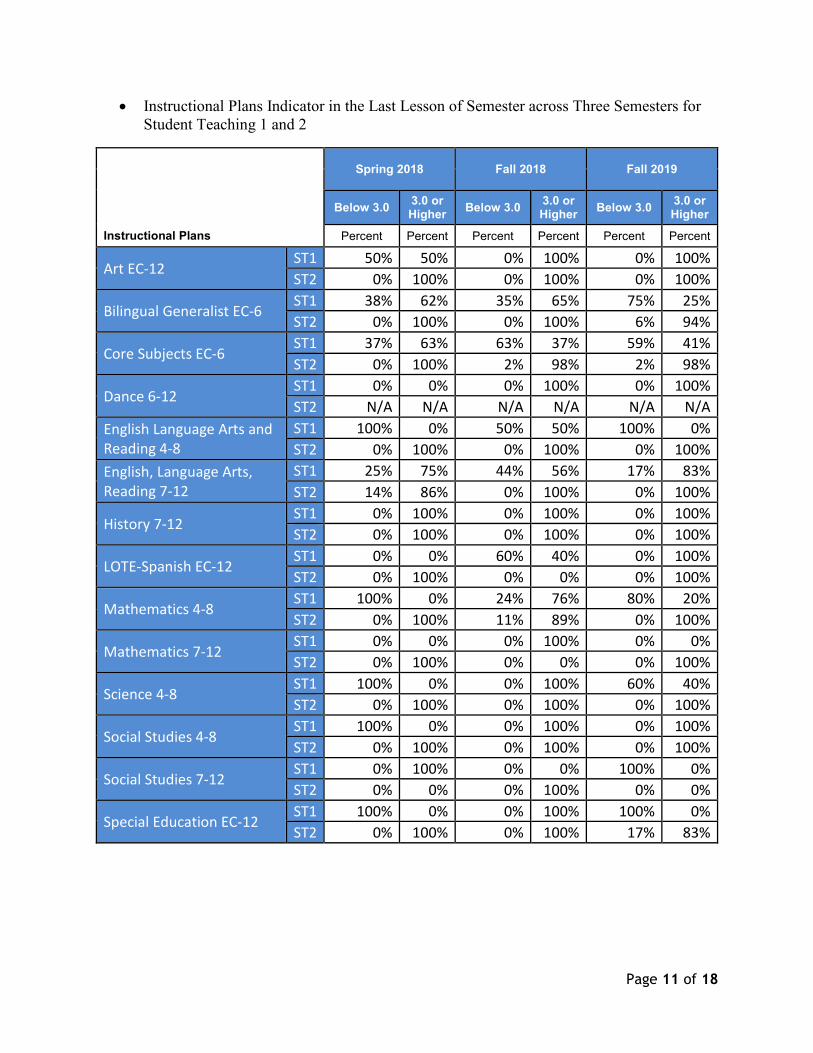
• Instructional Plans Indicator in the Last Lesson of Semester across Three Semesters for Student Teaching 1 and 2
Spring 2018 Fall 2018 Fall 2019
Below 3.0 3.0 or Higher Below 3.0 3.0 or
Higher Below 3.0 3.0 or Higher
Instructional Plans Percent Percent Percent Percent Percent Percent
Art EC-12 ST1 50% 50% 0% 100% 0% 100% ST2 0% 100% 0% 100% 0% 100%
Bilingual Generalist EC-6 ST1 38% 62% 35% 65% 75% 25% ST2 0% 100% 0% 100% 6% 94%
Core Subjects EC-6 ST1 37% 63% 63% 37% 59% 41% ST2 0% 100% 2% 98% 2% 98%
Dance 6-12 ST1 0% 0% 0% 100% 0% 100% ST2 N/A N/A N/A N/A N/A N/A
English Language Arts and Reading 4-8
ST1 100% 0% 50% 50% 100% 0% ST2 0% 100% 0% 100% 0% 100%
English, Language Arts, Reading 7-12
ST1 25% 75% 44% 56% 17% 83% ST2 14% 86% 0% 100% 0% 100%
History 7-12 ST1 0% 100% 0% 100% 0% 100% ST2 0% 100% 0% 100% 0% 100%
LOTE-Spanish EC-12 ST1 0% 0% 60% 40% 0% 100% ST2 0% 100% 0% 0% 0% 100%
Mathematics 4-8 ST1 100% 0% 24% 76% 80% 20% ST2 0% 100% 11% 89% 0% 100%
Mathematics 7-12 ST1 0% 0% 0% 100% 0% 0% ST2 0% 100% 0% 0% 0% 100%
Science 4-8 ST1 100% 0% 0% 100% 60% 40% ST2 0% 100% 0% 100% 0% 100%
Social Studies 4-8 ST1 100% 0% 0% 100% 0% 100% ST2 0% 100% 0% 100% 0% 100%
Social Studies 7-12 ST1 0% 100% 0% 0% 100% 0% ST2 0% 0% 0% 100% 0% 0%
Special Education EC-12 ST1 100% 0% 0% 100% 100% 0% ST2 0% 100% 0% 100% 17% 83%
Page 12 of 18
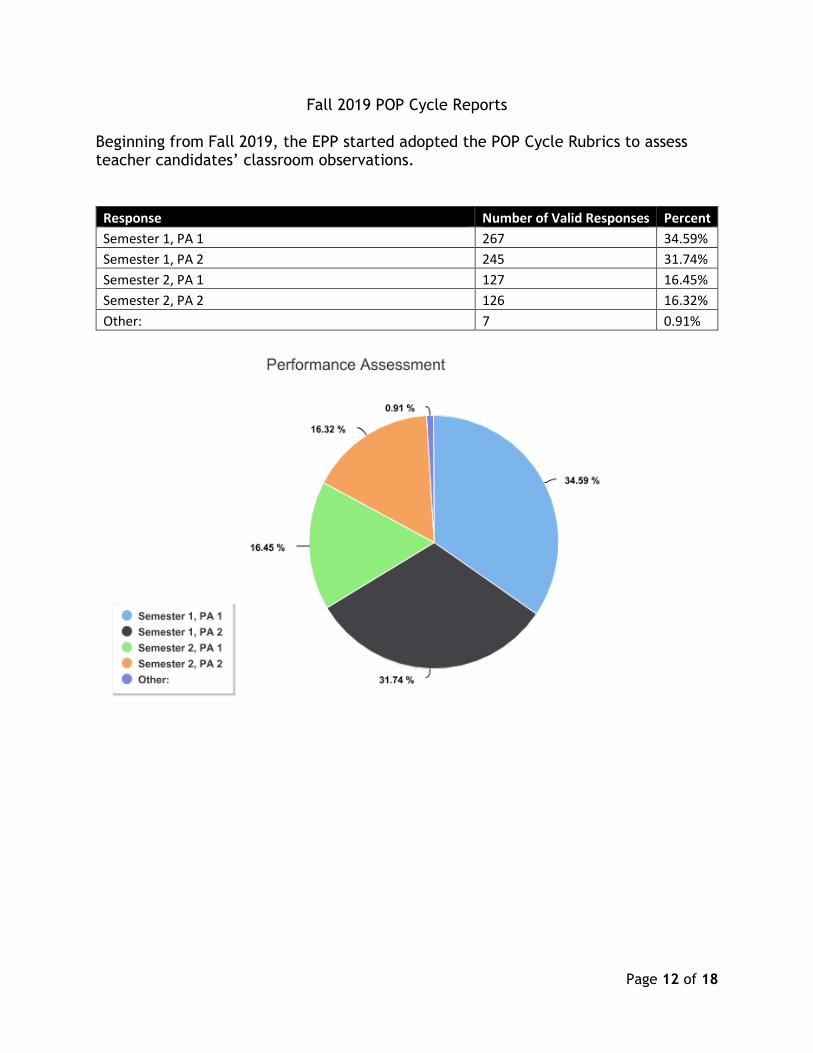
Fall 2019 POP Cycle Reports
Beginning from Fall 2019, the EPP started adopted the POP Cycle Rubrics to assess teacher candidates’ classroom observations.
Response Number of Valid Responses Percent Semester 1, PA 1 267 34.59% Semester 1, PA 2 245 31.74% Semester 2, PA 1 127 16.45% Semester 2, PA 2 126 16.32% Other: 7 0.91%
Page 13 of 18
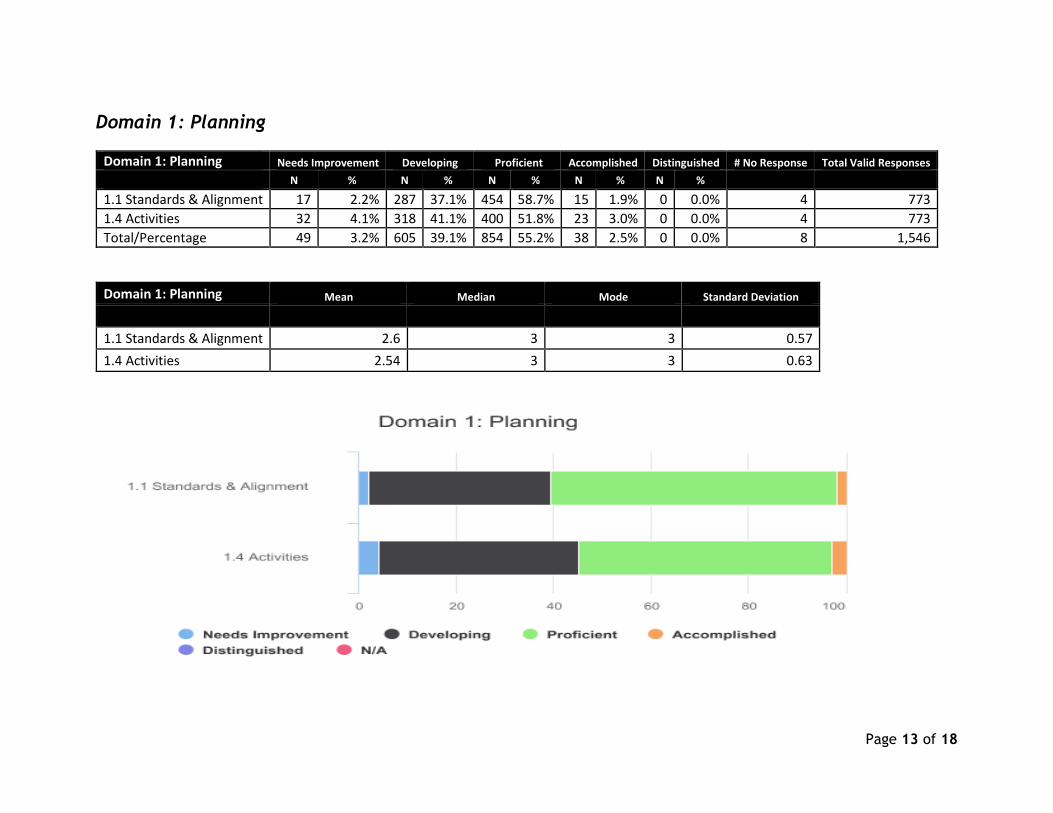
Domain 1: Planning
Domain 1: Planning Needs Improvement Developing Proficient Accomplished Distinguished # No Response Total Valid Responses N % N % N % N % N %
1.1 Standards & Alignment 17 2.2% 287 37.1% 454 58.7% 15 1.9% 0 0.0% 4 773 1.4 Activities 32 4.1% 318 41.1% 400 51.8% 23 3.0% 0 0.0% 4 773 Total/Percentage 49 3.2% 605 39.1% 854 55.2% 38 2.5% 0 0.0% 8 1,546
Domain 1: Planning Mean Median Mode Standard Deviation
1.1 Standards & Alignment 2.6 3 3 0.57 1.4 Activities 2.54 3 3 0.63
Page 14 of 18
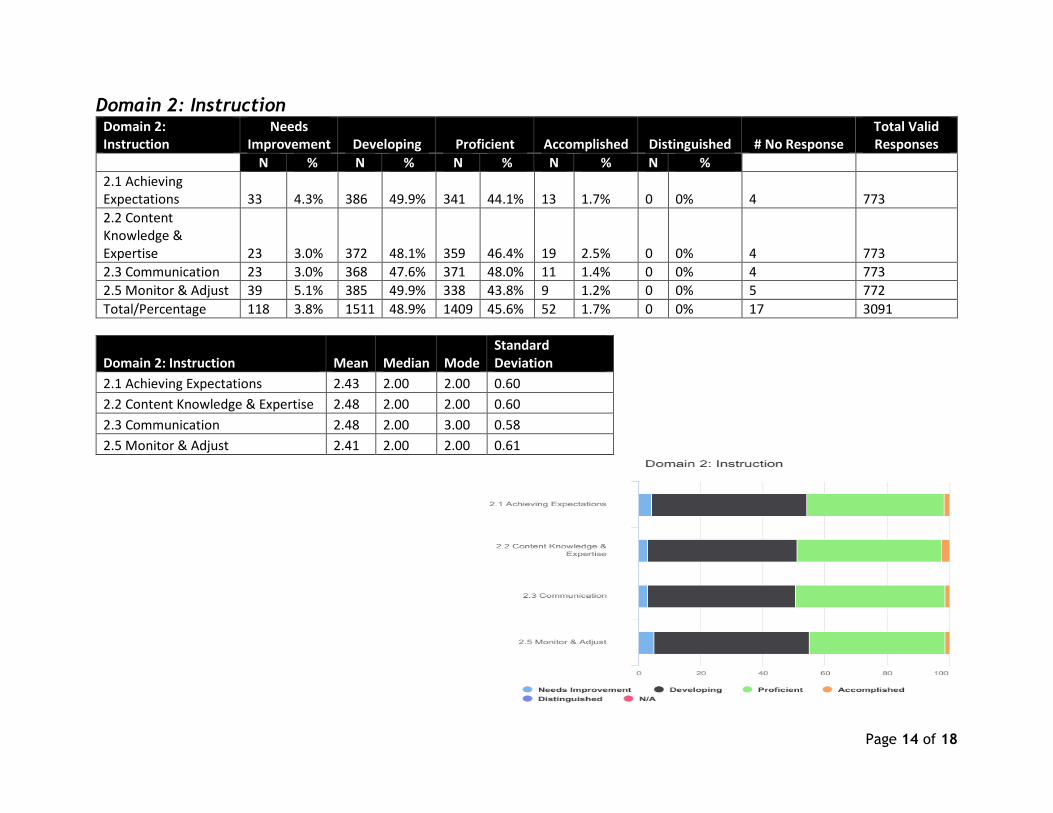
Domain 2: Instruction Domain 2: Instruction
Needs Improvement Developing Proficient Accomplished Distinguished # No Response
Total Valid Responses
N % N % N % N % N % 2.1 Achieving Expectations 33 4.3% 386 49.9% 341 44.1% 13 1.7% 0 0% 4 773 2.2 Content Knowledge & Expertise 23 3.0% 372 48.1% 359 46.4% 19 2.5% 0 0% 4 773 2.3 Communication 23 3.0% 368 47.6% 371 48.0% 11 1.4% 0 0% 4 773 2.5 Monitor & Adjust 39 5.1% 385 49.9% 338 43.8% 9 1.2% 0 0% 5 772 Total/Percentage 118 3.8% 1511 48.9% 1409 45.6% 52 1.7% 0 0% 17 3091
Domain 2: Instruction Mean Median Mode Standard Deviation
2.1 Achieving Expectations 2.43 2.00 2.00 0.60 2.2 Content Knowledge & Expertise 2.48 2.00 2.00 0.60 2.3 Communication 2.48 2.00 3.00 0.58 2.5 Monitor & Adjust 2.41 2.00 2.00 0.61
Page 15 of 18
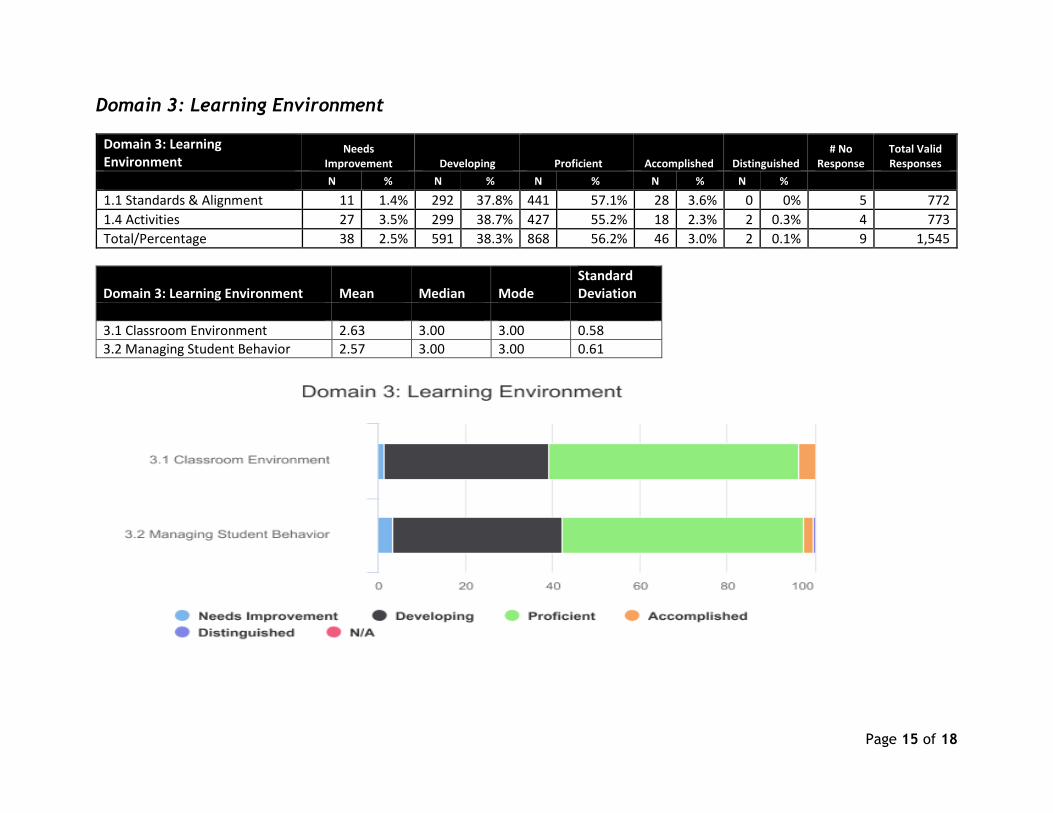
Domain 3: Learning Environment
Domain 3: Learning Environment
Needs Improvement Developing Proficient Accomplished Distinguished
# No Response
Total Valid Responses
N % N % N % N % N %
1.1 Standards & Alignment 11 1.4% 292 37.8% 441 57.1% 28 3.6% 0 0% 5 772 1.4 Activities 27 3.5% 299 38.7% 427 55.2% 18 2.3% 2 0.3% 4 773 Total/Percentage 38 2.5% 591 38.3% 868 56.2% 46 3.0% 2 0.1% 9 1,545
Domain 3: Learning Environment Mean Median Mode Standard Deviation
3.1 Classroom Environment 2.63 3.00 3.00 0.58 3.2 Managing Student Behavior 2.57 3.00 3.00 0.61

Page 16 of 18
Domain 4: Professional Practices & Responsibilities Domain 4: Professional Practices & Responsibilities
Needs Improvement Developing Proficient Accomplished Distinguished
# No Response
Total Valid Responses
N % N % N % N % N %
4.2 Reflection 12 1.6% 206 26.9% 527 68.8% 21 2.7% 0 0% 11 766 Total/Percentage 12 1.6% 206 26.9% 527 68.8% 21 2.7% 0 0% 11 766
Domain 4: Professional Practices & Responsibilities Mean Median Mode
Standard Deviation
4.2 Reflection 2.73 3.00 3.00 0.53
Page 17 of 18
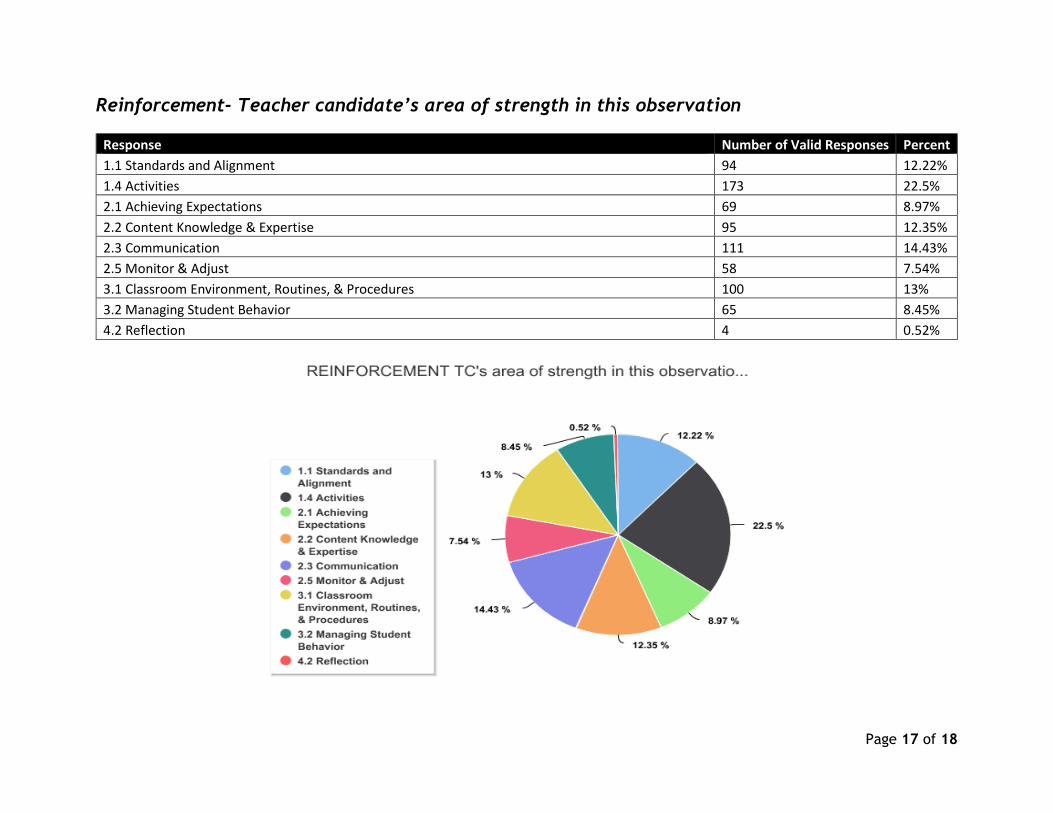
Reinforcement- Teacher candidate’s area of strength in this observation
Response Number of Valid Responses Percent 1.1 Standards and Alignment 94 12.22% 1.4 Activities 173 22.5% 2.1 Achieving Expectations 69 8.97% 2.2 Content Knowledge & Expertise 95 12.35% 2.3 Communication 111 14.43% 2.5 Monitor & Adjust 58 7.54% 3.1 Classroom Environment, Routines, & Procedures 100 13% 3.2 Managing Student Behavior 65 8.45% 4.2 Reflection 4 0.52%
Page 18 of 18
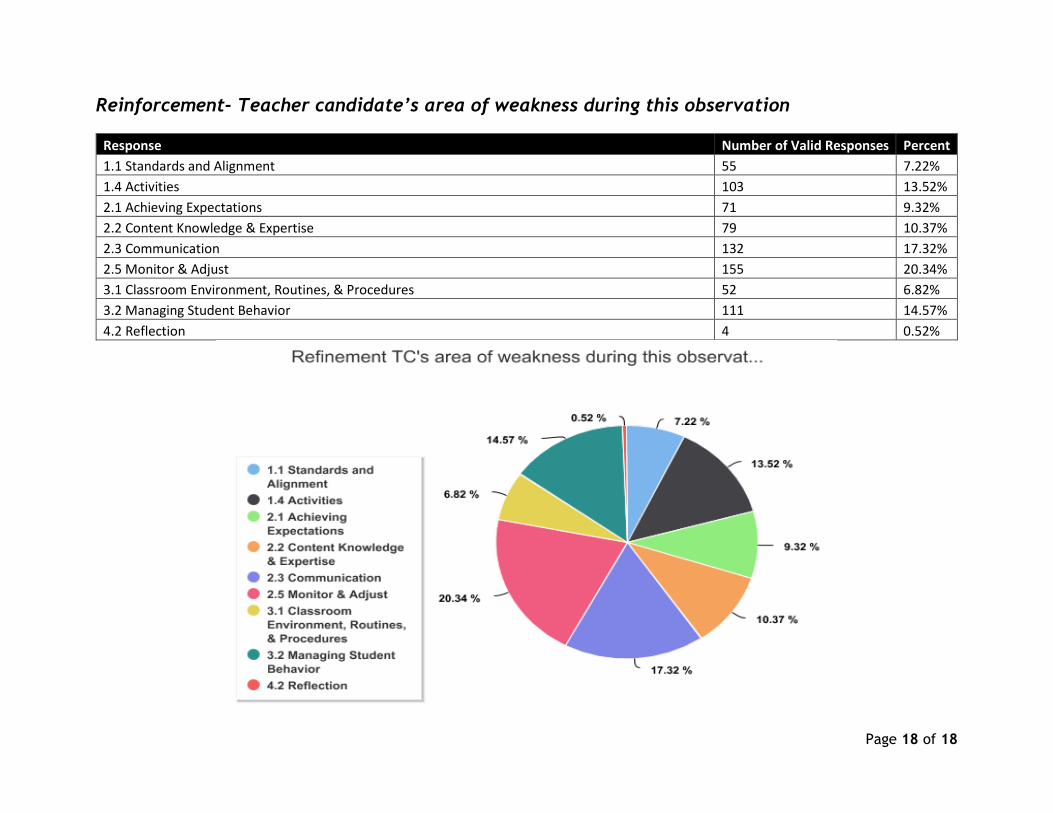
Reinforcement- Teacher candidate’s area of weakness during this observation
Response Number of Valid Responses Percent 1.1 Standards and Alignment 55 7.22% 1.4 Activities 103 13.52% 2.1 Achieving Expectations 71 9.32% 2.2 Content Knowledge & Expertise 79 10.37% 2.3 Communication 132 17.32% 2.5 Monitor & Adjust 155 20.34% 3.1 Classroom Environment, Routines, & Procedures 52 6.82% 3.2 Managing Student Behavior 111 14.57% 4.2 Reflection 4 0.52%