Classification of Physiological Correlates of Emotions · Classification of Physiological...
68
CZECH TECHNICAL UNIVERSITY IN PRAGUE Faculty of Electrical Engineering Department of Circuit Theory Prague 2014 Classification of Physiological Correlates of Emotions Klasifikace fyziologických korelátů emocí Diploma Thesis Study Programme: Biomedical Engineering and Informatics Branch of study: Biomedical Engineering Thesis advisor: Ing. Radoslav Bortel, Ph.D. Bc. Petra Henychová
Transcript of Classification of Physiological Correlates of Emotions · Classification of Physiological...
CZECH TECHNICAL UNIVERSITY IN PRAGUE
Faculty of Electrical Engineering
Department of Circuit Theory
Prague 2014
Classification of Physiological Correlates of Emotions
Klasifikace fyziologických korelátů emocí
Diploma Thesis
Study Programme: Biomedical Engineering and Informatics
Branch of study: Biomedical Engineering
Thesis advisor: Ing. Radoslav Bortel, Ph.D.
Bc. Petra Henychová
Czech Technical University in Prague Faculty of Electrical Engineering
Department of Circuit Theory
DIPLOMA THESIS ASSIGNMENT
Student: Bc. Petra H e n y c h o v á
Study programme: Biomedical Engineering and Informatics
Specialisation: Biomedical Engineering
Title of Diploma Thesis: Classification of Physiological Correlates of Emotions
Guidelines:
1. Assess the possibilities for the detection of the physiological correlates of emotions. 2. Choose from available physiological signals (EEG, ECG, GSR) those which allow classification of emotions of measured subjects. 3. Suggest a preprocessing algorithm of the selected physiological signals. 4. Design an algorithm for the classification of the physiological correlates of emotions in the selected physiological signals. 5. Implement the suggested algorithm in the MATLAB environment and verify this algorithm on real records of physiological signals.
Bibliography/Sources: [1] Andreassi, L.: Psychophysiology: Human Behavior and Physiological Response. 4th Edition, Lawrence Erlabaum Associates, 2000. [2] Duda, R.O.; Hart, P.E.; Stork, D.G.: Pattern Classification. 2nd Edition, Wiley, 2000. [3] Sovka, P.; Uhlíř, J.: Číslicové zpracování signálů. Vydavatelství ČVUT, Praha, 2002.
Diploma Thesis Supervisor: Ing. Radoslav Bortel, Ph.D.
Valid until: the end of the summer semester of academic year 2014/2015
L.S.
prof. Ing. Pavel Sovka, CSc. Head of Department
prof. Ing. Pavel Ripka, CSc.Dean
Prague, January 10, 2014
České vysoké učení technické v Praze Fakulta elektrotechnická
Katedra teorie obvodů
ZADÁNÍ DIPLOMOVÉ PRÁCE
Student: Bc. Petra H e n y c h o v á
Studijní program: Biomedicínské inženýrství a informatika (magisterský)
Obor: Biomedicínské inženýrství
Název tématu: Klasifikace fyziologických korelátů emocí
Pokyny pro vypracování:
1. Posuďte možnosti detekce fyziologických korelátů emocí. 2. Z dostupných fyziologických signálů (EEG, EKG, GSR) vyberte takové, které umožní klasifikaci emocí měřených subjektů. 3. Navrhněte algoritmus předzpracování vybraných fyziologických signálů. 4. Navrhněte algoritmus pro klasifikaci fyziologických korelátů emocí ve vybraných fyziologických signálech. 5. Výsledný algoritmus implementujte v prostředí MATLAB a ověřte na reálných záznamech fyziologických signálů. Seznam odborné literatury:
[1] Andreassi, L.: Psychophysiology: Human Behavior and Physiological Response, 4th Edition, Lawrence Erlabaum Associates, 2000. [2] Duda, R.O., Hart, P.E., Stork, D.G.: Pattern Classification, 2nd Edition, Wiley, 2000. [3] Sovka, P. , Uhlíř, J.: Číslicové zpracování signálů, Vydavatelství ČVUT, Praha, 2002.
Vedoucí diplomové práce: Ing. Radoslav Bortel, Ph.D.
Platnost zadání: do konce letního semestru 2014/2015
L.S.
prof. Ing. Pavel Sovka, CSc.
vedoucí katedry
prof. Ing. Pavel Ripka, CSc.
děkan
V Praze dne 10. 1. 2014
Annotation
The aim of this work is to design the algorithm for classification of the emotions based
on the frontal brain asymmetry evoked by the short film clips. The algorithm is based on the
differences in the frontal brain asymmetry evoked by the positive and negative stimuli. First,
the pre-processing of EEG signal is described; the technical artefacts are eliminated and
biological artefacts caused by movement and blinking are detected. Three different reference
electrode approaches are used (forehead electrode, Cz electrode and Laplacian operator).
Then, the power in the alpha band is computed. The power normalization is made using the
power of the resting EEG or using the weighted average of the power of all film clips. The
difference of the powers is computed for symmetric electrodes in the left and right frontal
area. The algorithm is tested using a head model simulation and then applied on the real data
obtained during presentation of short film clips from 10 reactive subjects. For statistical
evaluation of the asymmetry Monte Carlo method was used. The frontal brain asymmetry was
not found in response to the film clip stimuli. This is probably caused by the selection of
subjects or stimuli which was not based upon any research.
Key words
Emotions, Frontal brain asymmetry, EEG, Physiological correlates of emotions.
Anotace
Cílem práce bylo navrhnout algoritmus klasifikující emoce, které vznikají v reakci na
krátké filmy. Algoritmus vyhodnocuje změny frontální mozkové asymetrie, která se odlišně
projevuje při pozitivních a negativních stimulech (filmech). V prvním kroku algoritmu je
zařazeno předzpracování EEG signálu, technické artefakty jsou odstraněny, biologické
artefakty způsobené pohybem a mrkáním jsou detekovány. Jsou využity tři odlišné způsoby
reference (reference na čelní elektrodu, reference na Cz elektrodu a Laplaceův operátor).
Následně je vypočítán výkon signálu v pásmu alfa mozkové aktivity. Výkon je normalizován
pomocí váženého průměru všech filmů, nebo na klidové EEG. Rozdíl výkonů je vypočítán
pro odpovídající elektrody v pravé a levé hemisféře. Algoritmus je testován pomocí
simulačního modelu hlavy a následně použit na reálná data. Data byla získána od deseti
jedinců, kteří během měření sledovali krátké filmy. Ke statistickému vyhodnocení asymetrie
je použita metoda Monte Carlo. V reakci na krátké filmy nebyla nalezena frontální mozková
asymetrie. To může být způsobeno výběrem subjektů nebo filmů, který nebyl podpořen
dalšími výzkumy.
Klíčová slova
Emoce, frontální mozková asymetrie, EEG, fyziologické koreláty emocí.
iii
Acknowledgments
I would like to thank to my supervisor Ing. Radoslav Bortel, Ph.D. for his guidance,
valuable advice in field of signal processing and stylistics. I am grateful for the time he
provided and for his positive attitude.
I am thankful to my parents for their support. Special thanks belong to my boyfriend
for his encouragement and advice.

iv
Prohlášení autora práce
Prohlašuji, že jsem předloženou práci vypracovala samostatně a že jsem uvedla
veškeré použité informační zdroje v souladu s Metodickým pokynem o dodržování etických
principů při přípravě vysokoškolských závěrečných prací.
V Praze dne 12. 5. 2014 ………..………………….….
Podpis autora práce
v
Contents
Annotation ....................................................................................................................... i
Acknowledgments ......................................................................................................... iii
Prohlášení autora práce .................................................................................................. iv
List of Abbreviations .................................................................................................... vii
1 Introduction .............................................................................................................. 1
Motivation ................................................................................................................... 1
Aim of this Work ........................................................................................................ 1
State of the Art ............................................................................................................ 2
1.1. EEG Asymmetry ............................................................................................... 2
1.2. Emotions and Asymmetry ................................................................................ 3
1.2.1. Depressed People ....................................................................................... 5
1.2.2. Sleep ........................................................................................................... 5
1.2.3. Infants ......................................................................................................... 5
1.2.4. Emotions and Film Records ....................................................................... 6
1.3. Methodological Issues ...................................................................................... 8
1.3.1. EEG Signal ................................................................................................. 8
1.3.2. Galvanic Skin Response ........................................................................... 10
Structure of the Thesis .............................................................................................. 11
2 Methods .................................................................................................................. 12
2.1. Selection of the Appropriate Signal ................................................................ 12
2.2. Measurement ................................................................................................... 12
2.3. Pre-processing of Physiological Signals ......................................................... 14
2.3.1. Pre-processing of EEG ............................................................................. 15
2.3.2. Reference Electrode Choice ..................................................................... 18
2.3.3. Computation of the Power of the Alpha Activity .................................... 19
vi
2.3.4. Normalization ........................................................................................... 20
2.3.5. Pre-processing of GSR ............................................................................. 21
2.4. Algorithm Testing ........................................................................................... 23
2.5. Classification of the Film Clips ...................................................................... 24
2.6. Implementation in MATLAB Environment ................................................... 25
3 Results .................................................................................................................... 26
3.1. Pre-processing of EEG .................................................................................... 26
3.1.1. Reduction of Power Noise Interference ................................................... 26
3.1.2. Detection of Biological Artifacts ............................................................. 27
3.2. Evaluation of Reactivity ................................................................................. 31
3.3. Reference Electrode Choice ............................................................................ 31
3.4. Testing and Validation of the Algorithm ........................................................ 32
3.5. Significance Level Estimation ........................................................................ 33
3.6. Application of the Algorithm on the Real Data .............................................. 35
4 Discussion .............................................................................................................. 46
4.1. Signal Pre-processing ..................................................................................... 46
4.2. Testing of the Algorithm on the Simulated Data ............................................ 46
4.3. Application of the Algorithm on the Real Data .............................................. 46
4.4. Methodological Weaknesses ........................................................................... 48
4.5. Suggestions for Future Experiment ................................................................ 49
5 Summary ................................................................................................................ 50
References ..................................................................................................................... 52
Appendix ....................................................................................................................... 58
vii
List of Abbreviations
BEM Boundary element method
EEG Electroencephalography
EMG Electromyography
GSR Galvanic skin response
PET Positron emission tomography
Classification of Physiological Correlates of Emotions
1
1 INTRODUCTION
Motivation
This work is motivated by the need of the objective estimation of emotional stimuli.
Common way how to evaluate opinion and interest in the different evocative stimuli such as
film clips is filling a questionnaire. However, this suffers from several disadvantages.
Incorrect or untrue information could be provided or subjects may have trouble expressing
themselves correctly. Therefore, there is a need or a more precise way of emotional responses
evaluation that avoids wrong interpretation and provides objective rating. An efficient way
how to achieve the objective evaluation is to measure physiological responses to the stimuli
and evaluate those using objective methods. Therefore, this thesis concentrates on the
problem of finding and evaluating physiological correlates of emotions.
Aim of this Work
This thesis has the following objectives which lead to the creation of the system
classifying emotions.
- Choose appropriate physiological signal for the classification of emotions and suggest
an algorithm of its pre-processing.
- Design an algorithm for the classification.
- Implement the algorithm and verify it on real records.
Classification of Physiological Correlates of Emotions
2
State of the Art
This chapter summarizes the state of the art in the field of emotions classification. The
review is divided into several parts. The first part deals with the frontal EEG asymmetry in
general, followed by the connections between emotions and the asymmetry, which is
described in different cases – depressed people, emotions during sleep, infants and emotional
responses to the film clips. Methodological issues connected with evaluation of the frontal
EEG asymmetry are reviewed. Galvanic skin response as the tool for assessing arousal is
described.
1.1. EEG Asymmetry
Preliminary research of cortical asymmetry [1] confirmed the hypothesis that the right
hemisphere has a special role in emotions by asking subjects four types of questions. The
lateral eye movements were scored and they differed significantly in complex cognitive and
affective questions. It was proposed that more precise localisation of the source of the
emotions should be made by other means of measurement (such as the EEG).
Bilateral EEG filtered to 8 – 13 Hz band (so called alpha band [2]) was used to
demonstrate task dependent cerebral asymmetry. Right hemisphere activation during musical
and spatial tasks and left hemisphere activation during numerical and verbal tasks were
showed by several papers (e.g. [3]). Work [4] studied sex differences in patterns of EEG
asymmetry. It showed that during tasks designed to unilateral activation of the cerebral
hemispheres, females had greater cortical asymmetries than males. Work [5] investigated
EEG asymmetry filtered for 8 – 13 Hz activity during musical and non-musical self-
generation tasks. Greater relative right hemisphere activation was shown in non-musically
trained subject while whistling the melody of a song. Study [6] showed that the frontal brain
asymmetry is related to certain immune responses.
While the older studies mentioned above were focused on the asymmetries in the
occipital or parietal parts of the brain. The newer studies mentioned in the following text are
focused on a frontal asymmetry occurred in the alpha band of EEG activity.
Classification of Physiological Correlates of Emotions
3
Anterior brain electrical asymmetries in the alpha band in response to reward and
punishment were found in [7]. According to study [8] the frontal brain asymmetry in the
alpha2 band (10.5 – 12 Hz) occurred in response to a verbal memory task which were neutral,
positive and negative (reward and punishment). Work [9] examined a frontal brain asymmetry
comparing the resting and fear-induced state made by fearful film clip. The resting-state brain
asymmetry was not significant but the group with high anxiety level showed greater EEG
asymmetry. Another study [10] compared frontal asymmetry before and after stress induction.
The level of alpha activity in the right hemisphere was greater after the stress stimuli.
Investigators in [11] found asymmetries in alpha activity which was correlated with
neurophysiological tasks.
In conclusion, cerebral asymmetry in the whole brain was examined in works focused
on the response to different tasks, e. g. musical, numerical or verbal. Also, the frontal brain
asymmetry was found in response to the reward and punishment, verbal memory task, anxiety
or stress. The studies showed that in reaction to certain tasks asymmetries in brain occur.
1.2. Emotions and Asymmetry
Several works showed that the processing of emotions in a brain is also asymmetrical.
The processing of positive vs. negative emotions was investigated in many studies that can be
divided into several branches.
- normal populations (e.g. [12], [13], [14], [15], [16], [17], [18], [19], [20], [21])
- brain-damaged populations (e.g. [23], [24], [25], [26], [27])
- psychiatric populations (e.g. [28], [29], [30], [31])
All studies mentioned in the list above show that the frontal parts of the right
hemisphere are more activated in response to the processing of negative affect but the frontal
parts of the left hemisphere are more activated in response to the processing of positive affect.
Some of the more interesting studies are mentioned and discussed in the following text.
Classification of Physiological Correlates of Emotions
4
Work [12] verified the hypothesis that the hemispheres are specialized differently for
positive and negative emotions. Subjects were asked to push a button on the right or the left
side according to the side of the picture (the images with happy or sad faces were projected on
the right or the left side of their visual field randomly).A reaction time of right vs left visual
field was studied, and it was faster when the expression was happy compared to the sad
pictures.
The regulation of emotions was studied in respect to eye-blink startle by [13]. The
attenuated startle magnitude after negative stimuli occurred in subjects with greater anterior
activation on the left side of the EEG.
In study [14] it was examined how the resting frontal brain activity affects responses
to positive and negative stimuli. It was showed that if the frontal asymmetry is stable during
a certain time period (two measurements were made 3 weeks apart), a greater left (right)
activation occurred in response to positive and negative film clips, respectively. The subject
who had the stable frontal asymmetry during a time period of several weeks and whose rest
brain activity was relatively grater on the left side reported higher reactivity in response to the
positive clips and vice versa.
Study [21] assesses asymmetries in facial expression during happiness and sadness.
The 3D imaging method (physiognomic range finder ‘Fiore’ manufactured by NEC, Japan)
was used to investigate facial movements. The study supported conclusions in paper [17],
which claimed the response to emotions in brain to be differed in the both hemispheres.
Work [22] noticed that greater left frontal cortical activity is associated with approach
motivation, which can be positive (enthusiasm) or negative (anger). Their study is based on
another work [32], where they claimed that the anterior asymmetry varies as a function of
motivational direction rather than affective valence.
Studies focused on connections of the frontal brain asymmetry and emotions showed
that the frontal activation in the left and right hemisphere varies as the response to the
negative and positive stimuli.
Classification of Physiological Correlates of Emotions
5
1.2.1. Depressed People
Some investigations concentrated on depressed subjects. Their relative right frontal
activation was greater compared with subjects who did not suffer from depression [18], [33].
Greater activation of right hemisphere agrees with other hypotheses that the left and right
frontal regions specialize for particular positive and negative effects. The study [34] based on
the previous findings confirmed the left frontal hypo activation in currently and previously
depressed subjects. Another study of depressed subjects [35] showed that the subjects with
current or previous incidence of depression had greater frontal brain asymmetry. The EEG
asymmetry was compared between depressed and normal subjects in other experiment [36]. It
was showed that the frontal EEG asymmetry is a risk marker for depressive disorder. In this
study the subjects were asked to make four different facial expressions connected to
withdrawal (afraid and sad) and approach (angry and happy). Lower relative left frontal
activity was displayed in lifetime depressed individuals compared with normal ones.
1.2.2. Sleep
Despite most of the research has been comparing the alpha activity in frontal region at
subjects who were awake, a few works concentrated on sleeping subjects. The central region
of the brain activity was measured ([37], [38], [39]), but no asymmetry was found in these
works. Study [40] showed that the level of frontal brain activation asymmetry in wakefulness
could predict the emotional content of dreams. Work [41] showed connections between alpha
asymmetry in frontal region during wakefulness and sleep. If the asymmetry during
wakefulness and sleep is stable, it could be caused by emotional activity during dreaming.
1.2.3. Infants
Brain activity of ten-month-old infants was recorded from the frontal regions of the
scalp. In paper [42] two studies were presented and infants showed greater activation of the
left frontal than of the right frontal area in response to the happy facial expression.
Work [43] made another experiment with different stimuli: a stranger-approach,
mother-approach, and maternal separation experience. Changes in EEG asymmetry in frontal
Classification of Physiological Correlates of Emotions
6
lobes also reflected changes in facial behaviour. This idea was supported by an experiment
where the response to taste (sucrose solution and citric acid solution) was measured on new-
born infants [44]. The relative left-sided activation was greater for the sucrose solution in
frontal and parietal regions in the 6 – 12 Hz band. Paper [45] is focused on the response to
maternal separation with the similar results. Children who cried showed greater right frontal
activation.
1.2.4. Emotions and Film Records
In paper [46] the investigators let subjects watch short film clips and found that if
facial expression is not considered and the analysis is made from the whole film clip period,
no reliable differences in frontal EEG asymmetry is produced in ether the alpha or beta bands.
The film clips were selected carefully and precisely to elicit both self-report and facial signs
of positive and negative emotion. The selection of the stimuli was supported by paper [47],
where the facial expressions were examined during watching the selected film clips. Silent
clips were used because of the hypothesis that auditory patterns could affect the activation of
certain parts of the hemispheres. They compared results of EEG asymmetry in the whole film
clip period and in parts with certain facial expression and concluded that only appearance of
facial expressions ensures significant asymmetry.
On the other hand, work [48] confirmed frontal EEG asymmetry which occurred
during watching the emotional film clips. The activation was regional, especially for the
stimuli selected to elicit happy or disgust emotions. The subjects were selected according to
the rate of the reaction to the film clip stimuli and using Multidimensional Personality
Questionnaire.
Study [49] presented outcomes of the experiment made at healthy students. They saw
two film clips (one sad and one happy) and were asked to think about sad and happy events of
their lives after clips. The frontal EEG asymmetry in alpha band was confirmed especially
during the sad emotions because time to “regenerate” the brain from the sad to happy emotion
was not long enough and it could have affected the results.
In the three studies mentioned above [46], [48], [49] where the frontal EEG
asymmetry was showed in response to the film clips, selected subjects were all right-handed,
Classification of Physiological Correlates of Emotions
7
it the first case only women, in the second and third case students from the same schools. In
study [46] the frontal brain asymmetry was shown just in the time intervals with facial
expression. Work [48] found frontal asymmetry in subjects who were selected for high
positive and negative affectivity and the stimuli had high evocative nature. Work [49]
presented higher frontal brain asymmetry in the first stimuli (negative), than in the second
stimuli (positive).
Positron emission tomography (PET) was used for the localization of the brain regions
responsible for response to different stimuli. One part of paper [50] investigated regions
reacting to the film clip stimuli. The investigators stated that film-generated emotion was
associated with significantly greater increases in activity bilaterally in the
occipitotemporoparietal cortex; lateral cerebellum, hypothalamus, and a region that includes
the anterior temporal cortex, amygdala, and hippocampal formation, suggesting that there
regions participate in the emotional response to certain exteroceptive sensory stimuli. Another
study [51] localized responses to the happiness, sadness and disgust by PET as well. These
emotions are associated with increased activity in the thalamus and medial prefrontal cortex,
and also with activation of anterior and posterior temporal structures in case of induction by
film clip. The same findings were provided by work [52] based also on PET but with different
stimuli (the set of pictures).
In contrast with the abovementioned works, there were also some cases where the
frontal asymmetry was not found. In work [46] the frontal brain asymmetry was not found,
when the power in the alpha band was computed during the whole film clip period. Also,
paper [49] showed no significant results for the positive stimuli, which followed the negative
one. This indicates that the frontal asymmetry is not always a robust indicator of the
emotional valence, and unless the experiment is set up correctly, no differences in frontal
power can be detected.
Classification of Physiological Correlates of Emotions
8
1.3. Methodological Issues
Methodology previously used for the correct evaluation of the frontal asymmetry and
reactivity of the subjects is discussed in this section.
1.3.1. EEG Signal
Paper [53] summarizes methodology for assessment of the frontal asymmetry. Three
main aspects were discussed: metrics of asymmetry, artifacts and reference electrode location.
Each part will be presented in detail in following text.
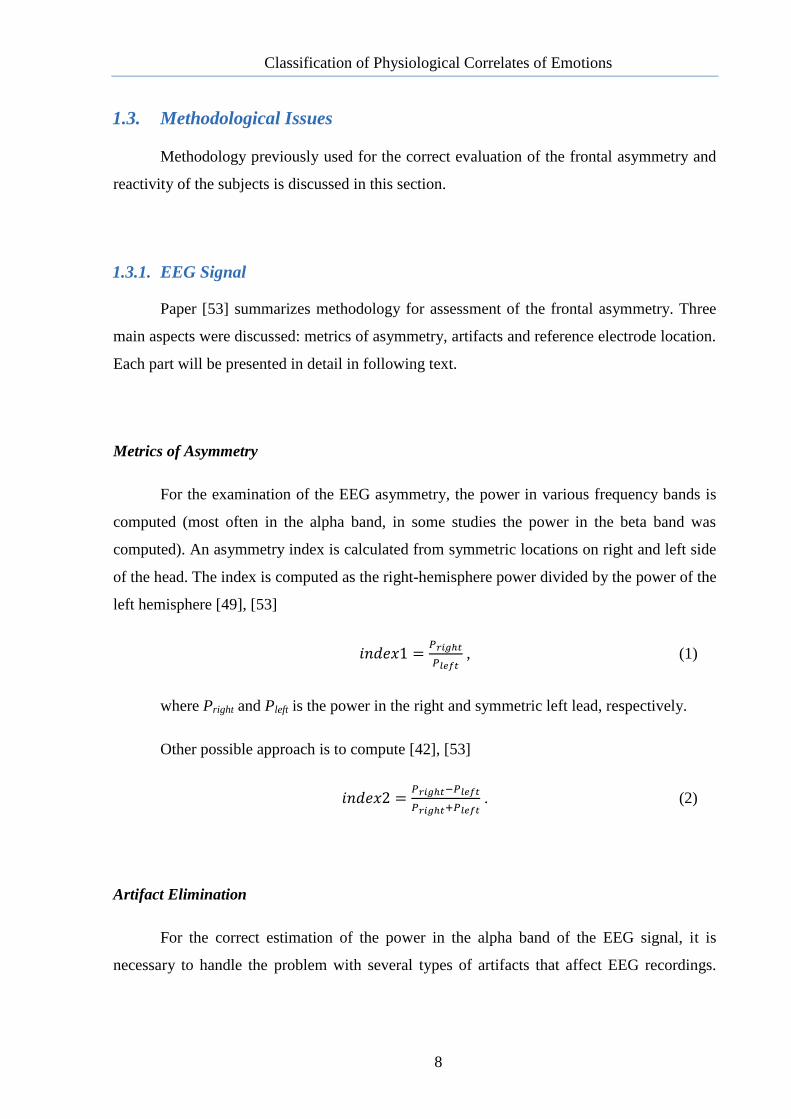
Metrics of Asymmetry
For the examination of the EEG asymmetry, the power in various frequency bands is
computed (most often in the alpha band, in some studies the power in the beta band was
computed). An asymmetry index is calculated from symmetric locations on right and left side
of the head. The index is computed as the right-hemisphere power divided by the power of the
left hemisphere [49], [53]
, (1)
where Pright and Pleft is the power in the right and symmetric left lead, respectively.
Other possible approach is to compute [42], [53]
. (2)
Artifact Elimination
For the correct estimation of the power in the alpha band of the EEG signal, it is
necessary to handle the problem with several types of artifacts that affect EEG recordings.
Classification of Physiological Correlates of Emotions
9
Physiological artifacts which should be removed from the signal include primarily blinking
and muscular artifacts.
Blinking is easily observable in the frontal EEG leads and can be simply eliminated by
simple thresholding [57]. The principle of the elimination is described in detail in
Section 2.3.1.
Muscular artifacts should be treated as well. The frequency content of EMG activity is
broad and interferes with the frequency content of the EEG activity. Especially facial
expressions, which may be asymmetrical [21], can bias measures of EEG asymmetry [53]. To
detect the artifacts, the power of the EEG signal is measured in higher frequencies which do
not contain any neurogenic activity. Parts with higher power which match the EMG activity
are removed from the recordings. The principle of the elimination is described in greater
detail in Section 2.3.1.
Eye movements could also be considered as possible source of artifact which can
affect the EEG. However, the slow eye movements influence the power of low frequencies
and do not influence the power of the alpha band which is examined in case of frontal EEG
asymmetry connected with the emotional response [55].
Reference Electrode Location
An appropriately chosen reference is essential for the measurement of the frontal EEG
asymmetry. Work [56] reported that the commonly used linked earlobe reference decreased
the magnitude of task-dependent asymmetry and therefore it is not suitable for the purpose of
the asymmetry evaluation. The other possibility which seems to be more appropriate is to use
the Cz electrode (placed on the cranial vertex) as the reference. Also, the reference-free
solution can be used – the scalp surface Laplacian operator. The use of the surface Laplacian
is described in detail in Section 2.3.2.
Classification of Physiological Correlates of Emotions
10
Other Considerations
Other methodological requirements which should be incorporated into research of
human emotions are [46]:
Emotion must be actually elicited – some other evidence that confirm that the
investigated emotion was produced should exist.
Adequate procedures must be used to verify the presence of the intended emotion –
every subject reacts differently to the stimuli, which were meant to have certain
reaction. It means that the stimuli picked to elicit one emotion can evoke more
emotions and affect the results.
Epochs of different discrete emotions must be separable – the period of time with the
examined emotion should be extracted from the whole measurement using other
independent method. For example analysis of the facial behaviour recording can be
used.
Behavioural and physiological measures of emotion must be appropriately
synchronized – for the extraction of suitable parts of record according to pervious
point.
At least two emotions and a baseline condition must be compared – every emotion
should be compared with the baseline measurement, because asymmetry of two
emotions can differ from each other but not from the baseline condition.
The data must be of sufficient duration for each emotion under study – at least 10
seconds long record should be made to obtain a stable estimate of spectral power.
1.3.2. Galvanic Skin Response
The galvanic skin response (GSR) is a method of measuring the electrical conductance
of skin which differs depending on various physiological processes ongoing in the human
body. This indicator is used for the assessment of the arousal of a subject.
The GSR increases if the sympathetic branch of the autonomic nervous system is
aroused. The arousal could be caused by emotional response, but the sympathetic branch of
the autonomic nervous system can also be activated during the physical movement. To assess
Classification of Physiological Correlates of Emotions
11
the arousal caused by the emotional response, the increase of GSR caused by the movement
should be suppressed.
Also the overlap of GSR changes caused both by movement and emotion appears. The
movement could cause the huge increase of the GSR, but the increase caused by the
emotional arousal is usually lower. Then, techniques suppressing the increasing and
decreasing trend, respectively, caused by the movement are applied to emphasize the peaks
caused by the emotional arousal. An example of this technique is using the first derivate,
which emphasises the fast changes [57].
Structure of the Thesis
The second chapter (Methods) describes the conditions of measurement, the algorithm
for pre-processing of physiological signals and the algorithm of classification of physiological
correlates of emotions.
The third chapter (Results) summarizes results obtained with implemented algorithm.
The fourth chapter (Discussion) analyses the results and proposes possible adjustment
that could improve quality of future experiment.
The last chapter is summary of the work.
Classification of Physiological Correlates of Emotions
12
2 METHODS
This chapter describes the methodology used for the classification of the physiological
correlates of emotions. First the selection of the appropriate signal and measurement is
discussed. Secondly, the pre-processing of EEG signal is explained; this includes artifact
detection, filtering and exclusion of electrodes with bad signal contact. Next, the reference
electrode choice, the computation of the power in the alpha band and the power normalization
is described. Also, the pre-processing of the GSR and its use for the selection of aroused
subjects is characterized. Finally, the description of the algorithm testing is included.
2.1. Selection of the Appropriate Signal
According to the summarized literature, there are two signals that seem to be a good
choice for the classification of emotions. These are EEG and GSR. The EEG is relatively easy
to measure (at least in comparison with other modalities of brain measurement) and it can
reflect valence of the stimuli, which is usually detected as the frontal asymmetry in the alpha
band. The GSR is also very easy to measure, and is a very good indicator of arousal.
Therefore, the EEG and GSR were chosen for further processing in this thesis.
2.2. Measurement
For this work EEG and GSR datasets measured within another project were used. This
section describes the procedures with which these data were measured.
Thirty-one subjects were recruited, 15 male and 16 female, both right- and left-
handed. 27 subjects were between 19 and 29 years of age. 4 subjects were older (31 – 37
years old).
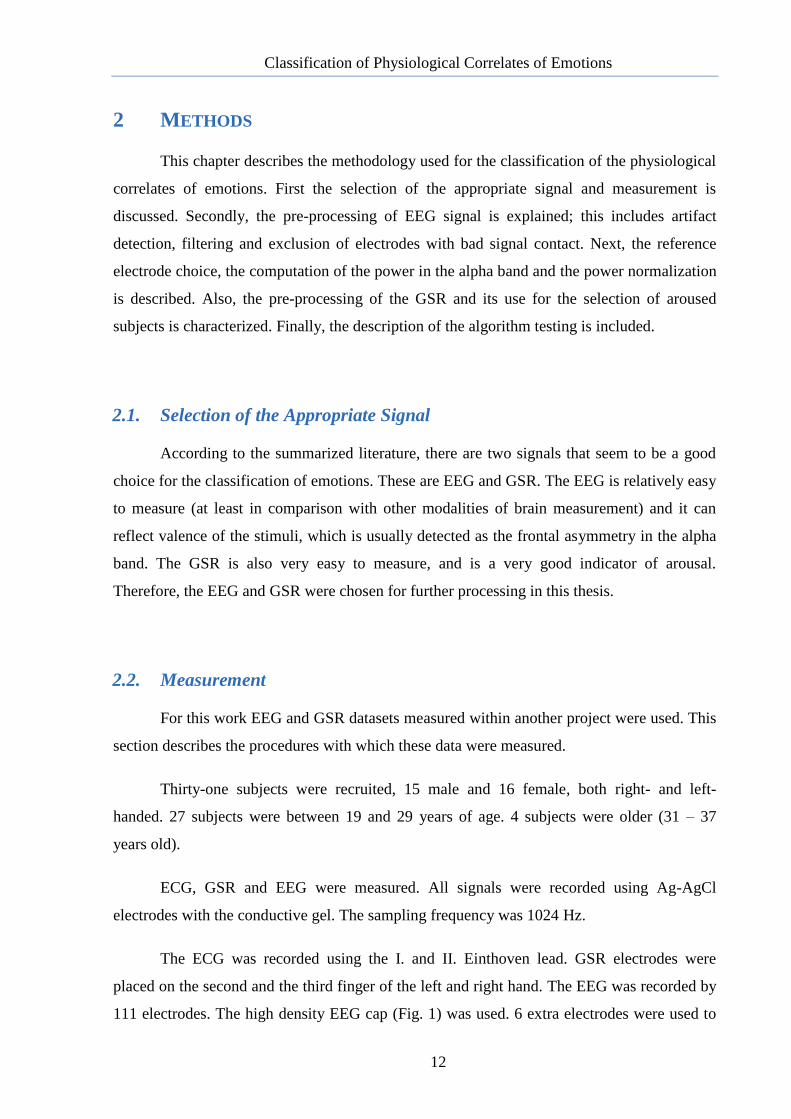
ECG, GSR and EEG were measured. All signals were recorded using Ag-AgCl
electrodes with the conductive gel. The sampling frequency was 1024 Hz.
The ECG was recorded using the I. and II. Einthoven lead. GSR electrodes were
placed on the second and the third finger of the left and right hand. The EEG was recorded by
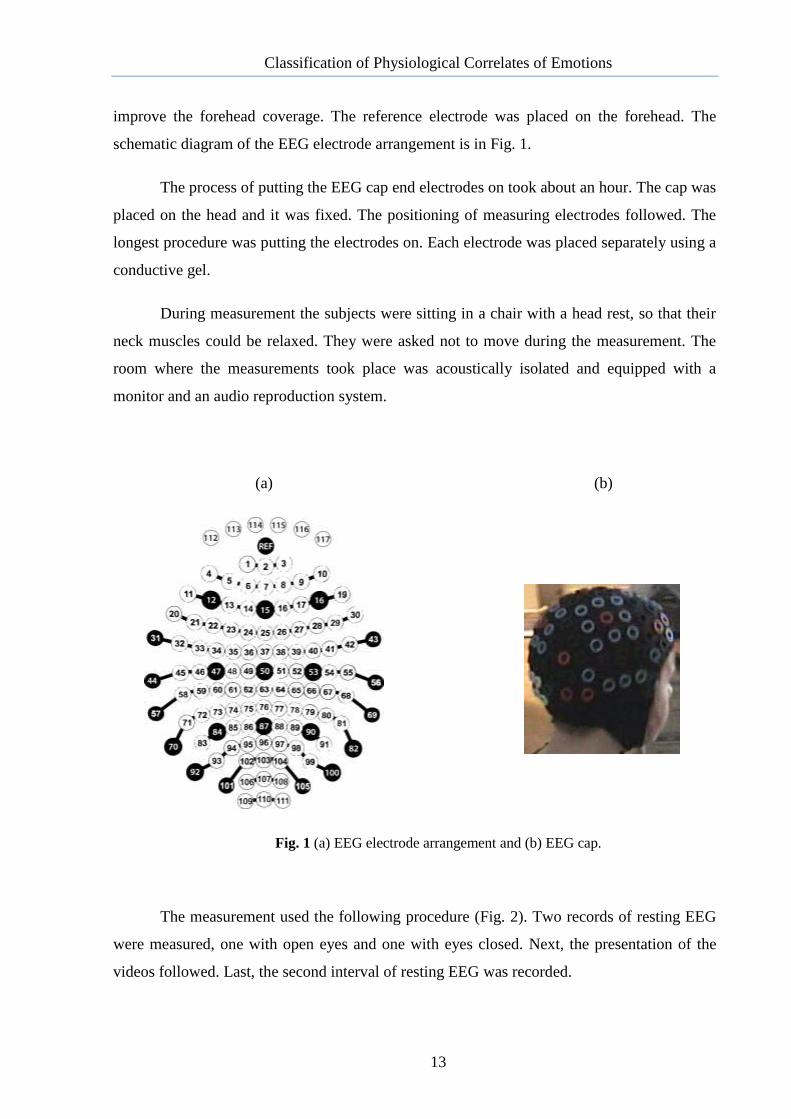
111 electrodes. The high density EEG cap (Fig. 1) was used. 6 extra electrodes were used to
Classification of Physiological Correlates of Emotions
13
improve the forehead coverage. The reference electrode was placed on the forehead. The
schematic diagram of the EEG electrode arrangement is in Fig. 1.
The process of putting the EEG cap end electrodes on took about an hour. The cap was
placed on the head and it was fixed. The positioning of measuring electrodes followed. The
longest procedure was putting the electrodes on. Each electrode was placed separately using a
conductive gel.
During measurement the subjects were sitting in a chair with a head rest, so that their
neck muscles could be relaxed. They were asked not to move during the measurement. The
room where the measurements took place was acoustically isolated and equipped with a
monitor and an audio reproduction system.
(a) (b)
Fig. 1 (a) EEG electrode arrangement and (b) EEG cap.
The measurement used the following procedure (Fig. 2). Two records of resting EEG
were measured, one with open eyes and one with eyes closed. Next, the presentation of the
videos followed. Last, the second interval of resting EEG was recorded.

Classification of Physiological Correlates of Emotions
14
Fig. 2 Scheme of the measurement.
The stimuli consisted of short film clips (about 2 minutes long) which were supposed
to evoke emotions (positive, negative or neural). The positive clips were either amusing or
affectionate; the negative clips showed violence or elicited disgust. Between videos, 30
seconds pauses with noise were placed.
Videos were presented in two different orders for the first 18 subjects and the rest. The
videos were divided into 4 groups, reference videos – positive, negative and neutral; and one
group with commercials. During the measurement subjects saw 29 film clips, which consisted
of 13 commercials, 5 positive, 5 negative and 6 neutral film clips.
2.3. Pre-processing of Physiological Signals
This chapter describes the methods used for pre-processing of physiological signals.
This includes the elimination of power noise interference, suppression of muscular and
blinking artifact, recognition of electrodes with bad signal contact and GSR pre-processing.
In the following text the EEG signal will be denoted as
[ ] [ [ ] [ ] [ ]] , where , (3)
where [ ] is a signal measured by lead i, L is the number of leads and N is the
number of samples.
Resting EEG Videos Resting EEG
Classification of Physiological Correlates of Emotions
15
2.3.1. Pre-processing of EEG
Power noise interference was reduced using the notch filter, which eliminates the
power at the frequency of 50 Hz. The bandwidth of the filter was 2.5 Hz. The higher
harmonies were also reduced.
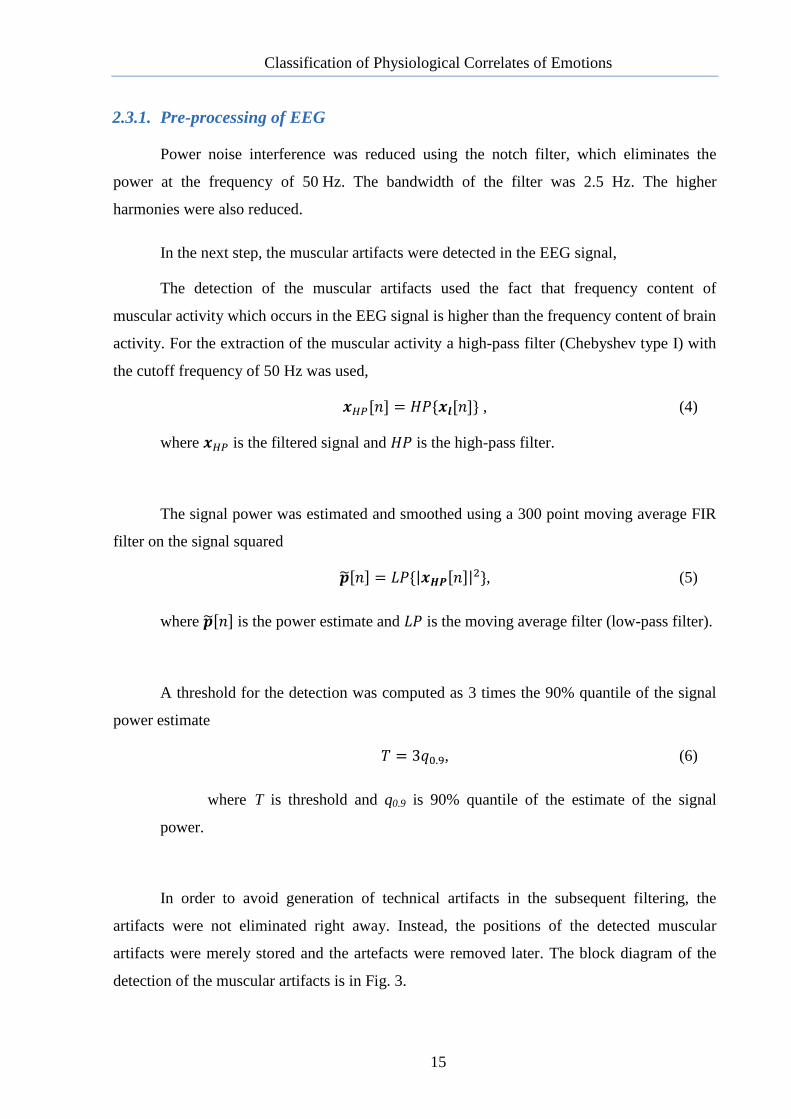
In the next step, the muscular artifacts were detected in the EEG signal,
The detection of the muscular artifacts used the fact that frequency content of
muscular activity which occurs in the EEG signal is higher than the frequency content of brain
activity. For the extraction of the muscular activity a high-pass filter (Chebyshev type I) with
the cutoff frequency of 50 Hz was used,
[ ] [ ] , (4)
where is the filtered signal and is the high-pass filter.
The signal power was estimated and smoothed using a 300 point moving average FIR
filter on the signal squared
[ ] | [ ]| , (5)
where [ ] is the power estimate and is the moving average filter (low-pass filter).
A threshold for the detection was computed as 3 times the 90% quantile of the signal
power estimate
, (6)
where T is threshold and q0.9 is 90% quantile of the estimate of the signal
power.
In order to avoid generation of technical artifacts in the subsequent filtering, the
artifacts were not eliminated right away. Instead, the positions of the detected muscular
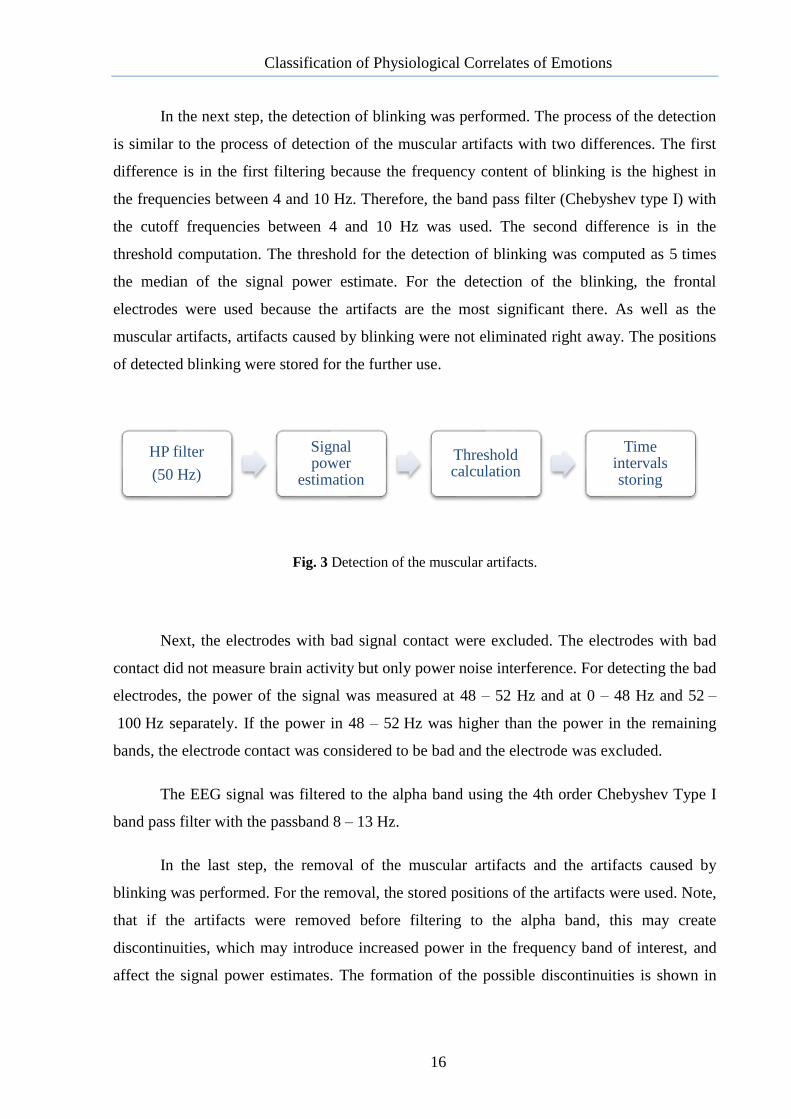
artifacts were merely stored and the artefacts were removed later. The block diagram of the
detection of the muscular artifacts is in Fig. 3.
Classification of Physiological Correlates of Emotions
16
In the next step, the detection of blinking was performed. The process of the detection
is similar to the process of detection of the muscular artifacts with two differences. The first
difference is in the first filtering because the frequency content of blinking is the highest in
the frequencies between 4 and 10 Hz. Therefore, the band pass filter (Chebyshev type I) with
the cutoff frequencies between 4 and 10 Hz was used. The second difference is in the
threshold computation. The threshold for the detection of blinking was computed as 5 times
the median of the signal power estimate. For the detection of the blinking, the frontal
electrodes were used because the artifacts are the most significant there. As well as the
muscular artifacts, artifacts caused by blinking were not eliminated right away. The positions
of detected blinking were stored for the further use.
Fig. 3 Detection of the muscular artifacts.
Next, the electrodes with bad signal contact were excluded. The electrodes with bad
contact did not measure brain activity but only power noise interference. For detecting the bad
electrodes, the power of the signal was measured at 48 – 52 Hz and at 0 – 48 Hz and 52 –
100 Hz separately. If the power in 48 – 52 Hz was higher than the power in the remaining
bands, the electrode contact was considered to be bad and the electrode was excluded.
The EEG signal was filtered to the alpha band using the 4th order Chebyshev Type I
band pass filter with the passband 8 – 13 Hz.
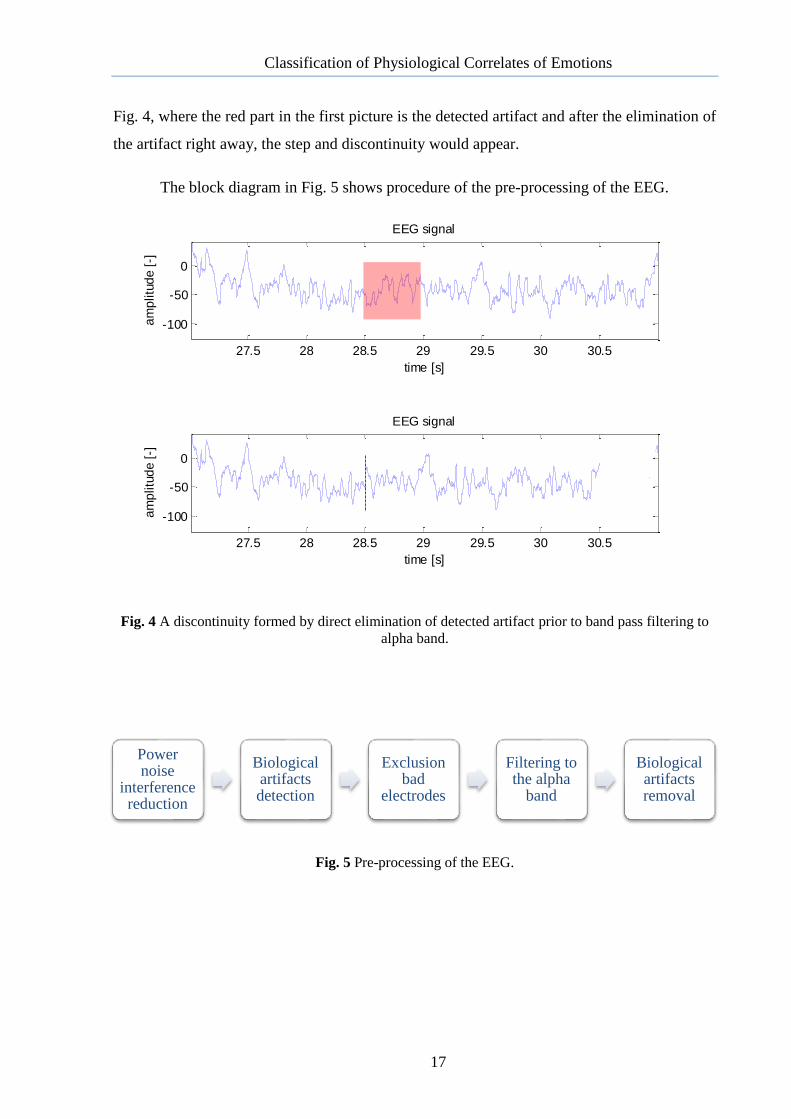
In the last step, the removal of the muscular artifacts and the artifacts caused by
blinking was performed. For the removal, the stored positions of the artifacts were used. Note,
that if the artifacts were removed before filtering to the alpha band, this may create
discontinuities, which may introduce increased power in the frequency band of interest, and
affect the signal power estimates. The formation of the possible discontinuities is shown in
HP filter
(50 Hz)
Signal power
estimation
Threshold calculation
Time intervals storing
Classification of Physiological Correlates of Emotions
17
Fig. 4, where the red part in the first picture is the detected artifact and after the elimination of
the artifact right away, the step and discontinuity would appear.
The block diagram in Fig. 5 shows procedure of the pre-processing of the EEG.
Fig. 4 A discontinuity formed by direct elimination of detected artifact prior to band pass filtering to
alpha band.
Fig. 5 Pre-processing of the EEG.
27.5 28 28.5 29 29.5 30 30.5
-100
-50
0
time [s]
am
plitu
de
[-]
EEG signal
27.5 28 28.5 29 29.5 30 30.5
-100
-50
0
time [s]
am
plitu
de
[-]
EEG signal
Power noise
interference reduction
Biological artifacts detection
Exclusion bad
electrodes
Filtering to the alpha
band
Biological artifacts removal
27.5 28 28.5 29 29.5 30 30.5
-100
-50
0
time [s]
am
plitu
de
[-]
EEG signal
Classification of Physiological Correlates of Emotions
18
2.3.2. Reference Electrode Choice
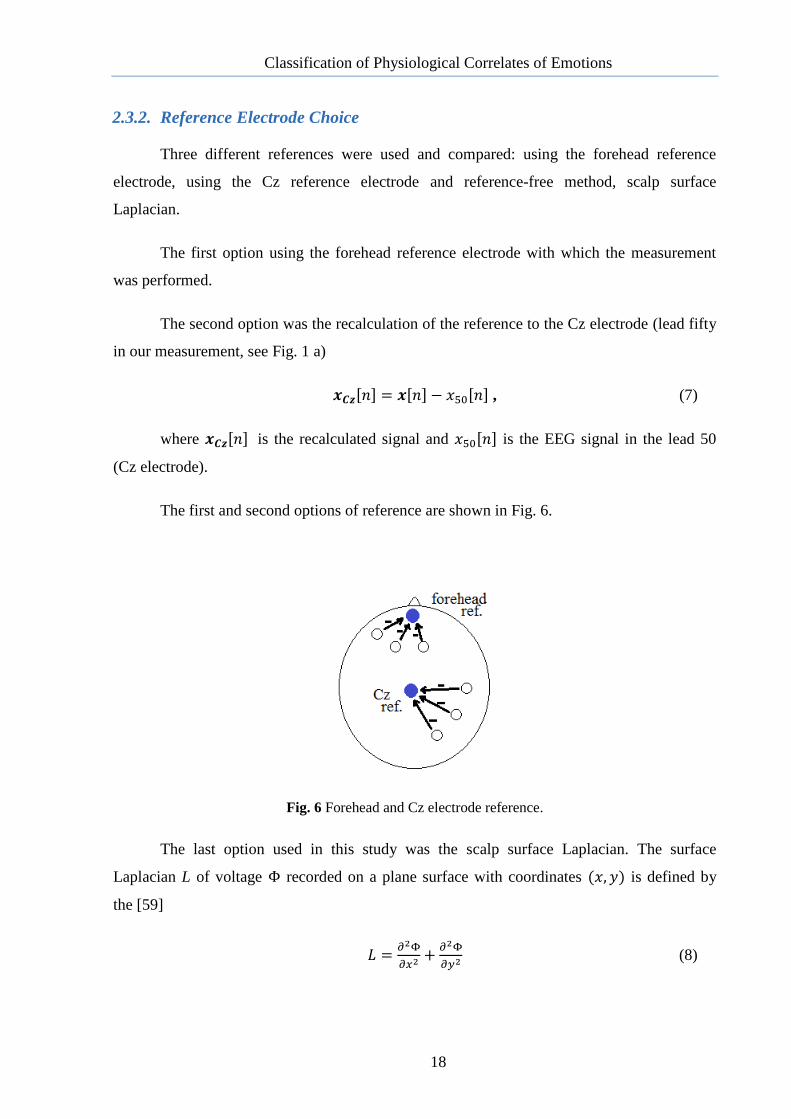
Three different references were used and compared: using the forehead reference
electrode, using the Cz reference electrode and reference-free method, scalp surface
Laplacian.
The first option using the forehead reference electrode with which the measurement
was performed.
The second option was the recalculation of the reference to the Cz electrode (lead fifty
in our measurement, see Fig. 1 a)
[ ] [ ] [ ] , (7)
where [ ] is the recalculated signal and [ ] is the EEG signal in the lead 50
(Cz electrode).
The first and second options of reference are shown in Fig. 6.
Fig. 6 Forehead and Cz electrode reference.
The last option used in this study was the scalp surface Laplacian. The surface
Laplacian L of voltage recorded on a plane surface with coordinates is defined by
the [59]
(8)
Classification of Physiological Correlates of Emotions
19
The Laplacian mapping is able to enhance the high spatial frequency components of
cortical electrical activity, which are smeared and distorted over the scalp when volume
conducting through the low-conductivity skull [60]. Each channel represents the difference
between an electrode and a weighted average of the surrounding electrodes. This is a
reference-free method [60].
Linked earlobe reference is a common used reference, but is not utilized for purposes
of assessing the frontal brain asymmetry, because it decreases the magnitude of task-
dependent asymmetry [56].
2.3.3. Computation of the Power of the Alpha Activity
Based on the suggestion in [53], the average power of alpha activity was computed for
each stimulus and each electrode as
, where , (9)
where is the average power estimate computed from the whole time period of the
film clip and N is the number of samples in the film clip.
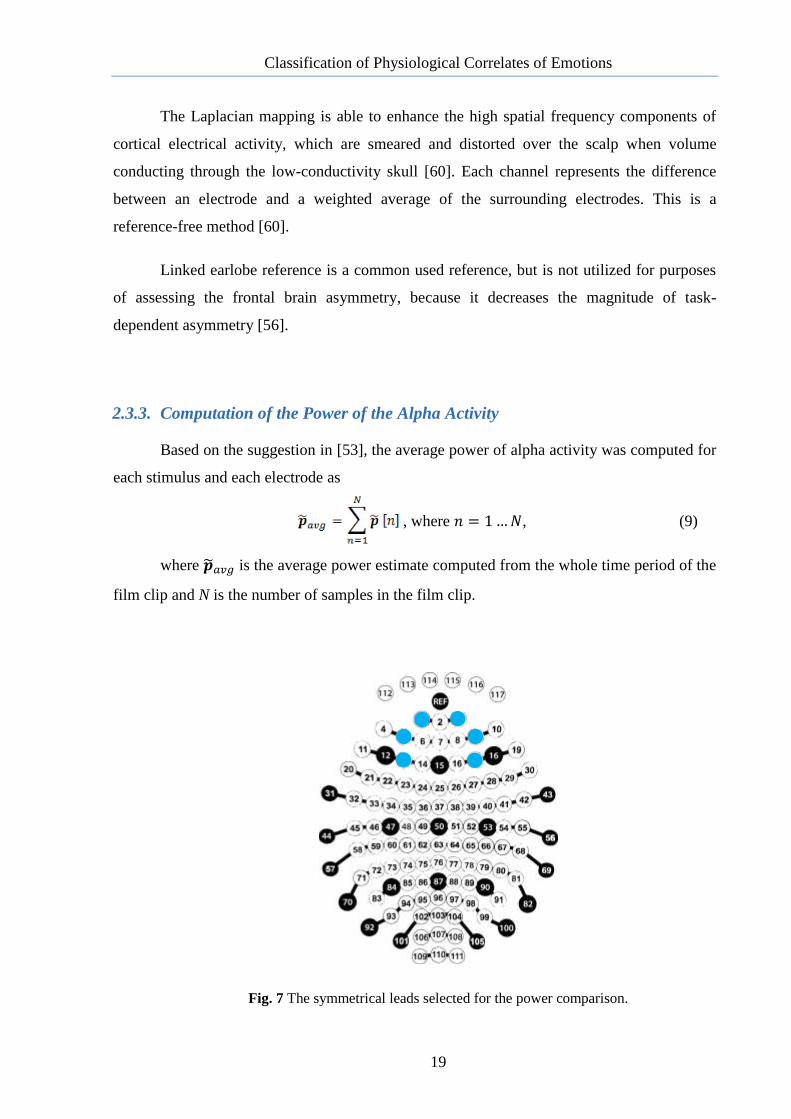
Fig. 7 The symmetrical leads selected for the power comparison.
Classification of Physiological Correlates of Emotions
20
The power was compared in the right and left frontal area in the symmetrical leads.
From each area three leads were selected (Fig. 7). The difference was computed in these 3
combinations of the leads. More than one combination was selected because the response to
the same stimulus could be localized differently for different subjects and also the electrode
cap placement may vary.
The power computed in the symmetrical leads was compared separately for each
stimulus.
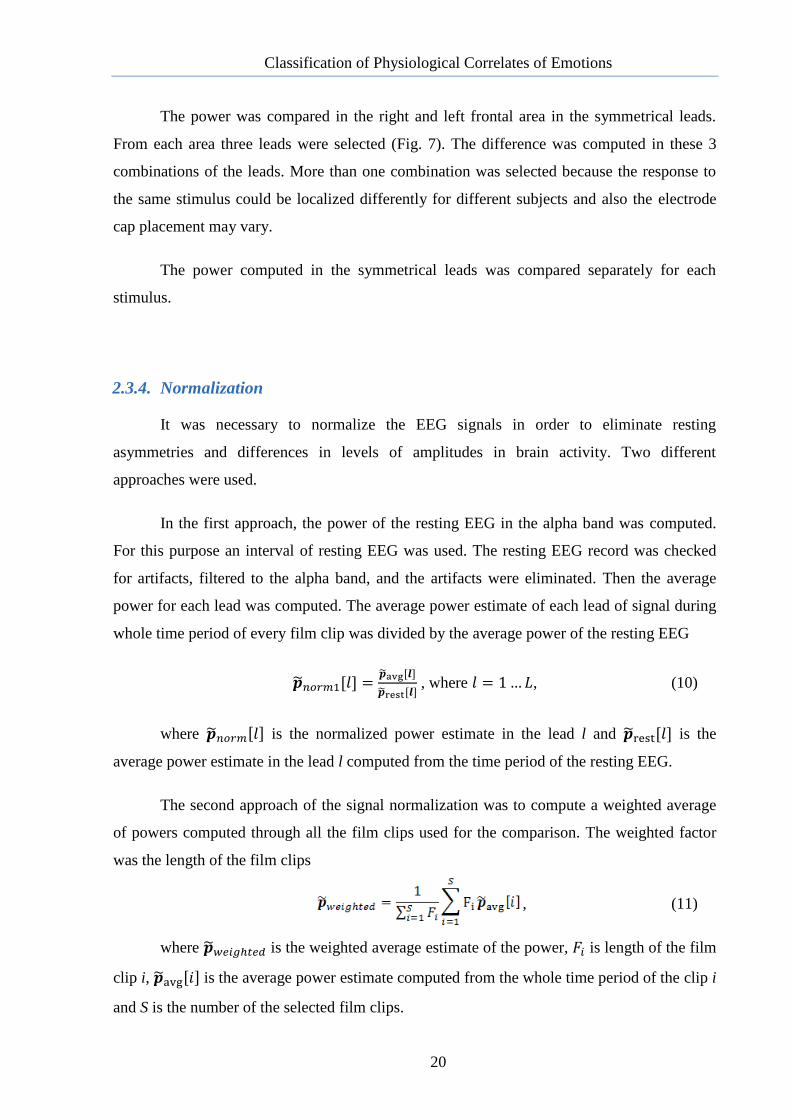
2.3.4. Normalization
It was necessary to normalize the EEG signals in order to eliminate resting
asymmetries and differences in levels of amplitudes in brain activity. Two different
approaches were used.
In the first approach, the power of the resting EEG in the alpha band was computed.
For this purpose an interval of resting EEG was used. The resting EEG record was checked
for artifacts, filtered to the alpha band, and the artifacts were eliminated. Then the average
power for each lead was computed. The average power estimate of each lead of signal during
whole time period of every film clip was divided by the average power of the resting EEG
[ ] [ ]
[ ] , where , (10)
where [ ] is the normalized power estimate in the lead l and [ ] is the
average power estimate in the lead l computed from the time period of the resting EEG.
The second approach of the signal normalization was to compute a weighted average
of powers computed through all the film clips used for the comparison. The weighted factor
was the length of the film clips
, (11)
where is the weighted average estimate of the power, is length of the film
clip i, [ ] is the average power estimate computed from the whole time period of the clip i
and S is the number of the selected film clips.
Classification of Physiological Correlates of Emotions
21
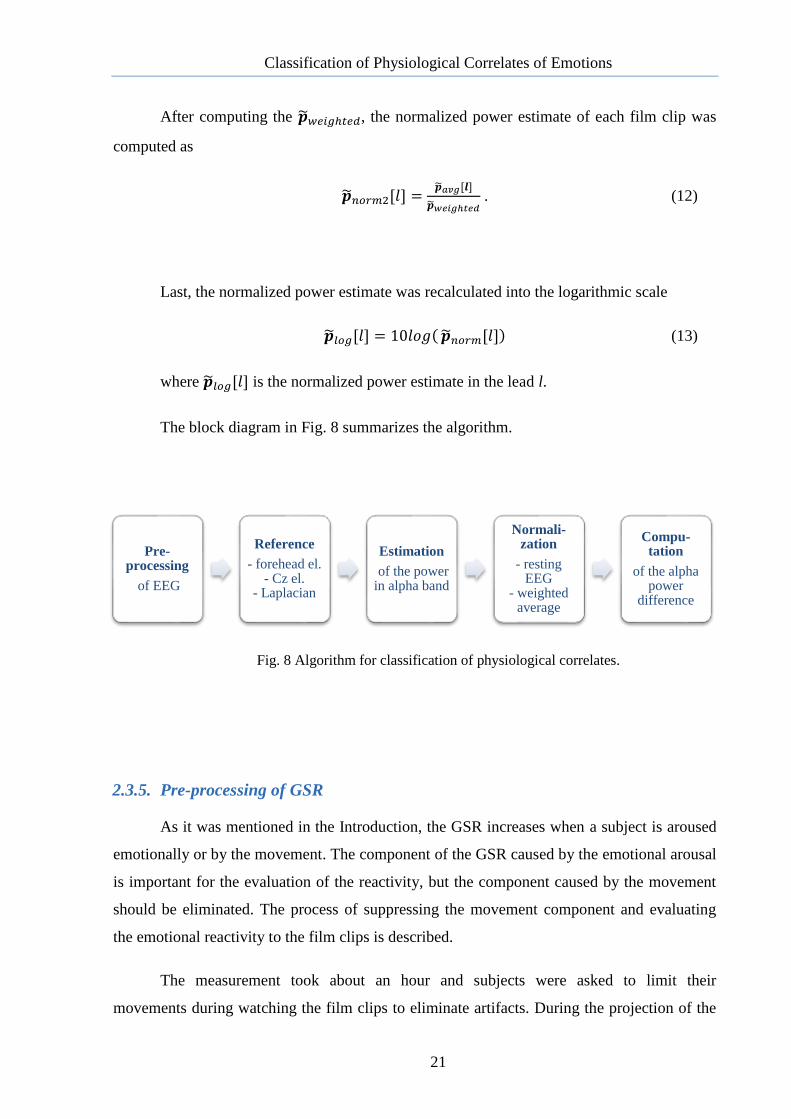
After computing the , the normalized power estimate of each film clip was
computed as
[ ] [ ]
. (12)
Last, the normalized power estimate was recalculated into the logarithmic scale
[ ] [ ] (13)
where [ ] is the normalized power estimate in the lead l.
The block diagram in Fig. 8 summarizes the algorithm.
Fig. 8 Algorithm for classification of physiological correlates.
2.3.5. Pre-processing of GSR
As it was mentioned in the Introduction, the GSR increases when a subject is aroused
emotionally or by the movement. The component of the GSR caused by the emotional arousal
is important for the evaluation of the reactivity, but the component caused by the movement
should be eliminated. The process of suppressing the movement component and evaluating
the emotional reactivity to the film clips is described.
The measurement took about an hour and subjects were asked to limit their
movements during watching the film clips to eliminate artifacts. During the projection of the
Pre-processing
of EEG
Reference
- forehead el. - Cz el.
- Laplacian
Estimation
of the power in alpha band
Normali-zation
- resting EEG
- weighted average
Compu- tation
of the alpha power
difference
Classification of Physiological Correlates of Emotions
22
film clips the subjects paid attention to the clips and moved slightly. But during the pauses
when the noise was screened, they started fidgeting and the GSR increased as the response to
their movement.
The GSR was assessed during the whole time period of the film clips. To suppress the
increase in GSR made by the movement, the first derivate (differential) was used. Using the
differential emphasized the peaks originated by the arousal caused by the reactive response to
the film clips.
The GSR was evaluated visually. If peaks were high enough, the film clip connected
to it was picked for further evaluation.
Each film clip and each subject were assessed using the GSR and only the film clips
with certain level of reaction were used for the evaluation of the algorithm. The subjects who
did not manifest any arousal, as evaluated by the GSR, were excluded from further evaluation.
This was done to increase the chance of frontal asymmetry detection.
Classification of Physiological Correlates of Emotions
23
2.4. Algorithm Testing
In order to test the functionality of the implemented algorithm, the simulation of the
EEG signal which was designed in works [61] and [62] was used.
The simulation used a three layer realistic head model computed using the boundary
element method (BEM) based on the symmetric approach. The three boundaries represented
skin and the inner and outer surface of a skull. The simulation consisted of 45 frontal brain
sources and totally 150 brain sources randomly placed into the brain volume [61]. The sources
signal were represented by pseudorandom numbers with the standard normal distribution
filtered using a low-pass filter in order to simulate the brain activity which occurs in
frequencies from 0 to approximately 30 Hz [2]. The surface potential was computed from the
sources in the positions of the electrodes.
The outcome of the simulation were signals from 111 leads representing 2 minutes
long recording with the sampling frequency of 1024 Hz. The resulting signal had similar
character as the brain activity.
The frontal asymmetry in the model was tested. To simulate the asymmetry, the
magnitude of the respective frontal sources was increased to various levels. Two cases were
designed, higher activity in the left frontal lobe (response to the positive stimuli) and higher
activity in the right frontal lobe (response to the negative stimuli). The designed algorithm
was applied to the simulation data.
Classification of Physiological Correlates of Emotions
24
2.5. Classification of the Film Clips
For the classification of the film clips and for the verification of the statistical
significance, following steps were used.
First, the power difference in the symmetrical leads was estimated
[ ] [ ] , (14)
where is the power difference estimate, and are symmetrical leads.
The power difference estimate is statistically significant in case that its value is
higher than a threshold T. The threshold T is defined as a value, which is exceeded by with
the probability assuming that the true frontal asymmetry is zero
[ | ] . (15)
Thus T is the -quantile of the distribution of provided that true r = 0, where r is the
true value of the power difference.
To determine the threshold T, Monte Carlo simulation was used [63]. The
measurement was simulated using the head model described in Section 2.4. The brain sources
were set so that there was no frontal asymmetry. 1600 simulated signals were computed and
processed with methods described in Section 2.3, resulting in 1600 power differences
estimates . These estimates were then used to estimate the -quantiles, and the respective
threshold T. The quantiles were estimated using the following procedure.
- The values of were arranged in the ascending order, forming a vector .
- The quantile is obtained as the -th value in the vector , where
[
] , (16)
where is the number of the values in the vector , is the value of the quantile in
the percent and [.] denotes the integer part of its argument.
Regarding the choice of the significance level, a single test could be performed at
a chosen level ; however, with the number of test rather high, this could lead to
Classification of Physiological Correlates of Emotions
25
a high number of false positive detections. Therefore, Bonferroni correction was used and the
significance level was decreased using the formula
, (17)
where is the original significance level, is the corrected significance level and
is the number of independent tests [64].
In this study, was chosen as 10%. In the measurement 10 subjects and 3 electrode
combinations were selected, 30 independent tests were used; therefore, the significance level
was corrected to 0.3 %.
Consequently, the 0.3% and 99.7% quantiles were used as the threshold for the testing
of the hypotheses, that the power in the right hemisphere is higher in response to the positive
stimuli and the power in the left hemisphere is higher in response to the negative stimuli,
respectively. It is decided, whether the computed asymmetry is caused by the physiological
processes or if it is a random event.
The algorithm was tested on the real records from 10 subjects. Records from 31
subjects were available, but only reactive subject were selected according to the arousal
evaluated using the galvanic skin response.
2.6. Implementation in MATLAB Environment
The whole algorithm was implemented in the MATLAB environment, including the
pre-processing of the EEG signal and GSR, reference electrode choice, normalization and
testing the algorithm using the simulation.
The inputs of the algorithm are measured data, selected symmetrical combinations of
electrodes which were examined, position of tags which identify start and end of each film
clip. The output is the table of power differences in symmetrical combinations for selected
film clips.
Classification of Physiological Correlates of Emotions
26
3 RESULTS
In this chapter results are presented. First, illustrative results of power noise
elimination, detection of muscular artifact and blinking, using the scalp surface Laplacian are
described. Then, tables summarizing testing and assessment of algorithm for frontal
asymmetry classification are included.
3.1. Pre-processing of EEG
The following section presents the results and the illustrative waveforms obtained in
the individual steps of the EEG pre-processing.
3.1.1. Reduction of Power Noise Interference
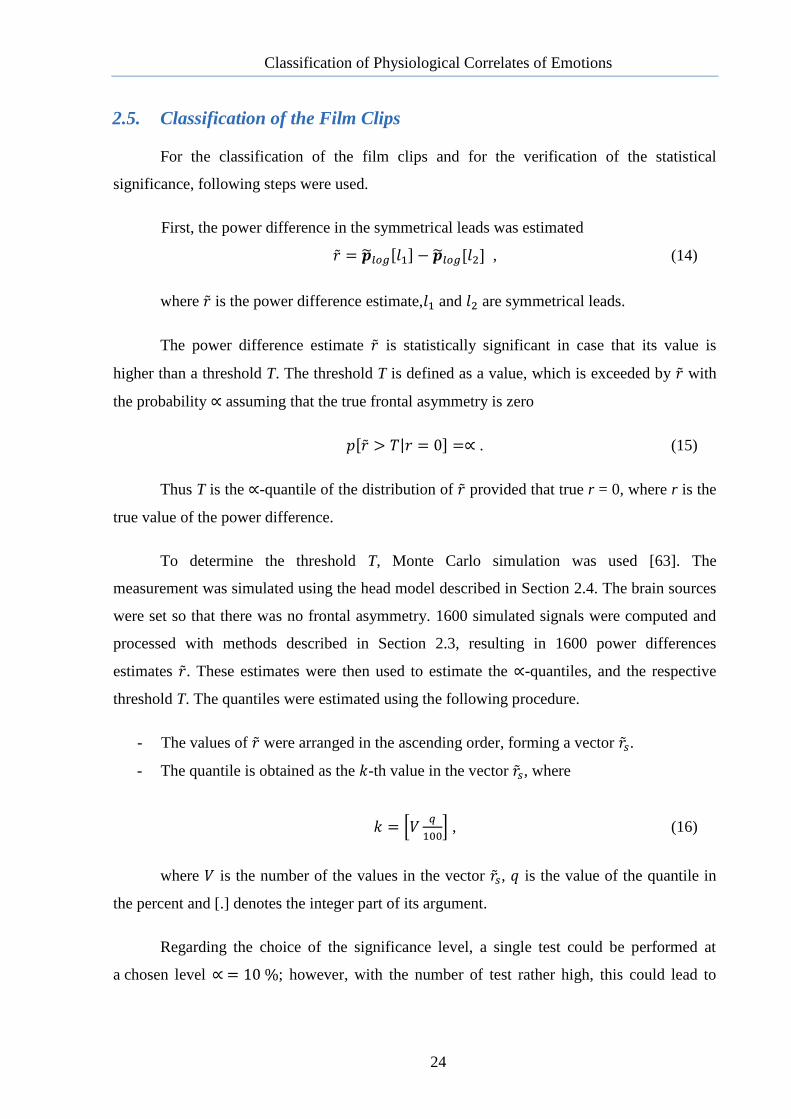
The result of reduction of the power noise interference is visualised in Fig. 9. The
green line denotes the signal with power noise and the blue line denotes the signal without
power noise. The lines are visualised with the offset for better clarity.
Fig. 9 One second long record of the signals with and without the power noise interference.
The first possibility of the visualisation in the time domain is complemented with the
visualisation in the frequency domain using the spectrogram.
14 14.2 14.4 14.6 14.8 15
-100
-50
0
50
EEG with power noise
time [s]
am
plitu
de
[-]
14 14.2 14.4 14.6 14.8 15
-100
-50
0
50
EEG without power noise
time [s]
am
plitu
de
[-]
Classification of Physiological Correlates of Emotions
27
(a) (b)
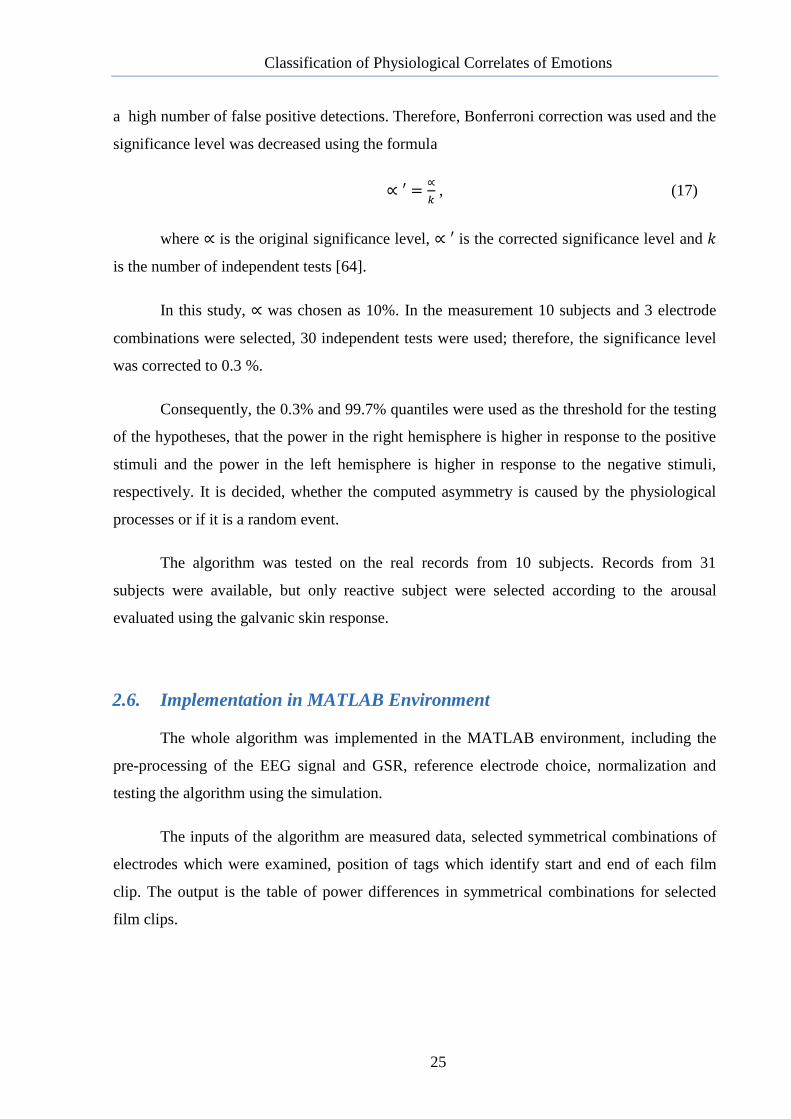
Fig. 10 Spectrogram of the signal (a) with (b) without the power noise interference.
Spectrograms of the signals in Fig. 9 are shown in Fig. 10. In the spectrogram of the
signal with the power noise interference, the high amplitude of 50 Hz frequency is easily
recognisable. After filtering the amplitude of 50 Hz is low, the power noise was removed
successfully.
3.1.2. Detection of Biological Artifacts
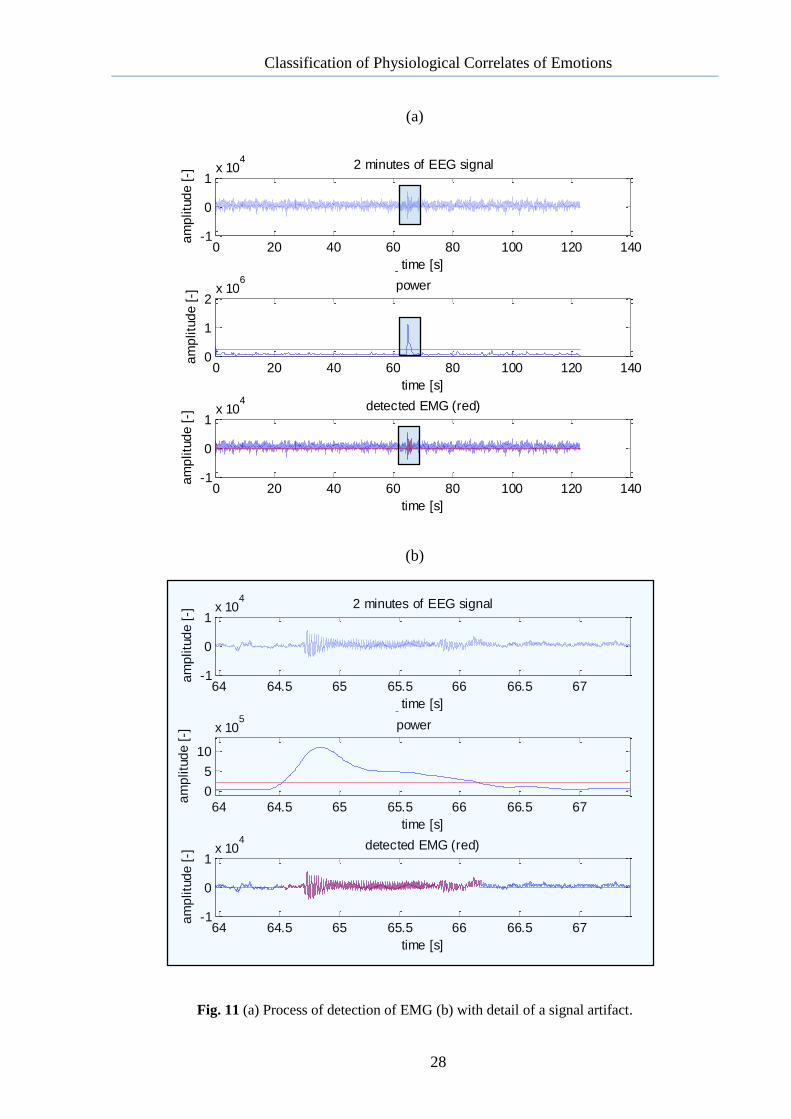
The process of the detection of the muscular artifacts is illustrated in Fig. 11. It shows
a signal from one electrode of one selected subject. The record was obtained during one
whole film clip which lasted for 2 minutes.
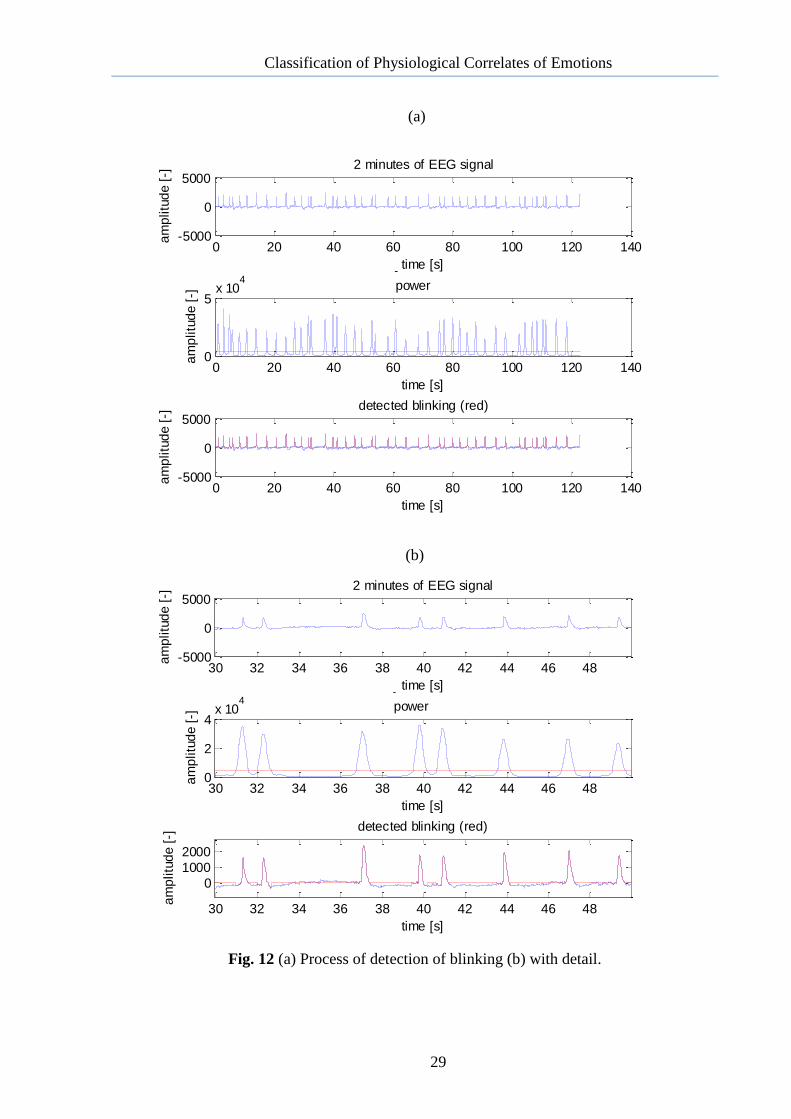
The process of the detection of the blinking is in Fig. 12. Similarly, it shows a signal
from one selected subject, one whole clip, which lasted for 2 minutes, and one selected lead.
The inspection of the detection was performed on the real data from two randomly
selected subjects. Specifically, the detection of biological artifacts was inspected. For the
examination, the records from 8 film clips (each film clip was approximately 2 minutes long)
were selected and the signals from all EEG leads were inspected. A careful inspection
confirmed the correct functionality of the designed algorithm.
20 40 60
10
20
30
40
50
60
Time
Fre
qu
en
cy
(Hz)
20 40 60
10
20
30
40
50
60
Time
Fre
qu
en
cy
(Hz)
20 40 60
10
20
30
40
50
60
Time
Fre
qu
en
cy
(Hz)
20 40 60
10
20
30
40
50
60
Time
Fre
qu
en
cy
(Hz)
Classification of Physiological Correlates of Emotions
28
(a)
(b)
Fig. 11 (a) Process of detection of EMG (b) with detail of a signal artifact.
0 20 40 60 80 100 120 140-1
0
1x 10
42 minutes of EEG signal
time [s]
am
plitu
de
[-]
0 20 40 60 80 100 120 1400
1
2x 10
6envelope of power
time [s]
am
plitu
de
[-]
0 20 40 60 80 100 120 140-1
0
1x 10
4detected EMG (red)
time [s]
am
plitu
de
[-]
64 64.5 65 65.5 66 66.5 67-1
0
1x 10
42 minutes of EEG signal
time [s]
am
plitu
de
[-]
64 64.5 65 65.5 66 66.5 67
0
5
10
x 105
envelope of power
time [s]
am
plitu
de
[-]
64 64.5 65 65.5 66 66.5 67-1
0
1x 10
4detected EMG (red)
time [s]
am
plitu
de
[-]
0 20 40 60 80 100 120 140-1
0
1x 10
42 minutes of EEG signal
time [s]
am
plitu
de
[-]
0 20 40 60 80 100 120 1400
1
2x 10
6envelope of power
time [s]
am
plitu
de
[-]
0 20 40 60 80 100 120 140-1
0
1x 10
4detected EMG (red)
time [s]
am
plitu
de
[-]
0 20 40 60 80 100 120 140-1
0
1x 10
42 minutes of EEG signal
time [s]
am
plitu
de
[-]
0 20 40 60 80 100 120 1400
1
2x 10
6envelope of power
time [s]
am
plitu
de
[-]
0 20 40 60 80 100 120 140-1
0
1x 10
4detected EMG (red)
time [s]
am
plitu
de
[-]
Classification of Physiological Correlates of Emotions
29
(a)
(b)
Fig. 12 (a) Process of detection of blinking (b) with detail.
0 20 40 60 80 100 120 140-5000
0
50002 minutes of EEG signal
time [s]
am
plitu
de
[-]
0 20 40 60 80 100 120 1400
5x 10
4envelope of power
time [s]
am
plitu
de
[-]
0 20 40 60 80 100 120 140-5000
0
5000detected blinking (red)
time [s]
am
plitu
de
[-]
30 32 34 36 38 40 42 44 46 48-5000
0
50002 minutes of EEG signal
time [s]
am
plitu
de
[-]
30 32 34 36 38 40 42 44 46 480
2
4x 10
4envelope of power
time [s]
am
plitu
de
[-]
30 32 34 36 38 40 42 44 46 48
0
1000
2000
detected blinking (red)
time [s]
am
plitu
de
[-]
0 20 40 60 80 100 120 140-1
0
1x 10
42 minutes of EEG signal
time [s]
am
plitu
de
[-]
0 20 40 60 80 100 120 1400
1
2x 10
6envelope of power
time [s]
am
plitu
de
[-]
0 20 40 60 80 100 120 140-1
0
1x 10
4detected EMG (red)
time [s]
am
plitu
de
[-]
0 20 40 60 80 100 120 140-1
0
1x 10
42 minutes of EEG signal
time [s]
am
plitu
de
[-]
0 20 40 60 80 100 120 1400
1
2x 10
6envelope of power
time [s]
am
plitu
de
[-]
0 20 40 60 80 100 120 140-1
0
1x 10
4detected EMG (red)
time [s]
am
plitu
de
[-]
Classification of Physiological Correlates of Emotions
30
(a)
(b)
Fig. 13 (a) reactive response to the film clip (b) no response to the film clip.
0 50 100 150 200-5
0
5
10
15x 10
-5
time [s]
GS
R [
S]
0 50 100 150 200-2
0
2
4
6x 10
-8
time [s]
GS
R [
S]
0 50 100 150 200-5
0
5
10
15x 10
-5
time [s]
GS
R [
S]
0 50 100 150 200-2
0
2
4
6x 10
-8
time [s]
GS
R [
S]
Classification of Physiological Correlates of Emotions
31
3.2. Evaluation of Reactivity
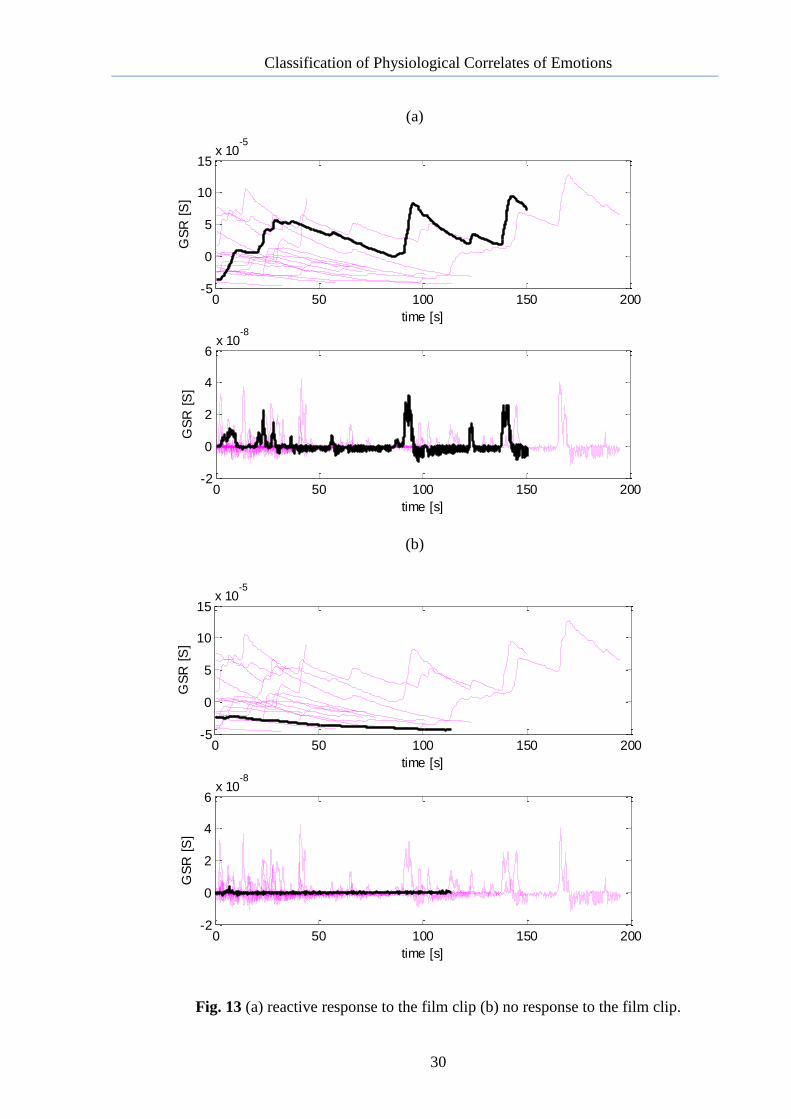
In Fig. 13 the GSR from all selected film clips is visualized in one graph and the
response to the specific clip is highlighted. Fig. 13 shows the difference between reactive and
unreactive responses to the clip. If the subject is aroused by the film clip, the GSR is
increased. The second picture in Fig. 13 is the differential of the GSR. There are noticeable
peaks created as the reactive response. In contrast, third and fourth picture in Fig. 13 shows
how the response to the film clip looks with no arousal. The amplitude of the GSR decreases
during the film clip and no noticeable changes in the amplitude appears.
The film clips with the reactive response were selected from the available records to
increase the chance of frontal asymmetry detection. Only film clips which were positive or
negative in general were used. Sometimes the reactive response occurred in case of neutral
clip.
3.3. Reference Electrode Choice
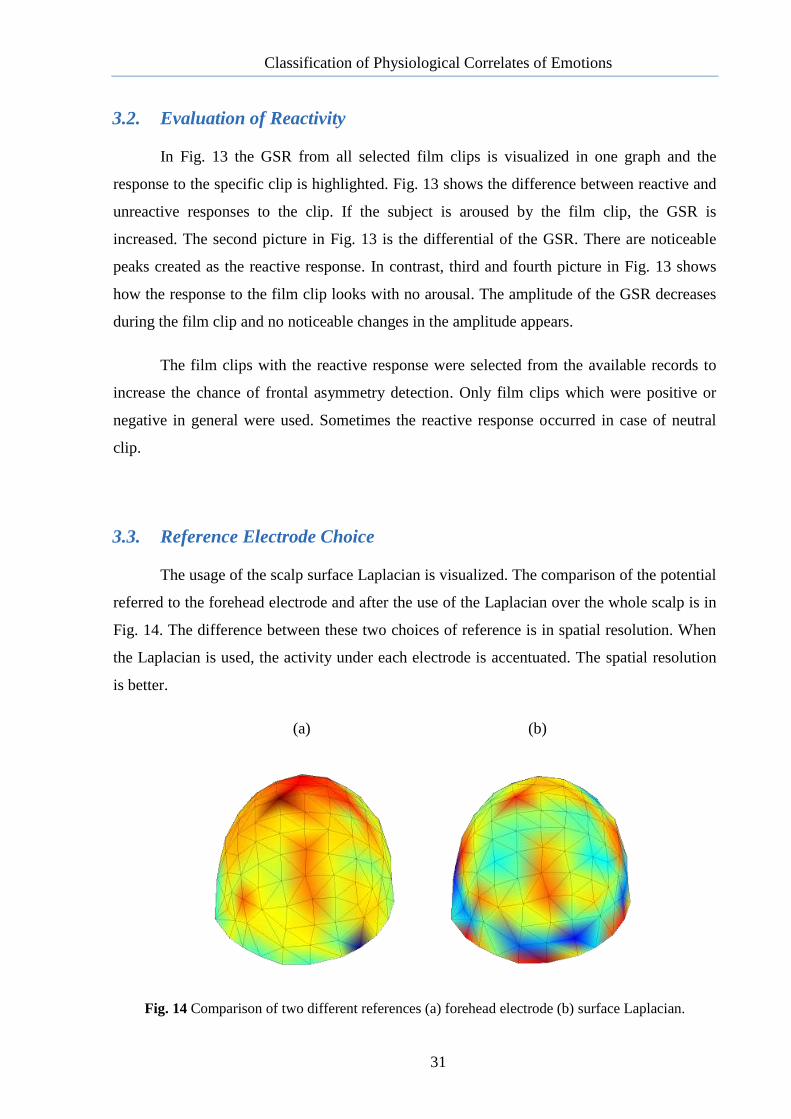
The usage of the scalp surface Laplacian is visualized. The comparison of the potential
referred to the forehead electrode and after the use of the Laplacian over the whole scalp is in
Fig. 14. The difference between these two choices of reference is in spatial resolution. When
the Laplacian is used, the activity under each electrode is accentuated. The spatial resolution
is better.
(a) (b)
Fig. 14 Comparison of two different references (a) forehead electrode (b) surface Laplacian.
Classification of Physiological Correlates of Emotions
32
3.4. Testing and Validation of the Algorithm
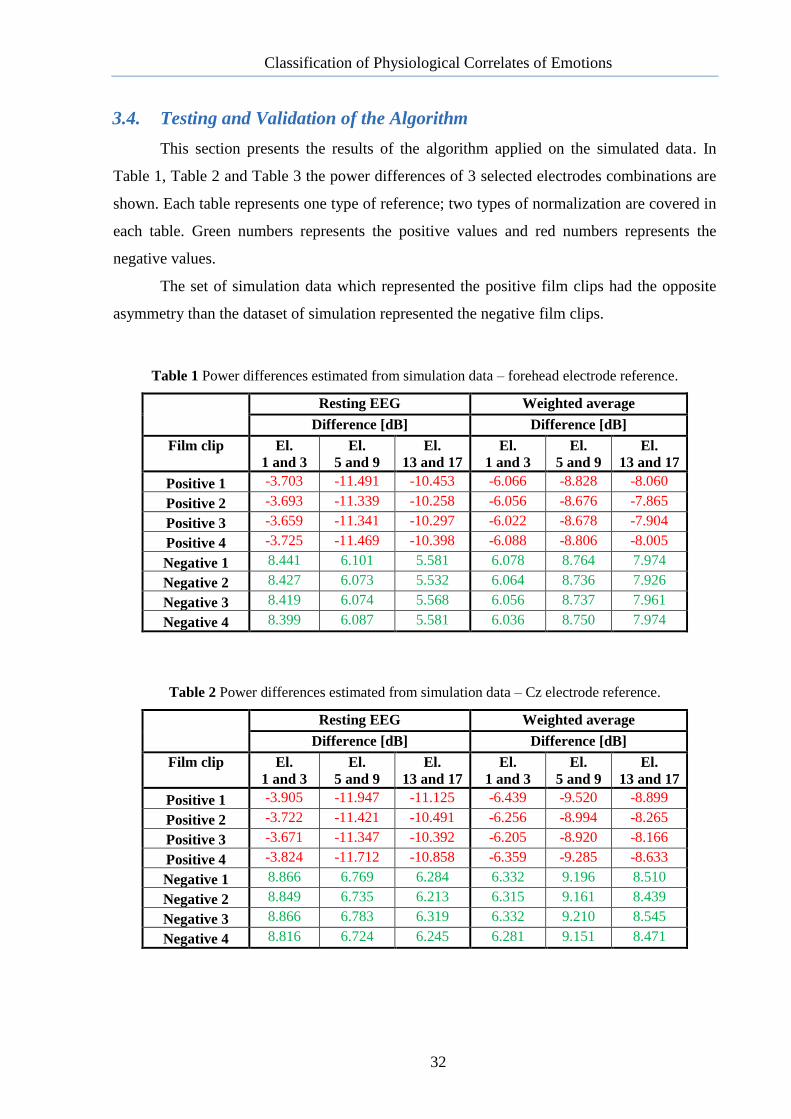
This section presents the results of the algorithm applied on the simulated data. In
Table 1, Table 2 and Table 3 the power differences of 3 selected electrodes combinations are
shown. Each table represents one type of reference; two types of normalization are covered in
each table. Green numbers represents the positive values and red numbers represents the
negative values.
The set of simulation data which represented the positive film clips had the opposite
asymmetry than the dataset of simulation represented the negative film clips.
Table 1 Power differences estimated from simulation data – forehead electrode reference.
Resting EEG Weighted average
Difference [dB] Difference [dB]
Film clip El.
1 and 3
El.
5 and 9
El.
13 and 17
El.
1 and 3
El.
5 and 9
El.
13 and 17
Positive 1 -3.703 -11.491 -10.453 -6.066 -8.828 -8.060
Positive 2 -3.693 -11.339 -10.258 -6.056 -8.676 -7.865
Positive 3 -3.659 -11.341 -10.297 -6.022 -8.678 -7.904
Positive 4 -3.725 -11.469 -10.398 -6.088 -8.806 -8.005
Negative 1 8.441 6.101 5.581 6.078 8.764 7.974
Negative 2 8.427 6.073 5.532 6.064 8.736 7.926
Negative 3 8.419 6.074 5.568 6.056 8.737 7.961
Negative 4 8.399 6.087 5.581 6.036 8.750 7.974
Table 2 Power differences estimated from simulation data – Cz electrode reference.
Resting EEG Weighted average
Difference [dB] Difference [dB]
Film clip El.
1 and 3
El.
5 and 9
El.
13 and 17
El.
1 and 3
El.
5 and 9
El.
13 and 17
Positive 1 -3.905 -11.947 -11.125 -6.439 -9.520 -8.899
Positive 2 -3.722 -11.421 -10.491 -6.256 -8.994 -8.265
Positive 3 -3.671 -11.347 -10.392 -6.205 -8.920 -8.166
Positive 4 -3.824 -11.712 -10.858 -6.359 -9.285 -8.633
Negative 1 8.866 6.769 6.284 6.332 9.196 8.510
Negative 2 8.849 6.735 6.213 6.315 9.161 8.439
Negative 3 8.866 6.783 6.319 6.332 9.210 8.545
Negative 4 8.816 6.724 6.245 6.281 9.151 8.471
Classification of Physiological Correlates of Emotions
33
Table 3 Power differences estimated from simulation data – surface Laplacian reference.
Resting EEG Weighted average
Difference [dB] Difference [dB]
Film clip El.
1 and 3
El.
5 and 9
El.
13 and 17
El.
1 and 3
El.
5 and 9
El.
13 and 17
Positive 1 -3.652 -10.369 -9.900 -0.962 -8.824 -8.097
Positive 2 -3.655 -10.262 -9.668 -0.965 -8.716 -7.865
Positive 3 -3.660 -10.240 -9.646 -0.970 -8.695 -7.844
Positive 4 -3.544 -10.292 -9.744 -0.855 -8.746 -7.942
Negative 1 1.779 7.225 6.150 0.911 8.770 7.953
Negative 2 1.701 7.200 6.075 0.989 8.746 7.878
Negative 3 1.730 7.180 6.149 0.959 8.726 7.952
Negative 4 1.797 7.194 6.163 0.892 8.739 7.965
Combinations of all used references and normalization were assessed. In each case the
power difference of “positive film clips” has the opposite polarity than the power difference
of “negative film clips”.
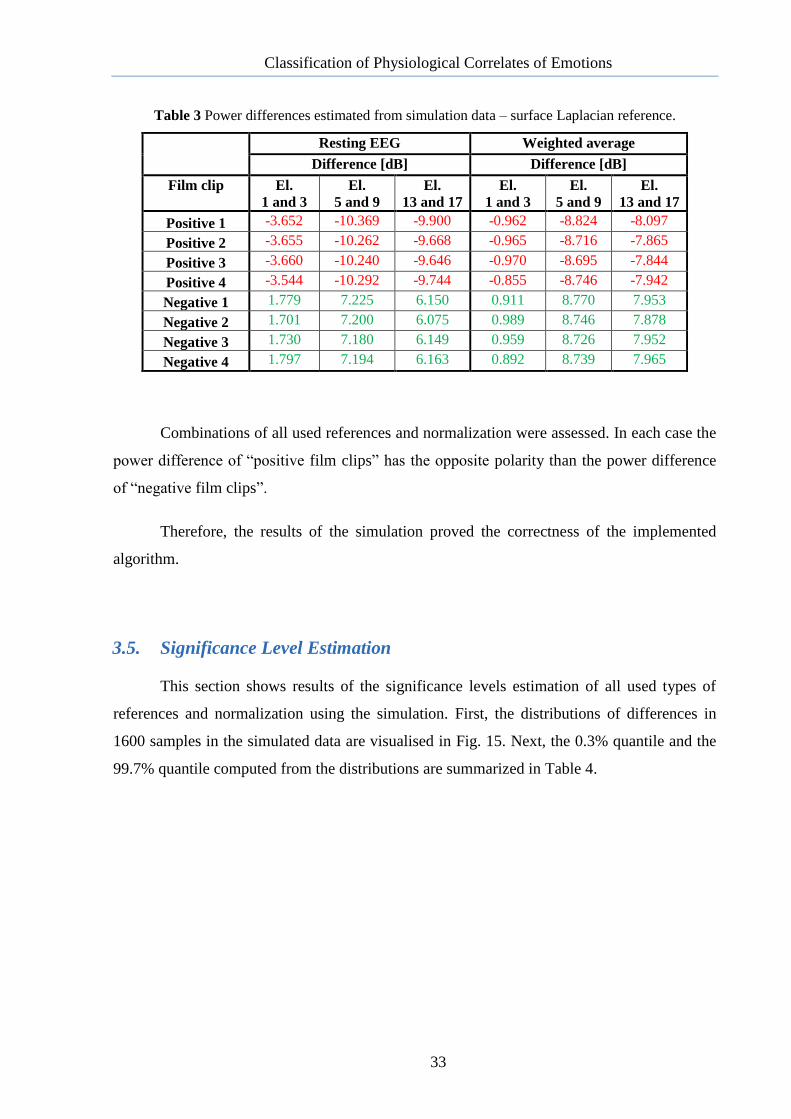
Therefore, the results of the simulation proved the correctness of the implemented
algorithm.
3.5. Significance Level Estimation
This section shows results of the significance levels estimation of all used types of
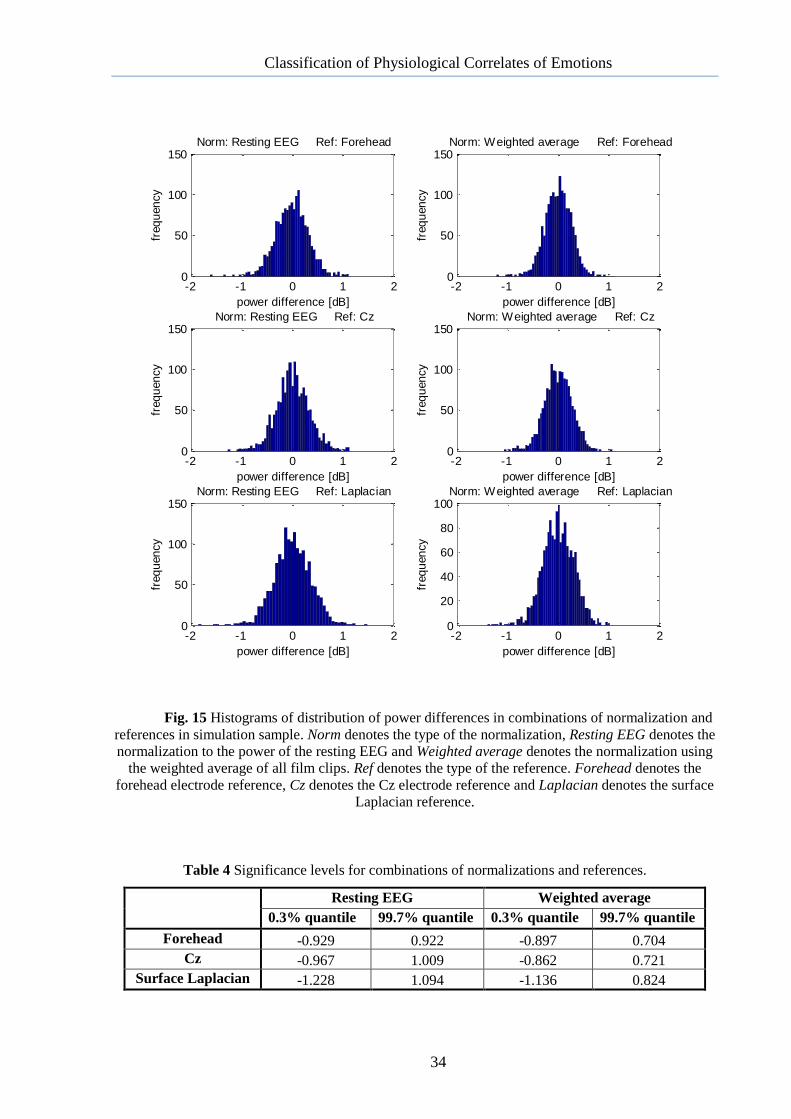
references and normalization using the simulation. First, the distributions of differences in
1600 samples in the simulated data are visualised in Fig. 15. Next, the 0.3% quantile and the
99.7% quantile computed from the distributions are summarized in Table 4.
Classification of Physiological Correlates of Emotions
34
Fig. 15 Histograms of distribution of power differences in combinations of normalization and
references in simulation sample. Norm denotes the type of the normalization, Resting EEG denotes the
normalization to the power of the resting EEG and Weighted average denotes the normalization using
the weighted average of all film clips. Ref denotes the type of the reference. Forehead denotes the
forehead electrode reference, Cz denotes the Cz electrode reference and Laplacian denotes the surface
Laplacian reference.
Table 4 Significance levels for combinations of normalizations and references.
Resting EEG Weighted average
0.3% quantile 99.7% quantile 0.3% quantile 99.7% quantile
Forehead -0.929 0.922 -0.897 0.704
Cz -0.967 1.009 -0.862 0.721
Surface Laplacian -1.228 1.094 -1.136 0.824
-2 -1 0 1 20
50
100
150
power difference [dB]
freq
uen
cy
Norm: Resting EEG Ref: Forehead
-2 -1 0 1 20
50
100
150
power difference [dB]
freq
uen
cy
Norm: Weighted average Ref: Forehead
-2 -1 0 1 20
50
100
150
power difference [dB]
freq
uen
cy
Norm: Resting EEG Ref: Cz
-2 -1 0 1 20
50
100
150
power difference [dB]
freq
uen
cy
Norm: Weighted average Ref: Cz
-2 -1 0 1 20
50
100
150
power difference [dB]
freq
uen
cy
Norm: Resting EEG Ref: Laplacian
-2 -1 0 1 20
20
40
60
80
100
power difference [dB]
freq
uen
cy
Norm: Weighted average Ref: Laplacian
Classification of Physiological Correlates of Emotions
35
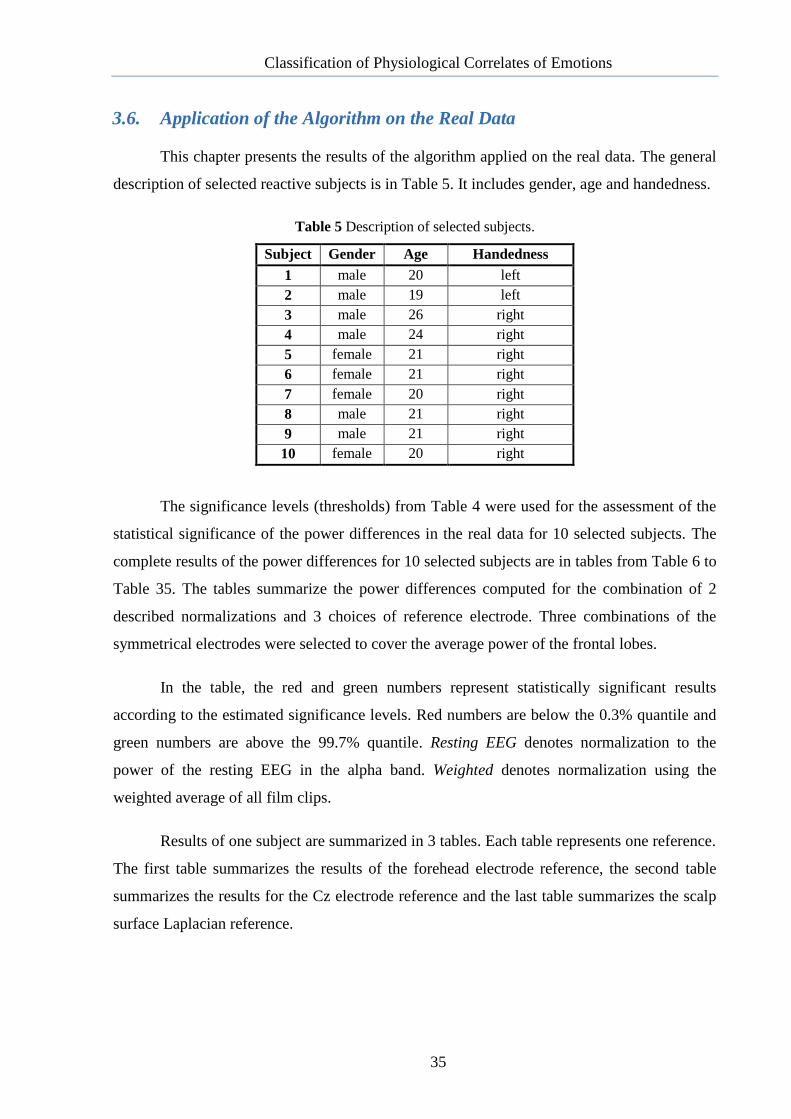
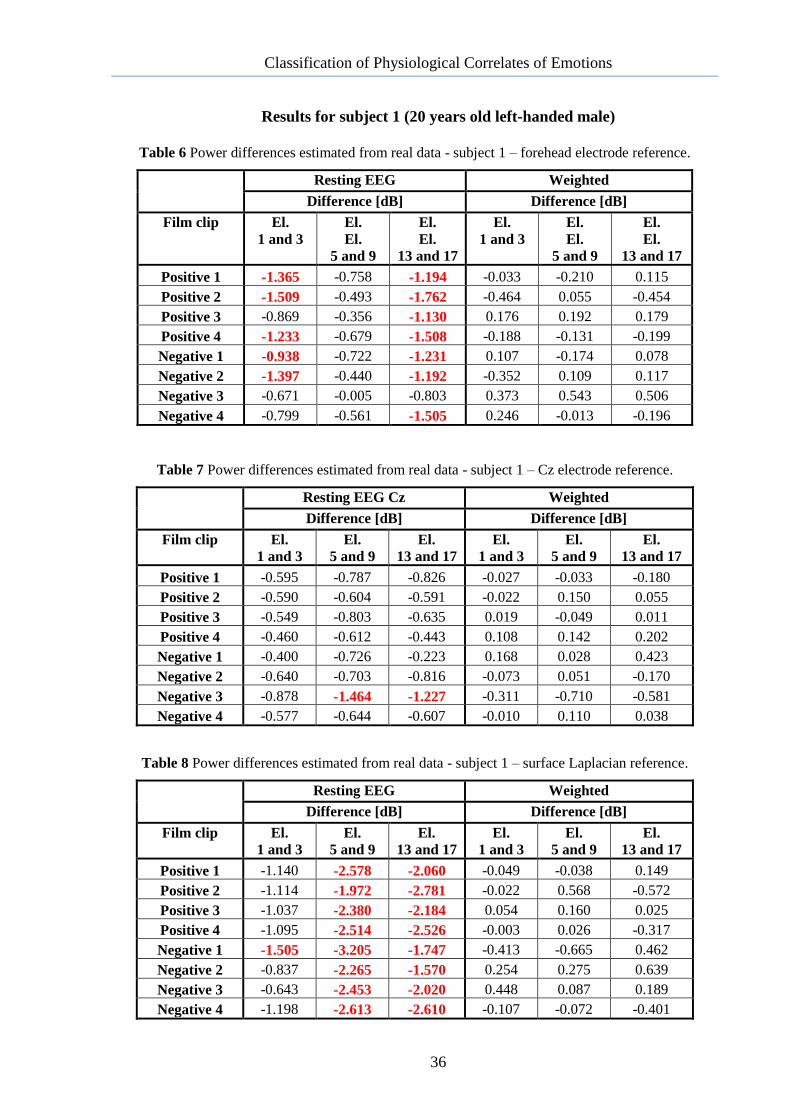
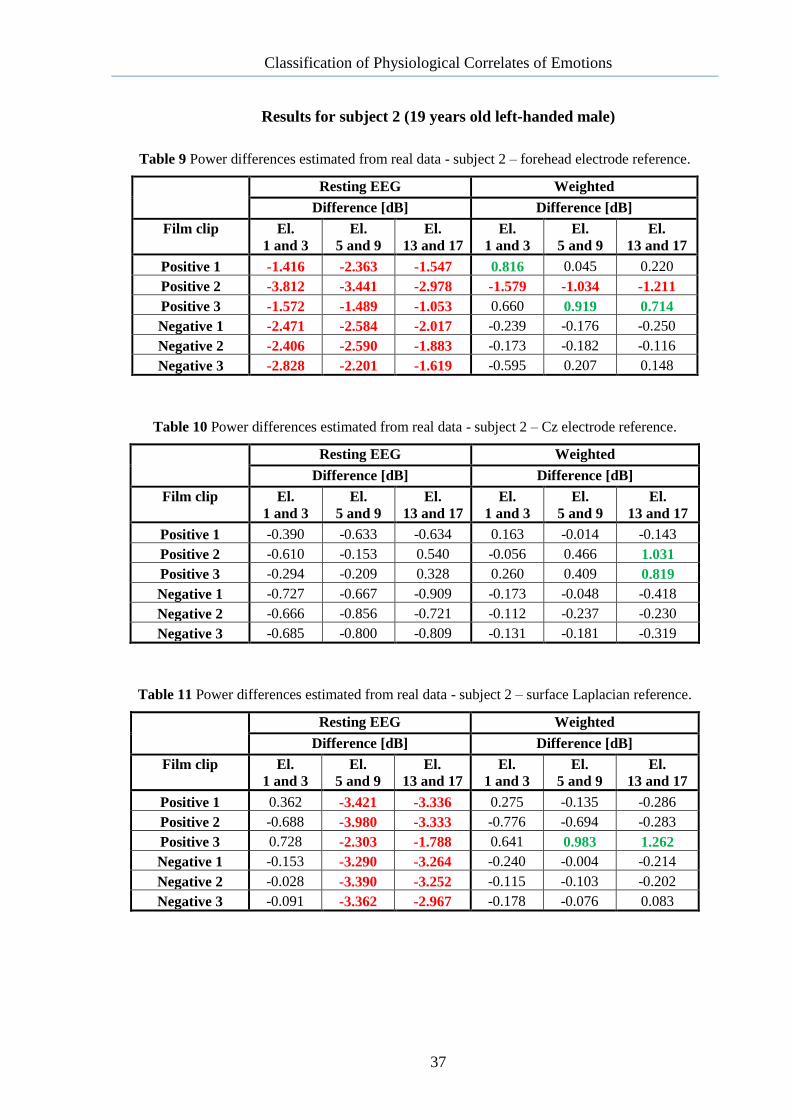
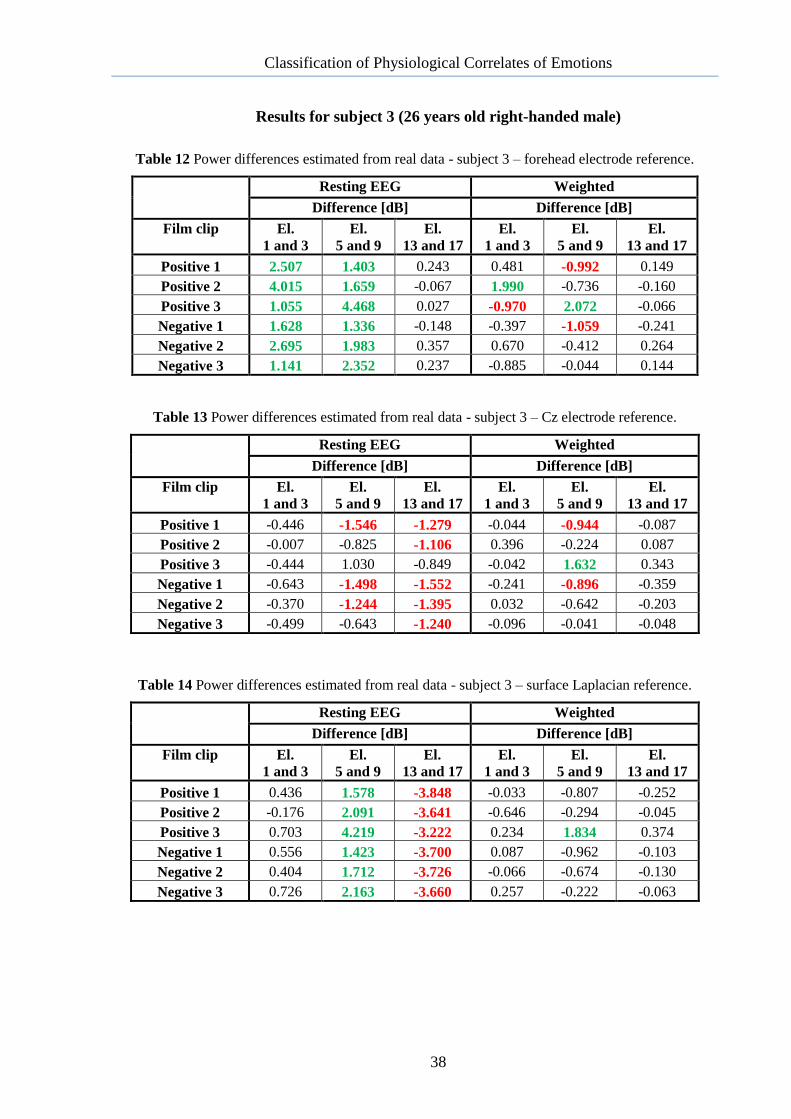
3.6. Application of the Algorithm on the Real Data
This chapter presents the results of the algorithm applied on the real data. The general
description of selected reactive subjects is in Table 5. It includes gender, age and handedness.
Table 5 Description of selected subjects.
Subject Gender Age Handedness
1 male 20 left
2 male 19 left
3 male 26 right
4 male 24 right
5 female 21 right
6 female 21 right
7 female 20 right
8 male 21 right
9 male 21 right
10 female 20 right
The significance levels (thresholds) from Table 4 were used for the assessment of the
statistical significance of the power differences in the real data for 10 selected subjects. The
complete results of the power differences for 10 selected subjects are in tables from Table 6 to
Table 35. The tables summarize the power differences computed for the combination of 2
described normalizations and 3 choices of reference electrode. Three combinations of the
symmetrical electrodes were selected to cover the average power of the frontal lobes.
In the table, the red and green numbers represent statistically significant results
according to the estimated significance levels. Red numbers are below the 0.3% quantile and
green numbers are above the 99.7% quantile. Resting EEG denotes normalization to the
power of the resting EEG in the alpha band. Weighted denotes normalization using the
weighted average of all film clips.
Results of one subject are summarized in 3 tables. Each table represents one reference.
The first table summarizes the results of the forehead electrode reference, the second table
summarizes the results for the Cz electrode reference and the last table summarizes the scalp
surface Laplacian reference.
Classification of Physiological Correlates of Emotions
36
Results for subject 1 (20 years old left-handed male)
Table 6 Power differences estimated from real data - subject 1 – forehead electrode reference.
Resting EEG Weighted
Difference [dB] Difference [dB]
Film clip El.
1 and 3
El.
El.
5 and 9
El.
El.
13 and 17
El.
1 and 3
El.
El.
5 and 9
El.
El.
13 and 17
Positive 1 -1.365 -0.758 -1.194 -0.033 -0.210 0.115
Positive 2 -1.509 -0.493 -1.762 -0.464 0.055 -0.454
Positive 3 -0.869 -0.356 -1.130 0.176 0.192 0.179
Positive 4 -1.233 -0.679 -1.508 -0.188 -0.131 -0.199
Negative 1 -0.938 -0.722 -1.231 0.107 -0.174 0.078
Negative 2 -1.397 -0.440 -1.192 -0.352 0.109 0.117
Negative 3 -0.671 -0.005 -0.803 0.373 0.543 0.506
Negative 4 -0.799 -0.561 -1.505 0.246 -0.013 -0.196
Table 7 Power differences estimated from real data - subject 1 – Cz electrode reference.
Resting EEG Cz Weighted
Difference [dB] Difference [dB]
Film clip El.
1 and 3
El.
5 and 9
El.
13 and 17
El.
1 and 3
El.
5 and 9
El.
13 and 17
Positive 1 -0.595 -0.787 -0.826 -0.027 -0.033 -0.180
Positive 2 -0.590 -0.604 -0.591 -0.022 0.150 0.055
Positive 3 -0.549 -0.803 -0.635 0.019 -0.049 0.011
Positive 4 -0.460 -0.612 -0.443 0.108 0.142 0.202
Negative 1 -0.400 -0.726 -0.223 0.168 0.028 0.423
Negative 2 -0.640 -0.703 -0.816 -0.073 0.051 -0.170
Negative 3 -0.878 -1.464 -1.227 -0.311 -0.710 -0.581
Negative 4 -0.577 -0.644 -0.607 -0.010 0.110 0.038
Table 8 Power differences estimated from real data - subject 1 – surface Laplacian reference.
Resting EEG Weighted
Difference [dB] Difference [dB]
Film clip El.
1 and 3
El.
5 and 9
El.
13 and 17
El.
1 and 3
El.
5 and 9
El.
13 and 17
Positive 1 -1.140 -2.578 -2.060 -0.049 -0.038 0.149
Positive 2 -1.114 -1.972 -2.781 -0.022 0.568 -0.572
Positive 3 -1.037 -2.380 -2.184 0.054 0.160 0.025
Positive 4 -1.095 -2.514 -2.526 -0.003 0.026 -0.317
Negative 1 -1.505 -3.205 -1.747 -0.413 -0.665 0.462
Negative 2 -0.837 -2.265 -1.570 0.254 0.275 0.639
Negative 3 -0.643 -2.453 -2.020 0.448 0.087 0.189
Negative 4 -1.198 -2.613 -2.610 -0.107 -0.072 -0.401
Classification of Physiological Correlates of Emotions
37
Results for subject 2 (19 years old left-handed male)
Table 9 Power differences estimated from real data - subject 2 – forehead electrode reference.
Resting EEG Weighted
Difference [dB] Difference [dB]
Film clip El.
1 and 3
El.
5 and 9
El.
13 and 17
El.
1 and 3
El.
5 and 9
El.
13 and 17
Positive 1 -1.416 -2.363 -1.547 0.816 0.045 0.220
Positive 2 -3.812 -3.441 -2.978 -1.579 -1.034 -1.211
Positive 3 -1.572 -1.489 -1.053 0.660 0.919 0.714
Negative 1 -2.471 -2.584 -2.017 -0.239 -0.176 -0.250
Negative 2 -2.406 -2.590 -1.883 -0.173 -0.182 -0.116
Negative 3 -2.828 -2.201 -1.619 -0.595 0.207 0.148
Table 10 Power differences estimated from real data - subject 2 – Cz electrode reference.
Resting EEG Weighted
Difference [dB] Difference [dB]
Film clip El.
1 and 3
El.
5 and 9
El.
13 and 17
El.
1 and 3
El.
5 and 9
El.
13 and 17
Positive 1 -0.390 -0.633 -0.634 0.163 -0.014 -0.143
Positive 2 -0.610 -0.153 0.540 -0.056 0.466 1.031
Positive 3 -0.294 -0.209 0.328 0.260 0.409 0.819
Negative 1 -0.727 -0.667 -0.909 -0.173 -0.048 -0.418
Negative 2 -0.666 -0.856 -0.721 -0.112 -0.237 -0.230
Negative 3 -0.685 -0.800 -0.809 -0.131 -0.181 -0.319
Table 11 Power differences estimated from real data - subject 2 – surface Laplacian reference.
Resting EEG Weighted
Difference [dB] Difference [dB]
Film clip El.
1 and 3
El.
5 and 9
El.
13 and 17
El.
1 and 3
El.
5 and 9
El.
13 and 17
Positive 1 0.362 -3.421 -3.336 0.275 -0.135 -0.286
Positive 2 -0.688 -3.980 -3.333 -0.776 -0.694 -0.283
Positive 3 0.728 -2.303 -1.788 0.641 0.983 1.262
Negative 1 -0.153 -3.290 -3.264 -0.240 -0.004 -0.214
Negative 2 -0.028 -3.390 -3.252 -0.115 -0.103 -0.202
Negative 3 -0.091 -3.362 -2.967 -0.178 -0.076 0.083
Classification of Physiological Correlates of Emotions
38
Results for subject 3 (26 years old right-handed male)
Table 12 Power differences estimated from real data - subject 3 – forehead electrode reference.
Resting EEG Weighted
Difference [dB] Difference [dB]
Film clip El.
1 and 3
El.
5 and 9
El.
13 and 17
El.
1 and 3
El.
5 and 9
El.
13 and 17
Positive 1 2.507 1.403 0.243 0.481 -0.992 0.149
Positive 2 4.015 1.659 -0.067 1.990 -0.736 -0.160
Positive 3 1.055 4.468 0.027 -0.970 2.072 -0.066
Negative 1 1.628 1.336 -0.148 -0.397 -1.059 -0.241
Negative 2 2.695 1.983 0.357 0.670 -0.412 0.264
Negative 3 1.141 2.352 0.237 -0.885 -0.044 0.144
Table 13 Power differences estimated from real data - subject 3 – Cz electrode reference.
Resting EEG Weighted
Difference [dB] Difference [dB]
Film clip El.
1 and 3
El.
5 and 9
El.
13 and 17
El.
1 and 3
El.
5 and 9
El.
13 and 17
Positive 1 -0.446 -1.546 -1.279 -0.044 -0.944 -0.087
Positive 2 -0.007 -0.825 -1.106 0.396 -0.224 0.087
Positive 3 -0.444 1.030 -0.849 -0.042 1.632 0.343
Negative 1 -0.643 -1.498 -1.552 -0.241 -0.896 -0.359
Negative 2 -0.370 -1.244 -1.395 0.032 -0.642 -0.203
Negative 3 -0.499 -0.643 -1.240 -0.096 -0.041 -0.048
Table 14 Power differences estimated from real data - subject 3 – surface Laplacian reference.
Resting EEG Weighted
Difference [dB] Difference [dB]
Film clip El.
1 and 3
El.
5 and 9
El.
13 and 17
El.
1 and 3
El.
5 and 9
El.
13 and 17
Positive 1 0.436 1.578 -3.848 -0.033 -0.807 -0.252
Positive 2 -0.176 2.091 -3.641 -0.646 -0.294 -0.045
Positive 3 0.703 4.219 -3.222 0.234 1.834 0.374
Negative 1 0.556 1.423 -3.700 0.087 -0.962 -0.103
Negative 2 0.404 1.712 -3.726 -0.066 -0.674 -0.130
Negative 3 0.726 2.163 -3.660 0.257 -0.222 -0.063

Classification of Physiological Correlates of Emotions
39
Results for subject 4 (24 years old right-handed male)
Table 15 Power differences estimated from real data - subject 4 – forehead electrode reference.
Resting EEG Weighted
Difference [dB] Difference [dB]
Film clip El.
1 and 3
El.
5 and 9
El.
13 and 17
El.
1 and 3
El.
5 and 9
El.
13 and 17
Positive 1 1.785 -0.799 -0.386 0.388 -0.131 0.018
Positive 2 1.163 -0.677 -0.343 -0.234 -0.009 0.062
Positive 3 1.302 -0.741 -0.436 -0.096 -0.074 -0.032
Negative 1 2.044 -0.047 -0.143 0.647 0.620 0.261
Negative 2 1.171 -1.150 -0.611 -0.226 -0.483 -0.206
Negative 3 1.201 -0.522 -0.410 -0.197 0.145 -0.005
Table 16 Power differences estimated from real data - subject 4 – Cz electrode reference.
Resting EEG Weighted
Difference [dB] Difference [dB]
Film clip El.
1 and 3
El.
5 and 9
El.
13 and 17
El.
1 and 3
El.
5 and 9
El.
13 and 17
Positive 1 -1.215 -0.908 -1.681 -0.191 -0.260 -0.489
Positive 2 -1.104 -0.985 -1.627 -0.080 -0.338 -0.435
Positive 3 -0.970 -0.697 -1.192 0.054 -0.050 0.000
Negative 1 -0.942 -0.724 -1.185 0.082 -0.076 0.007
Negative 2 -0.945 -0.366 -0.843 0.079 0.281 0.349
Negative 3 -0.990 -0.407 -0.881 0.034 0.241 0.312
Table 17 Power differences estimated from real data - subject 4 – surface Laplacian reference.
Resting EEG Weighted
Difference [dB] Difference [dB]
Film clip El.
1 and 3
El.
5 and 9
El.
13 and 17
El.
1 and 3
El.
5 and 9
El.
13 and 17
Positive 1 -3.050 -1.508 -3.031 -0.158 -0.264 -0.206
Positive 2 -2.870 -1.622 -2.885 0.023 -0.378 -0.059
Positive 3 -2.860 -1.318 -2.851 0.033 -0.074 -0.026
Negative 1 -3.162 -0.822 -2.586 -0.269 0.422 0.239
Negative 2 -3.012 -1.324 -2.958 -0.120 -0.080 -0.133
Negative 3 -2.697 -0.987 -2.677 0.195 0.257 0.149
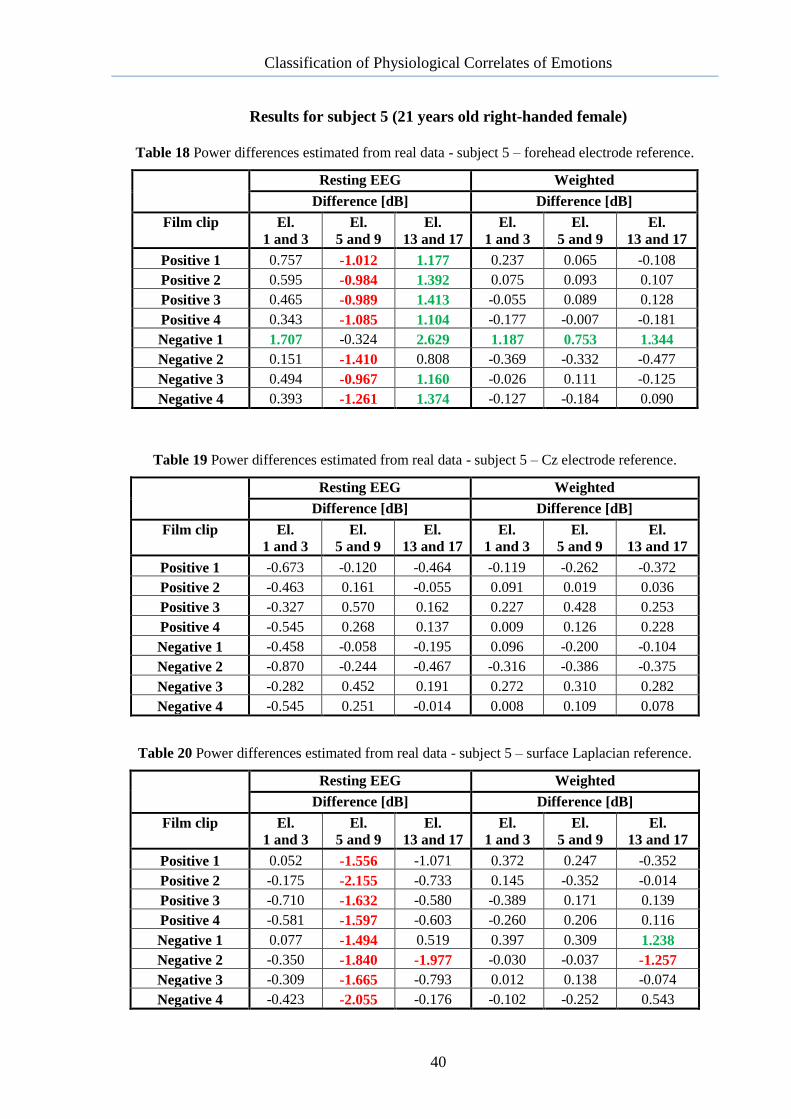
Classification of Physiological Correlates of Emotions
40
Results for subject 5 (21 years old right-handed female)
Table 18 Power differences estimated from real data - subject 5 – forehead electrode reference.
Resting EEG Weighted
Difference [dB] Difference [dB]
Film clip El.
1 and 3
El.
5 and 9
El.
13 and 17
El.
1 and 3
El.
5 and 9
El.
13 and 17
Positive 1 0.757 -1.012 1.177 0.237 0.065 -0.108
Positive 2 0.595 -0.984 1.392 0.075 0.093 0.107
Positive 3 0.465 -0.989 1.413 -0.055 0.089 0.128
Positive 4 0.343 -1.085 1.104 -0.177 -0.007 -0.181
Negative 1 1.707 -0.324 2.629 1.187 0.753 1.344
Negative 2 0.151 -1.410 0.808 -0.369 -0.332 -0.477
Negative 3 0.494 -0.967 1.160 -0.026 0.111 -0.125
Negative 4 0.393 -1.261 1.374 -0.127 -0.184 0.090
Table 19 Power differences estimated from real data - subject 5 – Cz electrode reference.
Resting EEG Weighted
Difference [dB] Difference [dB]
Film clip El.
1 and 3
El.
5 and 9
El.
13 and 17
El.
1 and 3
El.
5 and 9
El.
13 and 17
Positive 1 -0.673 -0.120 -0.464 -0.119 -0.262 -0.372
Positive 2 -0.463 0.161 -0.055 0.091 0.019 0.036
Positive 3 -0.327 0.570 0.162 0.227 0.428 0.253
Positive 4 -0.545 0.268 0.137 0.009 0.126 0.228
Negative 1 -0.458 -0.058 -0.195 0.096 -0.200 -0.104
Negative 2 -0.870 -0.244 -0.467 -0.316 -0.386 -0.375
Negative 3 -0.282 0.452 0.191 0.272 0.310 0.282
Negative 4 -0.545 0.251 -0.014 0.008 0.109 0.078
Table 20 Power differences estimated from real data - subject 5 – surface Laplacian reference.
Resting EEG Weighted
Difference [dB] Difference [dB]
Film clip El.
1 and 3
El.
5 and 9
El.
13 and 17
El.
1 and 3
El.
5 and 9
El.
13 and 17
Positive 1 0.052 -1.556 -1.071 0.372 0.247 -0.352
Positive 2 -0.175 -2.155 -0.733 0.145 -0.352 -0.014
Positive 3 -0.710 -1.632 -0.580 -0.389 0.171 0.139
Positive 4 -0.581 -1.597 -0.603 -0.260 0.206 0.116
Negative 1 0.077 -1.494 0.519 0.397 0.309 1.238
Negative 2 -0.350 -1.840 -1.977 -0.030 -0.037 -1.257
Negative 3 -0.309 -1.665 -0.793 0.012 0.138 -0.074
Negative 4 -0.423 -2.055 -0.176 -0.102 -0.252 0.543
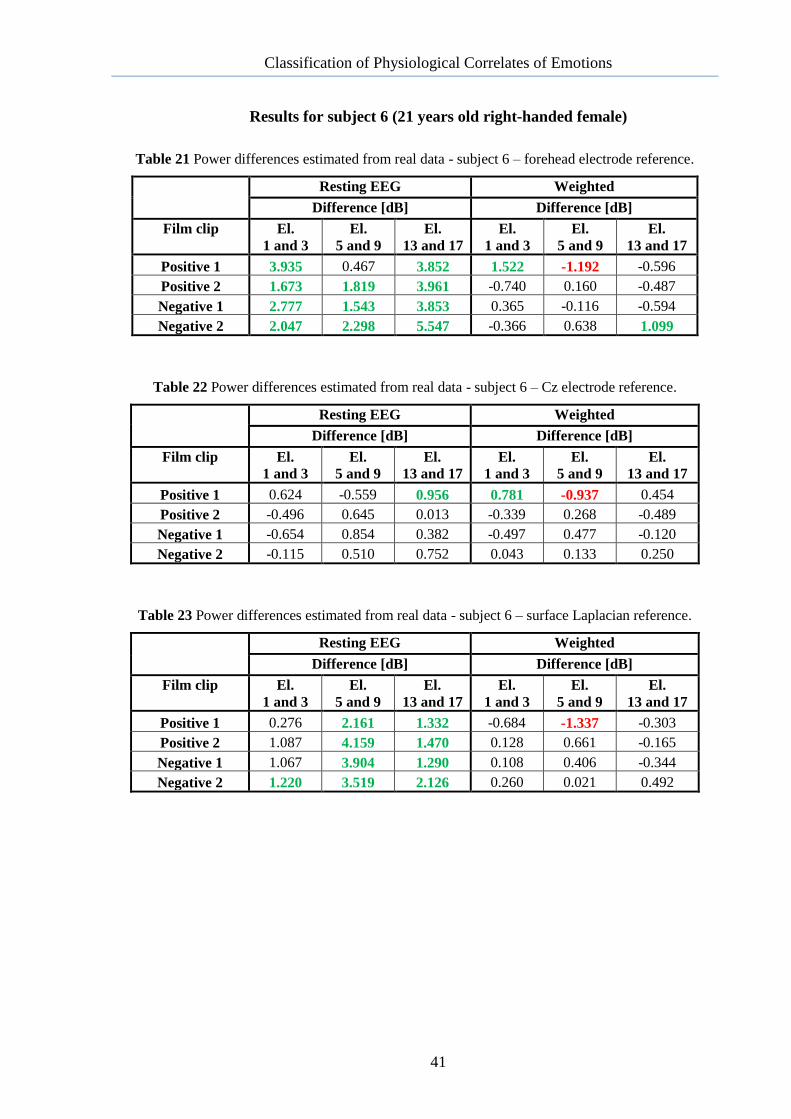
Classification of Physiological Correlates of Emotions
41
Results for subject 6 (21 years old right-handed female)
Table 21 Power differences estimated from real data - subject 6 – forehead electrode reference.
Resting EEG Weighted
Difference [dB] Difference [dB]
Film clip El.
1 and 3
El.
5 and 9
El.
13 and 17
El.
1 and 3
El.
5 and 9
El.
13 and 17
Positive 1 3.935 0.467 3.852 1.522 -1.192 -0.596
Positive 2 1.673 1.819 3.961 -0.740 0.160 -0.487
Negative 1 2.777 1.543 3.853 0.365 -0.116 -0.594
Negative 2 2.047 2.298 5.547 -0.366 0.638 1.099
Table 22 Power differences estimated from real data - subject 6 – Cz electrode reference.
Resting EEG Weighted
Difference [dB] Difference [dB]
Film clip El.
1 and 3
El.
5 and 9
El.
13 and 17
El.
1 and 3
El.
5 and 9
El.
13 and 17
Positive 1 0.624 -0.559 0.956 0.781 -0.937 0.454
Positive 2 -0.496 0.645 0.013 -0.339 0.268 -0.489
Negative 1 -0.654 0.854 0.382 -0.497 0.477 -0.120
Negative 2 -0.115 0.510 0.752 0.043 0.133 0.250
Table 23 Power differences estimated from real data - subject 6 – surface Laplacian reference.
Resting EEG Weighted
Difference [dB] Difference [dB]
Film clip El.
1 and 3
El.
5 and 9
El.
13 and 17
El.
1 and 3
El.
5 and 9
El.
13 and 17
Positive 1 0.276 2.161 1.332 -0.684 -1.337 -0.303
Positive 2 1.087 4.159 1.470 0.128 0.661 -0.165
Negative 1 1.067 3.904 1.290 0.108 0.406 -0.344
Negative 2 1.220 3.519 2.126 0.260 0.021 0.492
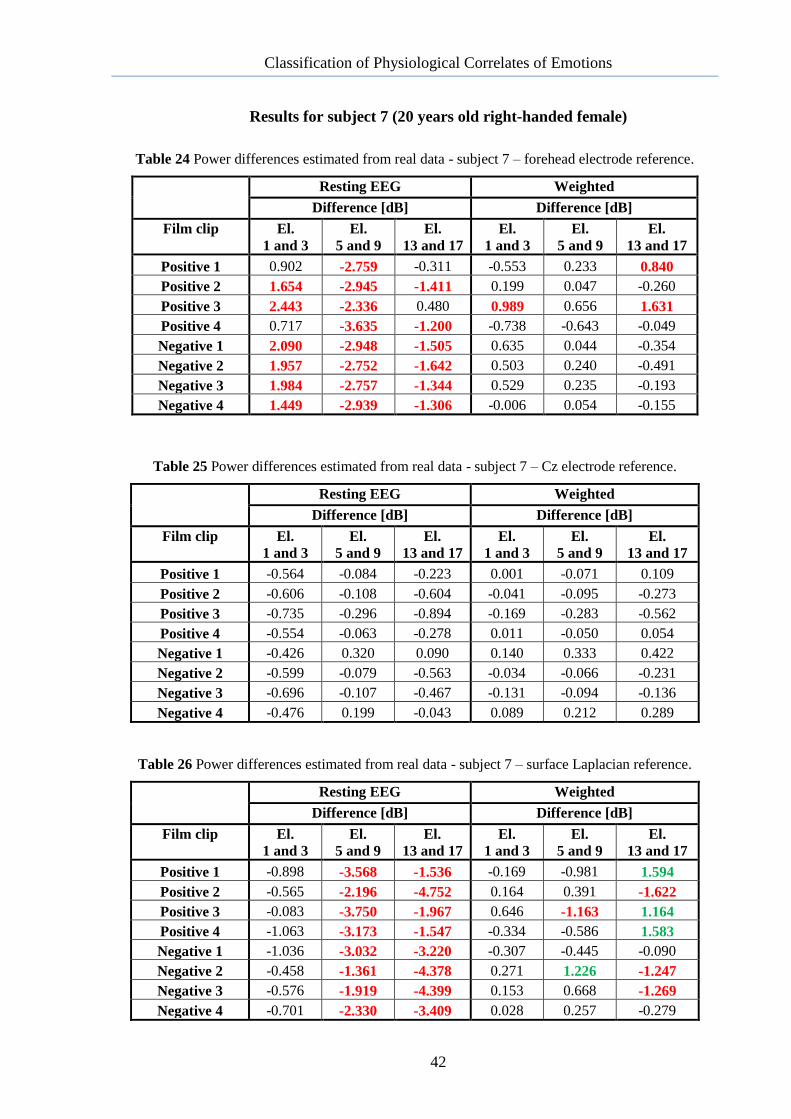
Classification of Physiological Correlates of Emotions
42
Results for subject 7 (20 years old right-handed female)
Table 24 Power differences estimated from real data - subject 7 – forehead electrode reference.
Resting EEG Weighted
Difference [dB] Difference [dB]
Film clip El.
1 and 3
El.
5 and 9
El.
13 and 17
El.
1 and 3
El.
5 and 9
El.
13 and 17
Positive 1 0.902 -2.759 -0.311 -0.553 0.233 0.840
Positive 2 1.654 -2.945 -1.411 0.199 0.047 -0.260
Positive 3 2.443 -2.336 0.480 0.989 0.656 1.631
Positive 4 0.717 -3.635 -1.200 -0.738 -0.643 -0.049
Negative 1 2.090 -2.948 -1.505 0.635 0.044 -0.354
Negative 2 1.957 -2.752 -1.642 0.503 0.240 -0.491
Negative 3 1.984 -2.757 -1.344 0.529 0.235 -0.193
Negative 4 1.449 -2.939 -1.306 -0.006 0.054 -0.155
Table 25 Power differences estimated from real data - subject 7 – Cz electrode reference.
Resting EEG Weighted
Difference [dB] Difference [dB]
Film clip El.
1 and 3
El.
5 and 9
El.
13 and 17
El.
1 and 3
El.
5 and 9
El.
13 and 17
Positive 1 -0.564 -0.084 -0.223 0.001 -0.071 0.109
Positive 2 -0.606 -0.108 -0.604 -0.041 -0.095 -0.273
Positive 3 -0.735 -0.296 -0.894 -0.169 -0.283 -0.562
Positive 4 -0.554 -0.063 -0.278 0.011 -0.050 0.054
Negative 1 -0.426 0.320 0.090 0.140 0.333 0.422
Negative 2 -0.599 -0.079 -0.563 -0.034 -0.066 -0.231
Negative 3 -0.696 -0.107 -0.467 -0.131 -0.094 -0.136
Negative 4 -0.476 0.199 -0.043 0.089 0.212 0.289
Table 26 Power differences estimated from real data - subject 7 – surface Laplacian reference.
Resting EEG Weighted
Difference [dB] Difference [dB]
Film clip El.
1 and 3
El.
5 and 9
El.
13 and 17
El.
1 and 3
El.
5 and 9
El.
13 and 17
Positive 1 -0.898 -3.568 -1.536 -0.169 -0.981 1.594
Positive 2 -0.565 -2.196 -4.752 0.164 0.391 -1.622
Positive 3 -0.083 -3.750 -1.967 0.646 -1.163 1.164
Positive 4 -1.063 -3.173 -1.547 -0.334 -0.586 1.583
Negative 1 -1.036 -3.032 -3.220 -0.307 -0.445 -0.090
Negative 2 -0.458 -1.361 -4.378 0.271 1.226 -1.247
Negative 3 -0.576 -1.919 -4.399 0.153 0.668 -1.269
Negative 4 -0.701 -2.330 -3.409 0.028 0.257 -0.279
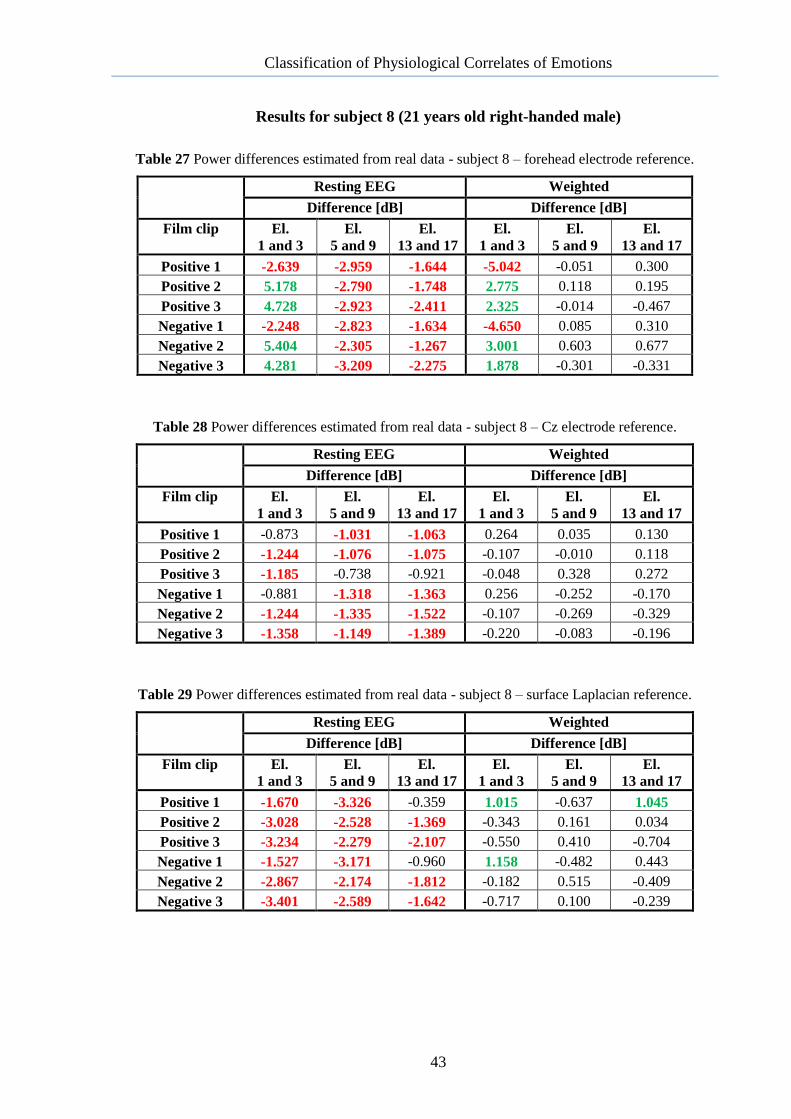
Classification of Physiological Correlates of Emotions
43
Results for subject 8 (21 years old right-handed male)
Table 27 Power differences estimated from real data - subject 8 – forehead electrode reference.
Resting EEG Weighted
Difference [dB] Difference [dB]
Film clip El.
1 and 3
El.
5 and 9
El.
13 and 17
El.
1 and 3
El.
5 and 9
El.
13 and 17
Positive 1 -2.639 -2.959 -1.644 -5.042 -0.051 0.300
Positive 2 5.178 -2.790 -1.748 2.775 0.118 0.195
Positive 3 4.728 -2.923 -2.411 2.325 -0.014 -0.467
Negative 1 -2.248 -2.823 -1.634 -4.650 0.085 0.310
Negative 2 5.404 -2.305 -1.267 3.001 0.603 0.677
Negative 3 4.281 -3.209 -2.275 1.878 -0.301 -0.331
Table 28 Power differences estimated from real data - subject 8 – Cz electrode reference.
Resting EEG Weighted
Difference [dB] Difference [dB]
Film clip El.
1 and 3
El.
5 and 9
El.
13 and 17
El.
1 and 3
El.
5 and 9
El.
13 and 17
Positive 1 -0.873 -1.031 -1.063 0.264 0.035 0.130
Positive 2 -1.244 -1.076 -1.075 -0.107 -0.010 0.118
Positive 3 -1.185 -0.738 -0.921 -0.048 0.328 0.272
Negative 1 -0.881 -1.318 -1.363 0.256 -0.252 -0.170
Negative 2 -1.244 -1.335 -1.522 -0.107 -0.269 -0.329
Negative 3 -1.358 -1.149 -1.389 -0.220 -0.083 -0.196
Table 29 Power differences estimated from real data - subject 8 – surface Laplacian reference.
Resting EEG Weighted
Difference [dB] Difference [dB]
Film clip El.
1 and 3
El.
5 and 9
El.
13 and 17
El.
1 and 3
El.
5 and 9
El.
13 and 17
Positive 1 -1.670 -3.326 -0.359 1.015 -0.637 1.045
Positive 2 -3.028 -2.528 -1.369 -0.343 0.161 0.034
Positive 3 -3.234 -2.279 -2.107 -0.550 0.410 -0.704
Negative 1 -1.527 -3.171 -0.960 1.158 -0.482 0.443
Negative 2 -2.867 -2.174 -1.812 -0.182 0.515 -0.409
Negative 3 -3.401 -2.589 -1.642 -0.717 0.100 -0.239
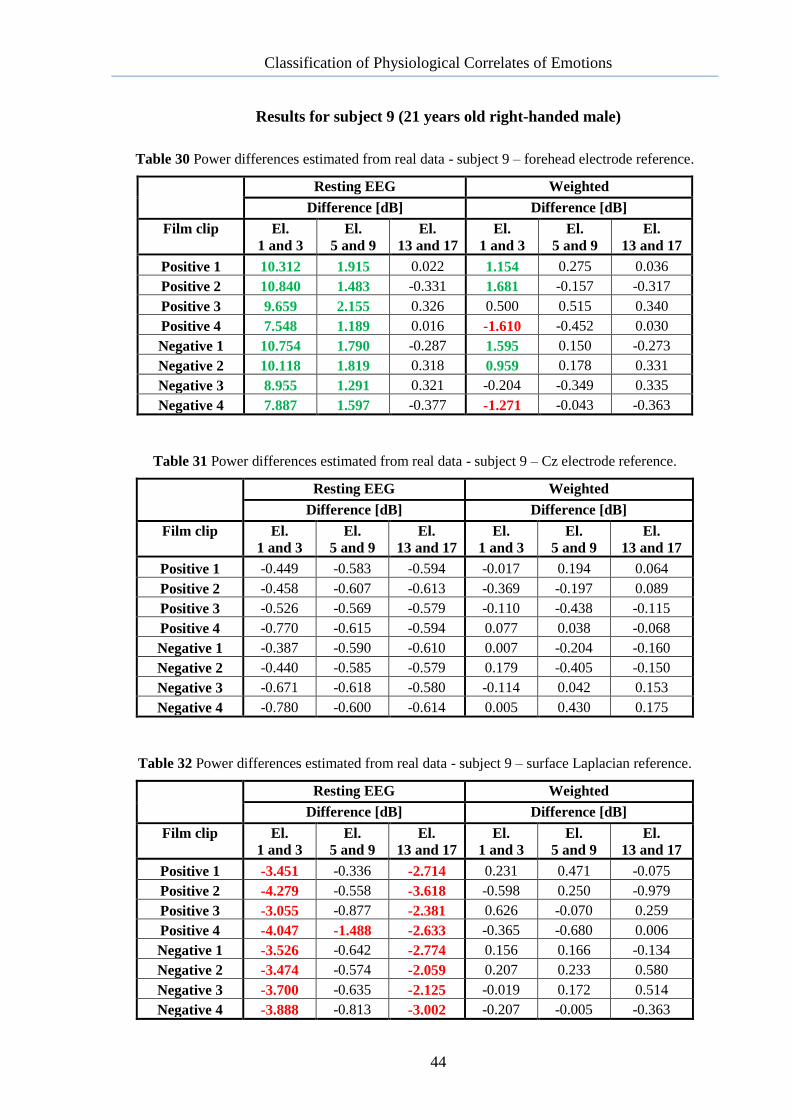
Classification of Physiological Correlates of Emotions
44
Results for subject 9 (21 years old right-handed male)
Table 30 Power differences estimated from real data - subject 9 – forehead electrode reference.
Resting EEG Weighted
Difference [dB] Difference [dB]
Film clip El.
1 and 3
El.
5 and 9
El.
13 and 17
El.
1 and 3
El.
5 and 9
El.
13 and 17
Positive 1 10.312 1.915 0.022 1.154 0.275 0.036
Positive 2 10.840 1.483 -0.331 1.681 -0.157 -0.317
Positive 3 9.659 2.155 0.326 0.500 0.515 0.340
Positive 4 7.548 1.189 0.016 -1.610 -0.452 0.030
Negative 1 10.754 1.790 -0.287 1.595 0.150 -0.273
Negative 2 10.118 1.819 0.318 0.959 0.178 0.331
Negative 3 8.955 1.291 0.321 -0.204 -0.349 0.335
Negative 4 7.887 1.597 -0.377 -1.271 -0.043 -0.363
Table 31 Power differences estimated from real data - subject 9 – Cz electrode reference.
Resting EEG Weighted
Difference [dB] Difference [dB]
Film clip El.
1 and 3
El.
5 and 9
El.
13 and 17
El.
1 and 3
El.
5 and 9
El.
13 and 17
Positive 1 -0.449 -0.583 -0.594 -0.017 0.194 0.064
Positive 2 -0.458 -0.607 -0.613 -0.369 -0.197 0.089
Positive 3 -0.526 -0.569 -0.579 -0.110 -0.438 -0.115
Positive 4 -0.770 -0.615 -0.594 0.077 0.038 -0.068
Negative 1 -0.387 -0.590 -0.610 0.007 -0.204 -0.160
Negative 2 -0.440 -0.585 -0.579 0.179 -0.405 -0.150
Negative 3 -0.671 -0.618 -0.580 -0.114 0.042 0.153
Negative 4 -0.780 -0.600 -0.614 0.005 0.430 0.175
Table 32 Power differences estimated from real data - subject 9 – surface Laplacian reference.
Resting EEG Weighted
Difference [dB] Difference [dB]
Film clip El.
1 and 3
El.
5 and 9
El.
13 and 17
El.
1 and 3
El.
5 and 9
El.
13 and 17
Positive 1 -3.451 -0.336 -2.714 0.231 0.471 -0.075
Positive 2 -4.279 -0.558 -3.618 -0.598 0.250 -0.979
Positive 3 -3.055 -0.877 -2.381 0.626 -0.070 0.259
Positive 4 -4.047 -1.488 -2.633 -0.365 -0.680 0.006
Negative 1 -3.526 -0.642 -2.774 0.156 0.166 -0.134
Negative 2 -3.474 -0.574 -2.059 0.207 0.233 0.580
Negative 3 -3.700 -0.635 -2.125 -0.019 0.172 0.514
Negative 4 -3.888 -0.813 -3.002 -0.207 -0.005 -0.363
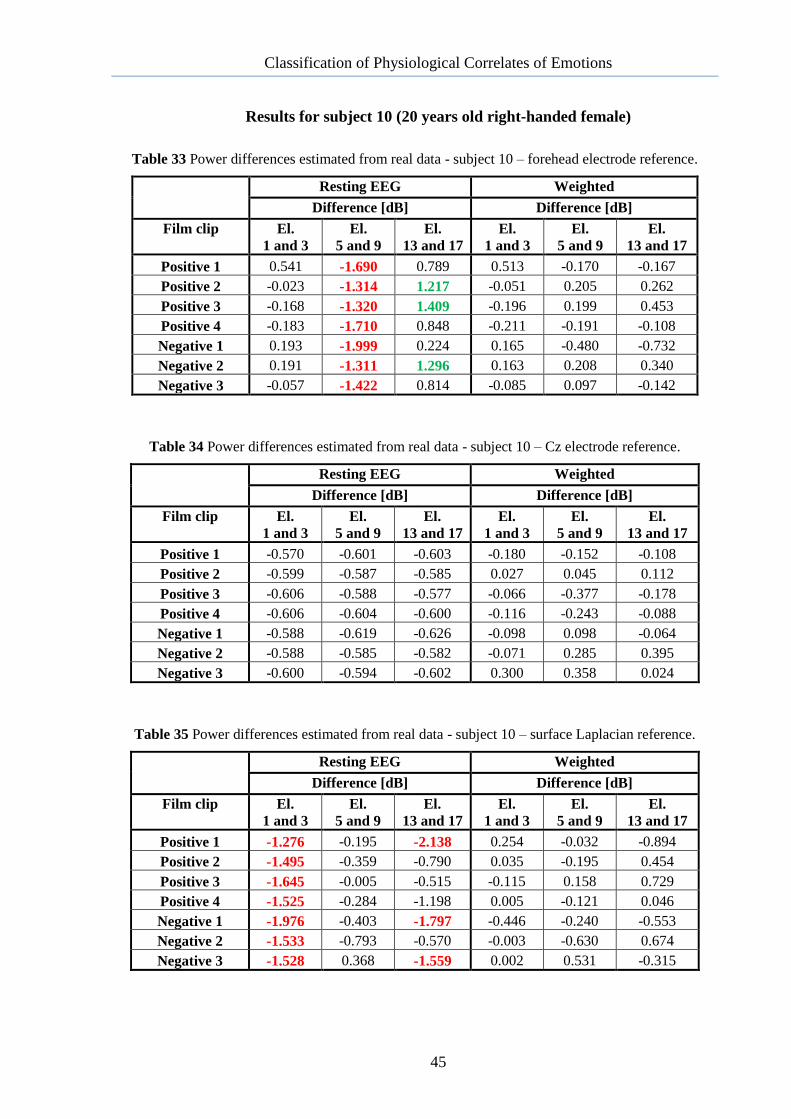
Classification of Physiological Correlates of Emotions
45
Results for subject 10 (20 years old right-handed female)
Table 33 Power differences estimated from real data - subject 10 – forehead electrode reference.
Resting EEG Weighted
Difference [dB] Difference [dB]
Film clip El.
1 and 3
El.
5 and 9
El.
13 and 17
El.
1 and 3
El.
5 and 9
El.
13 and 17
Positive 1 0.541 -1.690 0.789 0.513 -0.170 -0.167
Positive 2 -0.023 -1.314 1.217 -0.051 0.205 0.262
Positive 3 -0.168 -1.320 1.409 -0.196 0.199 0.453
Positive 4 -0.183 -1.710 0.848 -0.211 -0.191 -0.108
Negative 1 0.193 -1.999 0.224 0.165 -0.480 -0.732
Negative 2 0.191 -1.311 1.296 0.163 0.208 0.340
Negative 3 -0.057 -1.422 0.814 -0.085 0.097 -0.142
Table 34 Power differences estimated from real data - subject 10 – Cz electrode reference.
Resting EEG Weighted
Difference [dB] Difference [dB]
Film clip El.
1 and 3
El.
5 and 9
El.
13 and 17
El.
1 and 3
El.
5 and 9
El.
13 and 17
Positive 1 -0.570 -0.601 -0.603 -0.180 -0.152 -0.108
Positive 2 -0.599 -0.587 -0.585 0.027 0.045 0.112
Positive 3 -0.606 -0.588 -0.577 -0.066 -0.377 -0.178
Positive 4 -0.606 -0.604 -0.600 -0.116 -0.243 -0.088
Negative 1 -0.588 -0.619 -0.626 -0.098 0.098 -0.064
Negative 2 -0.588 -0.585 -0.582 -0.071 0.285 0.395
Negative 3 -0.600 -0.594 -0.602 0.300 0.358 0.024
Table 35 Power differences estimated from real data - subject 10 – surface Laplacian reference.
Resting EEG Weighted
Difference [dB] Difference [dB]
Film clip El.
1 and 3
El.
5 and 9
El.
13 and 17
El.
1 and 3
El.
5 and 9
El.
13 and 17
Positive 1 -1.276 -0.195 -2.138 0.254 -0.032 -0.894
Positive 2 -1.495 -0.359 -0.790 0.035 -0.195 0.454
Positive 3 -1.645 -0.005 -0.515 -0.115 0.158 0.729
Positive 4 -1.525 -0.284 -1.198 0.005 -0.121 0.046
Negative 1 -1.976 -0.403 -1.797 -0.446 -0.240 -0.553
Negative 2 -1.533 -0.793 -0.570 -0.003 -0.630 0.674
Negative 3 -1.528 0.368 -1.559 0.002 0.531 -0.315
Classification of Physiological Correlates of Emotions
46
4 DISCUSSION
In this chapter, the results of the pre-processing of the physiological signals, results of
algorithm testing on the simulated data and application on the real data are discussed. Also,
methodological weaknesses and advices for the future experiments are included.
4.1. Signal Pre-processing
The functionality of the algorithm for the pre-processing of the physiological signals
was verified visually. As mentioned in Results, the inspection of the EEG pre-processing was
performed in the real data from two randomly selected subjects. Based on the visual
inspection it could be concluded, that the detection of movement and blinking was performed
correctly.
4.2. Testing of the Algorithm on the Simulated Data
The algorithm detected correctly asymmetry of frontal brain sources in the simulated
data, therefore it could be concluded, that the algorithm works properly.
4.3. Application of the Algorithm on the Real Data
When the algorithm was applied on the real data, it did not detect any frontal
asymmetry that would correspond to the valence of presented stimuli. The obtained results
mainly differ depending on the power normalization.
When the resting EEG normalization was used, the algorithm detected a lot of falsely
significant results. This could be explained by several difficulties related to both the
measurement procedure and the temporal evolution of brain signals. In the measurement
signals the tags, which were available in the records, were saved incorrectly; the tags did not
match with the intervals of the resting EEG record. Therefore, the time intervals were found
manually. Moreover, in records from several subjects, parts with the resting EEG in the end of
the record were missing. Hence, only the estimate of the power of the resting EEG from the
Classification of Physiological Correlates of Emotions
47
beginning of the record was used. For the evaluation, it would be more appropriate to use the
power estimate from the beginning and from the end of the record and average it, because the
baseline power could increase or decrease during the time period.
When the weighted average normalization was used, the algorithm detected only a
small number of the falsely significant results, which did not seem to correspond to the
valence of the film clips. While this normalization approach did not detect the frontal
asymmetry, it provided much less false positive estimates than the resting EEG normalisation.
Therefore, it is concluded that the weighted average normalization was more appropriate
choice.
According to the results, the best combination of the reference electrode choice and
the power normalization was the Cz electrode reference and the weighted average
normalization, because in this combination the lowest amount of the falsely significant results
appeared in comparison with other possibilities.
In comparison with the results presented in the literature, the lack of frontal
asymmetry evoked by emotional stimuli is not completely unusual. While many works have
presented some frontal asymmetry that corresponded to the stimuli valence, some works also
did not detect this behaviour.
In work [46] the frontal brain asymmetry evoked by the positive and negative stimuli
was not found, when the asymmetry was examined across the whole time period of the film
clips. This paper illustrates the utility of using facial behaviour for evaluation. This findings
supported results of this thesis, where facial behaviour was not involved.
Paper [49] showed decreased level of frontal asymmetry in a positive stimulus which
came after a negative stimulus. This also supported results presented in this thesis, because
the positive and negative stimuli were combined.
Classification of Physiological Correlates of Emotions
48
4.4. Methodological Weaknesses
The reasons of missing significant results which would have allowed the classification
of physiological correlates of emotions are concluded.
The first problem was in the choice of the subjects. The selection was not based upon
any research or according to the common interests or features. Subjects were chosen
randomly as they were willing to undergo the experiment. In work [48] the selection of the
subjects was based upon the personality questionnaire and according to the rate of the reaction
to the stimuli.
The second problematic part was the duration of the placement of the EEG cap. It took
about an hour, the process was tedious, the subjects might have been tired after one hour
sitting in the chair and waiting.
Also, the film clips were selected to be strongly comical, sad or disgusting. But the
reaction to the stimuli could not be uniform, e.g. stimuli that elicit disgust in one person could
be boring or even interesting in the positive sense for the other person. Also, very disgusting
clip could affect emotions for the whole measurement and appropriate reaction to the positive
stimuli does not appear. The selection of the stimuli could be supported by additional study
that would evaluate the effect of stimuli as in paper [46].
Next, the stimuli were presented immediately one after the other, time between two
stimuli for recovery was just 30 seconds and the stimuli were combined randomly (in was
mixture of positive, negative and neutral film clips) which could have affected the outcomes.
Twenty-nine stimuli were presented and subjects might have not been able to react enough to
all of them because it is a lot of emotions to be expressed in only one hour. The problem with
combining negative and positive stimuli was mentioned in work [49], where the frontal brain
asymmetry was found in response to the negative film clip, which went first in comparison
with the positive film clip, which followed the negative and the asymmetry was not
significant.
Last, no additional measurement was employed to detect time periods, where subjects
made certain facial expressions. Work [46] showed, that no reliable differences in frontal
brain asymmetry are found, if the analysis is made from the whole movie, contrarily, it was
found in periods of time with facial expression.
Classification of Physiological Correlates of Emotions
49
4.5. Suggestions for Future Experiment
For the future study, there are some proposed methodological improvements regarding
to the measurement, subjects selection and stimuli choice.
In the first place, the EEG measurement apparatus should be selected in respect to the
shorter time of installation, so that the subjects are not tired from the long waiting. The
replacement of the high density EEG cap is now available. The apparatus consists of the
network of electrodes connected with the flexible fibre which is positioned on the head easily
and quickly; the other advantage is that no conductive gel is necessary.
Next to the GSR method, other secondary measurement evaluating the reactivity and
arousal should be employed. For example the facial expression should be assessed. In the
processing of the signal only the time intervals with the facial expressions of happiness or
disgust should be used from the whole film clip period. The camera recording could be used.
The right selection of subjects is one of the most important issues in the field of
evaluation of emotions in response to the film clips. People in the similar age and all right-
handed or left-handed should be recruited. To assure the comparable reaction to the stimuli,
the uniform group of the subjects should be enrolled, e.g. people with similar hobbies and
opinions should be found.
Last, the stimuli should be chosen precisely in respect to the group of examined
subjects.
Classification of Physiological Correlates of Emotions
50
5 SUMMARY
This thesis was motivated by the need to classify emotions in response to the film clip
stimuli. The common method of the emotion evaluation is the questionnaire, which suffers
from several disadvantages. The disadvantages include subjectivity, misinterpretation of the
feelings, untrue information etc. Therefore, aim of the thesis was to suggest and implement
the algorithm for the classification of emotions.
Based on the reviewed literature, the EEG signal was selected for the algorithm. In the
EEG signal, the frontal brain asymmetry in the alpha band was evaluated. The algorithm was
designed in the following steps.
In the first step, the EEG signal was pre-processed. The technical artifacts were
eliminated and biological artifacts were detected. After, the different electrode references
were used. The forehead and Cz electrode reference and the reference-free technique, the
scalp surface Laplacian were employed. Next, the signal was filtered to the alpha band. The
last step of the pre-processing was normalization using the power of the resting EEG or the
weighted average of the powers of all film clips. Last, the difference of the powers in two
symmetrical leads was computed.
The Monte Carlo method was used for the statistical evaluation. The distribution of
power difference in the left and right frontal lobe of the head model with zero asymmetry was
obtained, and this distribution was used to establish the thresholds that were used for the
testing of statistical significance of power differences estimated from real data.
Once the algorithm was implemented, the function of the algorithm was validated
using the head model simulation with asymmetries in the frontal brain area. The results
showed that the algorithm was able to identify the frontal brain asymmetry
When the algorithm was applied to the real it did not detect any frontal asymmetry that
would correspond to the valence of the presented stimuli. The weighted average of the powers
normalization brought negligible amount of the significant results and in case of the resting
EEG normalization, no relation appeared between the emotional valence of the film clips and
the frontal brain asymmetry.

Classification of Physiological Correlates of Emotions
51
For the future experiment some improvements were proposed. The selection of the
subjects and the stimuli should be more precise. Also, the measurement tool for the EEG
recording should enable faster application.
Classification of Physiological Correlates of Emotions
52
REFERENCES
[1] SCHWARTZ, G., R. DAVIDSON and F. MAER. Right hemisphere lateralization for
emotion in the human brain. Science. 1975-10-17. vol. 190. issue 4211. pp. 286-288.
[2] ANDREASSI, John L. Psychophysiology: human behavior and physiological
response. 5th ed. Mahwah: Lawerence Erlbaum. ISBN 08-058-4951-3.
[3] DAVIDSON, Richard J., et al. Sex Differences in Patterns of EEG Asymmetry.
Biological Psychology. 1976. vol. 4. no. 2. pp. 119-137.
[4] SCHWARTZ, Gary E., Richard J. DAVIDSON and Eric PUGASH. Voluntary
Control of Patterns of EEC Parietal Asymmetry: Cognitive
Concomitants. Psychophysiology. 1976. vol. 13. issue 6. pp. 498-504.
[5] DAVIDSON, Richard J. and Gary E. SCHWARTZ. The Influence of Musical
Training on Patterns of EEG Asymmetry During Musical and Non-Musical Self-
Generation Tasks. Psychophysiology. 1977. vol. 14. issue 1.
[6] KANG, Duck-hee, Richard J. DAVIDSON, Christopher L. COE, Robert E.
WHEELER and ET AL. The Influence of Musical Training on Patterns of EEG
Asymmetry During Musical and Non-Musical Self-Generation Tasks. Behavioral
Neuroscience. 1991. vol. 105. issue 6. pp. 860-869.
[7] SOBOTKA, Stanislaw S.; DAVIDSON, Richard J.; SENULIS, Joseph A. Anterior
Brain Electrical Asymmetries in Response to Reward and Punishment.
Electroencephalography and Clinical Neurophysiology. 1992. vol. 83. no. 4. pp. 236-
247.
[8] PIZZAGALLI, D. A., R. J. SHERWOOD, J. B. HENRIQUES, R. J. DAVIDSON and
ET AL. Frontal Brain Asymmetry and Reward Responsiveness: a Source-Localization
Study. Psychological Science. 2005-10-01. vol. 16. issue 10. pp. 805-813.
[9] YANG, Hye-Ryeon, Ji-Eun PARK, Sangsup CHOI, Jin-Hun SOHN and LEE. EEG
asymmetry and anxiety. 2013 International Winter Workshop on Brain-Computer
Interface (BCI). IEEE, 2013. pp. 54-55.
[10] NORHAZMAN, H., N. Mohamad ZAINI, M. N. TAIB, H. A. OMAR, R. JAILANI,
S. LIAS, L. MAZALAN and Maizura Mohd SANI. Behaviour of EEG Alpha
Asymmetry when stress is induced and binaural beat is applied. 2012 International
Symposium on Computer Applications and Industrial Electronics (ISCAIE). IEEE,
2012. pp. 297-301.
[11] HOPTMAN, Matthew J.; DAVIDSON, Richard J. Baseline Eeg Asymmetries and
Performance on Neuropsychological Tasks. Neuropsychologia. 1998. vol. 36. no. 12.
pp. 1343-1353.
Classification of Physiological Correlates of Emotions
53
[12] REUTER-LORENZ, Patricia; DAVIDSON, Richard J. Differential Contributions of
the Two Cerebral Hemispheres to the Perception of Happy and Sad Faces.
Neuropsychologia. 1981. vol. 19. no. 4. pp. 609-613.
[13] JACKSON, Daren C., Corrina J. MUELLER, Isa DOLSKI, Kim M. DALTON, Jack
B. NITSCHKE, Heather L. URRY, Melissa A. ROSENKRANZ, Carol D. RYFF,
Burton H. SINGER and DAVIDSON. Now you feel it, now you don't: frontal brain
electrical asymmetry and individual differences in emotion regulation. Psychological
Science. 2003. vol. 14. issue 6. pp. 612-617.
[14] WHEELER, ROBERT E., RICHARD J. DAVIDSON and ANDREW J.
TOMARKEN. Frontal brain asymmetry and emotional reactivity: a biological
substrate of affective style. Psychophysiology. 1993. vol. 30. issue 1. pp. 82-89.
[15] DIMOND, S.J., FARRINGTON, L., JOHNSON, P. Differing emotional response
from right and left hemisphere. Nature. 1976. vol. 261. pp. 689-691.
[16] TUCKER, M. Right Frontal Lobe Activation and Right Hemisphere
Performance. Archives of General Psychiatry. 1981-02-01. vol. 38. issue 2. pp. 169-
178.
[17] DAVIDSON, Richard J.; SHACKMAN, Alexander J.; MAXWELL, Jeffrey S.
Asymmetries in Face and Brain Related to Emotion. Trends in Cognitive Sciences.
2004. vol. 8. no. 9. pp. 389-391.
[18] SCHAFFER, Carrie E.; DAVIDSON, Richard J., SARON, Clifford Frontal and
Parietal Electroencephalogram Asymmetry in Depressed and Nondepressed Subjects.
Biological Psychiatry. 1983. vol. 18. no. 7. pp.753-762.
[19] TOMARKEN, Andrew J., Richard J. DAVIDSON and Jeffrey B. HENRIQUES.
Resting frontal brain asymmetry predicts affective responses to films: Conceptual and
Methodological Issues. Journal of Personality and Social Psychology. 1990. vol. 59.
issue 4. pp. 71-89.
[20] DAVIDSON, Richard J., Richard J. DAVIDSON and Jeffrey B. HENRIQUES.
EMOTION AND AFFECTIVE STYLE: Hemispheric Substrates. Psychological
Science. 1992. vol. 3. issue 1. pp. 39-43.
[21] NICHOLLS, M. E. R., B. E. ELLIS, J. G. CLEMENT and M. YOSHINO. Detecting
hemifacial asymmetries in emotional expression with three-dimensional computerized
image analysis. Proceedings of the Royal Society B: Biological Sciences. 2004-04-07.
vol. 271. issue 1540. pp. 663-668.
[22] HARMON-JONES, Eddie; GABLE, Philip A.; PETERSON, Carly K. The Role of
Asymmetric Frontal Cortical Activity in Emotion-Related Phenomena: a Review and
Update. Biological Psychology. 2010. vol. 84. no. 3. pp. 451-462.
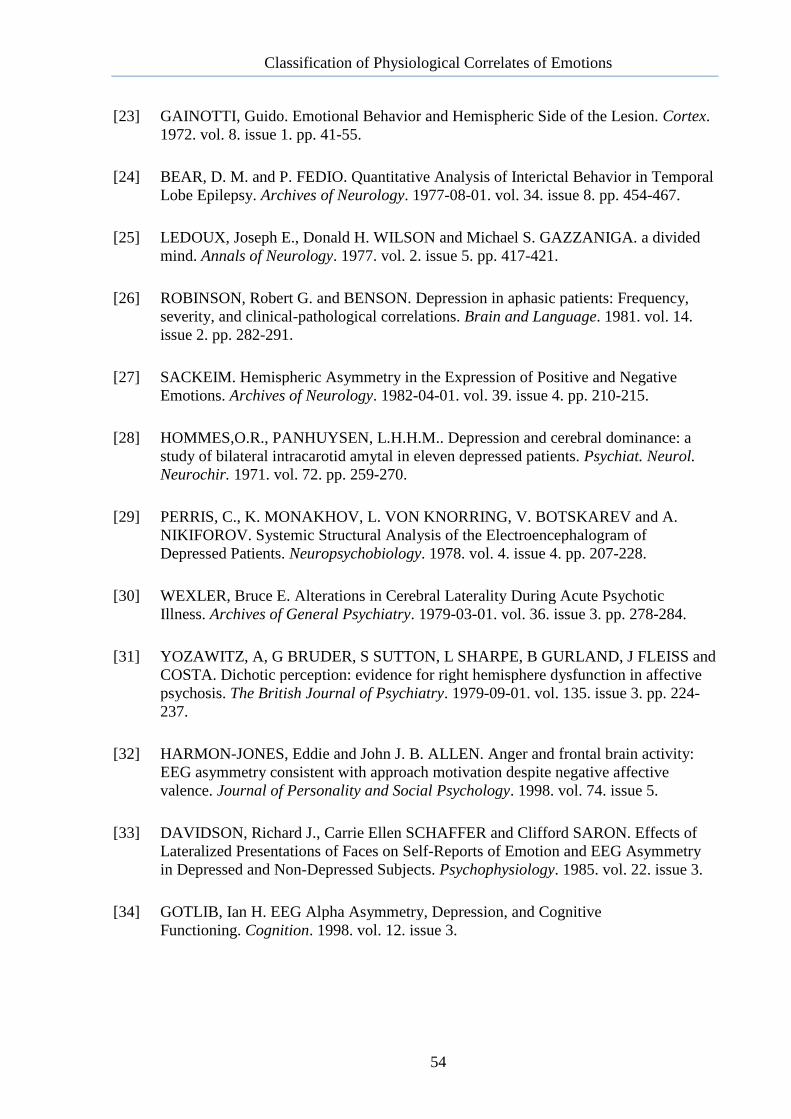
Classification of Physiological Correlates of Emotions
54
[23] GAINOTTI, Guido. Emotional Behavior and Hemispheric Side of the Lesion. Cortex.
1972. vol. 8. issue 1. pp. 41-55.
[24] BEAR, D. M. and P. FEDIO. Quantitative Analysis of Interictal Behavior in Temporal
Lobe Epilepsy. Archives of Neurology. 1977-08-01. vol. 34. issue 8. pp. 454-467.
[25] LEDOUX, Joseph E., Donald H. WILSON and Michael S. GAZZANIGA. a divided
mind. Annals of Neurology. 1977. vol. 2. issue 5. pp. 417-421.
[26] ROBINSON, Robert G. and BENSON. Depression in aphasic patients: Frequency,
severity, and clinical-pathological correlations. Brain and Language. 1981. vol. 14.
issue 2. pp. 282-291.
[27] SACKEIM. Hemispheric Asymmetry in the Expression of Positive and Negative
Emotions. Archives of Neurology. 1982-04-01. vol. 39. issue 4. pp. 210-215.
[28] HOMMES,O.R., PANHUYSEN, L.H.H.M.. Depression and cerebral dominance: a
study of bilateral intracarotid amytal in eleven depressed patients. Psychiat. Neurol.
Neurochir. 1971. vol. 72. pp. 259-270.
[29] PERRIS, C., K. MONAKHOV, L. VON KNORRING, V. BOTSKAREV and A.
NIKIFOROV. Systemic Structural Analysis of the Electroencephalogram of
Depressed Patients. Neuropsychobiology. 1978. vol. 4. issue 4. pp. 207-228.
[30] WEXLER, Bruce E. Alterations in Cerebral Laterality During Acute Psychotic
Illness. Archives of General Psychiatry. 1979-03-01. vol. 36. issue 3. pp. 278-284.
[31] YOZAWITZ, A, G BRUDER, S SUTTON, L SHARPE, B GURLAND, J FLEISS and
COSTA. Dichotic perception: evidence for right hemisphere dysfunction in affective
psychosis. The British Journal of Psychiatry. 1979-09-01. vol. 135. issue 3. pp. 224-
237.
[32] HARMON-JONES, Eddie and John J. B. ALLEN. Anger and frontal brain activity:
EEG asymmetry consistent with approach motivation despite negative affective
valence. Journal of Personality and Social Psychology. 1998. vol. 74. issue 5.
[33] DAVIDSON, Richard J., Carrie Ellen SCHAFFER and Clifford SARON. Effects of
Lateralized Presentations of Faces on Self-Reports of Emotion and EEG Asymmetry
in Depressed and Non-Depressed Subjects. Psychophysiology. 1985. vol. 22. issue 3.
[34] GOTLIB, Ian H. EEG Alpha Asymmetry, Depression, and Cognitive
Functioning. Cognition. 1998. vol. 12. issue 3.
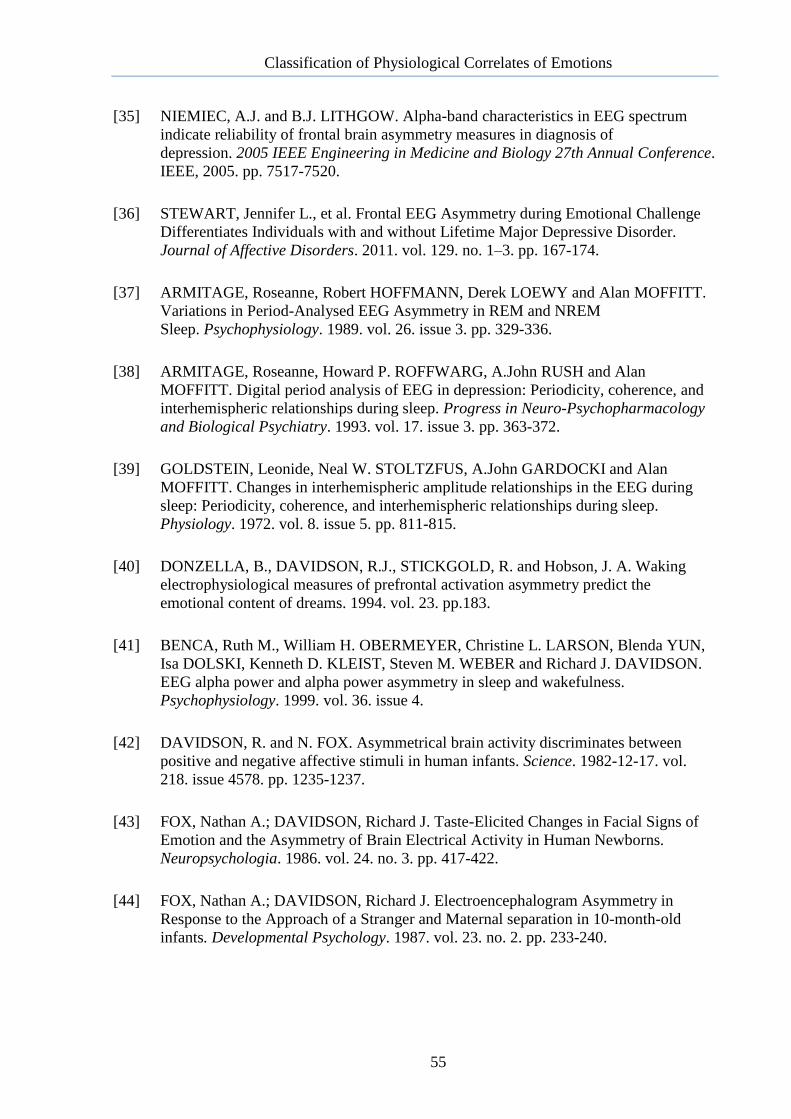
Classification of Physiological Correlates of Emotions
55
[35] NIEMIEC, A.J. and B.J. LITHGOW. Alpha-band characteristics in EEG spectrum
indicate reliability of frontal brain asymmetry measures in diagnosis of
depression. 2005 IEEE Engineering in Medicine and Biology 27th Annual Conference.
IEEE, 2005. pp. 7517-7520.
[36] STEWART, Jennifer L., et al. Frontal EEG Asymmetry during Emotional Challenge
Differentiates Individuals with and without Lifetime Major Depressive Disorder.
Journal of Affective Disorders. 2011. vol. 129. no. 1–3. pp. 167-174.
[37] ARMITAGE, Roseanne, Robert HOFFMANN, Derek LOEWY and Alan MOFFITT.
Variations in Period-Analysed EEG Asymmetry in REM and NREM
Sleep. Psychophysiology. 1989. vol. 26. issue 3. pp. 329-336.
[38] ARMITAGE, Roseanne, Howard P. ROFFWARG, A.John RUSH and Alan
MOFFITT. Digital period analysis of EEG in depression: Periodicity, coherence, and
interhemispheric relationships during sleep. Progress in Neuro-Psychopharmacology
and Biological Psychiatry. 1993. vol. 17. issue 3. pp. 363-372.
[39] GOLDSTEIN, Leonide, Neal W. STOLTZFUS, A.John GARDOCKI and Alan
MOFFITT. Changes in interhemispheric amplitude relationships in the EEG during
sleep: Periodicity, coherence, and interhemispheric relationships during sleep.
Physiology. 1972. vol. 8. issue 5. pp. 811-815.
[40] DONZELLA, B., DAVIDSON, R.J., STICKGOLD, R. and Hobson, J. A. Waking
electrophysiological measures of prefrontal activation asymmetry predict the
emotional content of dreams. 1994. vol. 23. pp.183.
[41] BENCA, Ruth M., William H. OBERMEYER, Christine L. LARSON, Blenda YUN,
Isa DOLSKI, Kenneth D. KLEIST, Steven M. WEBER and Richard J. DAVIDSON.
EEG alpha power and alpha power asymmetry in sleep and wakefulness.
Psychophysiology. 1999. vol. 36. issue 4.
[42] DAVIDSON, R. and N. FOX. Asymmetrical brain activity discriminates between
positive and negative affective stimuli in human infants. Science. 1982-12-17. vol.
218. issue 4578. pp. 1235-1237.
[43] FOX, Nathan A.; DAVIDSON, Richard J. Taste-Elicited Changes in Facial Signs of
Emotion and the Asymmetry of Brain Electrical Activity in Human Newborns.
Neuropsychologia. 1986. vol. 24. no. 3. pp. 417-422.
[44] FOX, Nathan A.; DAVIDSON, Richard J. Electroencephalogram Asymmetry in
Response to the Approach of a Stranger and Maternal separation in 10-month-old
infants. Developmental Psychology. 1987. vol. 23. no. 2. pp. 233-240.
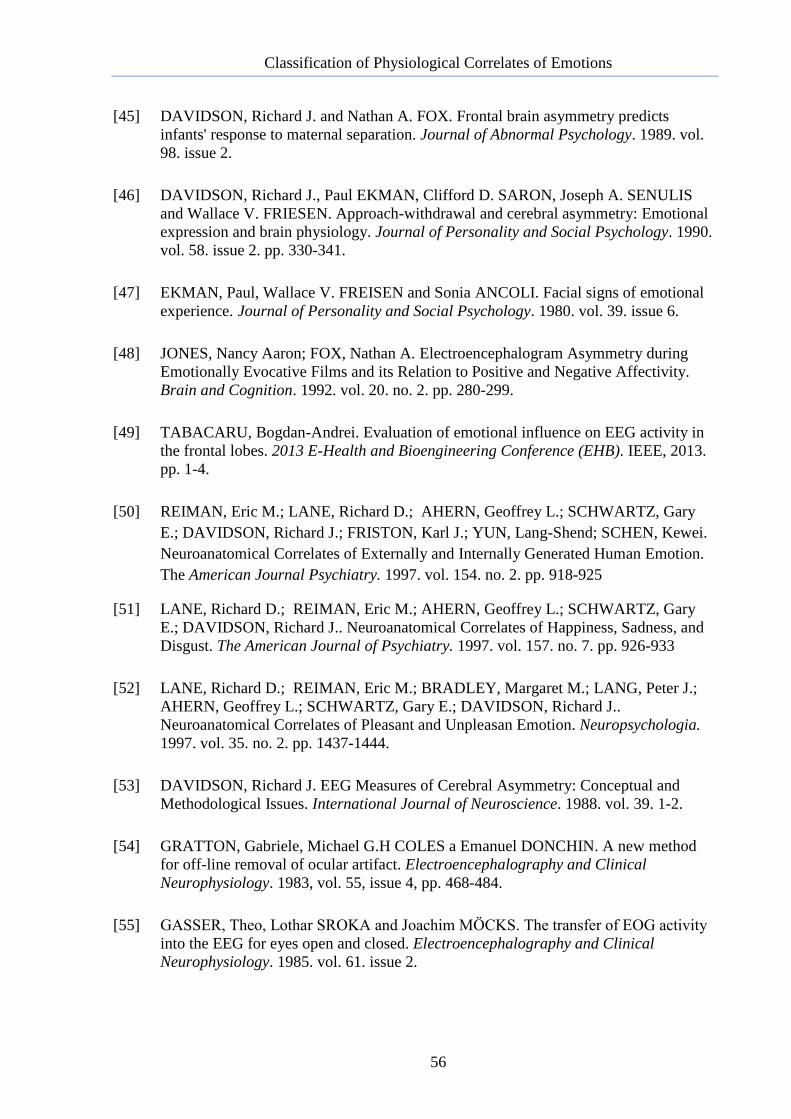
Classification of Physiological Correlates of Emotions
56
[45] DAVIDSON, Richard J. and Nathan A. FOX. Frontal brain asymmetry predicts
infants' response to maternal separation. Journal of Abnormal Psychology. 1989. vol.
98. issue 2.
[46] DAVIDSON, Richard J., Paul EKMAN, Clifford D. SARON, Joseph A. SENULIS
and Wallace V. FRIESEN. Approach-withdrawal and cerebral asymmetry: Emotional
expression and brain physiology. Journal of Personality and Social Psychology. 1990.
vol. 58. issue 2. pp. 330-341.
[47] EKMAN, Paul, Wallace V. FREISEN and Sonia ANCOLI. Facial signs of emotional
experience. Journal of Personality and Social Psychology. 1980. vol. 39. issue 6.
[48] JONES, Nancy Aaron; FOX, Nathan A. Electroencephalogram Asymmetry during
Emotionally Evocative Films and its Relation to Positive and Negative Affectivity.
Brain and Cognition. 1992. vol. 20. no. 2. pp. 280-299.
[49] TABACARU, Bogdan-Andrei. Evaluation of emotional influence on EEG activity in
the frontal lobes. 2013 E-Health and Bioengineering Conference (EHB). IEEE, 2013.
pp. 1-4.
[50] REIMAN, Eric M.; LANE, Richard D.; AHERN, Geoffrey L.; SCHWARTZ, Gary
E.; DAVIDSON, Richard J.; FRISTON, Karl J.; YUN, Lang-Shend; SCHEN, Kewei.
Neuroanatomical Correlates of Externally and Internally Generated Human Emotion.
The American Journal Psychiatry. 1997. vol. 154. no. 2. pp. 918-925
[51] LANE, Richard D.; REIMAN, Eric M.; AHERN, Geoffrey L.; SCHWARTZ, Gary
E.; DAVIDSON, Richard J.. Neuroanatomical Correlates of Happiness, Sadness, and
Disgust. The American Journal of Psychiatry. 1997. vol. 157. no. 7. pp. 926-933
[52] LANE, Richard D.; REIMAN, Eric M.; BRADLEY, Margaret M.; LANG, Peter J.;
AHERN, Geoffrey L.; SCHWARTZ, Gary E.; DAVIDSON, Richard J..
Neuroanatomical Correlates of Pleasant and Unpleasan Emotion. Neuropsychologia.
1997. vol. 35. no. 2. pp. 1437-1444.
[53] DAVIDSON, Richard J. EEG Measures of Cerebral Asymmetry: Conceptual and
Methodological Issues. International Journal of Neuroscience. 1988. vol. 39. 1-2.
[54] GRATTON, Gabriele, Michael G.H COLES a Emanuel DONCHIN. A new method
for off-line removal of ocular artifact. Electroencephalography and Clinical
Neurophysiology. 1983, vol. 55, issue 4, pp. 468-484.
[55] GASSER, Theo, Lothar SROKA and Joachim MÖCKS. The transfer of EOG activity
into the EEG for eyes open and closed. Electroencephalography and Clinical
Neurophysiology. 1985. vol. 61. issue 2.
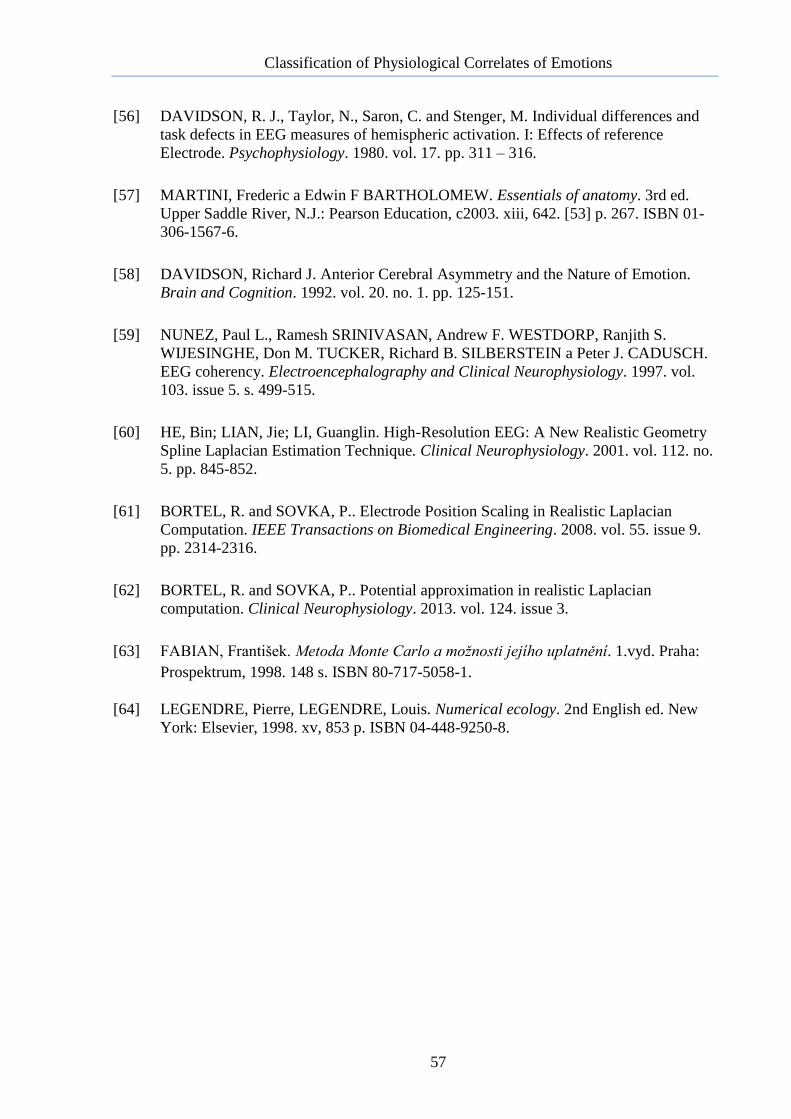
Classification of Physiological Correlates of Emotions
57
[56] DAVIDSON, R. J., Taylor, N., Saron, C. and Stenger, M. Individual differences and
task defects in EEG measures of hemispheric activation. I: Effects of reference
Electrode. Psychophysiology. 1980. vol. 17. pp. 311 – 316.
[57] MARTINI, Frederic a Edwin F BARTHOLOMEW. Essentials of anatomy. 3rd ed.
Upper Saddle River, N.J.: Pearson Education, c2003. xiii, 642. [53] p. 267. ISBN 01-
306-1567-6.
[58] DAVIDSON, Richard J. Anterior Cerebral Asymmetry and the Nature of Emotion.
Brain and Cognition. 1992. vol. 20. no. 1. pp. 125-151.
[59] NUNEZ, Paul L., Ramesh SRINIVASAN, Andrew F. WESTDORP, Ranjith S.
WIJESINGHE, Don M. TUCKER, Richard B. SILBERSTEIN a Peter J. CADUSCH.
EEG coherency. Electroencephalography and Clinical Neurophysiology. 1997. vol.
103. issue 5. s. 499-515.
[60] HE, Bin; LIAN, Jie; LI, Guanglin. High-Resolution EEG: A New Realistic Geometry
Spline Laplacian Estimation Technique. Clinical Neurophysiology. 2001. vol. 112. no.
5. pp. 845-852.
[61] BORTEL, R. and SOVKA, P.. Electrode Position Scaling in Realistic Laplacian
Computation. IEEE Transactions on Biomedical Engineering. 2008. vol. 55. issue 9.
pp. 2314-2316.
[62] BORTEL, R. and SOVKA, P.. Potential approximation in realistic Laplacian
computation. Clinical Neurophysiology. 2013. vol. 124. issue 3.
[63] FABIAN, František. Metoda Monte Carlo a možnosti jejího uplatnění. 1.vyd. Praha:
Prospektrum, 1998. 148 s. ISBN 80-717-5058-1.
[64] LEGENDRE, Pierre, LEGENDRE, Louis. Numerical ecology. 2nd English ed. New
York: Elsevier, 1998. xv, 853 p. ISBN 04-448-9250-8.
Classification of Physiological Correlates of Emotions
58
APPENDIX
Structure of the DVD
The electronic version of the diploma thesis and data measured from one subject are
recorded on the DVD attached to the thesis. The structure of the CD is following:
Folder: Diploma Thesis
- ClassificationOfPhysiologicalCorrelatesOfEmotions.pdf
Folder: Diploma Thesis Files
- 06 – the data measured from one subject
- functions – functions used in the algorithm
- RUN_ClassificationOfPhysiologicalCorrelatesOfEmotions.m – the algorithm
implemented in MATLAB environment