Clare Savage, EnergyAustralia:Towards A More Liquid and Transparent Gas Market
13
Towards A More Liquid and Transparent Gas Market October 2013
-
Upload
informa-australia -
Category
Business
-
view
433 -
download
1
Transcript of Clare Savage, EnergyAustralia:Towards A More Liquid and Transparent Gas Market

Towards A More Liquid and Transparent Gas Market October 2013
2
Towards a More Liquid and Transparent Gas Market
Evolution of our gas market
The rise of LNG and impact on demand
The changing face of supply
The challenge in New South Wales
Gas market design for the future
Towards A More Liquid and Transparent Gas Market
3
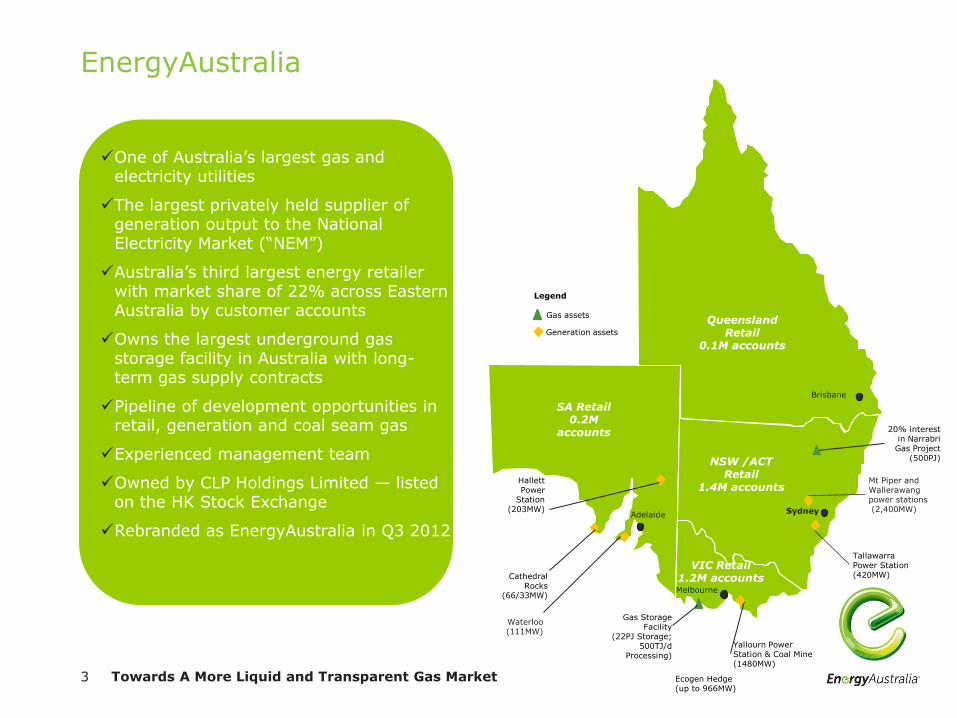
EnergyAustralia
Towards A More Liquid and Transparent Gas Market
One of Australia’s largest gas and electricity utilities
The largest privately held supplier of generation output to the National Electricity Market (“NEM”)
Australia’s third largest energy retailer with market share of 22% across Eastern Australia by customer accounts
Owns the largest underground gas storage facility in Australia with long-term gas supply contracts
Pipeline of development opportunities in retail, generation and coal seam gas
Experienced management team
Owned by CLP Holdings Limited — listed on the HK Stock Exchange
Rebranded as EnergyAustralia in Q3 2012
Gas assets
Legend
Generation assets
Tallawarra Power Station (420MW) Cathedral
Rocks (66/33MW)
Yallourn Power Station & Coal Mine (1480MW)
Ecogen Hedge (up to 966MW)
Gas Storage Facility
(22PJ Storage; 500TJ/d
Processing)
Brisbane
Melbourne
Adelaide
SA Retail 0.2M
accounts
Queensland Retail
0.1M accounts
VIC Retail 1.2M accounts
NSW /ACT Retail
1.4M accounts
20% interest in Narrabri
Gas Project (500PJ)
Mt Piper and Wallerawang power stations (2,400MW)
Hallett Power
Station (203MW) Sydney
Waterloo (111MW)
4
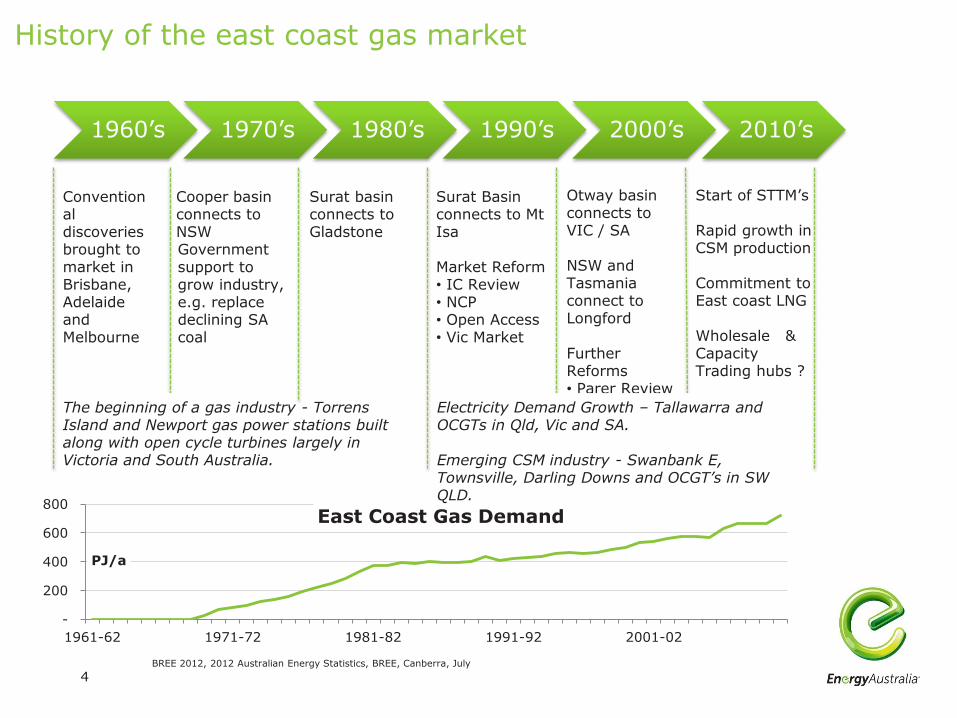
History of the east coast gas market
1960’s 1970’s 1980’s 1990’s 2000’s 2010’s
-
200
400
600
800
1961-62 1971-72 1981-82 1991-92 2001-02
PJ/a
East Coast Gas Demand
Conventional discoveries brought to market in Brisbane, Adelaide and Melbourne
Cooper basin connects to NSW
Surat basin connects to Gladstone
Surat Basin connects to Mt Isa Market Reform • IC Review • NCP • Open Access • Vic Market
Otway basin connects to VIC / SA NSW and Tasmania connect to Longford Further Reforms • Parer Review • AEMA/NGL Conventional Reserves in decline
Start of STTM’s Rapid growth in CSM production Commitment to East coast LNG Wholesale & Capacity Trading hubs ?
The beginning of a gas industry - Torrens Island and Newport gas power stations built along with open cycle turbines largely in Victoria and South Australia.
Electricity Demand Growth – Tallawarra and OCGTs in Qld, Vic and SA. Emerging CSM industry - Swanbank E, Townsville, Darling Downs and OCGT’s in SW QLD.
BREE 2012, 2012 Australian Energy Statistics, BREE, Canberra, July
Government support to grow industry, e.g. replace declining SA coal
5
-
1,000
2,000
3,000
4,000
2008 2013 2018 2023 2028
PJ/
a
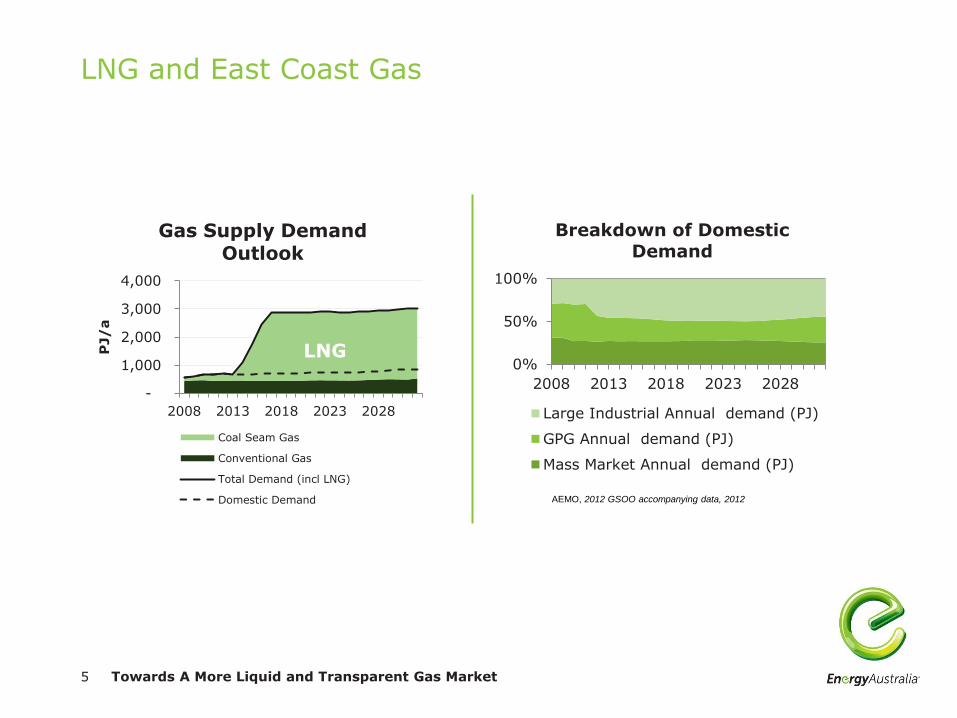
Gas Supply Demand Outlook
Coal Seam Gas
Conventional Gas
Total Demand (incl LNG)
Domestic Demand
0%
50%
100%
2008 2013 2018 2023 2028
Breakdown of Domestic Demand
Large Industrial Annual demand (PJ)
GPG Annual demand (PJ)
Mass Market Annual demand (PJ)
AEMO, 2012 GSOO accompanying data, 2012
LNG and East Coast Gas
Towards A More Liquid and Transparent Gas Market
LNG
6
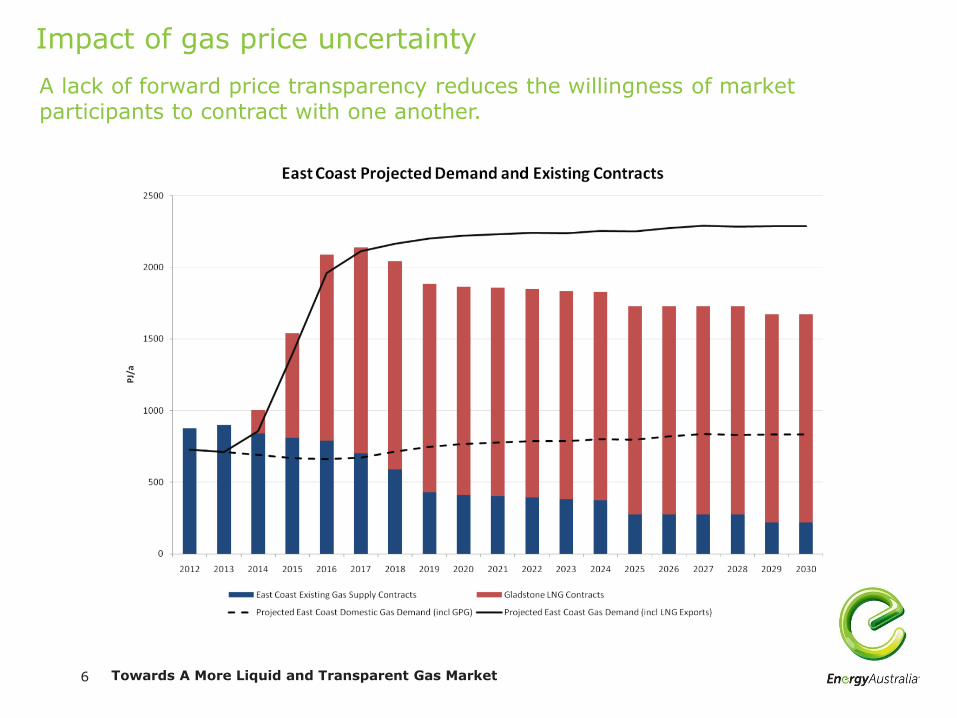
Impact of gas price uncertainty
A lack of forward price transparency reduces the willingness of market participants to contract with one another.
Towards A More Liquid and Transparent Gas Market
7
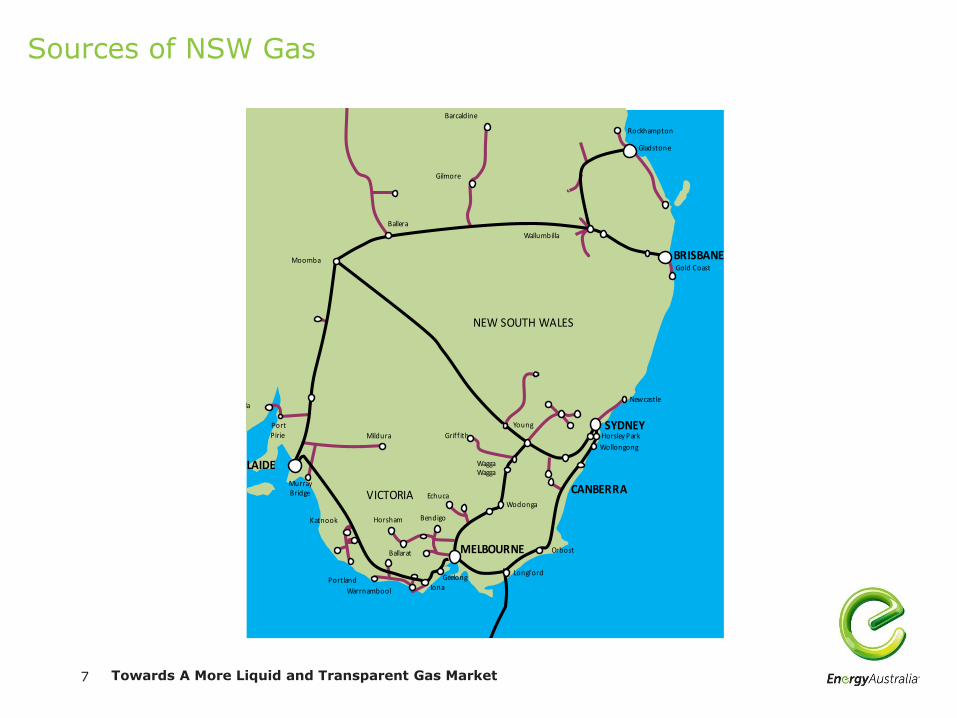
Sources of NSW Gas
Towards A More Liquid and Transparent Gas Market
Gilmore
MurrayBridge
Portland
Warrnambool
Longford
Ballera
Katnook
Wodonga
Geelong
Rockhampton
Gladstone
Wallumbilla
Mt Isa
Townsville
Moomba
Whyalla
PortPirie
Echuca
BendigoHorsham
Ballarat
Newcastle
Wollongong
WaggaWagga
Griff ith
AliceSprings
Barcaldine
McArthurRiver
Young
Mildura
Gold Coast
Orbost
Tennant Creek
Iona
Bell BayPort Latta
Horsley Park
VICTORIA
SOUTHAUSTRALIA
QUEENSLANDNORTHERN TERRITORY
NEW SOUTH WALES
WESTERNAUSTRALIA
TASMANIA
SYDNEY
CANBERRA
MELBOURNE
HOBART
BRISBANE
ADELAIDE
DARWIN
LauncestonBurnie
Mooranbah
8
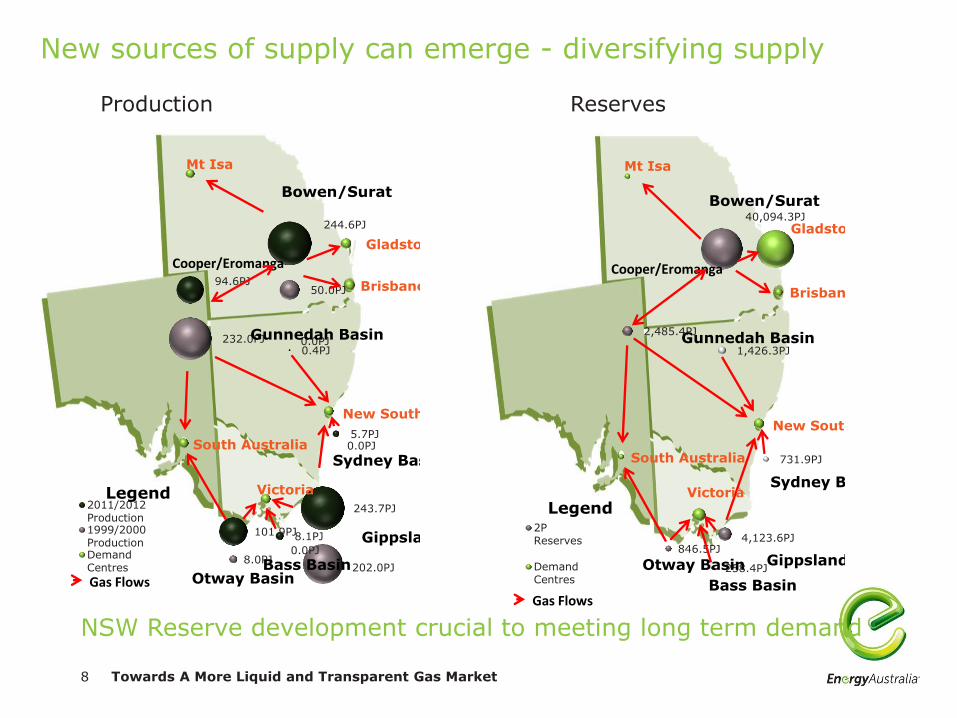
New sources of supply can emerge - diversifying supply
243.7PJ
94.6PJ
101.9PJ 8.1PJ
244.6PJ
5.7PJ
0.4PJ
202.0PJ
232.0PJ
8.0PJ 0.0PJ
50.0PJ
0.0PJ
0.0PJ
2011/2012Production1999/2000ProductionDemandCentres
Bowen/Surat
Cooper/Eromanga
Otway Basin
Gippsland Basin
Bass Basin
Gunnedah Basin
Sydney Basin South Australia
Victoria
Brisbane
Mt Isa
Gladstone
New South Wales
Legend
Gas Flows
4,123.6PJ
2,485.4PJ
846.5PJ
258.4PJ
40,094.3PJ
731.9PJ
1,426.3PJ
2PReserves
DemandCentres
Bowen/Surat
Cooper/Eromanga
Otway Basin Gippsland Basin
Bass Basin
Gunnedah Basin
Sydney Basin
South Australia
Victoria
Brisbane
Mt Isa
Gladstone
New South Wales
Legend
Gas Flows
Production Reserves
NSW Reserve development crucial to meeting long term demand
Towards A More Liquid and Transparent Gas Market
9
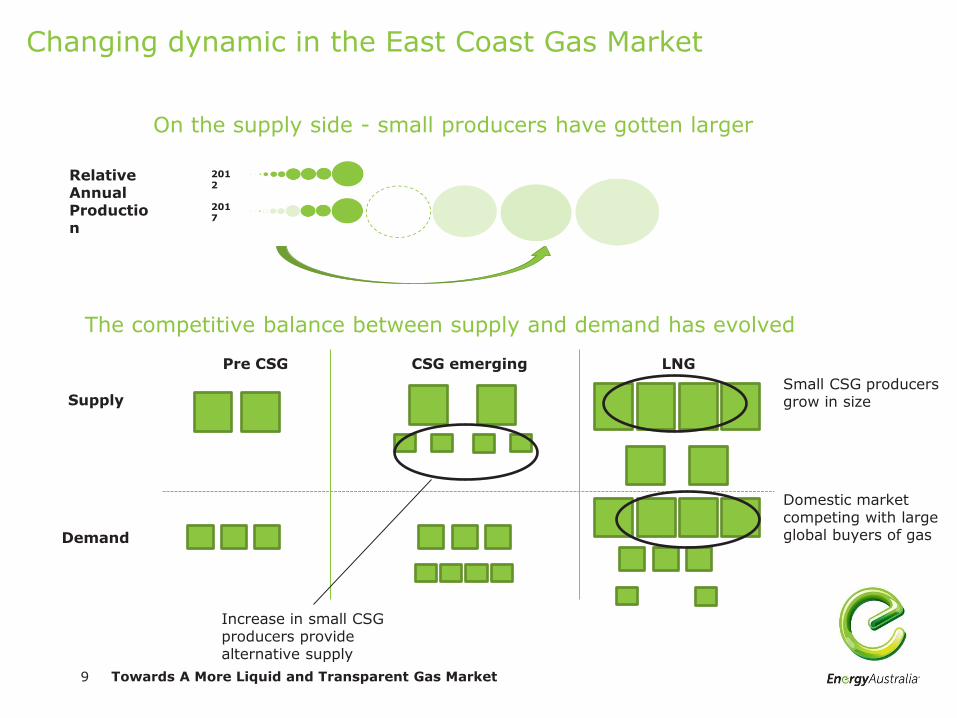
Changing dynamic in the East Coast Gas Market
Towards A More Liquid and Transparent Gas Market
2012
2017
On the supply side - small producers have gotten larger
Relative Annual Production
Pre CSG CSG emerging LNG
The competitive balance between supply and demand has evolved
Supply
Demand
Increase in small CSG producers provide alternative supply
Small CSG producers grow in size
Domestic market competing with large global buyers of gas
10
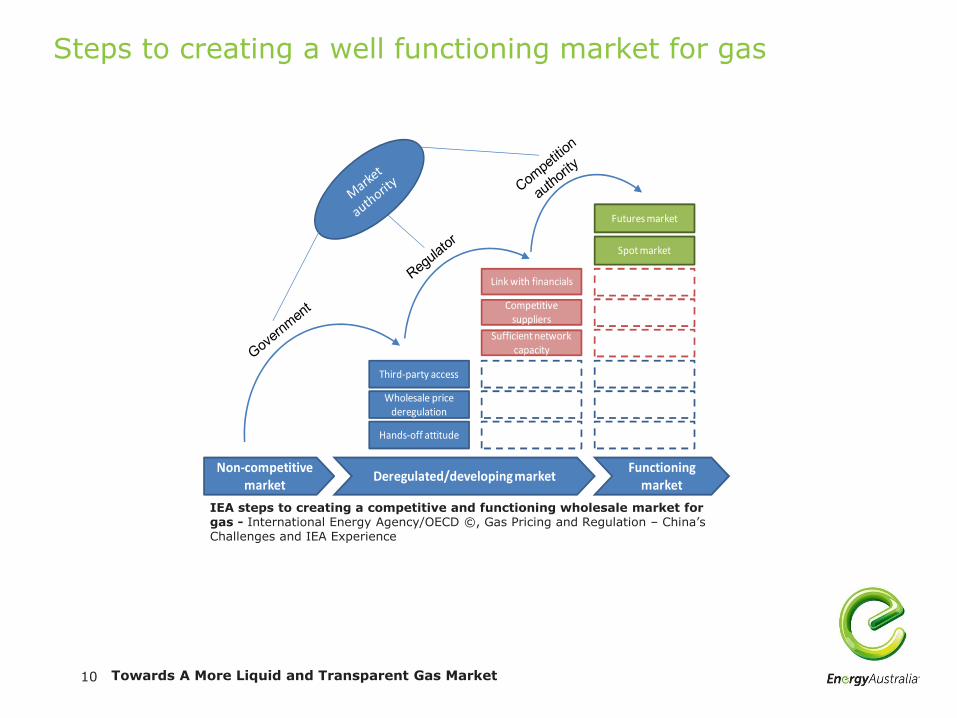
Steps to creating a well functioning market for gas
Towards A More Liquid and Transparent Gas Market
IEA steps to creating a competitive and functioning wholesale market for gas - International Energy Agency/OECD ©, Gas Pricing and Regulation – China’s Challenges and IEA Experience
11
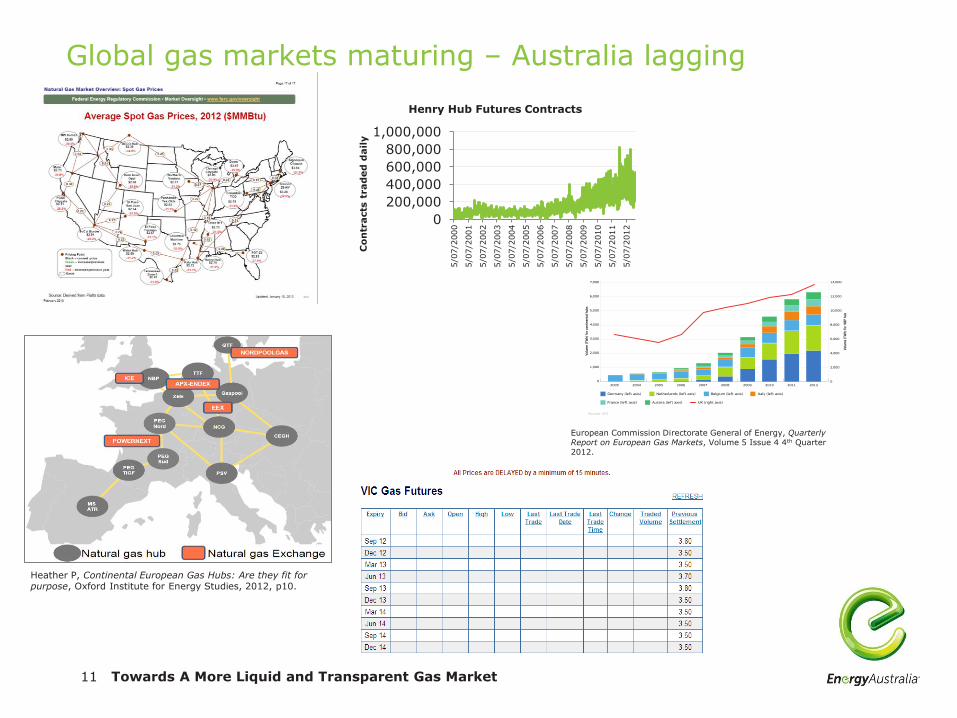
Global gas markets maturing – Australia lagging
Towards A More Liquid and Transparent Gas Market
0
200,000
400,000
600,000
800,000
1,000,000
5/0
7/2
000
5/0
7/2
001
5/0
7/2
002
5/0
7/2
003
5/0
7/2
004
5/0
7/2
005
5/0
7/2
006
5/0
7/2
007
5/0
7/2
008
5/0
7/2
009
5/0
7/2
010
5/0
7/2
011
5/0
7/2
012
Co
ntr
acts
trad
ed
dail
y
Henry Hub Futures Contracts
4
3. Continental European national gas hubs: status and stages of
development
The North West European (NWE) gas markets have seen significant evolutionary change
over the past 10 years both in terms of construct and growth; indeed, in 2002 only two NWE
countries had an operational gas hub, Britain’s NBP (since 1996) and Belgium’s Zeebrugge
(since 2000), and in Germany HubCo9 had just been established. There then followed, one by
one, gas hubs in each of the other NWE countries: the Dutch TTF and the Italian PSV in
2003; the French PEGs in 2004; the Austrian CEGH in 2005; the German EGT10
in 2006; the
German Gaspool and NCG in 2009. Therefore, the current ‘hub landscape’ was complete by
2009 and has shown signs of accelerated development in the last couple of years, especially
since early 2010, through 2011 and the Winter of 2011-12.
Figure 1: European gas hubs and gas exchanges
The situation across all these markets now looks quite different, not only in comparison to a
few years ago, but also to that which presented itself only a year ago in the Spring of 2011.
This is especially true of the Dutch and German markets but there have also been some
9 This gas hub was the forerunner of BEB (2004), which later became Gaspool in 2009.
10 The E.on Gas Transport network’s market was incorporated into the new NCG hub in 2009.
Heather P, Continental European Gas Hubs: Are they fit for purpose, Oxford Institute for Energy Studies, 2012, p10.
European Commission Directorate General of Energy, Quarterly Report on European Gas Markets, Volume 5 Issue 4 4th Quarter 2012.
12
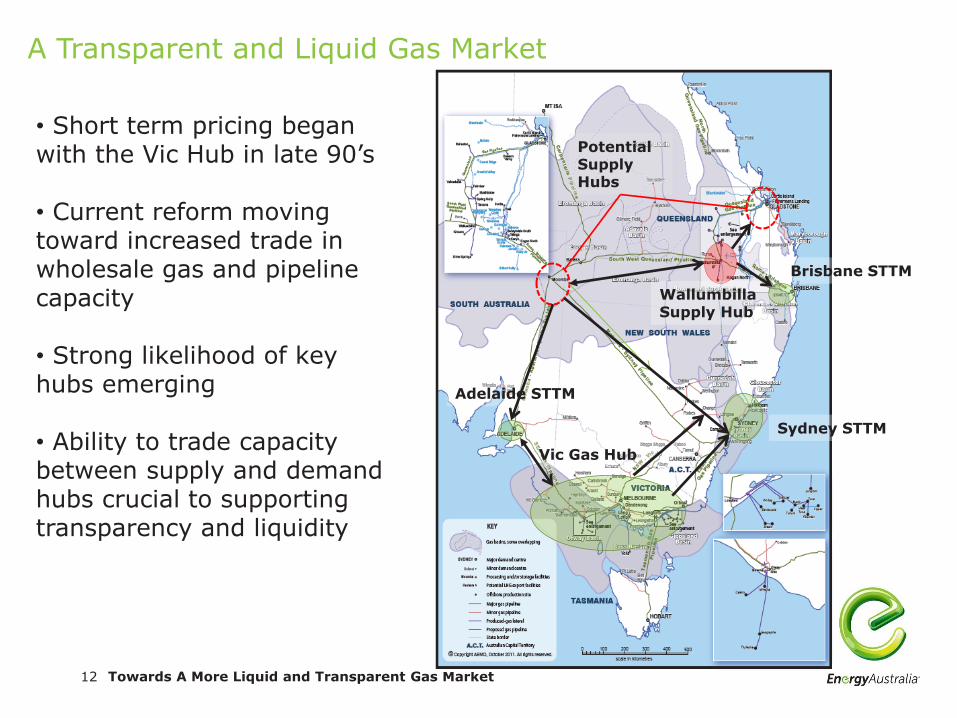
A Transparent and Liquid Gas Market
Towards A More Liquid and Transparent Gas Market
Brisbane STTM
Sydney STTM
Adelaide STTM
Vic Gas Hub
Wallumbilla Supply Hub
Potential Supply Hubs
• Short term pricing began with the Vic Hub in late 90’s • Current reform moving toward increased trade in wholesale gas and pipeline capacity • Strong likelihood of key hubs emerging • Ability to trade capacity between supply and demand hubs crucial to supporting transparency and liquidity

13
A Transparent and Liquid Gas Market
•Enabling guaranteed access to gas by those who value it the most and supporting production by those who can deliver it in the cheapest way.
One
•A more liquid and transparent market for capacity, which encourages more efficient pipeline use and more transparent signals about market demand for investment.
Two
•The role of long term gas and pipeline contracts is diminished. They can still play a role, but are referenced against open and transparent markets.
Three
Towards A More Liquid and Transparent Gas Market