Claims Analysis Study -...
8
Claims Analysis Study: On May 24, 2011, a series of thunderstorms which produced significant hail moved through the Dallas-Fort Worth metroplex and caused an estimated $876.8 million in property and automobile damages. The Insurance Institute for Business & Home Safety (IBHS) utilized property claims and policy-in-force data to evaluate the resiliency of building systems subjected to hail in this event. The study also provided a comparison between radar-estimated maximum hail sizes and damage levels seen in the claims data, to facilitate building relationships between the perceived radar-estimated risk and ground-truth damage data. EXECUTIVE SUMMARY Insurance Institute for Business & Home Safety June 2013 IBHS – RC02 – 2013 Where building science leads to real-world solutions. May 24, 2011 Hailstorms in Dallas-Fort Worth
Transcript of Claims Analysis Study -...

Claims Analysis Study:
On May 24, 2011, a series of thunderstorms which produced
significant hail moved through the Dallas-Fort Worth metroplex
and caused an estimated $876.8 million in property and
automobile damages. The Insurance Institute for Business &
Home Safety (IBHS) utilized property claims and policy-in-force
data to evaluate the resiliency of building systems subjected to
hail in this event. The study also provided a comparison between
radar-estimated maximum hail sizes and damage levels seen in
the claims data, to facilitate building relationships between the
perceived radar-estimated risk and ground-truth damage data.
EXECUTIVE SUMMARY
Insurance Institute for Business & Home SafetyJune 2013
IBHS – RC02 – 2013
Where building science leads to real-world solutions.
May 24, 2011 Hailstorms in Dallas-Fort Worth
CLAIMS ANALYSIS STUDY: MAY 24, 2011 HAILSTORMS IN DALLAS-FORT WORTH
2
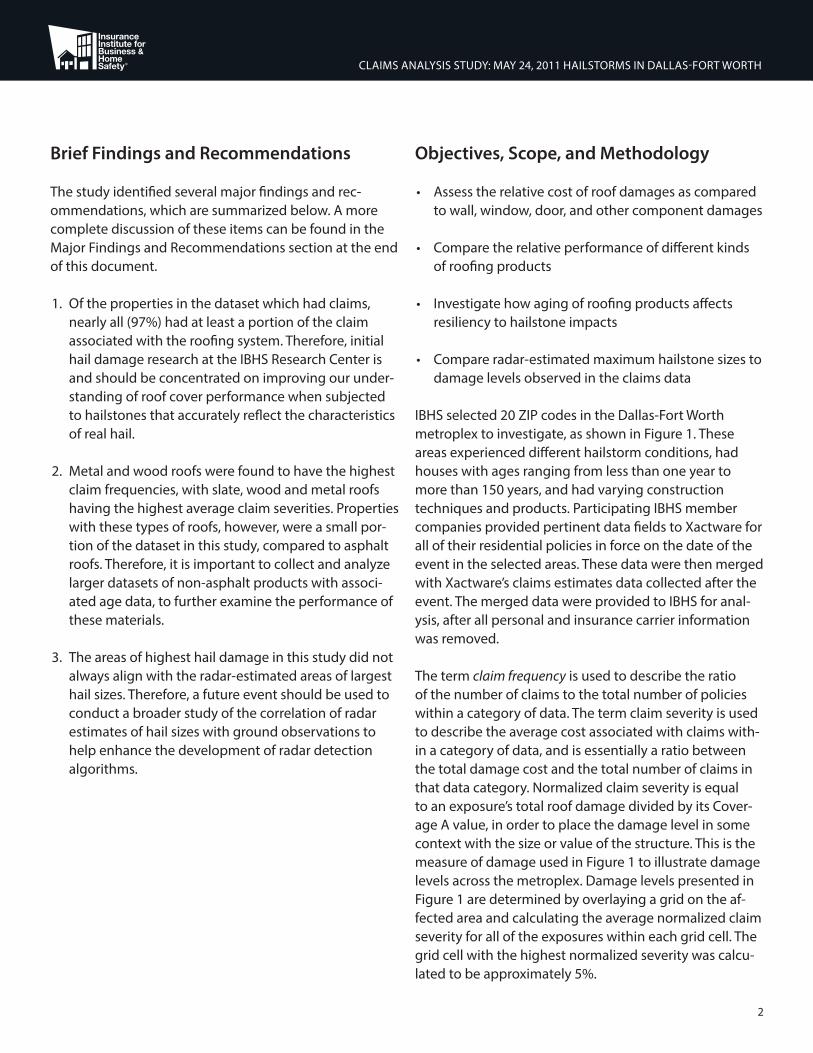
Brief Findings and Recommendations
The study identified several major findings and rec-ommendations, which are summarized below. A more complete discussion of these items can be found in the Major Findings and Recommendations section at the end of this document.
1. Of the properties in the dataset which had claims, nearly all (97%) had at least a portion of the claim associated with the roofing system. Therefore, initial hail damage research at the IBHS Research Center is and should be concentrated on improving our under-standing of roof cover performance when subjected to hailstones that accurately reflect the characteristics of real hail.
2. Metal and wood roofs were found to have the highest claim frequencies, with slate, wood and metal roofs having the highest average claim severities. Properties with these types of roofs, however, were a small por-tion of the dataset in this study, compared to asphalt roofs. Therefore, it is important to collect and analyze larger datasets of non-asphalt products with associ-ated age data, to further examine the performance of these materials.
3. The areas of highest hail damage in this study did not always align with the radar-estimated areas of largest hail sizes. Therefore, a future event should be used to conduct a broader study of the correlation of radar estimates of hail sizes with ground observations to help enhance the development of radar detection algorithms.
Objectives, Scope, and Methodology
• Assess the relative cost of roof damages as compared to wall, window, door, and other component damages
• Compare the relative performance of different kinds of roofing products
• Investigate how aging of roofing products affects resiliency to hailstone impacts
• Compare radar-estimated maximum hailstone sizes to damage levels observed in the claims data
IBHS selected 20 ZIP codes in the Dallas-Fort Worth metroplex to investigate, as shown in Figure 1. These areas experienced different hailstorm conditions, had houses with ages ranging from less than one year to more than 150 years, and had varying construction techniques and products. Participating IBHS member companies provided pertinent data fields to Xactware for all of their residential policies in force on the date of the event in the selected areas. These data were then merged with Xactware’s claims estimates data collected after the event. The merged data were provided to IBHS for anal-ysis, after all personal and insurance carrier information was removed.
The term claim frequency is used to describe the ratio of the number of claims to the total number of policies within a category of data. The term claim severity is used to describe the average cost associated with claims with-in a category of data, and is essentially a ratio between the total damage cost and the total number of claims in that data category. Normalized claim severity is equal to an exposure’s total roof damage divided by its Cover-age A value, in order to place the damage level in some context with the size or value of the structure. This is the measure of damage used in Figure 1 to illustrate damage levels across the metroplex. Damage levels presented in Figure 1 are determined by overlaying a grid on the af-fected area and calculating the average normalized claim severity for all of the exposures within each grid cell. The grid cell with the highest normalized severity was calcu-lated to be approximately 5%.

CLAIMS ANALYSIS STUDY: MAY 24, 2011 HAILSTORMS IN DALLAS-FORT WORTH
3
FIGURE 1 NORMALIZED CLAIM SEVERITY NORMALIZED BY COVERAGE A LIMITS.
Meteorological Data Compared to Claims Data
The majority of large hail reports occurred in Tarrant and Dallas Counties and many reports of hailstones larger than 2 inches were made, including two reports of hail in excess of 4 inches in diameter. Figure 2 provides a representation of the interpolated maximum hail sizes as detected by the Dallas-Fort Worth (KFWD) Weather Surveillance Radar-1988 Doppler (WSR-88D) hail detec-tion algorithm on the evening of May 24, 2011, overlaid on the normalized claim severities depicted in Figure 1. The swath of highest damage rates appears to be orient-ed west-northwest-to-east-southeast, from north-central Tarrant County, into northwestern, central, and eastern Dallas County. The radar-estimated claim severity data show a similar orientation of the largest hail sizes. While the orientation of the damage swath and high radar intensity are similar, the higher damage rates do not necessarily occur where the largest hail is indicated by the radar. This could be due to differences in the ages, materials, construction, or sheltering of the buildings, where stronger, more resilient, or more sheltered struc-tures existed where the largest hail fell. It could also be due to known errors in the ability of single-polarization radar to detect hail and the processing algorithms’ ability to properly distinguish the size of hailstones that fell in a particular area.
FIGURE 2 MAP RELATING NORMALIZED CLAIM SEVERITIES AS SHOWN IN FIGURE 1, TO OPEN CONTOURS OF HAIL SIZES.
Additionally, both layers of data were reclassified on a dimensionless scale and spatially compared in Figure 3. Areas shown in blue indicate where there were relative-ly low damages associated with areas of relatively high radar-estimated hail sizes. Results shown in green indi-cate reasonable agreement between the two datasets. These areas had relatively high damages associated with relatively high radar-estimated hail sizes, or had relatively low damages associated with relatively low radar-esti-mated hail sizes. Results shown in red indicate areas with relatively high damages but relatively low radar-estimat-ed hail sizes. In areas where there was not much damage, the radar and damage data were generally in reasonable agreement. Based upon radar data alone, the damages were higher than expected in areas in northwestern Dal-las County, especially east of the DFW Airport. Damages were lower than expected based on the radar data in north-central Tarrant County, and in central and south-eastern Dallas County.

CLAIMS ANALYSIS STUDY: MAY 24, 2011 HAILSTORMS IN DALLAS-FORT WORTH
4
FIGURE 3 COMPARISON BETWEEN DAMAGE SEVERITIES AND RADAR-ESTIMATED HAIL SIZES.
Data Analysis and Results
The dataset for this project included 67,100 residential policies from several IBHS member companies. Of those policies, 6,697 had claims, of which 6,490 had roofing-re-lated claims. As shown in Figure 4, the roof types were primarily asphalt composite shingles. Additional roofing materials included tile, metal, wood, slate, corrugated fiberglass, roll composition, composite, and membrane roofs. However the last four products listed had sample sizes less than 120 each, which was too small to draw any meaningful conclusions. Therefore, those exposures were removed from the dataset prior to analysis, leaving a sample size of 66,883 policies. There were nearly 20% of policies for which the primary roof covering material was unknown.
Unknown18.80%
Other2.026%
3-tab comp /Arch comp
79.19%
Metal 0.65%
Other
Tile 0.93%
Wood 0.24%
Slate 0.20%
Roof Covers
FIGURE 4 DISTRIBUTION OF ROOF COVER MATERIALS FOR ALL POLICIES CONTAINED IN THE DATASET.
Component Damage
All damages associated with a claim were categorized as roof, wall, door, window, or other (soffit and fascia) dam-age, to allow for a comparison between the major build-ing systems. The claim frequencies and severities for the component categories are illustrated in Figure 5. Claim frequencies for roofing-related claims were higher than for any other components, with nearly 10% of all poli-cies in the dataset having some roof damage. With the exception of roofing products, the average losses for the component categories were less than $1,000 per claim. Not only were the claim frequencies higher for roofing systems, but when there was a claim, the payout for the roofing-related damage was more than 10 times higher than for any other component category, which confirms that roofing-related damages were the loss driver for this particular event. As depicted in Figure 6, on average, the roofing-related losses make up more than 90% of the total claims amount.
Roof
9.6%
12%
10%
8%
6%
4%
2%
0%
6.7%
1.1% 0.4%
5.3%
Oth
er
Wal
l
Doo
r
Win
dow
Perc
enta
ge o
f Cla
ims
Type of Damage
Claim Frequency: Components
$10,000
$8,000
$6,000
$4,000
$2,000
$0
Roof
$8,790
$827$744 $213
$223
Oth
er
Wal
l
Doo
r
Win
dow
Aver
age
Clai
m C
ost
Type of Damage
Claim Severity: Components
FIGURE 5 DISTRIBUTION OF CLAIM FREQUENCIES AND SEVERITIES ASSOCIATED WITH MAJOR BUILDING COMPONENT GROUPS.

CLAIMS ANALYSIS STUDY: MAY 24, 2011 HAILSTORMS IN DALLAS-FORT WORTH
5
Other6.1%
Roof91.7%
Wall 0.9%
Door 0.1%
Window 1.3%
Damage by Component
FIGURE 6 DISTRIBUTION OF AVERAGE TOTAL DAMAGE PER EXPOSURE BY COMPONENT.
Roof Damage
The roof system included the roof covering material along with other roofing components such as flashing, vents, underlayment, and sheathing, among others. The claim frequencies and severities categorized by roof cov-ering type are presented in Figure 7. Many of the claim frequencies for some material groups were less than 20%, while all were less than 30%. There is a large range in the claim severities dependent upon the material category. Several roof cover types including asphalt and tile, had severities less than $10,000. Claim severities for all materials were less than $40,000.
Metal, slate, and wood roofs are often found on larg-er, more expensive properties and the claim severities associated with them were more than three times higher than the other roof covering categories. Therefore, the claim severities for all exposures were normalized by the Coverage A limit, which is the total insured value of the property, as shown in Figure 8. The normalized values are more similar amongst all material types, where all claim severities are less than 10% of the Coverage A limit. Nevertheless, the normalized claim severity for metal and wood roofs was more than twice that of any other roofing material.
3-ta
b co
mp/
Arch
Com
p
11%
28%
7%
11%
22%
1%
10%
Met
al
Slat
e
Tile
Woo
d
Unkn
own
Tota
l
Type of Roof Cover
30%
25%
20%
15%
10%
5%
0%
Perc
enta
ge o
f Cla
ims
Claim Frequency: Roof Damage
$40,000
$30,000
$20,000
$10,000
$0
3-ta
b co
mp/
Arc
h Co
mp
$8,256
$33,658$37,245
$9,678
$34,756
$756
$8,790
Met
al
Slat
e
Tile
Woo
d
Unk
now
n
Tota
l
Aver
age
Clai
m C
ost
Type of Roof Cover
Claim Severity: Roof Damage
FIGURE 7 DISTRIBUTION OF CLAIM FREQUENCIES WITH RESPECT TO ROOF COVERING MATERIALS.
10%
8%
6%
4%
2%
0%
3-ta
b co
mp/
Arc
h Co
mp
3.8%
9.2%
4.3%
2.9%
9.6%
0.3%
3.9%
Met
al
Slat
e
Tile
Woo
d
Unk
now
n
Tota
l
Aver
age
Clai
m C
ost
as a
Per
cent
age
of
Cove
rage
A L
imit
Type of Roof Cover
Normalized Claim Severity: Roof Damage
FIGURE 8 DISTRIBUTION OF NORMALIZED CLAIM SEVERITIES WITH RESPECT TO ROOF COVERING MATERIAL. DATA ARE NORMALIZED BY THE COVERAGE A LIMITS.

CLAIMS ANALYSIS STUDY: MAY 24, 2011 HAILSTORMS IN DALLAS-FORT WORTH
6
Effects of Aging
In recent years, there has been an increased focus on the effects of aging on the durability and performance of materials. IBHS has conducted several studies in the last decade which have shown that older buildings have a higher claim frequency in a variety of natural disasters. In some cases this may be due to changes in building codes requiring stronger construction for new buildings. In other cases it could be due to degradation of the build-ing materials or poor maintenance practices for the older buildings.
For this study, the ages of homes were divided into five-year bins, and the claim frequencies and severities were evaluated for asphalt roofs. It should be noted that the age groups correspond to the ages of the homes and not the ages of the roofs. For the newer homes, some assumptions can be made that the roof is likely the original roof and is therefore the same age as the house. The claim frequencies and normalized claim severities with respect to age for asphalt shingle roofs are provided in Figure 9. In general, the claim frequencies tended to increase with increasing age of the home. In each of the five-year periods, the normalized claim severities were less than 5%, but showed a pattern of increasing losses with age.
0-4
5-9
10-1
4
15-1
9
20-2
4
25-2
9
30-3
9
40-4
9
50+
Tota
l
30%
25%
20%
15%
10%
5%
0%
Claim Frequency: Asphalt Roofs
*Age is based on the year of construction.Age of building*
Freq
uenc
y of
Cla
ims
0-4
5-9
10-1
4
15-1
9
20-2
4
25-2
9
30-3
9
40-4
9
50+
Tota
l
10%
8%
6%
4%
2%
0%
Normalized Claim Severity: Asphalt Roofs
*Age is based on the year of construction.Age of building*
Seve
rity
of C
laim
s
FIGURE 9 CLAIM FREQUENCIES AND NORMALIZED CLAIM SEVERITIES WITH RESPECT TO AGE FOR ASPHALT ROOFS.

CLAIMS ANALYSIS STUDY: MAY 24, 2011 HAILSTORMS IN DALLAS-FORT WORTH
7
Major Findings and Recommendations
Importance of the Roof: Of the properties in the dataset which had claims, nearly all (97%) had at least a portion of the claim associated with the roofing system. Only 3% of the homes with dam-age had damage only to the non-roof systems such as walls, doors, windows, or other components. The losses associated with roof damages represented more than 90% of the total claims payout for the properties in the database.
RECOMMENDATION: Initial hail damage research at the IBHS Research Center is and should be concentrated on improving our understanding of roof cover performance when subjected to hailstones that accurately reflect the characteristics of real hail. More research is needed to understand the difference between functional and cosmetic damage, particularly for asphalt shingle roofs. This research would help determine if cosmetic damage leads to functional damage down the road after the asphalt has been exposed to the elements for some period of time and whether there are cost effective ways to repair shingle roofs that just have cosmetic damage.
Roofing Materials: Unfortunately, the numbers of properties with roof covers other than asphalt shingles was quite small in the database. Consequently, the results can be significantly biased by damage to relatively few properties. With this caution in mind, the data exhibited the following trends: Metal and wood roofs had the highest claim frequencies at 28% and 22% respectively. Average claim severities were highest for slate, wood, and metal roofs, at over $33,000 each. When normalized by the Coverage A amount, wood, metal, and slate roofs still had the highest claim severities, but they were more similar to those of the other materials. All materials had average normalized claim severities less than 10%.
RECOMMENDATION: To further examine the performance of ma-terials, it is important to collect and analyze larger datasets of the non-asphalt products with associated age data. Because of small sample sizes, it is possible that a few older or poorly maintained roofs of the non-asphalt products may have caused the higher claim frequencies or severities associated with these less-common products. These products tend to have higher costs associated with them compared to asphalt shingles, so if they are damaged the replacement cost would be higher than for asphalt shingles.
Damage Locations Compared to Hail Size Estimates:Some areas in the study were found to have reasonable agreement between the two datasets, i.e., relatively high damage rates were generally co-located with relatively high radar-estimated maximum hail sizes, while relatively low damage rates were generally co-located with rela-tively low radar-estimated hail sizes. Some areas where the damages rates were higher than expected given the radar-estimated hail sizes were located in northwestern Dallas County, particularly east of the DFW Airport. Some areas where the damage rates were lower than expect-ed given the radar-estimate hail sizes were located in north-central Tarrant County, and central and southeast-ern Dallas County.
RECOMMENDATION: The areas of highest hail damage do not always align with the meteorological data concerning largest hail sizes. This could be based on variations in the ages or conditions of the homes as well as the construction quality and materials in a particular community. It could also be due to a lack of ground reports or poor radar detection in high damage areas. While the data in this study showed reasonable agreement between the damage and radar patterns in most areas, those who rely on radar data as a way to identify hail swaths or areas with the largest hail-stones should do so with caution. Current radar algorithms for hail detection are somewhat prone to errors especially at significant distances from the radar site.
Radar observations are relatively coarse, both spatially and tem-porally, and for this event, the volumes of data begin hundreds or thousands of feet above ground level, increasing with increasing distance from the radar. Radar data may indicate the presence of hail when in reality heavy rain is falling. The radar may also over- or under-estimate the size of hail if present. Radar data can be use-ful in determining overall relative patterns of hailfall, but should not be relied upon for accurate determinations of the severity of damage. Now that the National Weather Service has completed upgrading all of their Weather Surveillance Radar-1988 Doppler radars with enhanced dual-polarization radar capabilities, a future event should be used to conduct a broader study of the cor-relation of radar estimates of hail sizes with ground observations to help enhance the development of radar detection algorithms.

Claims Anaylsis Study: May 24, 2011 Hailstorms in Dallas-Fort WorthPublished June 2013
IBHS – RC02 – 2013