
CIVIL ENGINEERIN STUDIES - IDEALS
37
UILU-ENG-94-2009 CIVIL ENGINEERIN STUDIES STRUCTURAL RESEARCH SERIES NO. 591 ISSN: 0069-4274 Constraint Effects on Fracture Initiation Loads in HSST ide-Plate Tests By Robert H. Dodds, Jr. University of Illinois A Report on a Research Project Sponsored by the HEAVY-SECTION STEEL TECHNOLOGY PROGRAM OAK RIDGE NATIONAL LABORATORY OAK RIDGE, TENNESSEE DEPARTMENT OF CIVIL ENGINEERING UNIVERSITY OF ILLINOIS AT URBANA-CHAMPAIGN URBANA, ILLINOIS JULY 1994
Transcript of CIVIL ENGINEERIN STUDIES - IDEALS

UILU-ENG-94-2009
CIVIL ENGINEERIN STUDIES STRUCTURAL RESEARCH SERIES NO. 591
ISSN: 0069-4274
Constraint Effects on Fracture Initiation Loads in HSST ide-Plate Tests
By
Robert H. Dodds, Jr. University of Illinois
A Report on a Research Project Sponsored by the HEAVY-SECTION STEEL TECHNOLOGY PROGRAM OAK RIDGE NATIONAL LABORATORY OAK RIDGE, TENNESSEE
DEPARTMENT OF CIVIL ENGINEERING UNIVERSITY OF ILLINOIS AT URBANA-CHAMPAIGN URBANA, ILLINOIS JULY 1994

50272-101
REPORT DOCUMENTATION PAGE
4. Title and Subtitle
1. REPORT NO.
SRS 591 2. 3. Recipient's Accession No.
5. Report Date
Constraint Effects on Fracture Initiation Loads in HSST WidePlate Tests 6.
July 1994
7. Author(s)
Robert H. Dodds, Jr.
9. Performing Organization Name and Address
University of Illinois at Urbana-Champaign Department of Civil Engineering 205 N. Mathews Avenue Urbana, Illinois 61801
12.Sponsoring Organization Name and Address
Oak Ridge National Laboratory Managed by Martin Marietta Energy Systems, Inc. Oak Ridge, TN 37831-6285
15. Supplementary Notes
16.Abstract (Limit: 200 words)
8. Performing Organization Report No.
UILU-ENG-94-2009 10. Project/Task/Work Unit No.
11. Contract(C) or Grant(G) No.
19X-SM986V
13. Type of Report & Period Covered
Final: 4-1-93 to 3-31-94
14.
During the period 1984-1987, researchers of the Heavy Section Steel Technology program at the Oak Ridge National Laboratory performed a unique series of fracture mechanics tests using exceptionally large, SECT) specimens Ca/W = 0.2) fabricated from a reactor pressure vessel material, A533B Class 1 steel. These "wide-plate" specimens have test sections of width W = 1000 mm, thickness B = 100 mm and initial crack lengths of 200 mm. While the specimen design, instrumentation and pre, post-test analyses focused on the cleavage run-arrest events, a disturbing outcome of the program centered on the inability offracture mechanics analyses at that time to predict the loads required to initiate the first cleavage event - required loads exceeded twice those estimated from 3-D finite element analyses. The source of the much larger than expected initiation loads remained unresolved at completion of the wideplate test program.
This study re-examines fracture initiation loads in the wide-plate tests using two constraint assessment methodologies developed over the past five years: the J-Q toughness locus approach and the toughness scaling approach based on a local failure criterion for cleavage. Both approaches demonstrate a significant loss of constraint in the elastic-plastic fields ahead of the crack in the wide-plate specimens caused by the inherent negative T -stress of the shallow notch SECT) configuration. Moreover, the 25 mm wide machined notch required for specimen fabrication is shown to further reduce constraint by introducing a traction free surface very near the crack tip. Both of these factors combined to reduce near-tip stresses by 10% below those of the small-scale yielding, SSY CT= 0), fields. This reduction places fracture results for the wide-plate specimens within the J-Q toughness locus defined by fracture toughness tests on the A533B material and within the constraint corrected Jc values defined by the toughness scaling methodology.
17. Document Analysis a. Descriptors
Fracture mechanics, finite elements, cleavage, elastic-plastic, J-integral, constraint, stress triaxiality, micromechanics, size effects, wide-plates, A533B
b. Identifiers/Open-Ended Terms
c. COSATI Field/Group
18. Availability Statement
Release U nlimi ted
(See ANSI-Z39.18)
19. Security Class (This Report)
UNCLASSIFIED
20. Security Class (This Page)
UNCLASSIFIED
21. No. of Pages
38
22. Price
OPTIONAL FORM 272 (4-77) Department of Commerce

Constraint Effects on Fracture Initiation Loads in
HSST ide-Plate Tests
By
Robert H. Dodds, Jr. Department of Civil Engineering
University of Illinois
A Report on a Research Project Sponsored by the:
HEAVY-SECTION STEEL TECHNOLOGY PROGRAM (HSST) OAK RIDGE NATIONAL LABORATORY OAK RIDGE, TENNESSEE 37831-6285
University of Illinois Urbana, Illinois
July 1994

1. Introduction
During the period 1984-1987, researchers of the Heavy Section Steel Technology program at the Oak Ridge National Laboratory performed a unique series of fracture mechanics tests using exceptionally large specimens [18]'. The test program focused on understanding multiple cleavage run-arrest events in single edge notch tension, SE(T), specimens fabricated from a reactor pressure vessel material, A533B Class 1 steel. The "wide-plate" specimens, as they are now generally termed, comprise test sections of width W = 1000 mm, thickness B = 100 mm and initial crack lengths of200 mm. End tabs, each 4 m in length, were welded to the 1 m x 1 m x 0.1 m test section to enable the application of pin loading. A steep temperature gradient imposed over the specimen width induced a corresponding toughness gradient, ranging from near lower-shelf conditions on the cold edge to upper-shelf conditions on the hot edge. Under remote tensile loading of these specimens, the crack initiates by cleavage in the low temperature region, propagates dynamically into material at higher temperature (and toughness) and eventually arrests when material toughness equals the dynamic driving force (multiple arrest and cleavage re-initiation events occurred in the tests).
While the specimen design, instrumentation and pre, post-test analyses focused on the cleavage run-arrest events, a disturbing outcome of the program centered on the inability offracture mechanics analyses to predict the loads required to initiate the first cleavage event. In the earliest specimens, the required loads exceeded twice those estimated from 3-D finite element analyses (to estimateKI) and from fracture toughness values obtained using 1-T and 2-T tests of conventional C(T) specimens. The unexpectedly high loads taxed the loading capacity of the system and precipitated a major nuisance in the experimental program. In subsequent tests, the crack-front thickness was reduced well below the 100 mm plate thickness with chevron notching in an effort to increase the effective KI. In yet other specimens, the KI generated by the remote tensile loading was supplemented with pressure loading applied directly to the crack faces using pillow jacks in addition to the chevron notching. These efforts realized only partial success. The source of the much larger than expected initiation loads remained unresolved at completion of the wide-plate test program.
Over the past five years, significant advancements have occurred in understanding the effects of specimen size, material flow properties and loading modes (tension, bending) on measured values of cleavage fracture toughness. Two complementary methodologies have evolved to quantifY the effects of crack tip stress triaxiality (constraint) on the macroscopic measure of elastic-plastic fracture toughness, J. In the continuum mechanics methodology [19,20], two parameters, J and Q, suffice to characterize the full range of near-tip environments at the onset offracture. J sets the size scale for the zone of high stresses and large deformations while Q scales the near-tip stress level relative to a high triaxiality reference stress condition of small-scale yielding (SSY). Full-field finite element calculations show that the J-Q field dominates over physically significant size scales, i.e., it describes the environment in which brittle and ductile failure mechanisms are active. The material's fracture resistance is characterized by a toughness locus, Jc(Q), which defines the sequence of J-Q values at fracture determined by experiment from high constraint conditions (Q::::::O) to low constraint conditions (Q<O). When specimens fracture under well-contained yielding, the complexity of a full-field nonlinear analysis becomes unnecessary; Q under such conditions is given quite accurately using the elastic T-stress for the specimen combined with a relatively simple, boundary layer analysis [21,6,12].
t Numbers in [] indicate references listed in Section 7.
1

The J-Q (and J-T) approach becomes prohibitively expensive as the number of specimens and temperatures of interest increases. To reduce the cost, a near-tip failure criterion for cleavage fracture [5,8] is introduced to predict the toughness locus using stress fields from finite element analyses and the J c values from a few fracture toughness tests. Recent developments in the formulation of a robust and simpler model [2,10,11] focus on the observation of a strong similarity in the shapes of principal stress contours enclosing the crack tip under increased loading and across different fracture specimens. While the spatial variation remains self-similar, the sizes of principal stress contours vary dramatically as crack tip constraint evolves under loading (size refers here to distances from the tip along a ray at some angle 8). The near-tip criterion for cleavage fracture employs the volume of material bounded within principal stress contours around the crack tip at fracture to correlate J c values for different specimens and loading modes, i.e., J c values for different geometrieslloading modes are scaled for the deterministic effects of constraint. The similarity in shapes of the principal stress contours as constraint evolves under loading is entirely consistent with the J-Q description of the crack tip stress fields. For an appliedJ-value, the size (but not the shape) of principal stress contours is altered by the near-tip, approximately hydrostatic stress states of adjustable magnitude characterized by Q.
This study re-examines the wide-plate tests using the J-Q and the toughness scaling methodologies to explain the unexpectedly large initiation loads at fracture. Both approaches demonstrate a significant loss of constraint in the elastic-plastic fields ahead of the crack caused by the inherent negative T-stress of the shallow notch SE(T) configuration. Moreover, the 25 mm wide machined notch required for specimen fabrication is shown to further reduce constraint by introducing a traction free surface very near the crack tip. Both of these factors combined to reduce near-tip stresses by 10% below those of the small-scale yielding, SSY (T= 0), fields. This reduction places fracture results for the wide-plate specimens within the J-Q toughness locus defined by fracture toughness tests on the A533B material and within the constraint corrected Jc values defined by the toughness scaling methodology.
The contents of the paper are as follows: (i) an overview of the wide-plate test program and a subsequent test program which used the same material and large SE(B) specimens, (ii) development of the J-Q and toughness scaling methodology with sufficient detail for application to the wide-plate and fracture test specimens, (iii) finite element analyses performed on the wide-plate specimens and companion SE(B), C(T) fracture specimens to compute crack tip stresses and J-values needed for constraint assessments. The paper concludes with a detailed section which evaluates the wide-plate specimens using these two methodologies.
2.. Overview of Wide-Plate Tests
The first wide-plate test program (series WP-1, [18]) investigated the run-arrest behavior of cracks in large plates possessing steep toughness gradients. Test sections of size 1 m X 1 m X
0.1 m were fabricated from A533B Class 1 steel plate as single-edge notch fracture specimens loaded by a remotely applied tensile force. Initial crack depth-to-specimen width ratios (alW) of nominally 0.2 were tested. A linear temperature profile was imposed across the 1 m wide plate to develop the steep toughness gradient. The crack initiated by cleavage on the low temperature side, propagated dynamically into material at higher temperature (and toughness) and eventually arrested when material toughness equaled the dynamic driving force. Extensive instrumentation on the specimens recorded the crack initiation and propagation events. Post-test analyses revealed a complex sequence of initiation-;..run-;..arrest-;..reinitiation events.
2

This section summarizes the specimen configurations and material properties of the wideplate tests relevant to the present investigation of the much larger (than expected) loads required to initiate the first cleavage event. Complete details of the fabrication, testing procedure and material characterization are provided in [18].
EB Weld Crack
~13~m 187 mm
80
Q) en
""0 W
+ w
.--- EndTa~
+
Q) en
""0 W +-' o I
1 m x 1 m xO.1 m test section
12.7 mm deep side grooves
Figure 1 Schematic of HSST wide-plate crack-arrest specimen (WP-1 series).
2.1 Specimen Configurations
Figure 1 shows the overall specimen design with the 1 m X 1 m X 0.1 m test section welded to end tabs through which the pin loading was applied. In the WP-1 series, six such specimens were fabricated and tested (designations WP-1.1 through WP-1.6). Precracking was performed by hydrogen charging of an electron beam (EB) weld located at the base of a machined notch (187 mm long by 25.4 mm wide). This procedure generated a sharp-tipped crack of ~ 13 mm in length at the end of the machined notch. The 187 mm long notch, terminated by the 13 mm crack, provided an overall specimen crack length of nominally 200 mm for an ao/W ~0.2. Side grooves with depth 12.7 mm were employed in all six specimens. The crack plane is perpendicular to the rolling direction (L-T orientation).
3

Table 1 summarizes the dimensions for the four specimens examined in the present study (WP-1.2, 1.3, 1.5, 1.6). Testing procedures for specimens WP-1.1 and 1.4 introduced additional complications: WP-1.1 underwent a warm prestress cycle; WP-1.4 had crack face loading applied by a pillow jack in addition to the remote tensile loading. This work omits consideration of these two specimens.
The unexpectedly large load required to initiate the first cleavage event in WP-1.2 prompted the in trod uction of chevron notches at the crack front in subsequent specimens. Chevron notching reduced the plate thickness at the crack front by ~ 50% in specimens WP-1.3, 1.5 and 1.6. Three-dimensional, linear-elastic finite element analyses conducted prior to these tests predicted a 35% increase in applied Kr at mid-thickness relative to the WP-1.2 specimen (no chevron notching).
Table 1 also provides the measured crack-front temperatures and measured loads at initiation of the first cleavage fracture event for the four test specimens (WP-1.2, 1.3, 1.5, 1.6). Additional columns provide: the nominal axial stress at fracture (neglecting side-grooves), the mid-thickness Kr at fracture (computed using geometry factors from the linear, 3-D finite element analyses and measured fracture loads), and the ratio of Kr at fracture to Krc (applicable Krc values derived from pre-test fracture characterization studies conducted on compact tension specimens). The large Kr/Krc ratios (> 2) remained unexplained at conclusion of the wide-plate test program.
2.2 Material Characterization
The 1 m X 1 m X 0.1 m test sections of specimens in the WP-1 program were taken from the same HSST plate of A533B steel, designated Plate 13A. A single manufactured Plate 13 was divided into plates 13A, 13B to facilitate shipment and further fabrication. Plate 13A was quenched and tempered, then stress relieved which produced exceptionally uniform, throughthickness properties. Table 2 lists the mechanical properties for Plate 13A at -40°C. Multi-linear models for the uniaxial, tensile stress-strain curve over a range of temperatures are also available (see Fig. 4.4 and Table 4.2 of [18]). In the finite element analyses described later in this report, a power-law hardening representation following an initial linear response is adopted with the hardening exponent taken as n = 10. TheRTNDT (ASME reference nil-ductility temperature) is -23°C as measured by drop weight/Charpy testing in the L-T orientation.
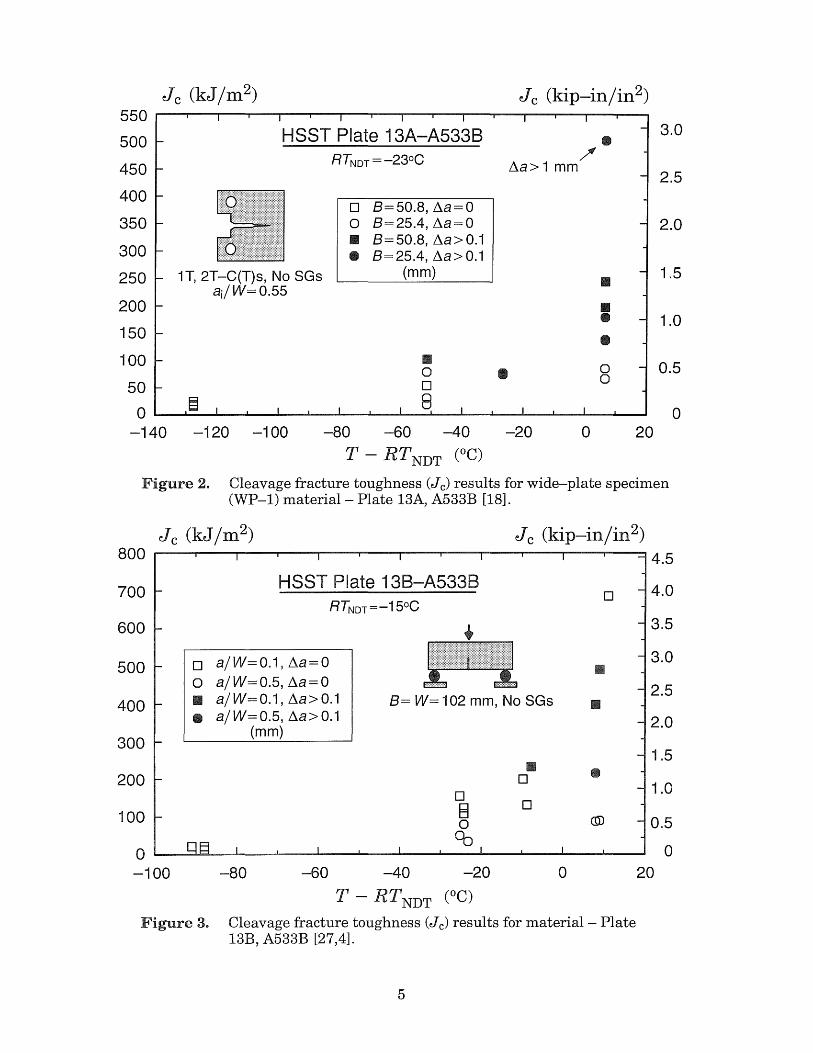
Nineteen compact tension tests, 1T-C(T) and 2T-C(T) with a/W;::::::0.55, were fabricated from Plate 13Amaterial and tested to quantify fracture toughness over the ductile-to-brittle transition (DBT) region. Additional tests were performed at higher temperatures to characterize the R-curve for the material. Test temperatures ranged from -150°C to -18°C; all of these tests terminated in cleavage, with the development of significant ductile crack extension prior to cleavage at only the highest temperatures. Figure 2 shows the measured J c values (J at cleavage fracture). Specimens with 0.1 mm or greater of ductile tearing prior to cleavage are highlighted.
A recent HSST investigation [27,4] has examined the shallow crack effect on fracture toughness by testing single-edge notched beams, SE(B)s, taken from HSST Plate 13B. This plate received a heat treatment similar to Plate 13A used for the WP-l test program. Table 2 lists the mechanical properties measured at -40°C. The RTNDT is -15°C for this material compared to -23°C for Plate 13A. Eighteen SE(B) specimens with W = B = 102 mm and span of 610 mm were tested over a range of temperatures in three-point bending. Six specimens had deep cracks (a/W = 0.5); the remaining twelve specimens had shallow cracks (a/W = 0.1). Figure 3 shows themeasuredJc values for the eighteen SE(B) specimens. Measurements of ductile tear-
4
550 r--r--r--r--r--r--r-~~r-~~--~~--~~--~~
500
450
400
350
300
250
200
150
100
50
HSST Plate 13A-A5338
o 8=50.8, ~a=O o 8=25.4, ~a=O II 8=50.8, ~a>O.i • 8=25.4, ~a>O.i
iT,2T -C(T)s, No SGs (mm) ajjW=0.55
~a>i mm
•
• /'
II
II • • 0 0
§ o ~~--~~--~~~--~~--~~--~~----~----~
3.0
2.5
2.0
1.5
1.0
0.5
0 -140 -120 -100 -80 -60 -40
T - RT NDT (OC)
-20 0 20
Figure 2. Cleavage fracture toughness (Jc) results for wide-plate specimen (WP-l) material - Plate 13A, A533B [18].
J c Ckip-injin2) 800 ~~~~--~--~--~--~---r---r--~--~--~~4.5
700
600
500
400
300
200
100
HSST Plate 138-A5338 RTNDT = -i5°C
o ajW=O.i, ~a=O o ajW=0.5, ~a=O II ajW=O.i, ~a>O.i • ajW=0.5, ~a>O.i
8= W= 102 mm, No SGs
(mm)
o E3 o
Go
II o o
o
II
•
4.0
3.5
3.0
2.5
2.0
1 ~ , .>OJ
o ~~~--~--~~~~~~--~--~--~--~--~--~
1.0
0.5
o -100 -80 -60 -40 -20 o
T - RT NDT (OC)
Figure 3. Cleavage fracture toughness (Jc) results for material- Plate 13B, A533B [27,4].
5
20

ing prior to cleavage are available for 6 of the specimens; in each of these cases !1a < Dc (the estimated CTOD at cleavage). In terms of J c , the shallow crack specimens exhibit a mean toughness 2.5 X the mean toughness of the deep notch specimens for tests conducted in the transition range, T -RTNDT = -25 to + 10°C. At temperatures on the lower-shelf of the DBT curve, there is no shallow crack effect (both deep and shallow specimens fracture under conditions of small-scale yielding and "valid" ASTM E399 [3] toughness values, Krc, are measured). To simplifY subsequent discussions of constraint effects on the fracture loads of the wide-plate tests, the J c values measured using C(T) and SE(B) specimens from Plates 13A and 13B given in Figs. 2, 3 are combined into a single data set with temperatures referenced to RTNDT.
Table 1. WP-1 series test specimen dimensions and measured values at cleavage fracture initiation from the pre-cracked configuration [18].
Specimen Designation
Quantity WP-1.2 WP-1.3 WP-1.5 WP-1.6
Width (w, mm) 998 1000 1000 1000
Initial crack length (ao, mm) 199 197 200 200
Thickness (B, mm) 101.8 99.5 101.7 101.8
Notched thickness (BN, mm) 77.5 75.4 76.4 75.5
Chevron thickness (Be, mm) * 47.5 41.2 40 (thickness at ao)
Crack front temp. (Tf, DC) -33 -51 -30 -19
Crack front temp. (Tf-RTNDT, DC) -10 -28 -7 4
Fracture load (Pf, MN) 18.9 11.25 11.03 14.5
Stress at fracture (aOO
, MPa) 186 113 108.5 142.5
Kr at fracture (MPa' ylm) 252 174 180 232
Kr/Krc 2.9 2.5 2.0 2.1
* Chevron not used
Table 2. Mechanical properties for HSST A533B Class 1 Plates 13A and 13B [18,27].
HSST A533B Plate Designation
Property 13A (@ -40°C) 13B (@ -40°C)
Young's modulus (E, GPa) 209.5 207.2
Poisson's ratio (v) 0.3 0.3
Yield stress (ao, MPa) 457 454
Ultimate stress (au, MPa) 650 640
Flow stress (afl, MPa) 553 547
Nil-ductility temp. (RTNDT,OC) -23 -15
6

3.. Constraint Assessment Procedures
In fracture test specimens and structural components, both subjected to low levels of loading, crack tip plastic zones remain "small" relative to the crack length, ligament length and thickness. Under such conditions, often termed small-scale yielding (SSY), there exists a unique coupling between load, JJ Kr and the near tip strain-stress fields. A single fracture parameter (Kr or J) suffices to describe both the near tip fields and the measured fracture toughness. However, under increased load, the SSY fields gradually breakdown as the crack tip plastic zones interact with nearby traction free boundaries; the crack tip fields are no longer uniquely described by J or Kr, and the measured fracture toughness becomes a complex function of spec imen geometry, loading mode and material flow properties.
Considerable recent work [19-12,2-31] in fracture mechanics focuses on quantifYing these kinematic effects of plastic flow at the crack tip to predict the influence on fracture toughness. Two approaches of interest here are the J-Q theory to describe crack tip fields as developed by O'Dowd and Shih [19,20] and the constraint model to scale cleavage fracture toughness developed by Dodds and Anderson[2,10,11]. Both approaches quantify the level of loading (relative to specimen size, crack size, and material flow properties) when global plasticity impinges on the SSY crack tip fields.
The J-Q theory provides an approximate two-parameter description of the elastic-plastic crack tip stress and strain fields. J scales with the global loading and defines the local crack tip deformation (CTOD r:xJ lao); Q scales the level of stress triaxiality over the relevant fracture process zones ahead of the crack tip (1-5 x CTOD). Material toughness (cleavage or initiation of ductile tearing) becomes a function of both J at fracture and Q at fracture; different specimen geometries and loading modes produce a variety of J-Q "loading paths" which lead to a J-Q toughness locus connecting measured fracture points on such paths.
In the Dodds and Anderson approach, constraint effects on fracture toughness are quantified by coupling the global failure pararneter (Jc) with a local failure criterion for cleavage. The model is designed for ferritic materials operating in the ductile-to-brittle transition region when fracture occurs by a stress-controlled, transgranular cleavage mechanism. The near tip stress field at fracture in a common test specimen, typically an SE(B) with a/W = 0.5, is correlated through finite element analyses to other specimens to predict the relative J-values at fracture. The criterion requires a common intensity of crack tip stress fields at fracture in all specimens even though the J values may differ significantly. By adopting a specific fracture mechanism (stress-controlled cleavage), the effects of stress triaxiality (Q) are reflected in the measured/predicted values of fracture toughness (Jc)' Extensive testing required to generate a toughness locus is reduced but with a loss of generality - the transition between a ductile tearing and cleavage mechanism cannot be predicted by the model.
The following sections outline essential features of the J-Q and the Dodds-Anderson approaches for constraint assessment needed to evaluate the wide-plate tests.
3.1 J-Q Theory
The J-Q description of Mode-I, plane-strain crack tip fields derives initially from consideration of the modified boundary layer (MEL) solution [7] which expresses near tip stresses for linear elastic, conditions in the form [32],
KI -a .. = -- 1-' .. (8) + Tol·o l · u j2nr J U L J
(1)
7

Here rand e are polar coordinates centered at the crack tip with e = 0 corresponding to a line ahead of the crack. Crack tip fields differing in stress triaxiality are generated by varying the the non-singular stress, T, parallel to the crack plane. Within the plane-strain MBL formulation,
J = 1 - v 2 KJ E I
(2)
where J is Rice's J-integral [23], E is Young's modulus and v is Poisson's ratio.
In the computational model for small-scale yielding, the conditions defined by Eq (1) are imposed incrementally on the remote outer boundary of a symmetrically constrained, semi-circular mesh of elements focused on the crack tip. When the plastic zone remains small relative to the extent of the modelled region, the non-singular T-stress term does not affect computed values of J, as implied by Eq (1). However, Larsson and Carlsson [16] were the first to demonstrate that the second term significantly alters the plastic zone shape and size as well as stresses ahead of the crack tip. These elastic-plastic crack tip fields can be organized into a family of fields parameterized by T / ao:
aij = ao lij ( J/ao
,8; Tjao) , (3)
where a 0 is the tension yield stress of the material. Subsequent work by Leevers and Radon [17], Bilby, et al. [7] and more recently by Betegon and Hancock [6], Wang and Parks [31] and others have explored the applicability of this J-T, MBL description of crack tip fields in fracture specimens; the appeal being the simplicity of estimating an elastic-plastic value for J and an elastic value for T. This methodology proves quite successful [14] in well-contained yielding, especially for specimen geometries which exhibit very high constraint (large positive Tstresses; deep notch bend, compact tension, a/W?:. 0.5) and very low constraint (large negative T-stresses; middle crack tension, shallow notch bend, a/W:5 0.2). However, the elastic Tstress, which increases proportionallywithKr, becomes ambiguous under conditions of largescale yielding as Kr saturates to a constant value at limit load.
O'Dowd and Shih [19,20] employed asymptotic and finite element analyses to develop an approximate two-parameter description of the crack tip fields without the limitations of the T-stress,
~ ( r n ~ \ aij = ao Tij \ J iao' f1; Jet) , (4)
Eij = EO gij(J/ao
,8;Q ) (5)
The dimensionless second parameter, Q, in Eqs (4,5) defines the mechanism by which aij and 8 ij in fracture specimens differ from the adopted SSY (T = Q = 0) reference solution at the same applied-J. For non-zero values of the T-stress, Q and Texhibit a one-to-one correspondence in SSY that varies only with the material flow properties [21].
Through extensive 2-D finite element analyses, O'Dowd and Shih showed that, to a good approximation, Qa 0 represents the difference of the hydrostatic stress between SSY(T = 0) and fracture specimens over the forward sector ahead of the crack tip,
(6)
8

Operationally, Q is defined by
_ °ee - (oee)sSY;T=O Q = °0 '
at () = 0, r = 2J /°0 (7)
where the specimen stresses (oee) in Eq (7) are evaluated from finite element analyses containing sufficient mesh refinement to resolve the fields at this length scale (where the fracture specimen and SSY are loaded to the same J). Values ofQ derived from small-displacement, smallstrain analyses are adequate for most applications.
J
o -Measured Toughness Values (~a = 0) -Measured Toughness Values (~a > 0)
SE(B), a/W=0.5
SE(B), a/W=0.1
Upper Estimate of / Toughness Locus
Lower Estimate of Toughness Locus
o ~--~-=~~~--~--~--~--------------~--~--~--~~ 0.2 0.0 -0.2 -0.4 -0.6 -0.8 -1.0 -1.2
Q [@ r/(J/oO) = 2]
Figure 4. Schematic of J-Q "loading paths" for fracture specimens and example construction of upper and lower limit toughness loci from measured J-values.
Figure 4 shows typical J-Q "loading paths" for several types of fracture specimens. Additional examples of J-Q loading paths, including those at locations along the curved front of a surface cracked plate, are available [11,13]. At low deformation levels (J---;..O), the fracture specimens experience SSY(T:::::::O) conditions and Q remains very nearly zero (Q and Tare uniquely related under SSY and T oc Kr). Once large-scale yielding conditions prevail, hydrostatic stresses at the crack tip are substantially less than those in SSY (T::::::: 0) at the same J-value. This difference produces negative Q values once the specimen deviates from SSY conditions. For deeply notched SE(B) and C(T) specimens, the elastic T-stress is positive and thus Q takes on slightly positive values at low deformation levels before constraint loss occurs.
Testing of fracture specimens enables construction of the J-Q toughness locus for a material at a specified temperature. The test program should utilize fracture specimens that generate
9

high, intermediate, and low constraint in terms of J-Q loading paths. Experimentally measured J-values at fracture (cleavage or ductile initiation) are plotted on the loading paths computed by finite element analyses for the specimens. The Q-value at fracture is thus not measured; it is determined from the position of J at fracture on the loading path. The usual scatter in results observed for multiple tests of the same specimen configuration defines points that lie along the loading path for that specimen (Fig. 4 illustrates this). By connecting, separately, the upper-most fracture value on all loading paths tested and then the lower-most fracture values, estimates for practical upper and lower bound toughness loci may be constructed. The potential overlap of cleavage and ductile initiation results on the upper and lower loci define constraint levels required to alter the fracture mode (cleavage under high constraint and tearing under low constraint). Lower and upper estimates of fracture loads for another type of specimen or structural component are predicted using toughness values defined at the intersection of the specimen/component's computed J-Q loading path with the material's lower and upper toughness locus.
3.2 Toughness Scaling Model for Cleavage
Dodds and Anderson quantify the geometric effects on fracture toughness by coupling the global fracture parameter (Jc) with a near-tip failure criterion. The model addresses ferritic materials operating in the ductile-to-brittle transition region which fracture by transgranular cleavage. For this failure mechanism, several models have been proposed [24-30]. These models assume a favorably oriented particle (e.g. carbide or inclusion) initiates cleavage fracture. Failure of this particle creates a microcrack which triggers global fracture through a local Griffith instability. The stochastic sampling effects of locating a favorably oriented particle to trigger the initial microcrack suggest that the highly stressed volume of material in the forward sector ahead of the crack plays a dominant role.
These features led to adoption of the material volume ahead of the crack tip over which the normalized (maximum) principal stress, a dao, exceeds a critical value as the local failure criterion. Unlike previous local models for cleavage fracture, the present methodology does not attempt to predict values of J c from metallurgical parameters that describe the distribution and strength of cleavage triggering particles. Rather, this model predicts the variation of fracture toughness with constraint changes for a specified material/temperature by scaling to a common reference condition.
By employing the family of near-tip states in the form ofEq (6), the maximum principal stress also has the (approximate) form
a1 (r ) ao = fa Ja/aa,e + Q (8)
For any given value of Q and e, a 1 / a 0 decreases monotonically once r extends beyond the finitely deformed region of r :5 J/ao' Rearrangement of the above expression furnishes a relation for the distance r as a function ofe and a l /aO as
(9)
Consider now a particular level of the principal stress al /aO' The areaA over which the principal stress is greater than adao is given by
10

:rc
h =! I gi<O; at/ao, Q)dO (10)
-:rc
The area enclosed by the contour of level 0 1/00 depends on J as well as the triaxiality of the near-tip fields identified with Q. To fix ideas, letAo and J 0 designate the area and J associated with the Q = 0 field (SSY, T= 0), and letAFB and JFB designate the area and J associated with a crack in a finite body with Q ~ O. Then we have
:rc
ho =! I gi(e; al/aO' Q = O)dO (lla-b)
-:rc
and
:rc
hFB =! I gi(e; adao, Q)dO (12a-b)
-:rc
Upon initial loading of the finite body, Q = 0 so that hFB = ho; compare Eqs (lIb) and (12b). As the load increases, plasticity spreads over the body, Q becomes non-zero, and hFB begins to deviate from ho.
5
4
3
2
1
fully plastic
Principal stress contour mostly within finite deformation zone
SE(8) a/W=0.15, n= 10
o~----~----~------~----~----~------~----~----~
2.0 2.5 3.0
0 1/00
3.5 4.0
Figure 5. Effects of principal stress on predicted fracture toughness ratio, JFB/JO, for a shallow notch SE(B) specimen.
11

For the same material and specified temperature, the present model requires attainment of equivalent stressed volumes (AFB x thickness, B) for triggering of cleavage fracture in different specimens, i.e., once the stressed volumes are equal so are the probabilities for triggering cleavage fracture). The ratio of applied J-values in a finite body and the reference Q = 0 stress state that generate equivalent stressed volumes is found by equating areas in Eqs (lla) and (12a) to yield
hO(a1/aO)
hFB(a1/aO)
AO(a1/aO)
AFB(a1/aO)" (13)
The J ratios are evaluated using Eq (13) at each loading level and for a range of principal stress values. The ratio quantifies the size and geometry dependence of cleavage fracture toughness. A critical value of Jo represents the fracture toughness of an infinitely large specimen (SSY, T= 0); aJFB/Jo> 1 implies that the specimen has experienced a constraint loss that causes the commonly observed increase in measured fractured toughness. Consider, for example, a test specimen that fails atJc= 200kJ/m2 and thecomputedratioJFB/Jo=2 at fracture (JFB = Jc)in the test specimen; then a very large specimen (assumed to be in SSY) made from the same material and tested at the same temperature is predicted to fail at J c = 100 kJ/m2. Similarly, the fracture toughness ratios for test specimens with the same absolute size but varying crackdepth to specimen-width, a/W, may be quantified. The model predicts a sharp increase in fracture toughness with decreasing a/W ratio.
Computational studies of SSY with T~ 0 and of various fracture specimens often reveal a noticeable independence of the JFB/JO ratio on the selected aI/aO (which must be sufficiently large, e.g., > 2, so that the contour lies entirely in the forward sector and in the plastic zone). Figure 5 illustrates the variation ofJFB/JO with aI/aofor a shallow notch SE(B) specimen. The J-Q description of the principal stresses given by Eq (8) implies that the shape of principal stress contours (the fo function) is maintained while the relative magnitude of the contours varies directly with the hydrostatic stress Qao. This self-similarity of principal stress contours prevails only to the extent that the approximate J-Q description of the crack tip stresses remains valid. At very large-scale yielding, particularly for specimens subjected to severe global bending, the similarity breaks down and JFB/JO varies strongly with aI/aO (Fig. 5 shows this behavior at the largest load levels aao/J <30).
The computational procedures outlined above have been applied to generate JFB/JO ratios for a variety of test specimens (including surface cracked specimens) and Inaterial properties [2-11,13]. Figure 6 provides the results of such computations for SE(B) specimens having a range of a/W ratios modelled with an n = 5 strain hardening material. Values of JFB and Jo are plotted on separate axes to facilitate removal of the size effect in experimental data. Points on the curves describe (JFB, J o) pairs that produce equal stressed volumes of material in the test specimen and in the SSY model. Upon initial loading, crack tip plasticity is well contained within a surrounding elastic field and identical values for JFB and Jo correspond to the same stressed volume of material at the crack tip. This 1:1 line is shown on the figure for reference. At higher loads and as constraint relaxes under extensive plastic flow, the test specimen requires more applied-J (JFB > J 0) to achieve the same conditions for cleavage (same stressed volume) as in SSY.
Information of this type is useful for both analysis of fracture test data and for assessing the defect integrity of structures. PathA-B-C shown in Fig. 6 illustrates the procedure to remove geometry dependence from experimental cleavage fracture toughness data (Jc value at A) by determining the geometry independent cleavage fracture toughness (Jo value at C) corre-
12

sponding to a measured J c value. Alternatively, Fig. 6 permits determination of the apparent fracture toughness for an SE(B) with any a/Wratio from a known Jo value (path C-D-E for example).
JO/baflow 0.020
0.016
0.012
0.008
c 0.004
0.0 0.0
n=5 Ejao = 500
Jo = JSE(B) / ~,
/ /
/
0.01
/
/ /
ajW = 0.5
ajW = 0.25
ajW = 0.15
ajW = 0.05 Ir-------,
0.02
JFB/baflow
0.03 0.04
Figure 6. Predicted effects of a/W ratio and absolute size on cleavage fracture toughness for SE(B) specimens.
4.. Finite Element Analyses Plane-strain finite element analyses were performed to obtain detailed descriptions of the crack tip stress fields for the wide-plate specimens and for the fracture specimens used in the material testing programs- SE(B) with a/W=O.l, 0.5 for Plate 13B material and C(T) with a/W = 0.6 for Plate 13A material. The SSY solutions for stresses on the crack plane needed to evaluate Q and toughness ratios, JFB/JO, in these geometries are summarized. The remainder of this section outlines the details of the models, solution procedures and the approach developed to represent the effects of side grooves and chevron notches.
4.1 Constitutive Model
The material model employs J2 deformation plasticity theory (nonlinear elasticity) in a conventional small-strain setting. The uniaxial stress-strain curve follows a linear then power-law model given by
13

EEO = :;0 E:::; EO (14)
fo = (gJ E > EO (15)
where EO and a o define limits for the initial linear portion of the response. A small, cubic transition region eliminates the discontinuous tangent modulus at E = EO; nonlinearity of the a - E
curve actually begins at E = 0.95Eo' The transition region significantly enhances the convergence rate of the global Newton iterations. Wang [31] provides additional details of this constitutive model.
Finite element solutions for the wide-plate specimens and for the fracture specimens are performed using n = 10, E lao = 500 and v = 0.3. Numerical results are normalized by ao and the appropriate specimen dimension (minimum of the crack length, a, or the remaining ligament, b) to accommodate variations in the actual yield stress and specimen size. The n = 10 exponent provides a good approximation to the measured a - E curves for Plate 13A, 13B over the temperature range -40°C to 35°C (at lower temperatures a definitive Luder's band develops). The yield stress varies approximately 3-5% over this temperature range.
4.2 Finite Element Models
Figure 7 shows the plane-strain finite element models defined for the wide-plate specimen, the SE(B) specimen with a/W = 0.1 and the C(T) specimen. Symmetry conditions permit modeling of only one-half of each specimen. A typical half-symmetric mesh contains 600 elements and 1600 nodes. Eight-noded isoparametric elements with reduced (2x2) Gauss quadrature are employed in all of the models. Reduced integration eliminates locking of arbitrarily shaped elements once the incompressible conditions offully plastic deformation constrain volumetric changes in the displacement gradients.
Concentric rings of polygonal-shaped elements surround the crack tips. The innermost ring contains elements collapsed into wedge shapes with side nodes retained at the mid-point position. Initially coincident nodes at the crack tip are left unconstrained. This model produces a 1/r strain singularity appropriate for n~ 00 and allows blunting deformations of the tip. The concentric rings of elements have sizes that increase geometrically with r. The mesh gradation provides at least 5-8 elements over the domain 1 < riot < 5, except for the very earliest stages of loading wheno t is truly infinitesimal.
The organization and size of the central core of elements in the crack tip region is common for all meshes. The core elements are divided into 40 rings of increasing size with 10 elements per ring (6 in the forward sector). Elements incident on the crack tip have side length WILe = 1400 for a l(T) specimen.
4.3 Solution Procedures
Loads are increased to final values in variably sized increments, typically a total of 40 increments, with full Newton iterations performed within each increment. Stringent criterion are specified to ensure convergence of strains and stresses in the third significant figure. Three to five iterations per increment are generally required for convergence. Given the strain path independence of stresses in deformation plasticity, converged values for strains and stresses are invariant of the load increment sizes used in the computations. The number and magnitude of the load increments is selected to provide a complete description of the response history and to maintain quadratic convergence of the Newton iterations.
14

J-integral values are obtained using the domain integral method [32,33]. The variation among J-values computed over element rings adjacent to the crack tip elements and rings remote from the tip is less than 1% as expected for the very refined models and deformation plasticity.
Numerical computations were performed on HP 9000 workstations using PATRAN [22] for mesh generation and Finite [9] for analyses and domain integral computations.
+ Remote (Pin) Loading
c..) ) () ) () U ( U U () t.:.:.:.:.:.· ••• •••••.••.• ,,, •• , ................... ,.,., ••••••••••.•••• , .•••••.• : ••••• :.' •.• : •.•.• :.:.:.:.:.:.:.:.:.:.,
Wide-Plate Specimens
R=12.5 mm
Crack Tip Region for Wide-Plate Model Including Machined Notch.
~
• h r----' r'\
r'\ \..../
r'\
'-"
"
~~ :: ~:
SE B a ( ), / W=O.1
.:.:.:.;.:.: ............ ,." ...... " ... , ......... , ....... , ....... ,., .•. , ........... , .•.•. , ...................................................... :.:.:.:.:.:.:.:.:.:.:.:.:.:.:.,
All Models Use 8-Node, 2-D Plane-Strain Elements (2 x 2 integration). Same Absolute Element Sizes Used in Crack Tip Region for All Models.
C(T) a/W=O.6
Figure 7. Finite element models for analyses of wide-plate and fracture test specimens.
4.4 Small-Scale Yielding Solutions
Figure 8 shows the opening mode stresses on the crack plane for the SSY (T = 0) model obtained for this constitutive model using finite element analyses in a related study [14]. For convenience in post-processing finite element solutions offracture test specimens, continuous functions are constructed to fit the SSY stresses which take the form
(16)
where
(17)
15

4
3
n a f3 y
5 1.5144 -0.17669 -2.0260
10 2.0600 -0.095105 -4.4849
20 2.4904 -0.047627 -6.6943
Fitting Function: a ee = a rf3 exp(yr) ao
E :0; EO ~ Uniaxial a-£
c > co )
2 ~~~--~~~--~~--~~~--~~~--~~~--~~--~~ o 0.005 0.015 0.020
Figure 8. Opening mode stresses on crack plane for small-scale yielding (T= 0). Uniaxialo-c model is power-law hardening after an initial linear response (small-strain analyses).
and a,(3, yare curve fitting parameters. The table included in Fig. 8 lists the values of these parameters for n = 5, 10 and 20.
4.5 Effects of Side Grooves and Chevron Notching
The plane-strain finite element model for the wide-plate specimens includes the 25 mm wide by 187 mm long machined notch with a semi-circular tip at which the ~ 13 mm long sharp crack forms. However, this model cannot include directly the effects of side grooves present in all four specimens listed in Table 1 and the chevron notch present in specimens WP-1.3, 1.5 and 1.6. Post-test analyses conducted using a 3-D linear-elastic model (with side grooves and chevron notches) predicted Kr values larger at mid-thickness on the crack front relative to values obtained with the present plane-strain model at common values of remotely applied stress, 0
00 (Kr values at fracture listed in Table 1 are predicted from the the 3-D analyses),
The following procedure defines an approximate method to incorporate the effects of side grooves and chevron notches within the framework of the nonlinear plane-strain analyses performed here to study constraint effects on fracture initiation loads. Using the specimen dimensions, remote stresses at fracture and Kr values at fracture listed in Table 1, a non-dimensional geometry factor, F3-D, is defined for each specimen by
16

/G-D F - 1 3-D -----"'--=
a3- D laao (18)
where a:; _ D denotes the experimentally measured (remote) stress at fracture in the wide-plate specimens. A linear-elastic analysis of the plane-strain, wide-plate model shown in Fig. 7 provides the plane-strain value of the geometry factor, F2-D = 1.365, from
K?-D F - _----=1::..-...",,= 2-D -
a2-D jnao (19)
where the plane-strain value for Kr above is obtained from the domain integral J-value using the conversion defined by Eq (2). At fracture in each wide-plate test, simple estimates (neglecting the machined notch) indicate a plastic zone size on the order of 30 mm; consequently, the specimens remain essentially linear elastic with nonlinear stresses in the crack tip region loading governed by Kr and the T-stress. To approximate the 3-D effects, the plane-strain model is subjected to an increased, effective remote stress which makes Iq-D = Kr-D. Using Eqs (18,19), the effective stress is given by
00 00 F 3 - D aeff = a3-D~
2-D (20)
Table 3 summarizes the effective stress at fracture for each of the wide-plate test specimens.
The nonlinear analysis of the plane-strain model for the wide-plate specimens provides the evolution of J and the constraint parameters (Q, Jo) with increasing levels of remotely applied stress. Estimates of Jc-Q and Jo at fracture in each wide-plate specimen, shown in Table 3, are given by results of the plane-strain model evaluated at the effective value of remotely applied stress (20) listed in Table 3.
5. Results and Discussions
The wide-plate specimens experienced cleavage fracture initiating from the starter crack at temperatures (T-RTNDT, DC) of-10, -28, -7 and +4 for specimens WP-1.2, 1.3, 1.5 and 1.6, respectively (refer to Table 1). Corresponding values of fracture toughness for the material are available at temperatures (T-RTNDT, DC): -27, +5 for Plate 13A and for -25, -8, +8 for Plate 13B (refer to Figs. 2 and 3). In the analyses of constraint effects described subsequently, these results are treated in two groups. In group one, the measured response of specimen WP-1.3 is compared to material toughness data for Plate 13A at -27 and Plate 13B at -25 (T-RTNDT, DC). In group two, the measured responses of specimens WP-1.2, 1.5, 1.6 are compared to material toughness data for Plate 13A at +5 and for Plate 13B at -8, +8 (T-RTNDT, DC).
SE(B) specimens used to perform fracture toughness tests on Plate 13B material have the same thickness (~100 mm) as the wide-plate specimens. However, fracture tests performed on Plate 13A used 25 mm and 50 mm thick C(T) specimens providing a ratio of 4: 1 and 2: 1 in plate thickness relative the wide-plate specimens. Previous experimental and theoretical work [30,29] on ferritic steels in the transition region demonstrates an absolute thickness effect on fracture toughness not related to constraint. Metallurgical variations in the material along the crack front require a statistical treatment of thickness in experimental fracture toughness data. Wallin [30] employs weakest link statistics to obtain the following statistical correction for fracture toughness data in specimens of different thickness (B1 and Bo) which fail by cleavage without previous ductile tearing,
17

Kcarr,l = K min + (K1c, 0 - Kmin) (BB
01)1/4 .
(21)
Recasting Eq (21) in terms of J yields,
J carr, 1 = J min + (J c, 0 - J min) (BB
01) 1/2 .
(22)
The corrections given in Eqs (21,22) arise solely from the different volume of material sampled along the crack front due to the different thicknesses. Each point along the crack front is assumed to be stressed at the same level. As the sampled volume increases, the probability of finding a metallurgical weak link increases. Because the failure of a weak metallurgical defect controls cleavage fracture, fracture toughness decreases with increasing probability of finding a defect. Jrnin for ferritic materials is quite small (~2-3 kJ/m2 ) and can be neglected in the above equation.
Table 3. Effective stresses, Jc-Q and Jo values at fracture for plane-strain models of WP-1 series test specimens.
Specimen Designation
Quantity WP-1.2 WP-1.3 WP-1.5 WP-1.6
a3- D expo at fracture (MPa) 186 113 108.5 142.5
K{-D at fracture (MPa' ylm) 252 174 180 232
Initial crack length (ao, mm) 199 197 200 200
F3-D (Eq 18) 1.71 1.96 2.09 2.05
a:;r at fracture (Eq 20, MPa) 233 162.3 166.1 214
J c (using a:tr, kJ/m2) 309 141 148 255
Q (at fracture using J c) -0.33 -0.23 -0.25 -0.31
Jo (at fracture using J c, kJ/m2)) 131 78.3 83.3 120
J /Jo (at fracture) 2.36 1.80 1.78 2.13
F2-D = 1.365
To apply this statistical thickness correction for the Plate 13A C(T) tests, the measured Jc-values for the 25 mm and 50 mm thicknesses are corrected to a 100 mm thickness by reducing (multiplying) the measured values by (25/100)1/2 = 0.5 and (50/100)1/2 = 0.7, respectively.
5.1 Constraint Assessment Using J-Q Theory
Figure 9 provides the J-Q driving force curves determined from the finite element analyses for the wide-plate model and for the various specimens used to obtain the fracture toughness values shown in Figs. 2 and 3 (a/W = 0.1, 0.5 SE(B)s and a/W = 0.6 C(T)s). With J normalized as shown by the crack length, a, (or remaining ligament, b) and yield stress, one curve for each configuration suffices to describe the results for different absolute specimen sizes having these material flow properties (linear plus power-law hardening, n = 10 and E lao = 500). Note that
18

E/ao ratios fortheA533B materials described in Table 2 are somewhat smaller than the nominal value of 500 used in the finite element analyses.
10-1
10-2
10-3
0.2
Linear, Power-Lawa-E Curve (n=10, E/ao = 500)
L=200 mm forWP Series 1
o
L= min( a, b)
-0.2 -0.4
- WP Series 1 (with notch)
A - SE(B), a/W=0.1
• - SE(B), a/W=0.5
x - C(T), a/W=0.6
-0.6 -0.8 -1.0
Q = °ee - °SSy on () = 0 ao
-1.2
Figure 9. Normalized J-Q driving force curves for wide-plate specimens and fracture test specimens. Computed using plane-strain analyses; no size corrections are ind uded.
While Fig. 9 using normalized J-values to scale specimen size effects on the J-Q driving force curves proves convenient to represent a large class of results , comparisons of actual J-Q values at fracture for a specific material-temperature combination requires unnormalized J-values reflecting the actual specimen sizes involved (e.g., an a/W = 0.1 SE(B) can have more or less constraint than the WP depending on the actual specimen size; a sufficiently large (L) SE(B) specimen remains in SSY). Figure 10 shows such results for the A533B wide-plate material at a temperature of T-RTNDT=-25 DC. The unnormalized J-Q driving force curves are obtained from Fig. 9 using nominal specimen sizes, a/W ratios (e.g., 0.10 rather than 0.11) and a uniform ao = 415 MPa. Jc-Q pairs at fracture for the C(T) and SE(B) specimens indicated in Figs. 2 and 3 and for WP-1.3 (see Table 3) at this temperature are shown. The small variations in size, a /W ratio and yield stress among specimens leads to Q-val ues that do not coincide exactly with the "nominal" J-Q driving force curves indicated on the figure. Six SE(B) toughness values are available at this temperature but only 2, 1-T C(T) values are available; the C(T) values shown reflect the thickness correction ofEq (22). The test reports indicate ductile crack
19

extension prior to cleavage fracture of less than 0.1 mm for these specimens. The dashed line sketched on the figure suggests an upper limit of the toughness locus determined by this (limited) data set ofSE(B) and C(T) results. The test result for wide-plate specimen WP-1.3 is entirely consistent with this upper limit.
3S0
300
2S0
200
150
100
Curves for Q @
r/(J/ao) = 2,3
SE(8) a/W=0.5
W=100 .........
, WP-1 Series W= 1000, wi notch
WP-1.3
/-(-28~1_--D ----//
SE(8) a/W=0.1
W=100
Toughness Locus (Upper Estimate)
,/ ---
T-RTNDT: -28°C
1.8
1.S
1.2
0.9
0.6
so D - SE(8), ~a < 0.1 mm [27] 0.3 0- C(T), ~a< 0.1 mm [18]
(Sizes in mm; Temps in DC, T-RTNDT) o ~~~~~~--~~--~--~--~~--~--~--~~--~ 0 0.2 0 -0.2 -0.4 -0.6 -0.8 -1.0 -1.2
Q Figure 10. J-Q driving force curves and estimate of upper toughness locus
for A533B material at -28°C. WP-1.3, SE(B) and C(T) fracture points are indicated.
Figure 11 shows a similar assessment for the three remaining wide-plate tests conducted at higher temperatures. Eight SE(B) and six C(T) fracture toughness values are available as shown on the figure for this temperature range, Specimens tested at the upper-end of the temperature range experienced ductile tearing of 0.4-0.8 mm prior to cleavage. Additional specimens experiencing more than 1 mm of prior ductile growth are not included in this assessment. The J-Q assessment neglects the potential impact of tearing on Q-values. Two dashed lines are sketched on the figure to suggest an upper and lower toughness locus determined by the data set of SE(B) and C(T) results. The lower curve defines a locus for no ductile tearing prior to cleavage; the higher curve reflects the larger Jc-values that develop with tearing. Not surprisingly, ductile tearing elevates significantly Jc-values in both the high and low constraint regions of the toughness locus. The WP-1.5 result appears in best agreement with the no ductile growth locus; it is at the low end of the temperature range (as is WP-1.2) and has the chevron notched crack front (WP-1.2 has no chevron notch).
20

In both assessments, the J-Q driving force curves at these loading levels reveal almost no dependence on distance ahead of the crack tip selected to evaluate Q for the wide-plate specimens and the shallow notch SE(B) specimens. However, the deep notch SE(B) and the C(T) specimens show a gradually increasing dependence of Q-values once the global bending deformation impinges strongly on the crack tip fields. The 1-T C(T) specimen maintains high constraint (Q ~ +0.12) at low loading but then loses constraint very rapidly under further loading. Despite the tension loading and small a/W ratio of the wide-plate specimens, their very large size enables the maintenance of constraint levels greater than the shallow notch SE(B)s of size W=B= 100 mm.
500
400
300
200
100
max ~a < 0.8 mm 0- C(T), ~a< 0.1 mm .-C(T),~a>O.1 mm
Toughness Locus (Upper Estimate)
SE(B) a/W=0.5
W=100
C(T) a/W=0.6
W=50 /J
'-----------' ./' ./'
./'
, WP-1 Series W= 1000, wi notch
,/ ,/
,/
,/./' WP-1.2 ~ (-10°C)
,/ ,/
,/
SE(B) a/W=O.1
W=100
Toughness Locus \/ WP-1.5 I (Lower Estimate) ~ (-7°C) __ -
_--8-; -----c(T)- D - SE(B), ~a < 0.1 mm a/W=0.6 - SE(B), ~a>O.1 mm
W=25
2.5
2.0
1.5
1.0
0.5
o ~~~~~~~~--~--~--~--~--~--~~--~--~--~ o -1.2 0.2 o -0.2 -0.4 -0.6 -0.8 -1.0
Q Figure 11. J-Q driving force curves and estimates of toughness locus for A533B
material at -10°C to +lOoC (T-RTNDT)' WP-1.2, 1.5, 1.6, SE(B) and C(T) fracture points are indicated.
5.2 Constraint Assessment Using Toughness Scaling
Figure 12 provides the toughness scaling models computed for the wide-plate specimen and for the various specimens used to obtain the fracture toughness values shown in Figs. 2 and 3 (a/W = 0.1, 0.5 SE(B)s and a/W = 0.6 C(T)s). These results are obtained by comparing the opening mode stresses on the crack plane in the fracture specimens (denoted FS) at distances ofr/(JFs/oo) = 2,3 to those in SSY, rather than by using the more complex, contour areaprocedures outlined in Section 3.2. Dodds, et al. [11] discuss the agreement of Jo values predicted using each of these two procedures. The crack-plane procedure is quite simple to apply. At each
21

loading level in the fracture specimen, the normalized value of opening mode stress, aee/ao, at rFS = r/(JFS/aO) = 2 is obtained from the finite element results. At the identical aee/ao in SSY, the normalized distance is found to be rSSY = (3rFs using the SSY stresses shown in Fig. 8 ((3 > 1 if the fracture specimen has less constraintthanSSY). TheratioofJFS/Jowhichgenerates the same opening mode stress at the same absolute distance ahead of the crack tip in each case (set rSSY = rFS ) is then given simply by the ratio rssy/rFs' By repeating this process at rFS = 3, for example, the effects on JFS/JO of the global deformation field impinging on the crack tip fields may be examined (a similar comparison of Q at these distances is shown in Fig. 9).
The deep-notch bending specimens, SE(B) and C(T), exhibit the largest differences in JFS/JO with rFS once the high constraint condition degenerates due to impingement of the bending field on the crack tip; the shallow-notch SE(B) and wide-plate specimens reveal much less sensitivity to rFs' These observations are fully consistent with those for the dependence of Q on distance from the crack tip illustrated in Fig. 9. At the maximum deformation shown for the wide-plate specimen (JFS = 3,350 kJ/m2), only a 5% difference exists in the predictedJo values for rFS = 2,3. For J-values at fracture in the wide-plate specimen (Jc-max = 300 kJ/m2), the difference falls below 1%.
Figure 13 shows the SSY (constraint corrected) toughness value, Jo, for each corresponding fracture toughness value given in Figs. 2 and 3 (values at T-RTNDT < -30°C are not needed).
Jo/(Loo) 0.04 iii i
0.03
0.02
0.01
Linear, Power-Lawa-E Curve (n= 10, E/ao=500)
L= min( a, b)
- Using aee@_r_=2/' J/ao ,,-
o - Using aee @_r_=3/' J/ao ,"-
/)/! //.-' JO=JFS
C(T) a/W=O.6
SE(B) a/W=O.1
I
o ~~~~~~~~~~~~~~~~~~~~~~~--~~~ o 0.01 0.02 0.03 0.04 0.05
JFs/(Loo)
Figure 12. Normalized toughness scaling results for wide-plate specimens and fracture test specimens. (Scaling model curves constructed using opening mode stress on 8 = 0).
22

Specimens with a reported ductile crack growth> 0.1 mm prior to fracture are indicated by solid symbols. For the C(T) specimens, J c values shown in Fig. 2 are constraint corrected to Jo values and then the Jo values are statistically corrected to a 100 mm thickness using Eq (22). Both the uncorrectedJc value (see Table 3) and correctedJo value for each wide-plate specimen are indicated on this figure. Fracture toughness values for the C(T) specimens and the a/W = 0.5 SE(B) specimens received negligible constraint corrections; for most C(T) specimens Jo is greater than Jc due to the very high constraint present at fracture. The statistical thickness correction for the C(T) specimens to the same 100 mm thickness of the SE(B) specimens plays a dominant role in this assessment (Jo values are reduced by factors of 0.5 and 0.71 for the 1-T and 2-T specimens, respectively). Tables in Appendix A summarize data for the C(T) and SE(B) fracture test specimens.
300
250
200
150
100
0- SE(B), Jo o - C(T), Jo - Thickness
Corrected to B= 100 mm
Filled Symbol: ~a > 0.1 mm
x WP-1.2
Constraint Correction ------to Jo
WP-1.3 WP-1.5
<> 6.
1 x
1 0
WP-1.6 'V
'V •
•
•
00
1.8
1.5
1.2
0.9
0.6
5: [ <> ~ 0
0 I •• Id o 0 o • B
0 0
, I , , , I , I , , , , ~""""""'&'~~~~~~~.......I....-..j:'3 -40 -30 -20 -10 0 10 20
T -RTNDT (oC)
Figure 13. Constraint corrected toughness values (Jo) for wide-plate specimens and SE(B), C(T) test specimens.
Jo values for WP-1.3 and WP-1.6 fall at the upper end of the scatter found in fracture toughness values at corresponding T -RTNDT values of -28 and +8 °C. With only 3 fracture toughness values available at -8 °C, the comparisons for WP-1.2 and WP-1.5 are less meaningful. However, it can be argued that additional toughness tests at -8 °C would predict values equal to or greater than those measured at -28 °C. Constraint corrected toughness values for WP-1.2 and WP-1.5 would then lie at the upper-end of the scatter at -8 °C.
The seemingly large J FS/ J 0 ratios for the wide-plate specimens arise from two interacting features of this geometry: (1) the inherent negative T-stress in this SE(T) geometry and (2) the proximity of the sharp crack tip to the rounded end of the 25 mm wide machined notch. The
23

ajW = 0.2 SE(T) geometry of the wide-plate specimens generates a negative T-stress under loading which reduces the level of stress triaxiality at the crack tip when elastic-plastic conditions develop. For a simple ajW = 0.2 SE(T) configuration, the geometry factor is f3 = T r;:w jK1=-0.415 [14,25]. Using the wide-plate results for specimen WP-1.2 as an exampIe, the T-stress at fracture is Tjao =-0.29 (using Kr=252 from Table 3 and ao from Table 2) which reduces the opening mode stress 9% below the SSY(T= 0) value. This degree of stress reduction exerts a strong effect on the JFSjJo ratio. To demonstrate this, consider Figs. 14 and 15 which compare an ajW = 0.2 SE(T) configuration without the notch to the wide-plate configuration (with the machined notch). The machined notch has the effect of making Q more negative and of increasing the JFSjJO ratio over the range of J values at fracture in the wide-plate specimens. At much higher levels of plastic deformation, the notch has no effect (the distance r = (2,3)J jao is much greater from the notch tip). Again using WP-1.2 as the example, JFSjJo = 1.82 for the SE(T) without the notch Conly the T-stress effect) while the ratio increases to 2.35 including the notch. In these wide-plate specimens, the inherent effect of the negative T-stress on elastic-plastic constraint is magnified significantly by the proximity of the large, traction-free notch tip (diameter of 25 mm compared to the actual sharp crack length of only 13 mm).
10° F ~i __________________ ~ A. - SE(B), a/it"V= 0.1
10-1
10-2
10-3
0.2
Linear, Power-Lawa-c Curve (n=10, Ejao=500)
L= min( a, b)
-r-=23 J/ao /' ~
• - SE(B), ajW=O.5
:x - C(T), ajW=O.6
WP Series 1 (with 25 mm machined notch)
/) WP Series 1 (without machined notch)
~~ J Levels at Fracture in Wide-Plates
o -0.2 -0.4 -0.6 -0.8 -1.0
Q
-1.2
Figure 14. Effects of machined notch in wide-plate specimens on J-Q driving force curves.
24

0.004
0.003
0.002
0.001
Linear, Power-Law O-E Curve (n= 10, Ejoo=500)
L= min( a, b)
///
//' /'
JO=JFS ~ //' al0£B6,1 /
WP-1 Series (without machined notch)
, WP-1 Series (with 25 mm machined notch)
o ~~~~~~~~~~~~~~~~~~~~~~~~~~~ o 0.001 0.002 0.003 0.004 0.005
Figure 15. Effects of machined notch in wide-plate specimens on constraint scaling model to estimate Jo.
The effects of ductile crack growth prior to cleavage fracture on J 0 val ues for the test specimens remains an issue. Recent work by Dodds et al. [26] examined the effects of small amounts of crack growth on the crack tip stresses driving the cleavage mechanism. For configurations exhibiting low constraint at Jlc, e.g. SE(B)s with ajW = 0.1, subsequent increases in J 0 can equal increases JFS after Jlc for materials with low-to-moderate strain hardening and tearing modulus. During ductile growth, the near-tip stresses increase to levels approaching SSYprimarily due to resharpening of the crack tip such that I1Jo=I1JFS. Moreover, crack extension subjects additional volumes of material to high stress,.L). V = l1a xB. For high constraint geometries, e.g., the C(T) and SE(B) with ajW = 0.5 here, the effects of growth are much less significant on J 0 values - crack growth has little effect on stress fields of a high constraint condition. The small data sets here preclude a quantitative treatment of tearing effects using the method proposed by Dodds et al [26]. However, their work demonstrates that J 0 values for the shallow notch SE(B) specimens in Fig. 13 with prior ductile extension are significantly "over-corrected" (Jo values shown are too small).
6.. Summary and Conclusions The unexpectedly large fracture initiation loads for the A533B wide-plate specimens previously tested as part of the ORNL-HSST program are re-evaluated using two current methodolo-
25

gies to assess constraint effects on cleavage fracture: the two-parameter, J-Q, approach and the toughness scaling approach. The wide-plate specimens are nominally SE(T) configurations with a/W = 0.2 (W = 1000 mm, B = 100 mm) subjected to remote tension loading. Following an overview of the wide-plate test program and the two constraint assessment methodologies, plane-strain finite element analyses are described for the wide-plate configuration which include modifications to approximate the increased near-tip loading caused by side grooves and by crack-front chevron notches.
Finite element analyses are also described for SE(B) and C(T) fracture specimens which were used in the wide-plate test program to characterize the plate material. The finite element analyses provide the J-Q driving force curves and the J / J 0 ratios needed to perform the constraint assessments. Fracture toughness tests are available for the Plate 13A material used to fabricate the wide-plate specimens and for a companion Plate 13B material. Compact specimens, 1-T and 2-T with a/W = 0.6, were used to test Plate 13A material while 4T SE(B) specimens with a/W = 0.1, 0.5 were used to test Plate 13B material. The fracture toughness values from these characterization studies provide data to construct J-Q toughness loci for the material and to construct size independent estimates for the material toughness, J 0, using the toughness scaling model.
The re-evaluation of wide-plate and fracture test specimen test results described here support the following observations and conclusions:
1. The computed J-Q driving force curve for the wide-plate specimens indicates greater crack tip constraint than in SE(B) fracture specimens (a/W = 0.1 and W =B = 100 mm) but much less constraint than in the specimens tested for material characterization studies, a /W = 0.5 SE(B)s and a /W = 0.6 C(T)s. Over the range of J val ues at which fracture occurs in the wide-plate and the SE(B), C(T) specimens, Q values exhibit no significant dependence on the distance,r/(J /00), ahead of the crack tip selected to make the computation.
2. The SE(B) and C(T) fracture toughness tests enable construction of a J-Q fracture toughness locus at -28 (T-RTNDT, °C) and for the range -8 to +8 (T-RTNDT, °C). The toughness locus for the higher temperature range exhibits considerable scatter, caused primarily by specimens that experience ductile crack growth prior to fracture (0.1 mm < ~a < 1 mm). J-Q fracture locations for the wide-plate specimens lie at the upper-end of these toughness loci.
3. The computed relationships between conventional J values and the constraint corrected Jo values for the wide-plate specimen and for the fracture specimens are fully consistent with the J-Q driving force curves. Over the range of J values at which fracture occurs in the wide-plate and the SE(B), C(T) specimens, the correspondingJo values show no significant dependence « 5%) on distance, r/(J /00), ahead of the crack tip adopted for the computation.
4. Fracture toughness values measured for the deep-notch SE(B) and C(T) specimens require no constraint correction. Some shallow notch SE(B ) results have J c/ J 0 ratios exceeding 4.0, i.e., those with ductile tearing prior to cleavage. Wide-plate Jc/Jo ratios are WP-1.2 (2.4), WP-1.3 (1.8), WP-1.5 (1.8) and WP-1.6 (2.1). Jovalues for wide-plate specimens WP-1.3 (-28°C, T-RTNDT) and WP-1.6 (+4 °C, T-RTNDT) lie within the scatter of corrected fracture toughness values available at those temperatures. Only three fracture toughness values are available for comparison with wide-plate specimens WP-1.2 and WP-1.5 (-10 °C, T-RTNDT)' Consequently, the comparison for these two wide-plate specimens remains inconclusive, although the results are consistent with the trend of toughness values between those at -28°C and +8 °C (T-RTNDT)'
26

5. The seemingly large Jc/Jo ratios for the wide-plate specimens arise from two features: (a) the inherent negative T-stress for an a/W = 0.2 SE(T) geometry, f3 = T [iW, /KI =-0.415, lowers markedly the stress triaxiality in the near-tip stresses even under well-contained plasticity; and (b) the rounded tip of the 25 mm wide machined notch provides a relatively large, nearby traction free surface adjacent to the sharp crack which further lowers constraint. For example, the presence of the notch increases the Jc/Jo ratio from 1.8 to 2.4 for specimen WP-1.2.
6. The statistical thickness correction for cleavage fracture in the transition region proposed by Wallin seems "consistent" within the framework of the toughness scaling model. Jc values are first "constraint" corrected to Jo values and then "thickness" corrected to a convenient reference thickness (B = 100 mm in the present study). However, a similar "consistent" approach does not exist for the J-Q methodology. Q values here are derived from thickness corrected J c values. The thickness correction is needed for the I-T and 2-T C(T) toughness values to bring them to the same 100 mm thickness of the SE(B) and wide-plate specimens. The correction multipliers are 0.5 (l-T) and 0.71 (2-T).
7. References 1. Anderson, T.L., and Stienstra, D., "A Model to Predict the Sources and Magnitude of Scatter in
Toughness Data in the Transition Region," Journal of Testing and Evaluation, Vol. 17, pp. 46-53, 1989.t
2. Anderson, T.L., and Dodds, R.H., "Specimen Size Requirements for Fracture Toughness Testing in the Ductile-Brittle Transition Region," Journal of Testing and Evaluation, Vol. 19, pp. 123-134, 1991.t
3. ASTM E399-83, "Standard Test Method for Plane-Strain Fracture Toughness of Metallic Materials," American Society for Testing and Materials, Philadelphia, Pennsylvania, 1983.t
4. Bass, B., et aI., Martin Marietta Energy Systems, Inc., Oak Ridge Natl. Lab., "Biaxial Loading and Shallow-Flaw Effects on Crack Tip Constraint and Fracture Toughness," USNRC Report NUREGI CR-6132 (ORNUTM-12498), January 1994.*
5. Beremin F. M., "A Local Criterion for Cleavage Fracture of a Nuclear Pressure Vessel Steel", Metallurgical Transactions A, VI4A, pp. 2277-2287, 1983.t
6. Betegon, C., and Hancock, J.W., "Two-Parameter Characterization of Elastic-Plastic Crack Tip Fields," Journal of Applied Mechanics, Vol. 58, pp. 104-113, March 1991. t
7. Bilby, B.A., Cardew, G.E., Goldthorpe, M.R. and Howard, I.C., "Size Effects in Fracture," Institution of Mechanical Engineers, London, England, pp. 36-46, 1986. t
8. Bruckner, A. and Munz, D., "Prediction of Failure Probabilities for Cleavage Fracture From The Scatter of Crack Geometry and of Fracture Toughness Using the Weakest Link Model", Engineering Fracture Mechanics, V18, N2, pp. 359-375, 1983.t
9. Dodds, R.H., and Lopez, L.A., "Software Virtual Machines for Development of Finite-Element Systems," International Journal for Engineering with Computers, Vol. 13, pp. 18-26, 1985.t
10. Dodds, R.H.,Anderson, T.L., and Kirk, ~v1.T., "AFrameworktoCorrelatea/~VRatioEffectsonElastic-Plastic Fracture Toughness (Jc )," International Journal of Fracture, Vol. 48, pp. 1-22, 1991.t
11. Dodds, R.H., Shih, C.F., and Anderson, T.L.,"Continuum and Micromechanics Treatment of Constraint in Fracture," International Journal of Fracture, Vol. 64, pp. 101-133, 1993. t
12. Du, Z.Z., and Hancock, J.W., "The Effect of Non-Singular Stresses on Crack Tip Constraint," Journal of the Mechanics and Physics of Solids, Vol. 39, pp. 555-567, 1991.t
13. Faleskog, J. and Nordlund, P., "Near-Tip Field Characterization and J-Integral Evaluation for Nonproportional Loads," International Journal of Solids & Structures, Vol. 31, pp. 1-26, 1994.t
14. Kirk, M.T., and Dodds, R.H., "Approximate Techniques for Prediction of Size Effects on Cleavage Fracture Toughness," ASTM STP1207, J. Landes, D. McCabe and Boulet, Eds., American Society for Testing and Materials, Philadelphia, 1994. t
27

15. Koers, R. W. J., Krom, A. H.M., and Bakker, A., "Prediction of Cleavage Fracture in the Brittle to Ductile Transition Region of a Ferritic Steel," Constraint Effects in Fracture: Theory and Applications, ASTM STP 1224, Mark Kirk and Ad Bakker Eds., American Society for Testing and Materials, Philadelphia, 1994.t
16. Larsson, S.G., and Carlsson, A.J., "Influence of Non-Singular Stress Terms and Specimen Geometryon Small-Scale Yielding at Crack Tips in Elastic-Plastic Materials," Journal of the Mechanics and Physics of Solids, Vol. 21, pp. 263-277, 1973.t
17. Leevers, P.C. and Radon, J.C., "Inherent Stress Biaxiality in Various Specimen Geometries," International Journal of Fracture, Vol. 19, pp. 311-325, 1982.t
18. Naus, D. J. et al., Martin Marietta Energy Systems, Inc., OakRidge Natl. Lab., "Crack-Arrest Behavior in SEN Wide Plates of Quenched and Tempered A533 Grade B Steel Tested Under N onisothermal Conditions," USNRC Report NUREG/CR-4930 (ORNLlTM-6388), August 1987.*
19. O'Dowd, N.P., and Shih, C.F., "Family of Crack Tip Fields Characterized by a Triaxiality Parameter: Part I - Structure of Fields," Journal of the Mechanics and Physics of Solids, Vol. 39., No.8, pp. 989-1015, 1991.t
20. O'Dowd, N.P., and Shih, C.F., "Family of Crack Tip Fields Characterized by a Triaxiality Parameter: Part II - Fracture Applications," Journal of the Mechanics and Physics of Solids, Vol. 40, pp. 939-963, 1992. t
21. Parks, D.M., "Advances in Characterization of Elastic-Plastic Crack Tip Fields," Topics in Fracture and Fatigue, Ed. A.S. Argon, Springer-Verlag, pp. 59-98, 1992.t
22. PATRAN User's Manual, Release 2.5, PDA Engineering Inc., Costa Mesa, California, 1993.§
23. Rice, J.R., "A Path Independent Integral and the Approximate Analysis of Strain Concentration by Notches and Cracks," Journal of Applied Mechanics, Vol. 35, pp. 379-386, 1968.t
24. Ritchie, R. 0., Knott J. F. and Rice, J. R., "On the relationship Between Critical Tensile Stress and fracture Toughness in Mild Steel", J. Mech. Phys. Solids, V21, pp. 395-410, 1973.t
25. Sham, T.L., "The Determination of the Elastic T-term using Higher Order Weight Functions," International Journal of Fracture, Vol. 48, pp. 81-102, 1991.t
26. Tang, M., Dodds, R.H. and Anderson, T.L., "Effects of Ductile Crack Growth on Constraint Models for Cleavage Fracture," SRS 585, UILU-ENG-94-2001, Department of Civil Engineering, University of Illinois at Urbana-Champaign, January 1994. *
27. Theiss, T. Shum, D. and Rolfe, S. Martin Marietta Energy Systems, Inc., OakRidge Natl. Lab., "Experimental and Analytical Investigation of the Shallow-Flaw Effect in Reactor Pressure Vessels," USNRC Report NUREG/CR-5886 (ORNLlTM-12115), July 1992. *
28. Wallin, K., Saario, T., and Torronen, K., "Statistical Model for Carbide Induced Brittle Fracture in Steel," Metal Science, Vol. 18, pp. 13-16, 1984.t
29. Wallin, K., "The Effect of Ligament Size on Cleavage Fracture Toughness," Engineering Fracture Mechanics, Vol. 32, 1989, pp. 449-457.t
30. Wallin, K., "Statistical Aspects of Constraint with Emphasis on Testing and Analysis of Laboratory Specimens in the Transition Region," Constraint Effects in Fracture, ASTM STP 1171, E.M. Hackett, K.H. Schwalbe, and R.H. Dodds, Eds., American Society for Testing and Materials, Philadelphia, pp. 264-288, 1993.t
31. Wang, Y.Y., "On the Two-Parameter Characterization of Elastic-Plastic Crack-Front Fields in Surface-Cracked Plates," Constraint Effects in Fracture, ASTM STP 1171, E.M. Hackett, K.H. Schwalbe, and R.H. Dodds, Eds., American Society for Testing and Materials, Philadelphia, pp. 2120-138, 1993.t
32. Williams, M.L., Journal of Applied Mechanics, Vol. 24, pp. 109-114, 1957.t
* Available for purchase from national Technical Information Service, Springfield, VA 22161.
t Available from public technical libraries.
:j: Copies are available from U.S. Government Printing Office, Washington, D.C. 20402. ATTN: Regulatory Guide Account.
§ Available for purchase from vendor.
28
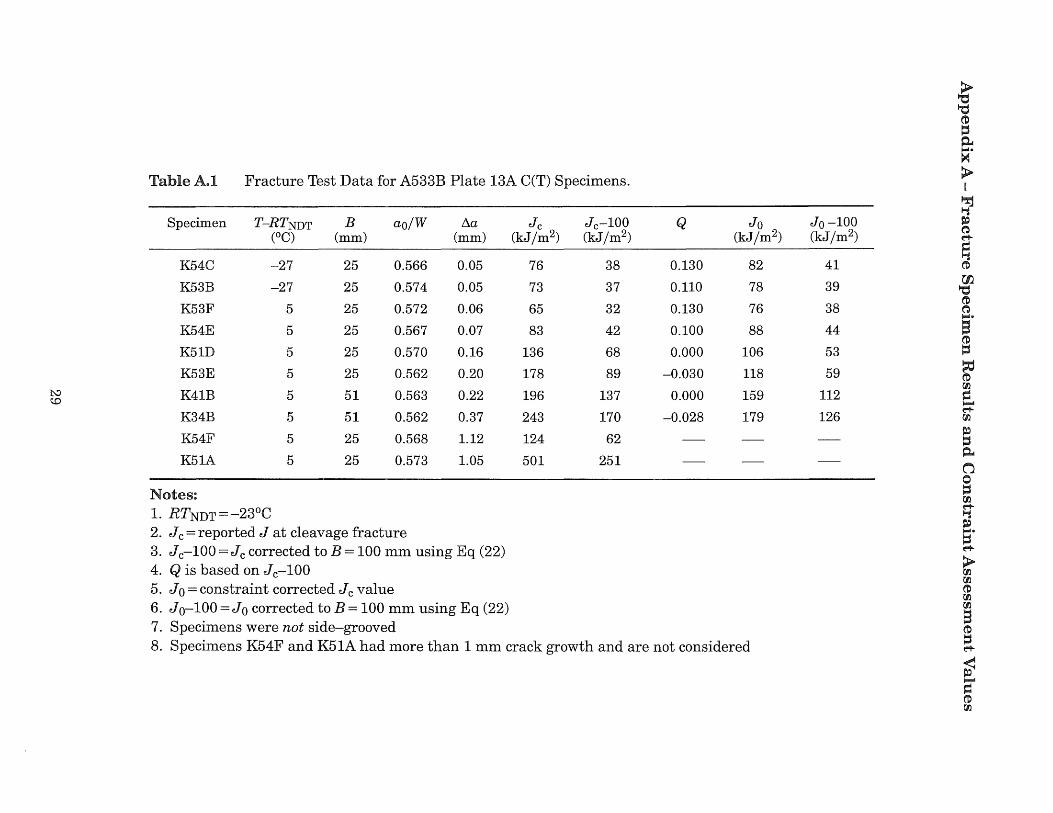
TableA.l Fracture Test Data for A533B Plate 13A C(T) Specimens.
Specimen T-RTNDT B ao/W !.ia J c J c-100 Q Jo (OC) (mm) (mm) (kJ/m2) (kJ/m2) (kJ/m2)
K54C -27 25 0.566 0.05 76 38 0.130 82
K53B -27 25 0.574 0.05 73 37 0.110 78
K53F 5 25 0.572 0.06 65 32 0.130 76
K54E 5 25 0.567 0.07 83 42 0.100 88
K51D 5 25 0.570 0.16 136 68 0.000 106
K53E 5 25 0.562 0.20 178 89 -0.030 118 t-.:) K41B 5 51 0.563 0.22 196 137 0.000 159 c:.o
K34B 5 51 0.562 0.37 243 170 -0.028 179
K54F 5 25 0.568 1.12 124 62
K51A 5 25 0.573 1.05 501 251
Notes: 1. RTNDT = -23°C 2. Jc=reported J at cleavage fracture 3. J c-100 = J c corrected to B = 100 mm using Eq (22) 4. Q is based on J c-100 5. Jo = constraint corrected J c value 6. Jo-100 =Jo corrected to B = 100 mm using Eq (22) 7. Specimens were not side-grooved 8. Specimens K54F and K51A had more than 1 mm crack growth and are not considered
Jo -100 (kJ/m2)
41
39
38
44
53
59
112
126
~ '"CS ~ 1:$ ~ 1-1.
~
> I ~ t1 ~ ~ e-t-
= t1 ~
00 '"CS ~ ~ 1-1.
S ~ = ~ ~ 00 = ....... e-t-00
~ 1:$ ~
C'1 o = 00 e-tt1 ~ 1-1.
= e-t-
> 00 00 ~ 00 00 s ~
= e-t-
~ .......
= ('0 r.JJ.

TableA.2 Fracture Test Data for A533B Plate 13B SE(B) Specimens.
HSST T-RTNDT ao/W !1a Jc Q Jo Beam No. COC) (mm) (kJ/m2) (kJ/m2)
28 9 0.10 0.750 491 -0.92 68
18 -9 0.10 204 -0.75 40
27 -7 0.11 0.270 237 -0.78 45
21 -8 0.11 135 -0.66 29
38 -24 0.11 0.074 III -0.62 24
37 -24 0.11 126 -0.66 25
20 11 0.11 686 -1.08 89
c:..o 22 8 0.11 0.540 398 -0.87 62 0 26 -25 0.11 158 -0.70 33
31 -25 0.51 0.011 53 0.03 57
36 -23 0.51 37 0.02 38
35 8 0.51 88 0.01 90
25 -24 0.51 82 0.01 87
24 8 0.51 0.342 216 -0.13 163
17 9 0.52 90 0.01 92
Notes: 1. RTNDT = -15°C 2. All specimens are SE(B) with W=B= 100 mm 3. Jc=reported J at cleavage fracture 4. Jo = constraint corrected J c value 5. Specimens were not side-grooved 6. Specimens at lower temperatures omitted 7. Crack growth measurements available only for 6 specimens indicated above

Contents
Section No. Page
Abstract .................................................................. III
List of Figures . . . . . . . . . . . . . . . . . . . . . . . . . . . . . . . . . . . . . . . . . . . . . . . . . . . . . . . . . . . . . v
List of Tables ............................................................. vi
Acknowledgements ....................................................... vii
1. Introduction ......................................................... 1
2. Overview of Wide-Plate Tests ........................................ 2
2.1 Specimen Configurations ........................................ 3
2.2 Material Characterization ........................................ 4
3. Constraint Assessment Procedures . . . . . . . . . . . . . . . . . . . . . . . . . . . . . . . . .. 7
3.1 J-Q Theory ..................................................... 7
3.2 Toughness Scaling Model for Cleavage ............................ 10
4. Finite Element Analyses . . . . . . . . . . . . . . . . . . . . . . . . . . . . . . . . . . . . . . . . . . .. 13
4.1 Constitutive Model ............................................. 13
4.2 Finite Element Models .......................................... 14
4.3 Solution Procedures ............................................. 14
4.4 Small-Scale Yielding Solutions .................................. 15
4.5 Effects of Side Grooves and Chevron Notching ..................... 16
5. Results and Discussion ............................................. 17
5.1 Constraint Assessment Using J-Q Theory ........................ 18
5.2 Constraint Assessment Using Toughness Scaling Model ............ 21
6. Summary and Conclusions ......................................... 25
7. References .......................................................... 27
Appendix A .. . . . . . . . . . . . . . . . . . . . . . . . . . . . . . . . . . . . . . . . . . . . . . . . . . . . . . . . 29

LIST OF FIGURES
Figure No. Page
1 Schematic of HSST wide-plate crack-arrest specimen (WP-1 series). . ....... 3
2 Cleavage fracture toughness (Jc) results for wide-plate specimen(WP-1) material - Plate 13A, A533B3 ............................................. 5
3 Cleavage fracture toughness (Jc) results for material - Plate 13B, A533B ..... 5
4 Typical J-Q "loading paths" for fracture specimens and example construction of upper and lower limit toughness loci from measured J-values ................................................................ 9
5 Effects of principal stress on predicted fracture toughness ratio, JFB/JO, for a shallow notch SE(B) specimen ............................... 11
6 Predicted effects of a/W ratio and absolute size on cleavage fracture toughness for SE(B) specimens ........................................... 13
7 Finite element models for analyses of ¥lide-plate and fracture test specimens .......................................................... 15
8 Opening mode stresses on crack plane for small-scale yielding (T = 0). Uniaxial a-8 model is power-law hardening after an initial linear response (small-strain analyses). . ....................................... 16
9 Normalized J-Q driving force curves for wide-plate specimens and fracture test specimens. Computed using plane-strain analyses; no size corections are included ............................................ 19
10 J-Q driving force curves and estimate of upper toughness locus for A533B material at -28DC. WP-1.3, SE(B) and C(T) fracture points are indicated. . ................................................... 20
11 J-Q driving force curves and estimates of toughness locus for A533B material at -10DC to +10DC (T-RTNDT). WP-1.2, 1.5, 1.6, SE(B) and C(T) fracture points are indicated. . ...................................... 21
12 Normalized toughness scaling results for wide-plate specimens and fracture test specimens. (Scaling model curves constructed using opening mode stress on e = 0) ....................................... 22
13 Constraint corrected toughness values (J 0) for wide-plate specimens and SE(B), C(T) test specimens.Gradients (m) for stationary constraint models of SE(B) specimens ............................................... 23
14 Effects of machined notch in wide-plate specimens on J-Q driving force curves. . . . . . . . . . . . . . . . . . . . . . . . . . . . . . . . . . . . . . . . . . . . . . . . . . . . . . . . . . . . . 24
15 Effects of machined notch in wide-plate specimens on constraint scaling model to estimate J o. ............................................ 25

LIST OF TABLES
Table No. Page
1 WP-1 series test specimen dimensions and measured values at cleavage fracture initiation from the pre-cracked configuration ............... 6
2 Mechanical properties for HSST A533B Class 1 Plates 13A and 13B ........... 6
3 Effective stresses, Jc-Q and J o values at fracture for plane-strain models ofWP-1 series test specimens ............................................ 17
A.1 Fracture Test Data for A533B Plate 13A C(T) Specimens. . .................. 29
A.2 Fracture Test Data for A533B Plate 13B SE(B) Specimens ................... 30

ACKNOWLEDGEMENTS
This investigation was supported by a grant to the University of Illinois from the Oak Ridge National Laboratory, Heavy-Section Steel Technology program under Subcontract No. 19X-SM986V. Computations were performed on the Department of Civil Engineering HP/Apollo workstation network made possible, in part, by grants from the Hewlett-Packard Company.
The author acknowledges the many helpful conversations with Tim Theiss and Richard Bass of the HSST program and the comments provided by John Merkle.


![z[ebook] - Computers - Programming - C++ - Reverse Engineerin](https://static.fdocuments.net/doc/165x107/5528d6684a79596c508b4852/zebook-computers-programming-c-reverse-engineerin.jpg)