CITY OF POWELL RIVER - Document Center
46
CITY OF POWELL RIVER SUMMARY REPORT NOVEMBER 2018 PREPARED FOR: CLIMATE ACTION POWELL RIVER (CAPR)
Transcript of CITY OF POWELL RIVER - Document Center
CITY OFPOWELL RIVER
SUMMARYREPORT
NOVEMBER 2018
PREPARED FOR:CLIMATE ACTION POWELL RIVER (CAPR)

i
ecoCity Footprint: City of Powell River Summary Report
SUMMARY
This project was initiated in 2018 by the non-profit organization Climate Action Powell River (CAPR) with funding
from the City of Powell River and the Pacific Institute for Climate Solutions (PICS).
This Summary Report presents the results of Powell River’s Consumption-Based Emission Inventory and
Ecological Footprint for 2016, as created by the ecoCity Footprint Tool.
Background
The ecoCity Footprint Tool enables a community to evaluate its ecological footprint, ‘territorial’ greenhouse gas
(GHG) emissions, and consumption-based GHG emissions. These inventories provide critical data to inform
sustainable consumption and climate mitigation efforts. Since the late ‘90s, governments have typically created
GHG emissions inventories using an in-boundary or territorial approach, which identifies emissions from sources
within the particular region. However, this form of inventory does not provide a complete picture of a
community’s impact on global climate change. It misses the climate impacts associated with the many goods a
community consumes, because many of these goods are produced in other regions, often in other continents.
Although climate change is arguably the most pressing environmental issue we are currently facing, we are also
bumping up against many other planetary boundaries. Due to unsustainable levels of consumption, global society
today is demanding more in a year through consumption of energy and resources than nature can provide, and
polluting more than nature can assimilate. The ecoCity Footprint Tool has the capacity to arm a community with
the information it needs to act on global climate change and ecological overshoot.
Results
This report presents Powell River’s ecological footprint and consumption-based emission inventory results for
2016.
Ecological Footprint Assessment
The ecological footprint is measured in global hectares (gha) per capita, where a global hectare
is a biologically productive hectare with globally averaged productivity for a given year. It is an
estimate of how much biologically productive land and water area an individual or population
needs to produce all the resources it consumes and to absorb the wastes it generates. Based
on current global population and biological productivity levels, an average of 1.7 global
hectares is available for each person on the planet.
Results show that Powell River’s per capita footprint is 6.0 gha/person.1 This means that
residents are consuming 3.5 times more of the Earth’s resources than what is currently
available. Put another way, this means that approximately 3.5 Earths would be required to
support the global population if everyone had lifestyles comparable to a Powell River resident.
Territorial GHG Emission Inventory and Consumption-Based Emission Inventory
The Consumption-Based Emissions Inventory (CBEI) presents the total GHG emissions resulting from production
and consumption of goods and services within a region, regardless of where those goods and services are
produced. This form of inventory is generated using the data typically collected for a territorial inventory,
1 This per capita footprint includes an estimate of national and provincial services.
# Planets
Required by
Powell River
ii
ecoCity Footprint: City of Powell River Summary Report
including the energy used by buildings and transportation and the emissions associated with solid waste
management; in addition to an evaluation of the emissions that result from the production and transport of all
goods consumed within the region, as informed by life cycle assessment data. Total consumption-based
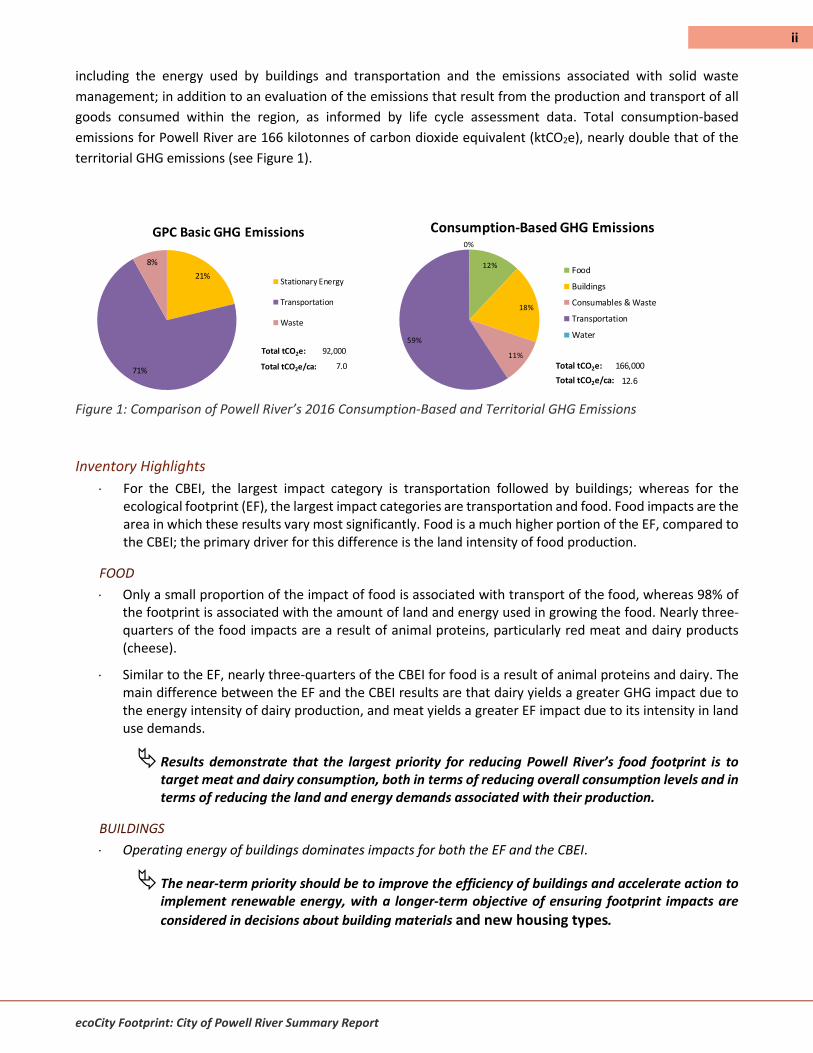
emissions for Powell River are 166 kilotonnes of carbon dioxide equivalent (ktCO2e), nearly double that of the
territorial GHG emissions (see Figure 1).
21%
71%
8%
GPC Basic GHG Emissions
Stationary Energy
Transportation
Waste
Total tCO2e: 92,000
Total tCO2e/ca: 7.0
12%
18%
11%
59%
0%
Consumption-Based GHG Emissions
Food
Buildings
Consumables & Waste
Transportation
Water
Total tCO2e: 166,000
12.6Total tCO2e/ca:
Figure 1: Comparison of Powell River’s 2016 Consumption-Based and Territorial GHG Emissions
Inventory Highlights
For the CBEI, the largest impact category is transportation followed by buildings; whereas for the ecological footprint (EF), the largest impact categories are transportation and food. Food impacts are the area in which these results vary most significantly. Food is a much higher portion of the EF, compared to the CBEI; the primary driver for this difference is the land intensity of food production.
FOOD
Only a small proportion of the impact of food is associated with transport of the food, whereas 98% of the footprint is associated with the amount of land and energy used in growing the food. Nearly three-quarters of the food impacts are a result of animal proteins, particularly red meat and dairy products (cheese).
Similar to the EF, nearly three-quarters of the CBEI for food is a result of animal proteins and dairy. The main difference between the EF and the CBEI results are that dairy yields a greater GHG impact due to the energy intensity of dairy production, and meat yields a greater EF impact due to its intensity in land use demands.
Results demonstrate that the largest priority for reducing Powell River’s food footprint is to target meat and dairy consumption, both in terms of reducing overall consumption levels and in terms of reducing the land and energy demands associated with their production.
BUILDINGS
Operating energy of buildings dominates impacts for both the EF and the CBEI.
The near-term priority should be to improve the efficiency of buildings and accelerate action to implement renewable energy, with a longer-term objective of ensuring footprint impacts are
considered in decisions about building materials and new housing types.
iii
ecoCity Footprint: City of Powell River Summary Report
CONSUMABLES
The footprint of consumables and waste is dominated by upstream impacts, namely the energy and materials that go into producing the goods that are consumed in the city.2 Textiles and paper are a significant component of the consumables and waste footprint.
The CBEI for consumables shows that in contrast to the EF, consumption-based emissions are higher for plastics; and much less for paper. These results are explained by the larger land footprint associated with production of paper, and the higher fuel intensity associated with plastic.
Results indicate the necessity to prioritize reduction in overall consumption, instead of focusing on end of stream waste management. Emphasis should be placed on priority material types, in particular paper, plastics and textiles.
TRANSPORTATION
Half of Powell River’s transportation footprint is a result of fuel consumption for private vehicles, and adding the embodied energy of vehicles, private vehicle transportation represents nearly two-thirds of the footprint. Similar to the EF, about three quarters of the consumption-based emissions for transportation are associated with private vehicle travel.
A near-term priority is to continue to electrify the vehicle fleet (including the transit vehicle fleet); and to reduce the number of vehicles on the road by promoting active transportation, transit, 3 and car-sharing. There are also opportunities to reduce the embodied energy for transportation through car sharing and transit. The long-term priority should be to promote compact communities that are designed for active transportation and transit.
THE SUSTAINABILITY GAP
To achieve ‘One Planet Living’ Powell River’s ecological footprint, as estimated with the ecoCity Footprint Tool4,
would need to reduce from 6.0 gha per capita (including national and provincial services)5 to 1.7 gha per capita.
This is a sustainability gap of 72% (see Figure 18). From a climate perspective, to achieve the target of maintaining
global temperatures below a 2 degree Celsius in warming, GHGs must be reduced to 2 tCO2e per capita by 2050.
Given Powell River’s current CBEI per capita emissions of 12.4 tCO2e, GHG emissions would need to be reduced
by 84%; and based on the more standard ‘territorial’ GHG emissions per capita of 7 tCO2e, they would need to
be reduced by 71%.
This report presents a proposed One Planet Scenario, as an example of how Powell River could reduce its total
ecological footprint to 1.7 gha per capita. It also presents a set of example policy and planning interventions to
help close this sustainability gap.
2 Operating energy for waste management facilities was not available, as discussed in Appendix B: Methodology, but would be negligible compared to the embodied energy and embodied materials impacts. 3 Promoting transit use over private vehicle use will shift a significant portion of the current emissions to transit, therefore it is particularly important to electrify the transit vehicle fleet. 4 As noted in the methodology, the bottom-up approach employed in the ecoCity Footprint Tool results in an underestimate of the footprint 5 Excluding national and provincial services Powell River’s footprint is 4.0 gha per capita.

iv
ecoCity Footprint: City of Powell River Summary Report
Acknowledgements
We would like to acknowledge that the City of Powell River is on the traditional land of the Tla'amin Nation.
This report has been prepared by Cora Hallsworth (Principal, Cora Hallsworth Consulting-CHC), Ryan Mackie
(CHC) and Dr. Jennie Moore (Director, Institute Sustainability, British Columbia Institute of Technology (BCIT));
with contributions and research provided by Arynn Keane (SFU) and with contributions and edits provided by
Climate Action Powell River.
The authors would like to thank and acknowledge the many individuals who contributed time to this project.
Special thanks to: Climate Action Powell River, staff members at the City of Powell River and qathet Regional
District.

v
ecoCity Footprint: City of Powell River Summary Report
TABLE OF CONTENTS
SUMMARY .................................................................................... i
Acknowledgements ..................................................................... iv
List of Figures ............................................................................... 1
Acronyms ..................................................................................... 2
Definition of Terms ...................................................................... 2
CONTEXT ...................................................................................... 3
ECOCITY FOOTPRINT TOOL OVERVIEW ....................................... 4
ECOCITY FOOTPRINT TOOL IN POWELL RIVER ............................ 5
DATA COLLECTION AND ANALYSIS METHODOLOGY ................... 7
RESULTS ..................................................................................... 10
Ecological Footprint Assessment ............................................... 10
Territorial GHG Emission Inventory ........................................... 16
Consumption-Based Emission Inventory ................................... 16
THE SUSTAINABILITY GAP .......................................................... 19
ONE PLANET SCENARIO ............................................................. 20
POLICY RESPONSES AND INTERVENTIONS ................................ 22
APPENDIX A: LCA DATA FOR CONSUMABLES AND WASTE ....... 26
APPENDIX B: data collection METHODOLOGY .......................... 27
1
ecoCity Footprint: City of Powell River Summary Report
LIST OF FIGURES
Figure 1: Comparison of Powell River’s 2016 Consumption-Based and Territorial GHG Emissions ........................ ii
Figure 2 Comparison of the GHG Emission Inventories and Ecological Footprint Approaches ...............................4
Figure 3 Two methods for calculating the Ecological Footprint ...............................................................................5
Figure 4: Data Inputs ................................................................................................................................................7
Figure 5: Summary of Ecological Footprint by Activity, 2016 (excluding national and provincial services) ......... 11
Figure 6: Food Footprint Summary, 2016.............................................................................................................. 11
Figure 7: Food Footprint by Food Type, 2016 ....................................................................................................... 12
Figure 8: Buildings Footprint Detailed, 2016 ......................................................................................................... 13
Figure 9: Consumables and Waste Footprint, 2016 .............................................................................................. 13
Figure 10: Consumables Footprint by Type, 2016 ................................................................................................. 14
Figure 11: Transportation Footprint in Detail, 2016 ............................................................................................. 15
Figure 12: Territorial GHG Emissions Inventory (GPC Basic Inventory) ................................................................ 16
Figure 13: Summary of GHG Emissions from Consumption, 2016 ........................................................................ 17
Figure 14: Greenhouse Gas Emissions Inventory of Food, 2016 ........................................................................... 17
Figure 15: GHG Emissions Inventory of Buildings, 2016........................................................................................ 18
Figure 16: GHG Emissions Inventory of Consumables, 2016 ................................................................................. 18
Figure 17: Greenhouse Gas Emissions Inventory of Transportation, 2016 ........................................................... 19
Figure 18: Sustainability Gap, 2016 (including national and provincial services) ................................................. 19
2
ecoCity Footprint: City of Powell River Summary Report
Acronyms AFOLU Agricultural, Forest, and other Commercial Land Uses
BCIT British Columbia Institute of Technology
CBEI Consumption-Based Emission Inventory
CLP Climate Leadership Plan
CMA Census Metropolitan Area
CRD Capital Regional District
EF Ecological Footprint
eF Tool ecoCity Footprint Tool
gha Global Hectares
gha/ca Global Hectares per Capita (person)
GHG Greenhouse Gas
GPC Global Protocol for Community-Scale Greenhouse Gas Emission Inventories
HS Harmonized System 10-digit merchandise codes by origin
ICI Industrial Commercial and Institutional (sectors)
IPPU Industrial Products and Pollutants
qRD qathet Regional District (formerly Powell River Regional District)
tCO2e Metric Tonnes Carbon Dioxide
VKT Vehicle Kilometers Traveled
Definition of Terms BASIC and BASIC+ Reporting levels in the Global Protocol for Community-Scale Greenhouse Gas Emission Inventories
(GPC).
Built Area For the ecocity Footprint (eF Tool), Built Area is the total municipal boundary excluding natural areas, where a natural area is a non-serviced area. For example, a treed park would be excluded, but agricultural land is included. In the eF Tool, the Built Area for the transportation sector is reported separately.
CO2e Carbon dioxide equivalent (CO2e) expresses the impact of each greenhouse gas in terms of the amount of CO2 (carbon dioxide) that would create the same amount of warming. This enables reporting total greenhouse gas emissions in one measurement.
Embodied Energy The energy used in creating and delivering a particular material (e.g., consumable good or infrastructure), including the energy used for extraction of raw materials, manufacturing and transportation of the end product.
Embodied Materials Materials that are utilized in the manufacture of a consumable product or infrastructure, but that do not end up in the finished product. Examples are manufacturing wastage and temporary features used during manufacture.
Urban Metabolism A study of the flow of energy and materials through the urban system.
Operating Energy The energy used in the function of a product, building, vehicle, etc.
Scope 1-3 GHG emissions that are generated in-boundary (Scope 1), from grid supplied energy (Scope 2), and generated out-of-boundary (Scope 3).

3
ecoCity Footprint: City of Powell River Summary Report
CONTEXT
Scientists are suggesting that we
have entered the era of the
Anthropocene; an era in which
humanity is the greatest force
shaping Earth’s terrestrial systems.
Currently, 50% of net primary
production is in service of the human
population and 80% of ecosystems
are influenced by humans. i As a
result, we are bumping up against
important planetary boundaries, ii
and are in a state of “ecological
overshoot.”iii
Climate change is one of these
critical areas of overshoot. Recently,
Nation States from around the
world, including Canada, ratified the
Paris Agreement, committing to
holding global temperature
increase to below 2 degrees
Celsius. The signatories are
aiming to go beyond this
commitment by staying below
1.5 degrees Celsius of warming,
which scientists now suggest is
the boundary threshold for
avoiding the most negative and
severe climate change impacts
of a changing climate.
Cities account for only 3% of
global land use, but they are
responsible for the majority of
global resource consumption. iv
It is not the cities that are the
problem, but the energy and
resource intensity of our urban
lifestyles that require vast land
areas outside of the city to
support it. The discrepancy
between the small amount of
land occupied by cities and the
vast amount of land required to
resource urban lifestyles is at
the heart of the urban
sustainability challenge.
The Ecological Footprint (EF)
and the Consumption-Based
Emission Inventory (CBEI) can
help communities and
governments tackle one of the
root causes of global ecological
overshoot and climate change:
individual and collective
consumption choices and
habits.
What is a Territorial
GHG Emissions Inventory?
Since the late 90’s governments have
typically created greenhouse gas
emissions inventories using an in-
boundary or territorial approach, which
identifies emissions from sources within
the region, plus electricity.
What is a Consumption-Based
Emissions Inventory?
The consumption approach includes
emissions released to produce goods and
services consumed within a region,
regardless of where they were originally
produced. That is, it estimates global
emissions resulting from local
consumption habits. Typical emissions
inventories include only emissions from
sources within a given region’s borders;
however, with the globalization and
integration of our economy, a significant
amount of the emissions from the
production, disposal, and transport of a
region’s goods occur in other regions.
CBEI results can demonstrate the scale to
which we are off-loading consumption-
related emissions on to other
jurisdictions. This will help encourage
strategies that maximize global emission
reductions. This form of inventory is of
growing interest to governments that are
keen to broaden and deepen their
sustainability and climate-action efforts.
What is an Ecological
Footprint?
The ecological footprint is an estimate of
how much biologically productive land
and water area an individual or
population needs to produce all the
resources it consumes and to absorb the
waste it generates. It is measured in
global hectares (gha) per capita, where a
global hectare is a biologically productive
hectare with globally averaged
productivity for a given year.
Ecological overshoot is
measured using ecological
footprint analysis, which
assesses humanity’s total
demand on nature’s services
over a one-year period
compared to the capability of
biologically productive land and
sea areas to meet that demand.
Global society today is
demanding more in a year
through consumption of energy
and resources than nature can
provide, and polluting more
than nature can assimilate.
Simply stated, it would take 1.5
Earths to sustainably provide
the ecological services we
currently use.

4
ecoCity Footprint: City of Powell River Summary Report
ECOCITY FOOTPRINT TOOL OVERVIEW
Dr. Jennie Moore, Associate Dean at BCIT, created the ecoCity Footprint
Tool (eF Tool) as part of her PhD under the supervision of Dr. William Rees,
founder of the ecological footprint concept. The goal in creating the eF Tool
was to support policy-related
decision-making aimed at
reversing global ecological
overshoot, namely by creating a
community-scale ecological
footprint using locally sourced
data. A prototype of this eF Tool
was used by the City of
Vancouver. The outputs from the
Tool are highly valued by the City
and are informing the strategies,
actions, and monitoring methods
for their “Greenest City 2020 Action Plan”.
The Tool was originally conceived for ecological footprint utility, but it also
generates an urban metabolism, a traditional ‘territorial’ greenhouse gas
(GHG) emission inventory, and a consumption-based emissions inventory.
These inventories provide critical data to inform sustainable consumption
and climate mitigation efforts.
Figure 2 Comparison of the GHG Emission Inventories and Ecological Footprint Approaches
How Does the eF Tool Work?
Many existing ecological footprint and consumption-based greenhouse gas (GHG) inventory tools use the
‘compound method’ (a top-down approach that uses national and/or econometric data). But, the eF Tool uses
What is an Urban Metabolism?
The urban metabolism traces the flow of
energy and materials through the urban
system, and yields the data to inform the
footprint and consumption inventory.
The urban metabolism can be depicted
visually using a SANKEY diagram (see
below).
.

5
ecoCity Footprint: City of Powell River Summary Report
the ‘component method’, which emphasizes the use of community-based data, and aligns with traditional
spheres of planning at the local government level (see Figure 3, below). Real consumption data, collected
through an urban metabolism study, provides the utility needed to directly link policy intervention to emission
outputs at the local government scale. This provides a clear and transparent understanding of how a municipality
functions, across all sectors and service areas, affect the footprint. It also enables scenario analyses to forecast
which policy interventions and changes could enable reductions in the city’s energy and material flows,
greenhouse gas (GHG) emissions, and ecological footprint.
Figure 3 Two methods for calculating the Ecological Footprint
ecoCity Footprint Tool Application
Exploring consumption-based inventories and ecological footprints is a way for governments to broaden and
deepen their sustainability and climate-action efforts. In particular, they provide a more robust understanding
of emission sources and ecological impacts, and they can directly inform sustainable consumption efforts.
The eF Tool also has the potential to help streamline data collection and reporting due to its capacity to create
multiple outputs: the consumption-based inventory, the territorial inventory, as well as the ecological footprint.
ECOCITY FOOTPRINT IN POWELL RIVER
Climate Action Powell River (CAPR) initiated this project to inform and contribute to climate and sustainability
planning efforts in the community, and in particular to advance their goal of creating a carbon-neutral city.
Through the calculation of Powell River’s ecological footprint, CAPR hopes to identify priorities for reducing the
community’s contribution to climate change and global overconsumption. The hope is that this information can
inform policy and planning at the local level, and also be used to educate and engage stakeholders throughout
the community. The project was funded by the City of Powell River and the Pacific Institute for Climate Solutions
(PICS).
Municipal Context
The City of Powell River is a small community on the lower mainland of British Columbia that comprises
approximately 30.6 km2 within the qathet Regional District River on the traditional land of the Tla'amin Nation.
The community has a population of 13, 157 individuals and a population density of approximately 450 individuals
per square kilometer (Sources). The City of Powell River has limited public transportation and is spread out

6
ecoCity Footprint: City of Powell River Summary Report
enough that walking and biking to destinations is often not practical. Despite being on the mainland, there are
no highways to connect Powell River to other cities, and it is surrounded by mountains, forest, and ocean. This,
combined with the low amounts of local industry, requires that the City of Powell River import much of its
resources and ship out its waste.
Powell River has a warm and temperate climate with an average low of 0.3℃ in the winter and an average high
of 22.1℃ in the summer, thus heating and cooling demand are not as significant as other locations in Canada.v
Heating is provided by a mix of electric baseboard, heat pump, natural gas, heating oil, and wood. Electricity is
supplied by BC Hydro, 98% of which is from renewable hydro power, and natural gas is supplied by FortisBC.
Just under 25 percent of Powell River’s working individuals are employed in goods production, both in primary
and secondary sectors. This is mainly composed of forestry (the leading private sector for the economy), the
pulp and paper mill, and aquaculture. The remainder of Powell River’s workers are involved in the service
sectors.vi The population of the City of Powell River has been stable, but may see an increase with projects such
as the development of an aviation industrial park.vii
Some of the city’s facilities are aging, and necessary changes are hard to make given the community’s small tax
base. Powell River is currently updating its sewage treatment plant and is in the final stages of an organics
collection pilot program.
Powell River has undertaken a number of recent sustainability initiatives including the creation of a Sustainability
Charter for the Powell River Region in 2010,viii a “Quick Start” Community Energy and Emissions Plan in 2012,ix
an updated “Sustainable” Official Community Plan that incorporates sustainability principles in 2014,x and an
Integrated Community Sustainability Plan in 2015.xi Recently the Sustainability Committee that was originally
formed to drive development of the Charter back in 2010 has been re-established and continues to work on local
policy and initiatives.

7
ecoCity Footprint: City of Powell River Summary Report
DATA COLLECTION AND ANALYSIS METHODOLOGY
The ecoCity Footprint Tool is aligned with the typical spheres, or categories, of municipal planning – buildings,
transportation, waste and water; a fifth category – food - is also included, which is of growing interest to
municipalities (see Figure 4). Data is collected on the total inputs in terms of materials, embodied energy,
operational energy and direct built area for each of these categories; and they are evaluated sectorally – by
residential, institutional, commercial, and industrial sectors. The Tool employs a bottom-up approach,
prioritizing the use of community- and regional-scale data sources. However, in cases where local data is not
available, assumptions or proxies are utilized.
Study Year
Ideally the reporting year should align with the national census reporting year, therefore 2016 was selected as
the reporting year for this study.
Figure 4: Data Inputs6
Key Assumptions and Limitations
As previously noted the eF Tool uses the bottom-up component method. This approach typically produces lower
estimates than the top-down compound method. Similarly, community-scale inventories yield lower per capita
results than national/provincial scale inventories. There are several reasons for the differences:
i. The bottom-up approach does not include emissions from national/provincial services, however an estimate of these can be added (the eF Tool increases the footprint by 1.9 gha to account for these sources, which is a conservative estimate).
ii. The bottom-up approach does not fully capture all life-cycle impacts of materials and energy used in what is being measured in the footprint components (e.g., embodied energy of fuel and airplanes are not currently included).
An overview of the data inputs required to generate the ecological footprint, CBEI and territorial GHG inventory,
and key assumptions and limitations are presented in the table, below. A detailed overview of the methodology,
data sources, and challenges and opportunities are presented in Appendix B.
6 (I)CI refers to light industrial, commercial and institutional sectors.
Categories: Food/Buildings/
Consumables & Waste / Transportation / Water
Materials
Residential (I)CI
Embodied Energy
Residential (I)CI
Operating Energy
Residential (I)CI
Built Area
Residential (I)CI

8
ecoCity Footprint: City of Powell River Summary Report
Table 1: Key Assumptions and Limitations
CATEGORY INPUTS EF CBEI TERRITORIAL
GHG INVENTORY
KEY ASSUMPTIONS AND LIMITATIONS
Food Food available is measured as a proxy for food consumption and import distances are used to estimate food-miles travelled. Energy associated with the production and transportation of imported food is then estimated.
Embodied energy and materials associated with food production (energy and materials used to produce and transport food)
Food consumption and ‘food miles’ statistics are not typically available at the local level; therefore, national averages were used as a proxy. Vancouver is currently conducting a food survey to derive local food estimates. Results from this study could be used as a proxy at a later date.
Land used to produce food
Buildings The embodied materials, embodied energy, operating energy, and the built area associated with residential, industrial and commercial buildings are evaluated in order to establish a material-flow analysis, assess the direct and embodied carbon, and evaluate the ecological footprint of these buildings.
Operating energy used by buildings and related infrastructure
Commercial building count is estimated based on a ratio
of residential to commercial total building numbers of other jurisdictions.
Built area is estimated using Google Maps.
There is limited tracking of wood burning appliances, yet these technologies have a high impact on air quality.
Embodied energy and embodied materials of buildings
Built area associated with buildings
Consumables and Waste Data is collected on the:
quantity of solid and liquid waste generated by sector (residential, industrial, commercial and institutional) and by material type;
method in which materials are managed (i.e., landfilled, incinerated, recycled, composted);
energy consumption and emissions associated with waste management facilities, and transportation of waste;
material composition and built area associated with waste management facilities.
Operating energy used in waste management facilities and hauling waste
Operating energy for waste (liquid and solid) facilities
were not available.
Direct emissions from waste facilities
Embodied energy and materials associated with consumables (as inferred by waste stream)
Built area associated with waste management

9
ecoCity Footprint: City of Powell River Summary Report
CATEGORY INPUTS EF CBEI TERRITORIAL
GHG INVENTORY
KEY ASSUMPTIONS AND LIMITATIONS
Transportation Evaluates the embodied materials and embodied energy of physical transportation infrastructure and vehicles, operating energy (fuel consumed by vehicles), and physical built area occupied by transportation infrastructure. Data is collected for private and commercial vehicles; transit; aviation travel; marine travel and off road vehicle use.
Operating energy associated with transportation (fuel use for private and commercial vehicles; aviation; marine vessels and off-road vehicles)
Relying solely on data from the Powell River airport would provide a gross under-estimate of residents’ total air travel since many residents travel to international airports for much of their aviation travel (Vancouver). Therefore, air travel was estimated using average per-capita values for Metro Vancouver in addition to local flight data.
BC Ferries fuel usage attributable to Powell River residents was based on an estimate of annual fuel consumption for the standard winter schedule. This method assumes that the majority of travellers in the winter months are local (qathet Regional District). Results were apportioned based on Powell River residents’ proportion of the regional population.
Cruise ship and off-road vehicle fuel use was not available.
Embodied energy and embodied materials associated with personal vehicles and transportation infrastructure
Built area associated with transportation
Water Evaluates the embodied materials, embodied energy, operating energy, and built area impacts of the water distribution and purification system relied on by the municipality.
Operating energy used in treating and conveying water
Operating energy for water facilities was not available as
it was aggregated with other regional government data. Embodied energy and embodied materials associated with water infrastructure
Built area associated with water management

10
ecoCity Footprint: City of Powell River Summary Report
RESULTS
The following presents the results of the assessment of the City of Powell River’s: (1) Ecological Footprint (EF),
(2) Consumption-Based Emission Inventory (CBEI), and (3) ‘Territorial/GPC GHG emission inventory; as evaluated
by the ecoCity Footprint Tool.
It is important to contextualize results with the knowledge that the qathet Regional District (qRD) benefits from
the services provided by the City of Powell River. Many residents work in the city and utilize the cultural services,
generating waste and using energy while they do so. This would have an upward influence on Powell River’s GHG
emissions and footprint.
Ecological Footprint Assessment
The ecological footprint is measured in global hectares (gha). A global hectare represents the
average of all biological productive land and aquatic area on Earth for a given year. An ecological
footprint is an estimate of how much biologically productive land and water area an individual
or population needs to produce all the resources it consumes and to absorb the wastes it
generates. Based on current global population and biological productivity levels, an average of
1.7 global hectares is available for each person on the planet.
Powell River’s total ecological footprint is 54,000 gha,7 which is an area 17 times bigger than the
municipal boundary. Powell River’s current per capita footprint is 4.1 gha excluding the resource
demands associated with national and provincial services such as the military. If we were to add
these national and provincial services, Powell River’s per capita ecological footprint increases by
at least 1.9 gha, to 6.0 gha/person.8 Although Powell River’s footprint is significantly less than
the Canadian and US average, it is still 3.5 times what is available (1.7 gha per person). Put
another way, this means that approximately 3.5 Earths would be required to support the global
population if everyone had lifestyles comparable to a Powell River resident.
If we look at the various components of Powell River’s footprint, as shown in Figure 5,
transportation and the consumption of food represents the largest impact, followed by
buildings, and consumables and waste. As previously noted, some of the qRD residents’ impact
is being absorbed by the city of Powell River, which acts as a regional service centre. Thus, the
energy used in commercial and institutional buildings, and the impact of consumables that result
from qRD residents working and recreating in Powell River is also captured in this footprint.
7 Excluding national and provincial services. 8 As noted in the methodology, the bottom-up approach employed in the ecoCity Footprint Tool results in an underestimate of the
footprint. The estimation of the impact of national and provincial services was recently reviewed by Dr. Moore, with total impacts being higher than previously reported. As such, the results presented here (including these senior government services) are not directly comparable with results generated for Vancouver, Saanich, Victoria and North Vancouver (until these community’s reports are updated).
# Planets
Required by
Powell River

11
ecoCity Footprint: City of Powell River Summary Report
34%
19%12%
35%
0%
Ecological Footprint by Activity
Food
Buildings
Consumables & Waste
Transportation
Water
Total gha:
Total gha/ca:
54,000
4.1
Figure 5: Summary of Ecological Footprint by Activity, 2016 (excluding national and provincial services)
Food Footprint
In considering the food footprint we see that only a small proportion of the impact is associated with transport
of food, whereas 98% of the footprint is a result of the amount of land and energy that are utilized in growing
food (see Figure 6).
60%13%
0%
25%
2%
0% Food Footprint Summary
Materials (Cropland)
Materials (Pasture Land)
Materials (Fishing Area)
Embodied Energy (Production)
Operating Energy (Food Miles)
Built Area
Total gha:
Total gha/ca:
18,000
1.4
Figure 6: Food Footprint Summary, 2016
When we look at which types of food are having the largest impact on the footprint, nearly three quarters of the
footprint is a result of animal proteins, in particular red meat, and dairy products, in particular cheese (see Figure
7). These results demonstrate that the largest priority for reducing Powell River’s food footprint is to target

12
ecoCity Footprint: City of Powell River Summary Report
meat and dairy consumption, both in terms of reducing overall consumption levels and in terms of reducing
the land and energy demands associated with their production.
6%
54%
6%
3%
8%
18%
5%
Food Footprint by Food Type
Fruits and Vegetables
Fish, Meat, Eggs
Grains
Stimulants (coffee, tea, sugar, cocoa)
Oils, Nuts, Legumes
Dairy Products
Beverages
Total gha:
Total gha/ca:
18,000
1.4
Figure 7: Food Footprint by Food Type, 2016
Buildings Footprint
As shown in Figure 8, nearly half of the ecological footprint of buildings is a result of operating energy. This is not
to say that material choices for buildings are insignificant, but given that the impact of these materials are
amortized over the entire lifespan of the building, their overall impact compared to fuel and electricity
consumption becomes overshadowed. 9 As the municipality transitions to lower impact energy sources to
operate buildings, the impact of material choices will make up a greater percentage of the footprint. In addition,
the embodied energy impact of Powell River buildings is higher than that of other BC jurisdictions that have used
the ecoCity Footprint Tool because Powell River has a much higher percentage of single-family homes, and fewer
people per home. The near-term priority should be to improve the efficiency of buildings and accelerate action
to implement renewable energy, with a longer-term objective of ensuring footprint impacts are considered in
decisions about building materials over their lifecycle and new housing types.
9 There is an unresolved issue with the data for concrete resulting in under reporting of impacts of commercial/institutional embodied energy on EF and CBEI.

13
ecoCity Footprint: City of Powell River Summary Report
3%
26%
0%
29%
17%
22%
3% 0% Buildings Footprint DetailedMaterials (Residential Woodframe only)
Embodied Energy Residential
Embodied Energy Commercial/Institutional
Operating Energy Residential
Operating Energy Commercial/Institutional
Built Area Residential
Built Area Commercial
Built Area Institutional
Total gha:
Total gha/ca:
10,000
0.8
Figure 8: Buildings Footprint Detailed, 2016
Consumables and Waste Footprint
The footprint of consumables and waste is dominated by upstream impacts, namely the energy and materials
that go into producing the goods that are consumed in the municipality.10 As shown in Figure 9, these upstream
impacts – the embodied materials and embodied energy associated with the consumables – represent 96% of
the footprint. Embodied materials are those that are utilized in the manufacture of a consumable product or
infrastructure but do not end up in the finished product; and embodied energy is the energy used in creating and
delivering a particular material (e.g., consumable good or infrastructure). Results indicate the necessity to
prioritize reduction in overall consumption, instead of focusing on end of stream waste management.
Emphasis should be placed on priority material types, in particular paper and textiles.
4%
32%
49%
14%
1%0% 0%
0%
Consumables and Waste Footprint
Materials Disposed
Embodied Materials Disposed
Embodied Energy of Materials Disposed
Embodied Energy of Materials Recycled
Solid Waste Operations
Liquid Waste Operations
Solid Waste Built Area
Liquid Waste Built Area
Total gha:
Total gha/ca:
6,000
0.5
Figure 9: Consumables and Waste Footprint, 2016
10 Operating energy for waste management facilities was not available, as discussed in Appendix B: Methodology, but would be negligible compared to the embodied energy and embodied materials impacts.

14
ecoCity Footprint: City of Powell River Summary Report
It is also instructional to evaluate which consumables are yielding the largest impact on the footprint in order to
develop targeted policy and communication measures. As shown in Figure 10, the consumables footprint is
dominated by textiles, followed by paper, plastics and metals. These consumable types should be considered
priority impact areas for footprint reduction. Within these components, it is also important to note that
textiles typically comprise a small portion of the waste stream by weight, but their embodied energy and
material are very high. Thus, textiles should be considered a particular priority. Table 1 in Appendix A provides
a detailed breakdown of footprint impacts by type (that is, by type of plastic, paper, etc.).
24%
11%
40%
10%
2% 7%
6%
Consumables Footprint by Consumables Type
Paper
Plastic
Wood Waste, Textiles, & Rubber
Metals
Glass
Household Hygiene
Other
Total gha:
Total gha/ca:
5,000
0.4
Figure 10: Consumables Footprint by Type, 2016
Transportation Footprint
Half of Powell River’s transportation footprint is a result of fuel consumption for private vehicles, and if we add
in the embodied energy of vehicles, private vehicle transportation represents nearly two-thirds of the footprint.
Powell River has a much higher proportion of trucks in the private fleet then other jurisdictions studied which
not only use more fuel, but also require double to triple the material (and embodied energy) to make. Air travel
is also significant. A near-term priority is to electrify the vehicle fleet (particularly transit) and reduce the
number of vehicles on the road by promoting active transportation, transit, and car-sharing. There are also
opportunities to reduce the embodied energy for transportation through promoting compact cars over trucks,
car sharing and transit. The long-term priority should be promoting compact communities that are designed
for active transportation and transit.

15
ecoCity Footprint: City of Powell River Summary Report
0% 2%
12%
48%
14%
0%0% 4%
11%
0%9%
Transportation Footprint MaterialsEmbodied Energy RoadsEmbodied Energy VehiclesOperating Energy Private VehiclesOperating Energy Commercial VehiclesOperating Energy Public TransportationOperating Energy Rail TravelOperating Energy Ferry TravelOperating Energy Air TravelOperating Energy Street LightsBuilt Area Roads
Total gha:
Total gha/ca:
19,000
1.4
Figure 11: Transportation Footprint in Detail, 2016

16
ecoCity Footprint: City of Powell River Summary Report
Territorial GHG Emission Inventory
Through enhancements as part of a 2017 pilot project, the eF Tool now provides a territorial GHG emission
inventory which is compliant with GPC 11 reporting protocols. For this report, we present only summary
information on the territorial emission inventory for the purposes of comparison with the Consumption-Based
Emission Inventory. As shown, total territorial emissions for Powell River are 92 ktCO2e,12 or 7 tC02e per capita.
21%
71%
8%
GPC Basic GHG Emissions
Stationary Energy
Transportation
Waste
Total tCO2e: 92,000
Total tCO2e/ca: 7.0
Figure 12: Territorial GHG Emissions Inventory (GPC Basic Inventory)13
Consumption-Based Emission Inventory
As previously noted, the Consumption-Based Emission Inventory (CBEI) presents the total GHG emissions
resulting from production and consumption of goods and services within a region, regardless of where those
goods and services are produced. This form of inventory is generated using the data typically collected for a
territorial inventory, including the energy used by buildings and transportation and the emissions associated with
solid waste management; in addition to an evaluation of the emissions that result from the production and
transport of all goods consumed within the region, as informed by life cycle assessment data.
Total consumption-based emissions for Powell River were 166 ktCO2e in 2016 (see Figure 13), nearly double the
territorial emissions (see Figure 12). The difference is largely due to the upstream GHG impacts of food and other
consumables, as well as the embodied carbon impacts of transportation infrastructure, which are included in a
CBEI.
For the CBEI, the largest impact category is transportation (59%) followed by buildings (18%); whereas for the
EF, the largest impact category is transportation (35%) followed by food (34%). Food impacts are the area in
which these results vary most significantly. Food is only 12% of the total for the CBEI, but 34% of the EF; the
primary driver for this difference is the land intensity of food production.
11 ‘Global Protocol for Community-Scale Greenhouse Gas Emission Inventories’, a new international standardized approach to conducting territorial emission inventories at the community level. 12 Carbon dioxide equivalent (CO2e) expresses the impact of each different greenhouse gas in terms of the amount of CO2 (carbon dioxide) that would create the same amount of warming. This enables reporting total greenhouse gas emissions in one measurement. 13 Stationary Energy is made up of emissions from fossil fuel and electricity use in buildings

17
ecoCity Footprint: City of Powell River Summary Report
12%
18%
11%
59%
0%
Consumption-Based GHG Emissions
Food
Buildings
Consumables & Waste
Transportation
Water
Total tCO2e: 166,000
12.6Total tCO2e/ca:
Figure 13: Summary of GHG Emissions from Consumption, 2016
CBEI of Food
To inform policy and planning decisions it is important to consider the varying contributions of each of the food
types to the overall food emissions. Figure 14 shows that, similar to the ecological footprint (EF), the majority of
the CBEI for food is a result of animal proteins (red meat) and dairy (cheese). The main difference between the
EF and the CBEI results are that dairy yields a greater GHG impact due to the energy intensity of dairy production,
and meat yields a greater EF impact due to its intensity in land use demands.
8%
43%
5%
9%2%
31%
2%GHG Emissions Inventory of Food
Fruits and Vegetables
Fish, Meat, Eggs
Stimulants (coffee, tea, sugar, cocoa)
Grains
Oils, Nuts, Legumes
Dairy Products
Beverages
Total tCO2e: 20,000
Total tCO2e/ca: 1.5
Figure 14: Greenhouse Gas Emissions Inventory of Food, 2016
CBEI of Buildings
As with the EF, the operating energy of buildings dominates the impact on the CBEI. There is an unresolved issue with the data for concrete resulting in under reporting the impacts of commercial/institutional embodied energy, however, it is expected that changes will not impact the overall emissions significantly or the trend of operating energy being the priority action area.

18
ecoCity Footprint: City of Powell River Summary Report
35%
41%
0%
24%
GHG Emissions Inventory of Buildings
Residential Embodied Energy
Residential Operating Energy
Commercial and Institutional Embodied Energy
Commercial and Institutional Operating Energy
Total tCO2e: 30,000
2.3Total tCO2e/ca:
Figure 15: GHG Emissions Inventory of Buildings, 2016
CBEI of Consumables
The CBEI for consumables shows that the largest GHG impact is due to textiles, as shown in Figure 16. The impact
on consumption-based emissions are higher from plastics then their impact on the footprint (17%, compared to
11% for the EF); and much less for paper (15%, compared to 24% for the EF). These results are explained by the
larger land footprint associated with production of paper, and the higher fuel intensity associated with plastic.
Table 1 in Appendix A provides a detailed breakdown of GHG impacts by type (that is, by type of plastic, paper,
etc.).
15%
17%
34%
14%
3%
7%
10%
GHG Emissions Inventory of Consumables
Paper
Plastics
Wood Waste, Textiles, & Rubber
Metals
Glass
Household Hygiene
Hazardous Material Container
Total tCO2e: 13,000
1.0Total tCO2e/ca:
Figure 16: GHG Emissions Inventory of Consumables, 2016
CBEI of Transportation
Similar to the EF, the majority of the consumption-based emissions for transportation are associated with private
vehicle travel (73%), as shown in Figure 17.

19
ecoCity Footprint: City of Powell River Summary Report
2%
73%
13%
0%
0%
3%
9%
0%
GHG Emissions Inventory of Transportation
Roads
Private Vehicles
Commercial Vehicles
Public Transit
Rail Travel
Ferry Travel
Air Travel
Off Road and Street Lights
Total tCO2e: 98,000
7.5Total tCO2e/ca:
Figure 17: Greenhouse Gas Emissions Inventory of Transportation, 2016
THE SUSTAINABILITY GAP
To achieve ‘One Planet Living’ Powell River’s ecological footprint would need to reduce from 6.0 gha per capita
(with national and provincial services)14 to 1.7 gha per capita.15 This represents a sustainability gap of 72%. From
a climate perspective, in order to achieve the target of maintaining global temperatures below a 2 degree Celsius
in warming, GHGs must be reduced to 2 tCO2e per capita before 2050. Given Powell River’s current CBEI per
capita emissions of 12.6 tCO2e, GHG emissions would need to be reduced by 84%; and based on the GPC
(territorial) per capita emissions of 7 tCO2e, they would need to be reduced by 71%. Net GHG emissions would
need to reach zero before 2075.
0.00
1.00
2.00
3.00
4.00
5.00
6.00
7.00Sustainability Gap
Cropland Pasture Land Fish AreaForest Land Energy Land Built LandServices
72 %
One Planet 1.7 gha/ca
gha/ca
Figure 18: Sustainability Gap, 2016 (including national and provincial services)
14 Excluding national and provincial services Powell River’s footprint is 4.1 gha per capita. 15 Currently an average of 1.7 global hectares is available for each person on the planet
Cropland, Pasture Land, and Fish Area • Refer to the area used for these
activities Forest Land
• Refers to the area of forest harvested
Energy Land • Refers to the area of forest
needed to absorb CO2 emissions
Built Area • Refers to the area covered by
infrastructure such as roads and buildings
Services • Refers to the area needed to
absorb the impact of national and provincial services

20
ecoCity Footprint: City of Powell River Summary Report
ONE PLANET SCENARIO
A One Planet Scenario for Powell River is proposed for the portion of the city's footprint that is a direct result of
local activity (excluding national and provincial services). To achieve the 1.7 gha per capita target, the actual
reductions would need to be greater to account for national and provincial services and for those components
that are not included in the bottom-up approach. The associated reduction in GHG emissions are also presented.
MEASURE EF reduction (gha/capita)
GHG reduction (tCO2e/capita)
Convert 70% of vehicle fleet to electric & the remaining 30% to hybrid, also converting 50% of Light Trucks/SUV hybrids to Small/Compact Car hybrids**
0.92 5.58
Reduce VKT 25% in private vehicle fleet 0.03 0.17
Convert 100% of ferries and transit to electric 0.07 0.27
Eliminate fossil fuel use in buildings 0.29 1.40
Reduce beef/lamb by 75% (and substitute with fish, chicken and legumes) and reduce dairy (without substitution) by 50%16
0.53 0.29
Reduce food waste post-purchase 30% 0.25 0.37
Reduce Municipal Solid Waste (MSW) 50% 0.15 0.42
**These reductions can also be achieved by including mode shift to active transportation and transit which has the added benefit of reducing the total vehicle fleet size and its embodied energy.
This scenario lowers the footprint below the 1.7 gha per capita threshold, lowers the GPC (territorial) GHG
emissions to 1.1 tCO2e per capita, and lowers the CBEI GHG emissions to 3.9 tCO2e per capita. Further emissions
reductions would need to target aviation, vehicles, consumption of consumables, farming practices and the
materials used for buildings and infrastructure such as roads.
What might a one planet lifestyle look like…17
Meet Brenda. Her family has recently moved into a new home in Westview that is certified zero carbon. This
means that all building materials and construction equipment are carbon neutral. Most of the windows in the
home face southwest overlooking Malaspina Strait. This design results in certification as a passive home with
very little space heating and cooling requirements. A programmable thermostat maintains a comfortable room
temperature by controlling window shading and a solar thermal heat/cooling pump system. The roof space is
leased to one of Powell River’s increasing number of urban farmers and to BC Hydro for renewable electricity
generation.
In addition to weekly visits to the Farmers’ Market, the family orders grocery deliveries from the network of local
farmers and distributors, based on a meal plan she has entered online. She and her family eat a largely vegetarian
diet high in fresh vegetables and legumes with small portions of white meat, local wild fish and local cheese, all
of which is tracked in their personal carbon emissions budget. They collect all food scraps and yard waste for
16 When one food item is reduced, essential calories will need to be replaced with calories from another food group. 17 To enable residents to achieve a one planet lifestyle, governments and corporations that provide goods and services must also adopt one planet operations.

21
ecoCity Footprint: City of Powell River Summary Report
composting at the qathet carbon sequestration plant for use in local farms and community or private vegetable
gardens.
The family owns a small electric car that is certified zero carbon. It is easily and quickly charged at the large
number of charging stations throughout the city. They belong to the local car co-op for times when they need an
electric truck or second vehicle. As often as possible, family members bike or walk to work or school. On
inclement days, they use the electric car or make use of electric transit. It is a short trip to Westview Elementary
for Brenda’s daughter, but her son takes transit to Brooks.
Brenda and her family hold periodic clothing swap parties. They also frequent local thrift and consignment stores.
They have taken courses at the Powell River campus of VIU to learn about repurposing fabric and apparel. For
DIY projects, they go to the Resource Recovery Centre to find what they need.
Brenda, her partner and children all like to participate in the Powell River sports and culture scene. When they
do so, they can now rest assured that the events are all required to be carbon neutral. In the past they donated
to the “Offset the Carbon Cost of this Event” receptacle, a long-time feature of all Powell River concerts and
games.
The family keeps in touch with relatives and friends online. When they do travel, they make use of the electric
shuttle bus and electric ferries to Vancouver Island and the Vancouver train terminal. The high-speed electric
trains now only take 6 hours to reach Toronto. Usually they spend vacation time in the surrounding Powell River
area.
Whenever the city or regional district hold public meetings to update residents on One Planet Living, the family
attends.

22
ecoCity Footprint: City of Powell River Summary Report
POLICY RESPONSES AND INTERVENTIONS
While a typical territorial GHG inventory identifies
the emissions that are occurring within a
community’s borders, the ecological footprint and
consumption-based approach broadens the analysis
to consider global ecological and carbon impacts.
Local government staff can use data from the
ecoCity Footprint Tool to identify activities and
consumption habits that are having the greatest
impact on their community’s contribution to global
climate change and ecological overshoot. They can
then implement informed policy interventions to
best reduce these impacts. The ultimate objective is
to achieve One Planet Living; and with respect to
climate change, that means mitigating our
emissions to the extent that we do not increase our
planet’s temperature more than 1.5 degrees Celsius.
CBEI and EF results highlight the need for the
municipality, and other levels of governments, to
support a shift to a more sustainable pattern of
consumption. This could include:
Enacting policies and regulations to (1)
influence consumers and (2) ensure that
more sustainable options are available.
Communicating the impact of purchasing
decisions to residents and encouraging their
adoption of sustainable consumption
behaviours.
Consideration of the CBEI and EF results can
effectively shift some key areas of policy and
planning decision-making. In particular, they
highlight the necessity to:
Target the resource and climate impacts
associated with food production and
disposal. For Powell River, 12% of CBEI
emissions and 34% of the EF are due to food
consumption.
Decrease red meat and dairy (cheese)
consumption by substituting with legumes
and white meat and reduce food waste.
For Powell River, meat and dairy
consumption is responsible for nearly three
quarters of the food component of the EF,
and CBEI emissions.
Ensure that local food production has low
resource intensity (in terms of fossil energy
use and land area). For Powell River, 98% of
the food footprint is associated with energy
and land requirements, while
transportation represents only 2% of the
food footprint.
Shift the focus from waste reduction to
consumption reduction.
For Powell River, 96% of the footprint
associated with goods consumed is due to
production and transport, rather than use
and disposal.
Reduce the consumption and disposal of
textiles, which have a very high ecological
impact even though their portion of the
waste stream is comparatively smaller.
Reduce vehicle ownership and support this
shift through effective land use planning.
Eliminate emissions from oil, propane and
natural gas usage in residential, commercial
and institutional buildings.
One-planet living refers to a lifestyle that, if
adopted by everyone, could be supported
indefinitely by the regenerative capacity of
Earth’s ecosystems.
- Wackernagel and Rees 1996

23
ecoCity Footprint Tool: City of Powell River Summary Report
Potential Action Areas for City of Powell River
High-level actions for each sphere of municipal planning are presented below. This is not an exhaustive list, it is
recommended that the City review results in detail and use these results to inform upcoming policy, planning
and communication efforts.
Planning Sphere
Key Objectives Instrument
FOO
D
Reduce food waste
Reduce meat and dairy consumption
Obtain local data on food consumption
impacts
Promote sharing economy opportunities (e.g., community gardens).
Promote diet shifts (e.g., ‘Meatless Mondays’ Oregon; Celebrate the Harvest campaigns).
Adopt advanced purchasing standards (e.g., Emeryville Good Food Purchasing Program, EPA West Coast Forum on Materials and Climate’s Climate Friendly Purchasing Toolkit).
Implement food waste reduction campaigns (e.g., Canada’s Love Food Hate Waste; US EPA’s Food too Good to Waste; NRDC Save the Food Campaign).
Undertake a food survey to gain knowledge about local food consumption and impacts so as to track progress toward goals.
BU
ILD
ING
S &
IN
FRA
-
STR
UC
TU
RE
Increase efficiency
(envelope 1st approach)
Use building materials with lower embodied
energy
Implement government purchasing policies to favour recycled content/reused building materials.
Provide incentives for smaller and more energy efficient homes, and renewable technology incentives for homes and business.
Building codes that promote energy and material efficiency
CO
NSU
MA
BLE
S Reduce the volume of individually owned
goods
Increase reuse
Promote sustainable consumption behaviours (e.g., Vancouver’s Green Bloc Neighbourhood Challenge).
Promote sharing economy opportunities (e.g., clothes swaps).
Promote ‘smart’ buying practices – focusing on durability and buying fewer clothes (e.g., Oregon DEQ’s Make Every Thread Count).
Support and promote Repair Cafés and Fix-it clinics and the local repair industry.
TRA
NSP
OR
TATI
ON
Reduce vehicle
ownership
Decrease vehicle travel
Improve efficiency of vehicle fleet
Better understand
inter-urban transportation demand
Increase electrification of fleet.
Support and promote bike-sharing and car-sharing programs.
Continue to expand Active Transportation Initiatives.
Ensure neighbourhood plans contribute to compact urban development, smaller homes and walkable neighborhoods.
Undertake an ‘Inter-urban’ Transportation Demand Survey to gain a better understanding of residents out of boundary transportation habits (e.g., ferry, cruise, aviation).

24
ecoCity Footprint: City of Powell River Summary Report
City Initiatives
There are also overarching initiatives that the City
can undertake to create a shift to more sustainable
patterns of consumption, such as
Update goal and target setting: consider
adjusting emission reduction goals to reflect this
new information (e.g., Eugene, Oregon has
developed science-based targets that used
consumption-based emissions to set its “carbon
budget”, and a similar approach is being
considered in Europe).
Integrate EF and CBEI results into reporting:
include these results alongside the traditional
territorial GHG emission inventory.
Incorporate sustainable consumption principles
into economic and community development
strategies; for example, by implementing
policies and bylaws that would attract low-
carbon producers, promote work force
development in the repair and reuse industries,
and drive community investment in shared
public goods such as arts, libraries, parks and
recreation.
Engage with other levels of government to
encourage and promote policies and regulations
to shift to more sustainable patterns of
consumption; in particular,
- Design for the Environment practices that
increase the longevity and reduce the
resource intensity of products, and expand
the potential for product reuse and
recycling.
- Product labelling to encourage the purchase
of lower impact goods.
- Expand extended producer responsibility
programs to reduce waste disposal.
Use accessible framing, communications and
metrics to advance sustainable consumption
objectives as a means of engaging residents and
businesses to shift to more sustainable
consumption habits (e.g., ‘One Planet Living’
framing and metrics). Local governments are
uniquely positioned to reach and influence
these key stakeholders with the goal of building
awareness, changing attitudes, and shifting
consumption patterns.
Green Bloc is an innovative ecological footprint challenge that is being piloted in four Vancouver neighbourhoods, using a streamlined version of the ecoCity Footprint Tool. Through Green Bloc, community members are measuring their household ecological footprint, developing neighbourhood action plans, and delivering neighbourhood enhancing, and footprint-reducing, projects in their communities. The first pilot neighbourhood – Riley Park – already reduced their footprint by 12% between 2013 and 2015. (See http://greenbloc.lighterfootprint.ca/)
In Vancouver, a collaborative group of
non-governmental organizations are
partnering with the City to actively
bringing together a community of action
around the Lighter Footprint goal. They
are revealing and linking projects and
partners across Vancouver, as well as
encouraging new efforts in key impact
areas, with the goal of helping
Vancouver become a One-Planet City.
(See: http://lighterfootprint.ca/)

25
ecoCity Footprint: City of Powell River Summary Report
Additional Resources and Tools
Although the use of ecological footprint and CBEI
results to inform community planning is a new and
emerging area, there are some useful resources to
guide governments and community builders in this
work, for example:
USDN Sustainable Consumption Toolkit:
Launched in 2015, it includes a conceptual
overview and a database of local actions. A
refresh/update is planned for early 2018 (see:
http://sustainableconsumption.usdn.org/)
Life Cycle Analysis studies:
The Oregon Department of Environmental
Quality has produced several studies related to
food and food-specific products such as wine
and tomatoes.
Climate Friendly Purchasing Toolkit:
A resource for institutional purchasing from a
consortium of west coast cities and states
containing modules on a number of product
categories such as IT, infrastructure, and food.
The Stockholm Environment Institute Working Paper: Reducing Greenhouse Gas Emissions Associated with Consumption: A Methodology for Scenario Analysis
Summarizes a methodology for constructing
long-term scenarios of a transition to low-GHG
consumption; and provides results of applying
this methodology in Seattle, Washington (see:
https://tinyurl.com/yaahjena).
26
ecoCity Footprint: City of Powell River Summary Report
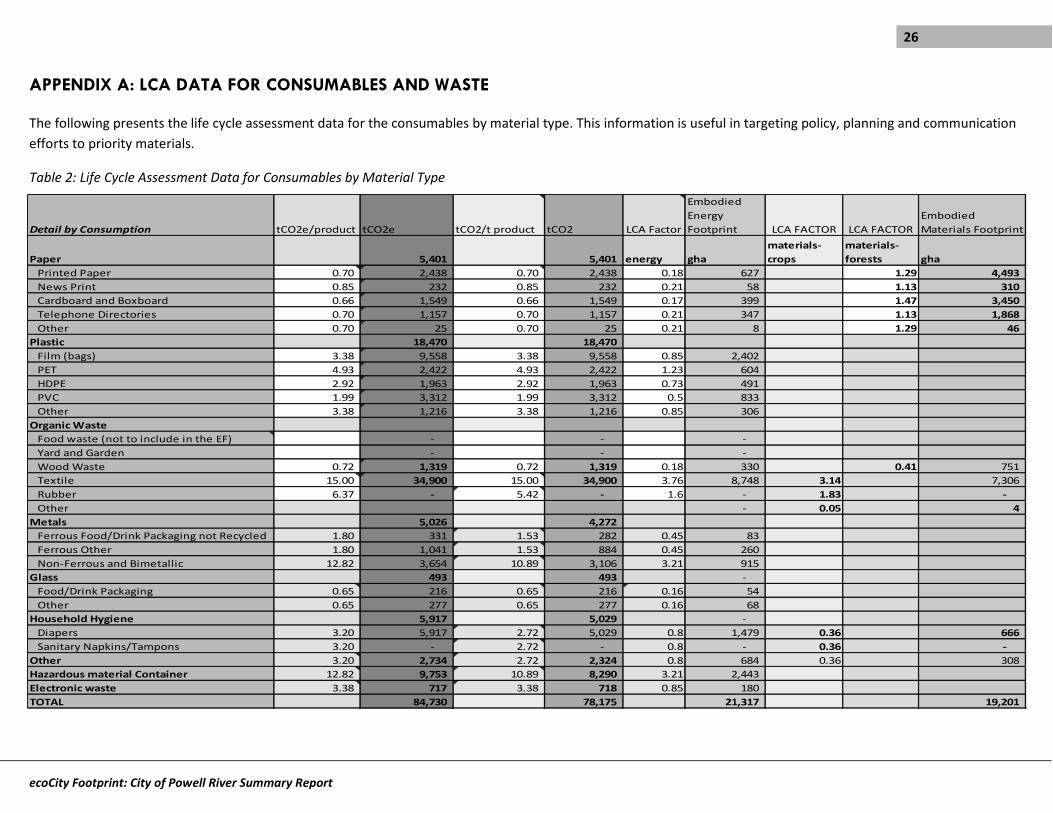
APPENDIX A: LCA DATA FOR CONSUMABLES AND WASTE
The following presents the life cycle assessment data for the consumables by material type. This information is useful in targeting policy, planning and communication
efforts to priority materials.
Table 2: Life Cycle Assessment Data for Consumables by Material Type
Detail by Consumption tCO2e/product tCO2e tCO2/t product tCO2 LCA Factor
Embodied
Energy
Footprint LCA FACTOR LCA FACTOR
Embodied
Materials Footprint
Paper 5,401 5,401 energy gha
materials-
crops
materials-
forests gha
Printed Paper 0.70 2,438 0.70 2,438 0.18 627 1.29 4,493
News Print 0.85 232 0.85 232 0.21 58 1.13 310
Cardboard and Boxboard 0.66 1,549 0.66 1,549 0.17 399 1.47 3,450
Telephone Directories 0.70 1,157 0.70 1,157 0.21 347 1.13 1,868
Other 0.70 25 0.70 25 0.21 8 1.29 46
Plastic 18,470 18,470
Film (bags) 3.38 9,558 3.38 9,558 0.85 2,402
PET 4.93 2,422 4.93 2,422 1.23 604
HDPE 2.92 1,963 2.92 1,963 0.73 491
PVC 1.99 3,312 1.99 3,312 0.5 833
Other 3.38 1,216 3.38 1,216 0.85 306
Organic Waste
Food waste (not to include in the EF) - - -
Yard and Garden - - -
Wood Waste 0.72 1,319 0.72 1,319 0.18 330 0.41 751
Textile 15.00 34,900 15.00 34,900 3.76 8,748 3.14 7,306
Rubber 6.37 - 5.42 - 1.6 - 1.83 -
Other - 0.05 4
Metals 5,026 4,272
Ferrous Food/Drink Packaging not Recycled 1.80 331 1.53 282 0.45 83
Ferrous Other 1.80 1,041 1.53 884 0.45 260
Non-Ferrous and Bimetallic 12.82 3,654 10.89 3,106 3.21 915
Glass 493 493 -
Food/Drink Packaging 0.65 216 0.65 216 0.16 54
Other 0.65 277 0.65 277 0.16 68
Household Hygiene 5,917 5,029 -
Diapers 3.20 5,917 2.72 5,029 0.8 1,479 0.36 666
Sanitary Napkins/Tampons 3.20 - 2.72 - 0.8 - 0.36 -
Other 3.20 2,734 2.72 2,324 0.8 684 0.36 308
Hazardous material Container 12.82 9,753 10.89 8,290 3.21 2,443
Electronic waste 3.38 717 3.38 718 0.85 180
TOTAL 84,730 78,175 21,317 19,201

27
ecoCity Footprint: City of Powell River Summary Report
APPENDIX B: DATA COLLECTION METHODOLOGY
The following provides a detailed summary of the methodology and sources utilized in creating Powell River’s
ecological footprint and GHG inventories. It also presents challenges and opportunities associated with the data
collection process.
A detailed overview of the methodology by which ecological footprints are generated in the ecocity Footprint
Tool are provided in Dr. Moore’s thesis: Moore, Jennie Lynn (2013). Getting Serious About Sustainability:
Exploring the Potential for One-Planet Living in Vancouver. A thesis submitted in partial fulfilment of the
requirements for the Degree of Doctor of Philosophy, School of Community and Regional Planning, University
of British Columbia. Available at: http://pics.uvic.ca/sites/default/files/uploads/publications/moore_jennie-
UBC_0.pdf
Research Principles
The following guidelines were applied when making decisions about data sources:
i) Accuracy: The goal is to achieve a high degree of accuracy, where accuracy is the degree of closeness to
a measured value’s actual value. (This is in contrast to precision, in which the goal is to have measurements
conform with one another.)
ii) Subsidiarity: Locally produced data is preferred, especially when local authorities trust the source’s
validity and use it to inform policies and management practices. Locally derived data reflect the nuance of the
local community being profiled and can resonate more readily with local authorities who use these same data
points to inform their work.
iii) Conservatism: In cases where two data sources equally meet the accuracy and subsidiarity criteria, the
final decision is based on which data point represents a more conservative estimate. The purpose of this
approach is to avoid overstating consumption amounts.
Population
The number of people living in the municipality was based on the most recent census year (2016). In some cases,
a ratio of the municipal population to the regional population was also required to allocate regional impacts to
the municipality.
Sources
Statistics Canada. (April, 2018). Census Profile, 2016 Census. Retrieved from
http://tinyurl.com/ydg48p58
Food
Evaluates the land area, materials, embodied and operational energy including for transportation of food from
field to table. Food available is measured as a proxy for food consumption and import distances are used to
estimate food-kilometers travelled. The energy associated with the production and transportation of imported
food is then estimated.

28
ecoCity Footprint: City of Powell River Summary Report
Embodied Materials and Energy [Food]
Methodology
Food consumption was estimated using national Statistics Canada data from CANSIM Table 002-0011
which documents food availability per person by year (Statistics Canada, n.d.). Disaggregated food items
are then organized into larger food groups to estimate average food consumption per-capita by food
type. Life Cycle Assessment data from Dr. Moore’s previous study (2013), which is built into the ecoCity
Footprint Tool, is then used to determine the embodied energy of the food by type.
Sources
Statistics Canada. (n.d.). Table 002-0011: Food available in Canada, annual (kilograms per person, per
year unless otherwise noted), CANSIM. Retrieved May 11, 2017, from
http://www5.statcan.gc.ca/cansim/a47
Challenges and Opportunities
The biggest challenge concerning food consumption is the lack of readily available data sources since
local governments typically do not track food-related data. Instead, national data from Statistics Canada
was used to infer average consumption by food type. Accordingly, food consumption emissions and
ecological footprints represent national averages rather than local profiles.
However, City of Vancouver plans to undertake a localized food survey in 2018, which will subsequently
be incorporated into the Metro Vancouver Food Waste Survey in 2019. It will be possible to use results
from this survey to estimate local food consumption for the city and the region. City-specific food
consumption data presents an opportunity to obtain improved statistics that represent each city; but
unfortunately, this is widely unavailable and still presents an overarching challenge.
Operating Energy [Food-Kilometers]
Methodology
In order to estimate distance travelled for Canadian food, food-kilometers use a similar methodology as
outlined in Meidad Kissinger’s International Trade Related Food Miles – The Case of Canada (2012).
Similar to Kissinger’s study, data is obtained from the Canadian CHASS (Computing in Humanities and
Social Sciences) Trade Analyzer Database. The database tracks Canadian import totals based on
Harmonized System (HS) 10-digit merchandise codes by origin (country or US state) and province of
clearance.
Distance Calculations
Two types of distances were considered, land and sea. Where available, road distances were used for
North American destinations and more specifically, the distance between the most populous city in each
province and state were used. Road distances were taken from online North American Mileage Charts
whereas all other imports were assumed to be transported by sea. The Sea Distance/ Port Distances
online tool, available on Sea-Distances.org, was used to calculate distances between sea ports. Where
available, the most major sea port was used for each origin or destination. Inland countries’ imports
were assumed to be trucked to the closest major sea port and shipped by sea. Accordingly, inland
countries without a major sea port used the distance to the closest sea port in a neighboring country.
Percent Imports by Destination
Canadian imports for the latest available year, 2013, was exported and organized into broader food
categories to align with food consumption data. Based on the total quantity of imports, the percent of

29
ecoCity Footprint: City of Powell River Summary Report
food imports by category and origin destinations was calculated. For example, 4.32% of Canada’s total
wine imports were imported from Australia into Ontario. A matrix of food category import percentages
by origin and province of clearance was created.
Average Food-Kilometers
An average food kilometer value was determined for each specific category, separated by road and by
sea, using a weighted average. Each individual import percentage by food category, destination, and
origin, was multiplied by the respective road or sea distance. Using the same example as above, the
percent of total wine imports from Australia to Ontario was multiplied by the assumed sea distance (20
618 kilometers x 4.32% = 866 kilometers). The sum of each food category’s distances by destination and
origin was taken as the average food-kilometers distance.
Percent Scale for Imports
With an average import distance for food categories calculated, a percent import scale factor was applied
which averaged out the imported sea and road distances across the entire food category population.
Percent imports were calculated by analyzing data from CANSIM Table 002-0011, which documents the
imports and total supply for food categories by year (Statistics Canada, n.d.-a, n.d.-b).
Total Kilometers Calculation
Finally, the average food distance per food type was multiplied by the total food consumption recorded
in the Embodied Energy [Food] subsection. Since the most recent available data year was 2013, the
CHASS Trade Analyzer Database exports were used to estimate an average food-kilometer for each food
category, which was then multiplied by total food imports to generate tonnes-kilometers per food type.
These totals are then multiplied by emission factors for CO2e per tonnes-kilometers by sea and truck to
estimate total emissions.
Sources
Kissinger, M. (2012). International trade related food miles: The case of Canada. Food Policy, 37(2),
171-178. doi:10.1016/j.foodpol.2012.01.002
Mileage-Charts. (n.d.). Retrieved August 2017, from http://www.mileage-
charts.com/chart.php?p=index&a=NA
SEA-DISTANCES.ORG. (n.d.). Sea Distance/ Port Distances. Retrieved September 2017, from https://sea-
distances.org/
Statistics Canada. (n.d-a). Table 002-0010: Supply and disposition of food in Canada, annual (tonnes
unless otherwise noted), CANSIM. Retrieved on September 17, 2017, from
http://www5.statcan.gc.ca/cansim/a47
Statistics Canada. (n.d.-b). Table 002-0011: Food available in Canada, annual (kilograms per person, per
year unless otherwise noted), CANSIM. Retrieved May 11, 2017, from
http://www5.statcan.gc.ca/cansim/a47
Weber, C.L., Matthews, S.H. (2008). Food-miles and the relative climate impacts of food choices in the
United States. Environmental Science & Technology, 42, 3508–3513.

30
ecoCity Footprint: City of Powell River Summary Report
Challenges and Opportunities
Similar to food consumption, the biggest challenge concerning food-kilometers is the lack of readily
available data sources. Quantifying food-kilometers can be difficult, and relies on the combination of
several data sets to produce estimates. National Canadian import data was used to approximate average,
representative distances for the entire food category which limits insights from food-kilometers to a
national scale.
Using Canadian imports sorted on the 10-digit HS system, we were able to quantify imports and their
origins and destinations at a granular level. Some of the fine-grained food-related items may not be
associated with consumption (for example, wheat for sowing). It is assumed that the transported
distances for food items are similar between food for consumption and production.
Another challenge was that this methodology only considers road and sea distances. Although the
majority of food imports are by truck and sea, it is estimated that 7% of imports are by train (Kissinger,
2012). The associated emissions with air travel are significantly higher than those associated with truck
or sea distances (Weber and Matthews, 2008) For this reason, air imports should be considered in food
calculations even though they represent a small portion of total food imports.
Averaged road and sea distances for Canadian imports are scaled by percent import factors for each food
category. This scaling to determine overall average distances introduces uncertainties in the last step of
distance calculations.
The methodology only considers imported food distances whereas domestic food-kilometers between
provinces and cities are not calculated; however, these distances and their associated emissions are
partially included in the Transportation portion of the ecoCity Footprint Tool.
Buildings
Evaluates the materials, the embodied and operational energy; and the built area associated with residential,
industrial and commercial buildings in order to establish a material-flow analysis, assess the direct and embodied
carbon, and evaluate the ecological footprint of buildings.
Embodied Materials and Energy [Buildings]
Methodology
The number of commercial, institutional and residential buildings as well as an estimated composition
of each building type are required to evaluate the embodied materials and energy associated with the
building stock. Residential units are divided into categories depending on building types (e.g., single
family detached house, apartment, etc.). Commercial and industrial buildings are differentiated based
on height as this is a significant indicator of their material composition.
The ecoCity Footprint Tool contains calculations and assumptions to derive the embodied materials and
energy associated with the total materials contained within the buildings, which were developed through
Dr. Moore’s original ecological footprint study of the City of Vancouver, and are summarized in Dr.
Moore’s 2013 thesis. Specifically, for a prescribed set of building archetypes, building material
composition is assigned while average lifespan and floor area can be altered to reflect local conditions.
The material composition estimates were derived using the Athena Impact Estimator for Buildings Tool.
The archetypes created for the Vancouver 2013 study have been used in this inventory, as they are not

31
ecoCity Footprint: City of Powell River Summary Report
likely to have changed significantly since the previous study. The average lifespan of buildings which was
assumed to be 75 years for residential and institutional/commercial buildings.
Sources
National census data provides a detailed count of housing units. The number of commercial buildings
was estimated using ratios of residential to commercial building counts for other BC jurisdictions and
scaled for Powell River’s population.
Statistics Canada. (April, 2018). Private Dwellings Profile, 2016 Census. Retrieved from
http://tinyurl.com/y82sb66z
Moore, J., Kissinger, M., & Rees, W. E. (2013) An urban metabolism and ecological footprint assessment
of Metro Vancouver. Journal of Environmental Management, 124, 51-61.
Challenges and Opportunities
The number of commercial buildings was not available and was estimated using ratios of residential to
commercial building counts for other BC jurisdictions and scaled for Powell River’s population.
Operating Energy [Buildings]
Methodology
To calculate operating energy, data is required on the annual consumption of electricity, natural gas, and
other heating fuels; broken down by sector. Energy lost through transmission and fugitive emissions is
also collected or estimated. Carbon footprints are then calculated using provincially specified emissions
factors.
The most recent building operating energy was provided by the province for 2017. However, BC Hydro
and Fortis BC have both changed their methodologies from what was done in previous years. Until the
new methodologies are back-casted and compared to the old methodologies it is unknown if the data is
comparable. Therefore, the building operating energy data used for this analysis is from Powell River’s
2012 CEEI, and those numbers were multiplied by the population change percentage of Powell River
from 2011 to 2016 to adjust to the 2016 reporting year.
Transmission Loss
BC Hydro’s estimated transmission loss rate of 7.5% was applied to account for emissions associated
with electricity transmission losses (Equation 1).
(total energy in MWh) x (0.075) = energy loss through transmission
Where total energy in MWh = (energy used in boundary) / (0.925)
Fugitive Emissions
Fugitive emissions estimates for Powell River were estimated by scaling the fugitive emissions for other
BC jurisdictions by the amount of gas used.
Sources
The 2012 CEEI from the City provided the most recent study year to have reliable estimated energy use.
This was scaled by population change to estimate 2016 energy use.
(1)
(2)

32
ecoCity Footprint: City of Powell River Summary Report
BC Ministry of Environment. (2016). 2016/17 B.C. best practices methodology for quantifying
greenhouse gas emissions: Including guidance for public sector organizations, local
governments and community emissions. Retrieved from
http://www2.gov.bc.ca/assets/gov/environment/climate-change/cng/methodology/2016-17-
pso-methodology.pdf
Government of BC (2012). 2012 Community Energy and Emissions Inventory (CEEI). Retrieved from
https://www2.gov.bc.ca/gov/content/environment/climate-change/data/ceei
Challenges and Opportunities
The CEEI data combines commercial and institutional data sets, therefore commercial operating energy
was over-represented and institutional data was not expressed in its own category.
There was limited tracking of wood burning appliances, yet these technologies have a high impact on air
quality. Data on their use and number may help municipalities evaluate the importance of targeting these
sources for reducing air contaminants and GHG emissions.
Built Land Area [Buildings]
Methodology
Built area includes all non-road areas that have been paved for parking or built-up for residential,
industrial, and commercial use. Calculations of total built area of homes and commercial structures were
completed with rough estimates using Google Maps. Streets, lanes, and sidewalks could not be
separated, so were included in total numbers and extracted later using data from other BC jurisdictions
that shows roads to make up 40% of the built area on average.
Sources
Built area was roughly calculated using Google Maps.
Challenges and Opportunities
Built area is often available through GIS data, however smaller communities such as Powell River typically
do not have the resources for GIS mapping. The methodology used is likely resulting in an overestimate
of built area for Powell River as its impact is significantly higher then for other BC jurisdictions that have
used the ecocity Footprint Tool.
Consumables and Waste
Evaluates the materials, embodied energy and embodied materials, and land area associated with the production
and disposal of products in the municipal waste stream.
Data is collected on:
the type and quantity of solid and liquid waste generated by sector (residential, industrial, commercial and institutional) and by material type;
the method in which these materials are managed (i.e., landfilled, incinerated, recycled or composted);
the energy consumption and emissions associated with the waste management facilities, and the transportation of the waste; and
the material composition and built area associated with waste management facilities.
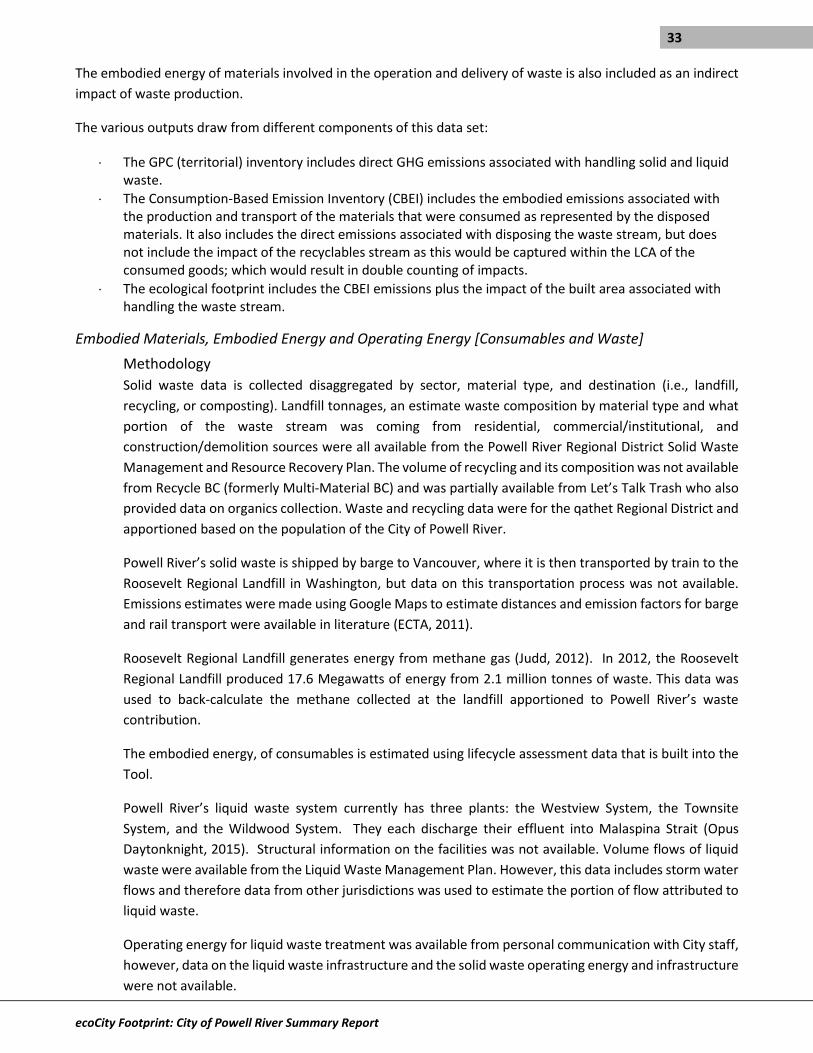
33
ecoCity Footprint: City of Powell River Summary Report
The embodied energy of materials involved in the operation and delivery of waste is also included as an indirect
impact of waste production.
The various outputs draw from different components of this data set:
The GPC (territorial) inventory includes direct GHG emissions associated with handling solid and liquid waste.
The Consumption-Based Emission Inventory (CBEI) includes the embodied emissions associated with the production and transport of the materials that were consumed as represented by the disposed materials. It also includes the direct emissions associated with disposing the waste stream, but does not include the impact of the recyclables stream as this would be captured within the LCA of the consumed goods; which would result in double counting of impacts.
The ecological footprint includes the CBEI emissions plus the impact of the built area associated with handling the waste stream.
Embodied Materials, Embodied Energy and Operating Energy [Consumables and Waste]
Methodology
Solid waste data is collected disaggregated by sector, material type, and destination (i.e., landfill,
recycling, or composting). Landfill tonnages, an estimate waste composition by material type and what
portion of the waste stream was coming from residential, commercial/institutional, and
construction/demolition sources were all available from the Powell River Regional District Solid Waste
Management and Resource Recovery Plan. The volume of recycling and its composition was not available
from Recycle BC (formerly Multi-Material BC) and was partially available from Let’s Talk Trash who also
provided data on organics collection. Waste and recycling data were for the qathet Regional District and
apportioned based on the population of the City of Powell River.
Powell River’s solid waste is shipped by barge to Vancouver, where it is then transported by train to the
Roosevelt Regional Landfill in Washington, but data on this transportation process was not available.
Emissions estimates were made using Google Maps to estimate distances and emission factors for barge
and rail transport were available in literature (ECTA, 2011).
Roosevelt Regional Landfill generates energy from methane gas (Judd, 2012). In 2012, the Roosevelt
Regional Landfill produced 17.6 Megawatts of energy from 2.1 million tonnes of waste. This data was
used to back-calculate the methane collected at the landfill apportioned to Powell River’s waste
contribution.
The embodied energy, of consumables is estimated using lifecycle assessment data that is built into the
Tool.
Powell River’s liquid waste system currently has three plants: the Westview System, the Townsite
System, and the Wildwood System. They each discharge their effluent into Malaspina Strait (Opus
Daytonknight, 2015). Structural information on the facilities was not available. Volume flows of liquid
waste were available from the Liquid Waste Management Plan. However, this data includes storm water
flows and therefore data from other jurisdictions was used to estimate the portion of flow attributed to
liquid waste.
Operating energy for liquid waste treatment was available from personal communication with City staff,
however, data on the liquid waste infrastructure and the solid waste operating energy and infrastructure
were not available.

34
ecoCity Footprint: City of Powell River Summary Report
Sources
Landfill waste volumes and estimates of composition were accessed from the qathet Regional District
and recycling volumes and composition were partially available from personal communication with Let's
Talk Trash representatives. Volumes of liquid waste were available from the City.
Maura Walker & Associates. (2017). Powell River Regional District Solid Waste Management and
Resource Recovery Plan. Retrieved from http://www.powellriverrd.bc.ca/wp-
content/uploads/FINALSWRMP_17Nov2017-FINAL.pdf
ECTA. (2011). Guidelines for Measuring and Managing CO2 Emission from Freight Transport Operations.
Retrieved from
https://www.ecta.com/resources/Documents/Best%20Practices%20Guidelines/guideline_for_
measuring_and_managing_co2.pdf
Opus DaytonKnight. (2015). CITY OF POWELL RIVER LIQUID WASTE MANAGEMENT PLAN - STAGE 3.
Retrieved from https://powellriver.civicweb.net/document/34493
Judd, R. (August 3, 2012). What a big bunch of garbage: but Roosevelt Landfill turns it into power. The
Seattle Times. Retrieved from https://www.seattletimes.com/pacific-nw-magazine/what-a-big-
bunch-of-garbage-but-roosevelt-landfill-turns-it-into-power/
Klickitat Public Utility District (2011). H.W. Hill Landfill Gas Project. Retrieved from
http://www.klickitatpud.com/topicalMenu/about/powerResources/hwHillGasProject.aspx
Republic Services (2018). Roosevelt Regional Landfill. Retrieved August 2018, from
http://local.republicservices.com/site/roosevelt
Challenges and Opportunities
Agencies that handle collection of waste and recyclables across the Province, are not providing full access
to data. The Province and cities can make this data access a requirement in contract renewals.
Solid and Liquid Waste Built Area [Consumables and Waste]
Methodology
Data on built area was not available and estimates were made using data from other jurisdictions and
scaling for population.
Sources
N.A.
Challenges and Opportunities
Smaller communities typically do not have the resources to track this type of data
Transportation
Evaluates the embodied materials and embodied energy of physical transportation infrastructure and vehicles,
operating energy (fuel consumed by vehicles), and physical built area occupied by transportation infrastructure.

35
ecoCity Footprint: City of Powell River Summary Report
Embodied Materials and Embodied Energy and Built Area [Transportation]
Methodology
Built area for transportation includes road length and paved right-of-way width. The quantity of roadway
and the road material composition is used along with LCA data to evaluate the embodied energy of
transportation infrastructure. Road lengths and area was not available and data from other BC
jurisdictions was used to apportion the amount of the total built area from roads at 40%.
Sources
LCA data that identifies the embodied energy of paving materials was obtained from the Dr. Moore’s
previous ecological footprint assessment for Vancouver (Moore, 2013).
Challenges and Opportunities
The methodology to calculate built area is likely resulting in an overestimate for Powell River as its impact
is significantly higher then for other BC jurisdictions that have used the ecocity Footprint Tool.
Large portions of city surfaces are paved, yet their surface materials are not consistently, uniformly, or
currently listed and tracked across jurisdictions. As previously mentioned, paved or impermeable
surfaces represent a loss of important ecosystem services, represent a significant source of CO2, and
even reduce the esthetic qualities of an area.
Operating Energy [Transportation]
1. Road Transportation
Methodology
Private and Commercial Vehicles
Data requirements include Vehicle Kilometers Traveled (VKT), number of vehicles per class, average
mileage for each vehicle class, and emissions factors for each vehicle class.
ICBC registration data for 2016 and VKTs from Climate Action Powell River’s carbon calculator could not
be provided in time for this study. The latest data was 2010 CEEI data which was adjusted for population
change to estimate 2016 data.
Transit
Transit emissions were provided from personal communications with City staff.
Off road vehicles
Off-road vehicle fuel consumption was not available.
Sources
Private Vehicles
Data on private vehicles relied on the same 2010 data used in:
City of Powell River (2012). City of Powell River Community Energy and Emissions Plan. Retrieved from
https://powellriver.civicweb.net/document/2723

36
ecoCity Footprint: City of Powell River Summary Report
Challenges and Opportunities
All BC municipalities have difficulties collecting data on road transportation. Up-to-date ICBC data takes
time to access and VKT data is no longer being collected by the province. The carbon calculator being
hosted by Climate Action Powell River provides an opportunity to collect local VKT data for future studies.
2. Marine Transportation
Methodology
Marine transportation includes private vessels, passenger ferries, and cruise ship activities. Only limited
data from BC ferries was available. Ferry fuel efficiency was estimated using the 2016 B.C. Best Practices
Methodology for Quantifying Greenhouse Gas Emissions. The average fuel efficiency of Powell River’s
routes is likely much lower then this BC average since the smaller ships use more fuel per person and the
minor routes have a lower average loading. This means emissions from ferry travel are likely under
reported for this study. Total distances were calculated using the winter route numbers, assuming that
extra runs during the summer were attributable to tourism. The removal of runs for holidays or weather
and the addition of runs for predicted busy days were not accounted for. The ferry from Langdale to
Horseshoe Bay was included in the total distance data because most individuals exiting Powell River in
the southern direction take both ferries, rather than stopping in the Sechelt area. Emissions were
apportioned based on average loads on the Comox and Earls Cove routes adjusted for the City of Powell
River’s proportion of the regional population.
Sources
BC Ministry of Environment. (2016). 2016 B.C. BEST PRACTICES METHODOLOGY FOR QUANTIFYING
GREENHOUSE GAS EMISSIONS. Retrieved from
https://www2.gov.bc.ca/assets/gov/environment/climate-change/cng/methodology/2016-17-
pso-methodology.pdf
BC Ferries route and distance information retrieved from https://www.bcferries.com/
BC Ferry Services. (2017). Annual Report to the British Columbia Ferries Commissioner. Retrieved from
http://www.bcferrycommission.ca/wp-content/uploads/2017/08/2016-
2017_Annual_Report_to_the_BC_Ferry_Commissioner.pdf
Challenges and Opportunities
Marine emissions from other sources are difficult to find publicly, but these sources could be significant.
3. Air Travel
Methodology
Powell River has a local airport, but calculating emissions associated only with the Powell River airport
would grossly under-estimate residents’ total air travel. In addition to travelling out of the Powell River
airport, many residents regularly use other international airports such as YVR in Vancouver.
Therefore, air travel was estimated using average per-capita values for Metro Vancouver based on a
modified methodology described in A Greenhouse Gas Emissions Inventory and Ecological Footprint
Analysis of Metro Vancouver Residents’ Air Travel (Legg et al., 2013). These per-capita factors were
multiplied by Powell River’s population to estimate greenhouse gas emissions in addition to the
emissions from the Powell River airport. Emissions from Powell River airport were based on the average
37
ecoCity Footprint: City of Powell River Summary Report
number of flights per year at an approximate distance of a flight (120km) apportioned to the City of
Powell River’s proportion of the regional population.
For Metro Vancouver, air travel data was provided by the Vancouver International Airport (YVR)
organized by destination. The total number of inbound and outbound flights were sorted into four
categories:
1. International
2. International – United States
3. Domestic – Flights within Canada
4. Commuter – Flights within British Columbia
Seat Class
YVR provided the total number of seats per flight. Where available, a breakdown of seat classes was
provided. Using these numbers, average factors for seat class breakdowns were generated based off of
flight type (International, International – United States, and Domestic) and plane size (total seats). These
factors were then used to estimate the number of seats by class for flights that did not provide
disaggregated seat data.
Average Load Factor
Since YVR does not collect passenger numbers per flight, average flight load factors were applied to the
total number of seats per flight to estimate passenger movements. Based on YVR estimates, their
average load factor in 2015 was 82%. For reference, this load factor was compared to national averages
for major Canadian airlines listed as Level IA, which means the airline’s transported passenger revenues
were at least ten million. Air Canada’s 2015 load factor was 84%, and WestJet’s 2015 load factor was
80% (Statistics Canada, 2016).
Distance and Emission Calculation
The Great Circle Distance was used to estimate flight distances to and from each destination using the
World Airport Codes web tool. For cities with multiple airports that did not specify the specific airport,
the largest airport for the city was used. These flight distances were then multiplied by the number of
passengers by seat class per destination to estimate total passenger-kilometers by flight and seat
classification. Then, air emission factors based on flight distance and seat class from the United Kingdom
Department for Environment, Food & Rural Affairs (UK DEFRA) were applied to convert passenger-
kilometers to tCO2e (UK DEFRA, 2016).
Metro Vancouver Residential Scale Factor
Finally, a load factor of 0.20 was used to scale YVR’s total flights for Metro Vancouver Residents. YVR
demographic analysis from 2015 indicates that approximately 20% of flights are attributable to Metro
Vancouver residents (J. Aldcroft, Manager, Environment, YVR, personal communication, August 22,
2017). Total residential emissions were divided by Metro Vancouver’s population to generate per-capita
air emission averages, which are multiplied by Powell River’s population to estimate tCO2e associated
with air travel from YVR.

38
ecoCity Footprint: City of Powell River Summary Report
Sources
Legg, R., Moore, J., Kissinger, M., & Rees, W. (2013). A greenhouse gas emissions inventory and
ecological footprint analysis of Metro Vancouver residents’ air travel. Environment and
Pollution, 2(4). doi:10.5539/ep.v2n4p123
Statistics Canada. (n.d.). Table 401-0043: Operational statistics for major Canadian airlines, level IA, by
airline, monthly, CANSIM. Retrieved on October 14, 2017, from
http://www5.statcan.gc.ca/cansim/a47
UK DEFRA. (June 2016). Greenhouse gas reporting: Conversion factors 2016. Retrieved from
https://www.gov.uk/government/uploads/system/uploads/attachment_data/file/526958/ghg-
conversion-factors-2016update_MASTER_links_removed_v2.xls
Flight information for Powell River airport from https://www.pacificcoastal.com/
Fuel consumption of Beechcraft 1900 calculated using information from
https://www.globalair.com/aircraft-for-sale/Specifications?specid=282
Challenges and Opportunities
These estimates are limited by three main constraints.
YVR can only provide flight data to and from flights based off of their first destination. This overlooks air
emissions associated with connecting flights, which is represented in the final results. For example,
domestic flight emissions represent 32.4% of total air travel emissions, while international flights
(excluding to the United States) account for 39.8% of air travel emissions. A number of these domestic
flights are much more likely to be flights to Canadian cities connecting to international destinations, and
as such the second leg of air travel is not estimated.
Second, these estimates do not account for Powell River residents who may drive to and from other
airports (Seattle, WA, Victoria, BC, etc.) for outbound and inbound flights. With high volumes of air traffic
served by YVR, this may not represent a significant omission, but it does present an area for future
research and consideration.
Third, the introduction of the 82% average flight load factor and 20% scale for residential emissions
introduces scaling uncertainties into the last points of emission calculations.
Water
Evaluates the materials, embodied energy, operating energy, and built area impacts of the water purification
and distribution system relied on by the municipality.
Embodied Materials and Energy [Water]
Methodology
Other than some outdated pipe information, there was little structural information available. Water pipe
lengths were added together to get a rough estimate of the total network, but there was no information
on whether new pipes have been added. The water sources (lakes) have few structures associated with
water collection, and are accessed by dirt logging roads and trails.

39
ecoCity Footprint: City of Powell River Summary Report
The available data indicated that 90 percent of Powell River’s water was provided by Haslam Lake, which
is a completely gravity fed system (Dayton & Knight, 2006). Powell Lake uses three pumps and provides
the remainder of the community’s water (Dayton & Knight, 2006). The average daily consumption was
determined by adding average daily volumes consumed by the Haslam areas and the Powell Lake areas.
Powell River has had a small population drop since that time which was not accounted for.
The ecoCity Footprint Tool has built-in assumptions established from previous research (Moore, 2013)
that enables the calculation of the embodied energy of materials utilized in the water system
infrastructure.
Sources
Dayton & Knight Ltd. (2005). Water Network Model Upgrade. Retrieved from
https://powellriver.civicweb.net/document/378
Dayton & Knight Ltd. (2006). City of Powell River Drinking Water Protection Act Implementation.
Retrieved from
https://powellriver.civicweb.net/document/339/Drinking%20Water%20Protection%20Act%20I
mplementa.pdf?handle=91A96267FD97494CB0804C277E5B0158
Operating Energy [Water]
Methodology
The water system is mainly gravity fed, with a few hydraulic zones, and therefore does not use a lot of
energy (Dayton & Knight, 2006). Electricity data was provided by city staff through the 2017 City
Buildings Electricity Use.
Sources
Personal communication with City of Powell River staff
Built Area [Water]
Methodology
Area calculations for the watershed included roads (length and width), buildings, and dams; and
protected area and reservoir area. Built area was not estimated for Powell River as there are few known
structures associated with the water collection, and accessibility is through dirt logging roads and trails.
Sources
N.A.
IPPU and AFOLU
Industrial Products and Pollutants (IPPU) and Agricultural, Forest, and other Commercial land uses
(AFOLU) are important dimensions of a GPC compliant BASIC+ inventory. The ecological footprint and
CBEI output however, does not include these sources, as energy use and emissions from these sectors
are already captured in the evaluation of consumables and waste.

40
ecoCity Footprint: City of Powell River Summary Report
i WWF (World Wide Fund for Nature). (2014). Living Planet Report. Gland Switzerland: World Wide Fund for Nature. Retrieved from: http://wwf.panda.org/about_our_earth/all_publications/living_planet_report/ (accessed on 12 November, 2015). ii Rockström, J., et.al. (2009). Planetary boundaries: exploring the safe operating space for humanity. Ecology and Society, 14(2): 32. Retrieved from: http://www.ecologyandsociety.org/vol14/iss2/art32/ (accessed on 5 October 2015). iii Wackernagel, M. and W. Rees. (1996). Our Ecological Footprint: Reducing Human Impact on the Earth. Gabriola Island BC: New Society Publishers. Retrieved from: http://cdn1.footprintnetwork.org/Living_Planet_Report_2014_summary.pdf (accessed on 26 October 2015). iv WWF (World Wide Fund for Nature). (2014). Living Planet Report. Gland Switzerland: World Wide Fund for Nature. Retrieved from: http://wwf.panda.org/about_our_earth/all_publications/living_planet_report/ (accessed on 12 November, 2015). v The Weather Network (2018). Statistics: Powell River, B.C. Retrieved August 2018, from https://www.theweathernetwork.com/ca/api/sitewrapper/index?b=%2Fstatistics%2F&p=%2Fforecasts%2Fstatistics%2Findex&url=%2Fstatistics%2Fcabc0233%2Fpowell-river%2F%2F%2F%3F vi Lions Gate Consulting (2015). Powell River Economic Development Strategy. Retrieved from https://powellriver.civicweb.net/document/33198 vii Brindle, D. (August 26, 2018). Powell River accepts offer to develop aviation industry. Coast Reporter. Retrieved from https://www.coastreporter.net/news/local-news/powell-river-accepts-offer-to-develop-aviation-industry-1.23410359 viii City of Powell River (2010). A Sustainability Charter for the Powell River Region. Retrieved from https://powellriver.civicweb.net/document/2720 ix City of Powell River (2012). City of Powell River Community Energy and Emissions Plan. Retrieved from https://powellriver.civicweb.net/document/2723 x City of Powell River (2014). Powell River Sustainable Official Community Plan. Retrieved from https://powellriver.civicweb.net/document/15309 xi City of Powell River (2015). Powell River Integrated Community Sustainability Plan. Retrieved from https://powellriver.civicweb.net/document/32785