
CITY OF NORTH MYRTLE BEACH OCEAN OUTFALL...
48
December 8, 2016 CITY OF NORTH MYRTLE BEACH OCEAN OUTFALL PROGRAM Reduction of Pollutant Load as a Stormwater Management Option Strategies and Tools to Protect and Restore Coastal Water Quality Kevin D. Blayton, PE City Engineer - Public Works Director
Transcript of CITY OF NORTH MYRTLE BEACH OCEAN OUTFALL...
December 8, 2016
CITY OF NORTH MYRTLE BEACH OCEAN OUTFALL PROGRAM
Reduction of Pollutant Load as a Stormwater Management Option
Strategies and Tools to Protect and Restore Coastal Water Quality
CITY OF NORTH MYRTLE BEACH
Kevin D. Blayton, PE
City Engineer - Public Works Director
Main Street Design/Permitting
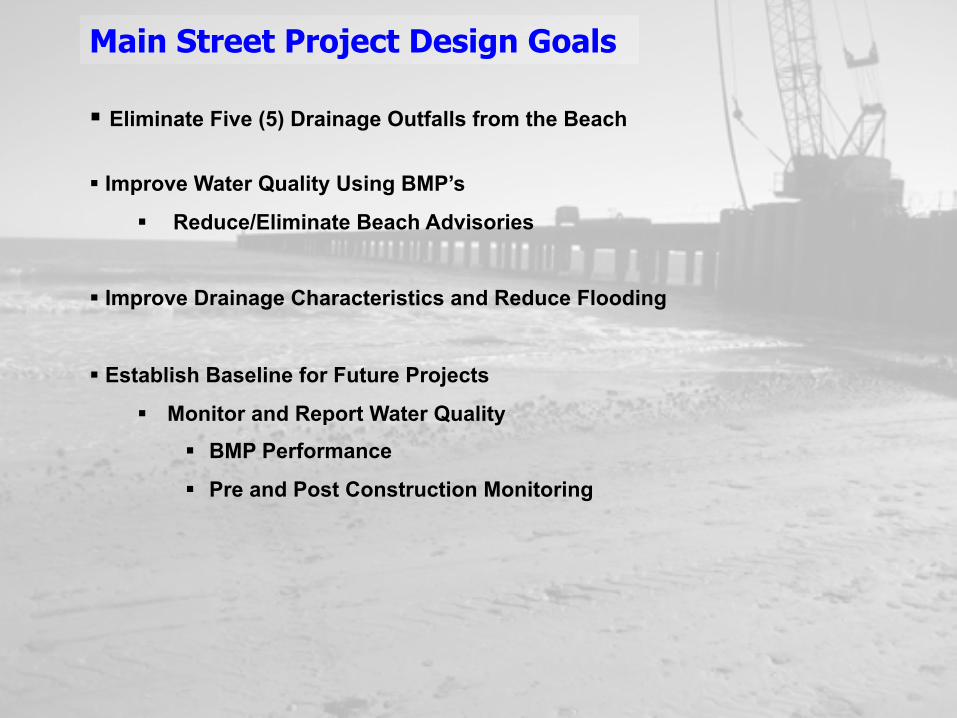
!! Eliminate Five (5) Drainage Outfalls from the Beach
!! Improve Water Quality Using BMP’s
!! Reduce/Eliminate Beach Advisories
!! Improve Drainage Characteristics and Reduce Flooding
!! Establish Baseline for Future Projects
!! Monitor and Report Water Quality
!! BMP Performance
!! Pre and Post Construction Monitoring
Main Street Project Design Goals

Main Street Basin Characteristics
!! 100± Acre Drainage Basin - Combination of five (5) Drainage Basins into one (1)
!! Highly Impervious (70%)
!! Flooding between 2 and 10-Year Storm Events
!! Existing Topography (from elevation 25.0’ – 7.0’)
!! All Stormwater Ultimately Outfalls to the Beach
!! Poor Water Quality
!! Beach Advisories (after certain rainfall events)

Existing 6th Ave. South Outfall 72”
3rd Ave. South
2rd Ave. South
1st Ave. South Proposed Outfall
2nd Ave. North Beach Outfall
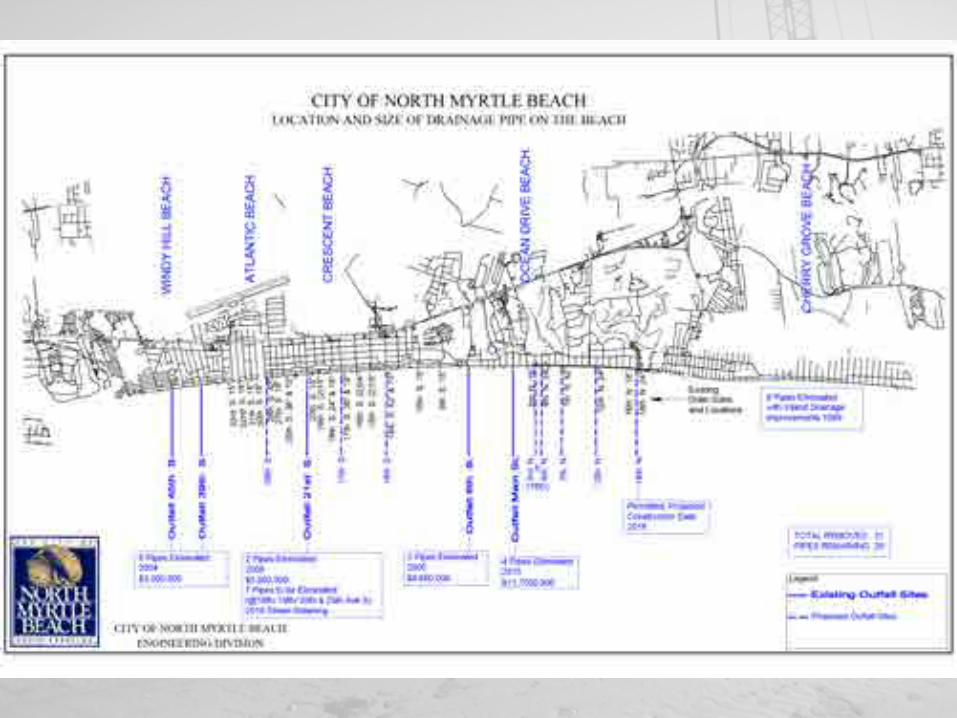
Drainage Basin Map
Existing Beach Outfalls
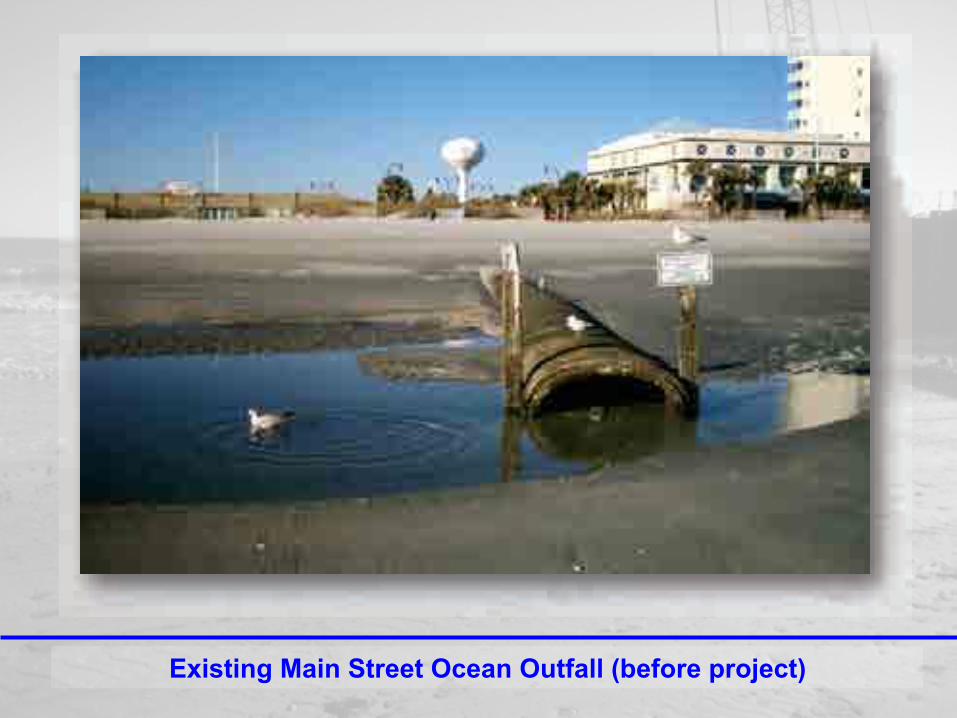
Existing Main Street Ocean Outfall (before project)

Existing Water Quality Issues
!! 70% or Greater of Drainage Basin is Impervious Area -! Pavement, Roads / Parking Lots -! Roof Tops -! Coquina Parking Lots
!! Limited Available/Existing BMP’s
- Older Developments Prior Stormwater Regulations
!! Debris, Floatables, and Sediment Oils/Greases - Sand -! Plastics -! Cigarette Butts, Etc.
!! Beach Advisories !! Public Health Impacts
!! Community Business Impacts
!! Beach Erosion

Landside
Overall Project
Off-Shore Side
Outfall Plan View
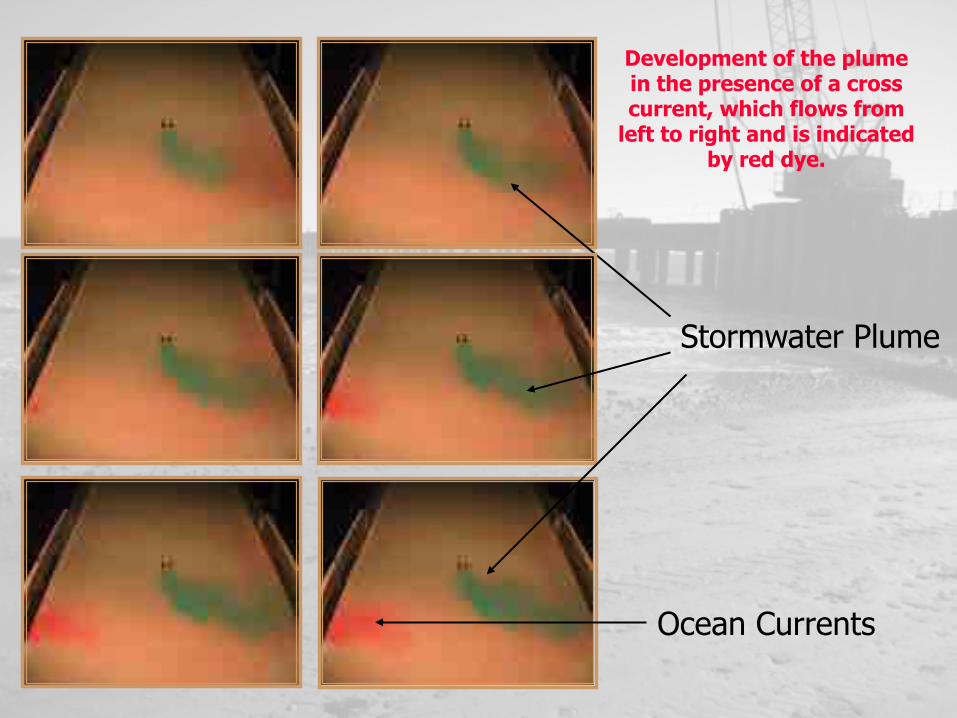
Development of the plume in the presence of a cross current, which flows from
left to right and is indicated by red dye.
Stormwater Plume
Ocean Currents
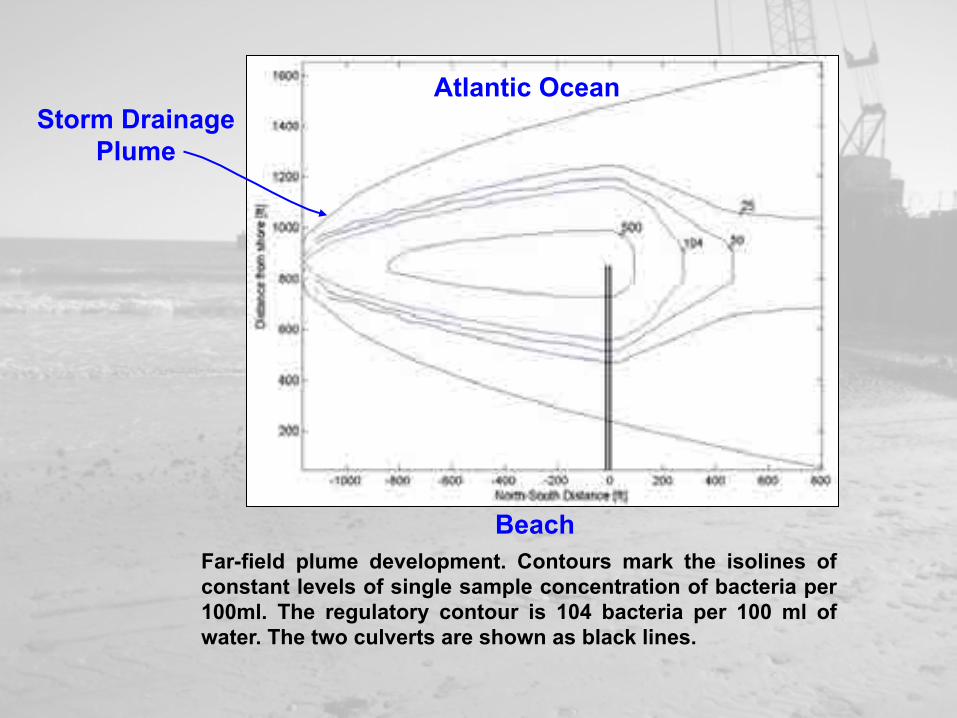
Far-field plume development. Contours mark the isolines of constant levels of single sample concentration of bacteria per 100ml. The regulatory contour is 104 bacteria per 100 ml of water. The two culverts are shown as black lines.
Storm Drainage Plume
Beach
Atlantic Ocean
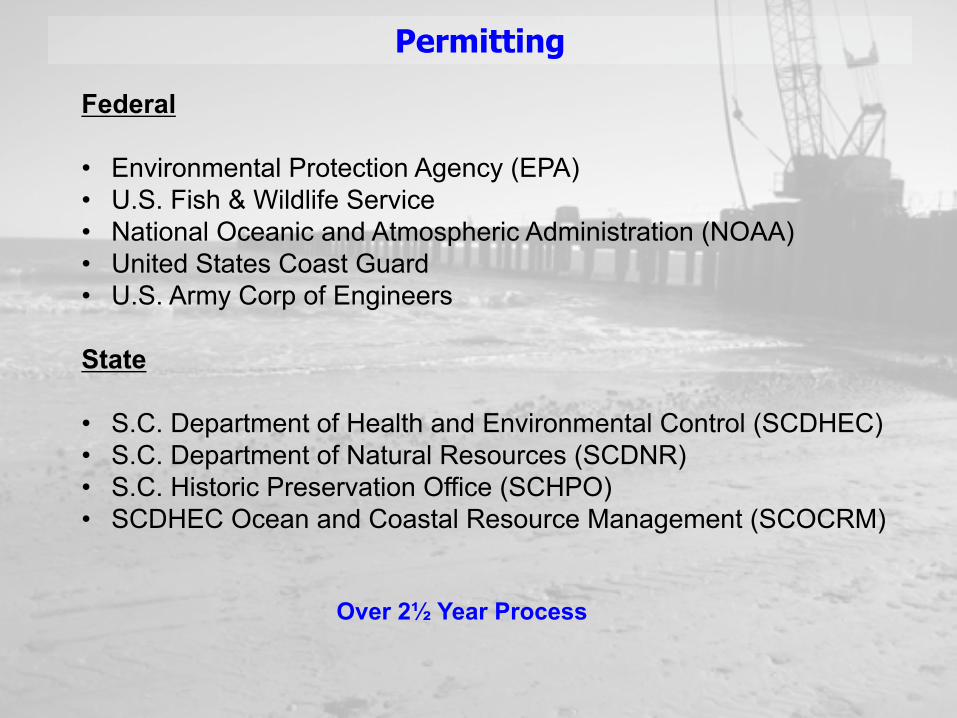
Permitting
Federal •! Environmental Protection Agency (EPA) •! U.S. Fish & Wildlife Service •! National Oceanic and Atmospheric Administration (NOAA) •! United States Coast Guard •! U.S. Army Corp of Engineers
State •! S.C. Department of Health and Environmental Control (SCDHEC) •! S.C. Department of Natural Resources (SCDNR) •! S.C. Historic Preservation Office (SCHPO) •! SCDHEC Ocean and Coastal Resource Management (SCOCRM)
Over 2! Year Process
BMP Selection
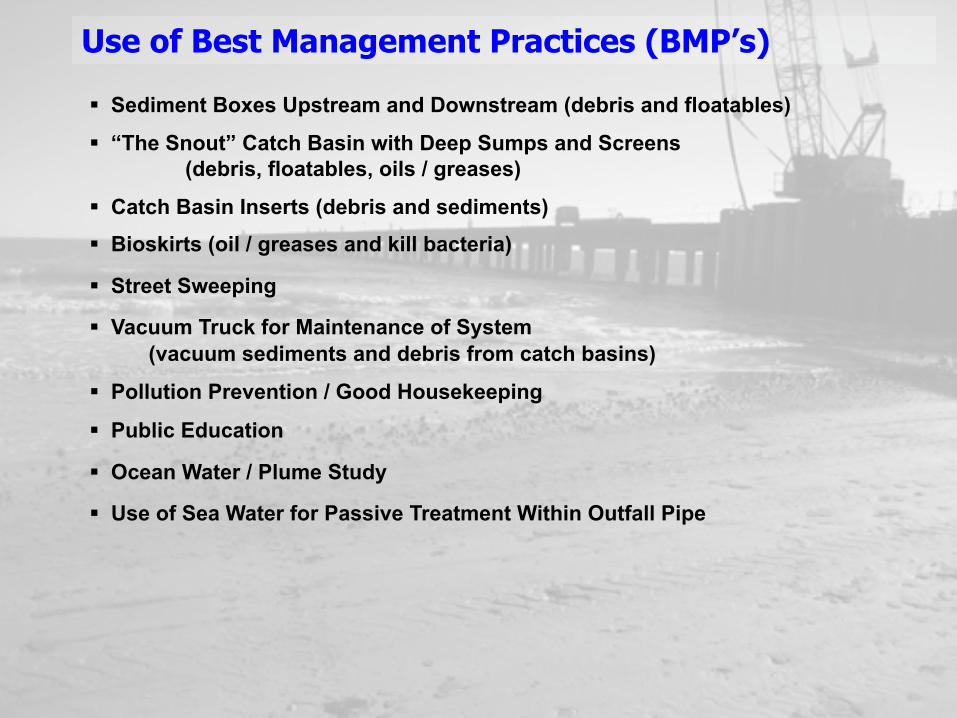
Use of Best Management Practices (BMP’s)
!! Sediment Boxes Upstream and Downstream (debris and floatables)
!! “The Snout” Catch Basin with Deep Sumps and Screens (debris, floatables, oils / greases)
!! Catch Basin Inserts (debris and sediments)
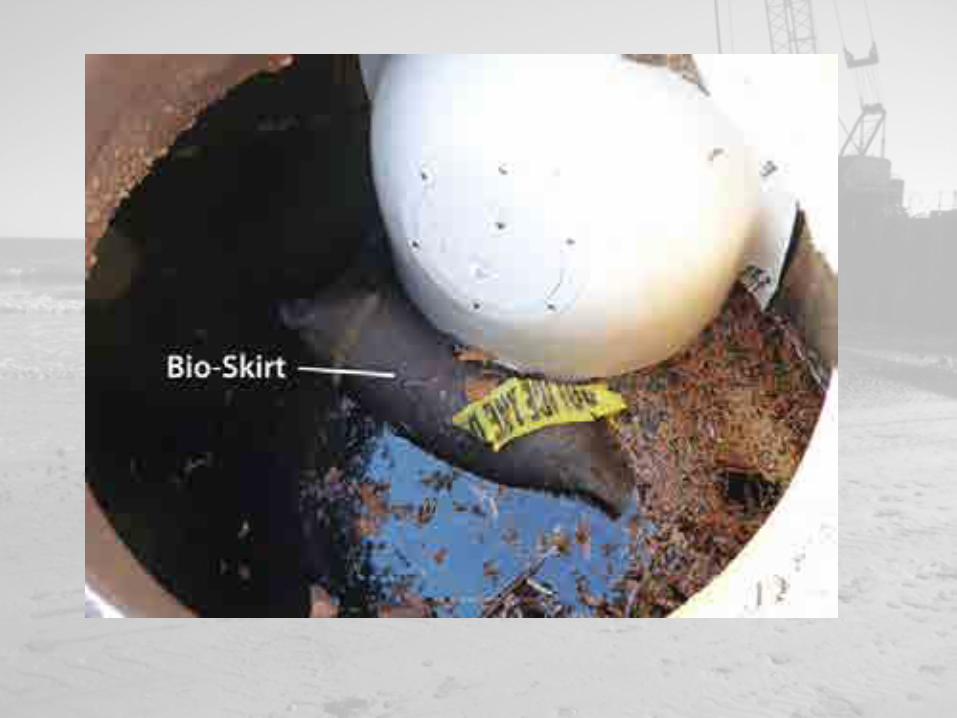
!! Bioskirts (oil / greases and kill bacteria)
!! Street Sweeping
!! Vacuum Truck for Maintenance of System (vacuum sediments and debris from catch basins)
!! Pollution Prevention / Good Housekeeping
!! Public Education
!! Ocean Water / Plume Study
!! Use of Sea Water for Passive Treatment Within Outfall Pipe

Land Side
Structure #1
Structure #2 & 2A Structure #3
Structure #8
Structure #6 Structure #9 Structure #5
Main Street (Street-End)
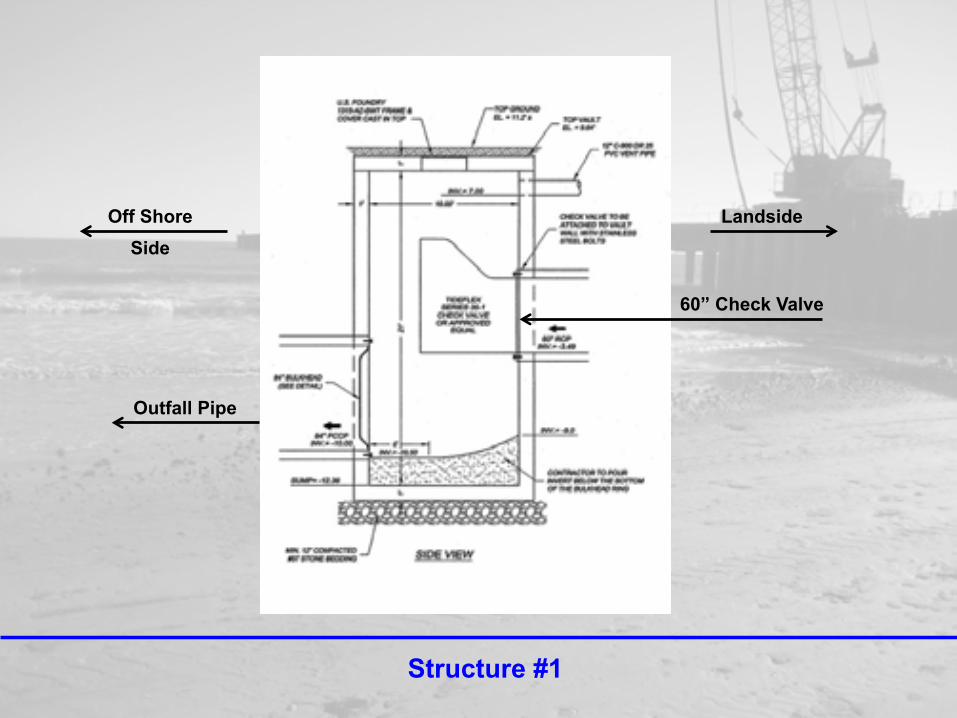
Structure #1
60” Check Valve
Outfall Pipe
Off Shore Landside Side
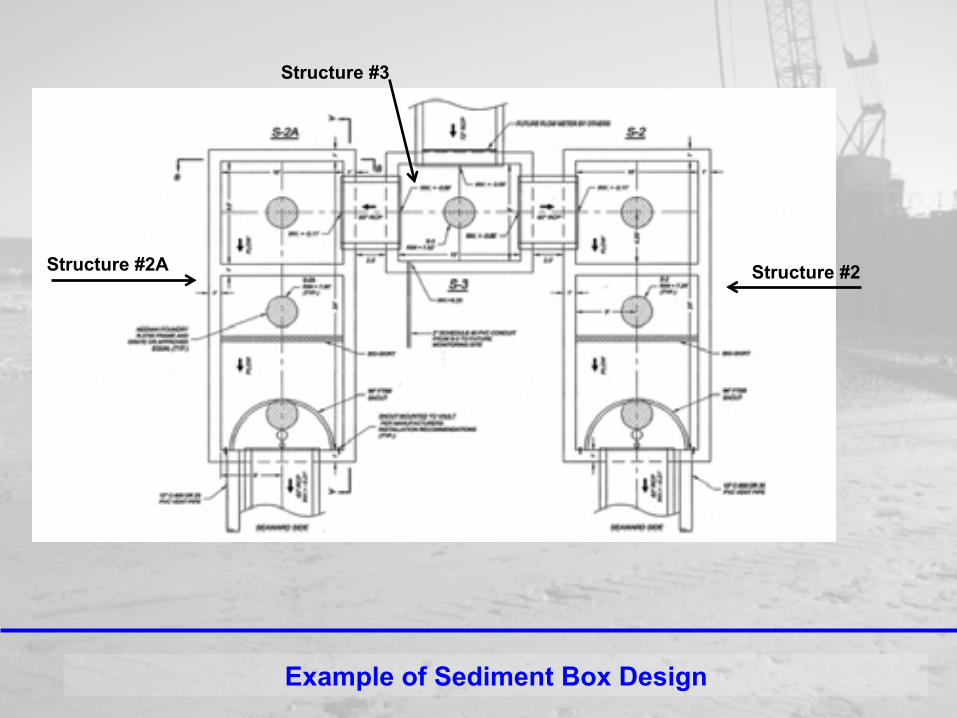
Example of Sediment Box Design
Structure #2A
Structure #3
Structure #2
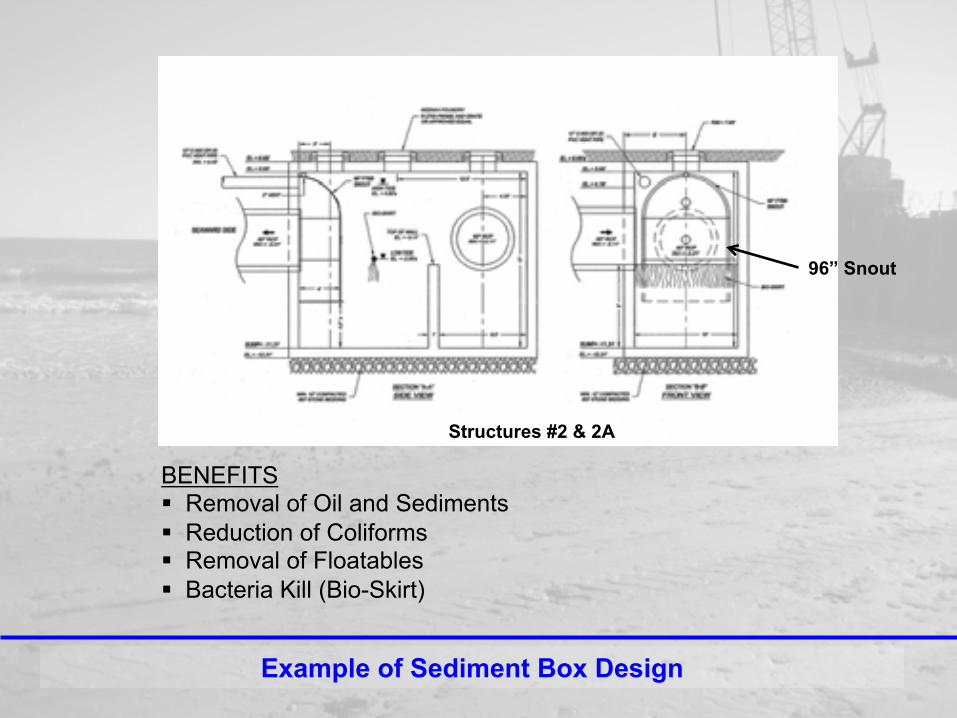
Example of Sediment Box Design
BENEFITS !! Removal of Oil and Sediments !! Reduction of Coliforms !! Removal of Floatables !! Bacteria Kill (Bio-Skirt)
96” Snout
Structures #2 & 2A
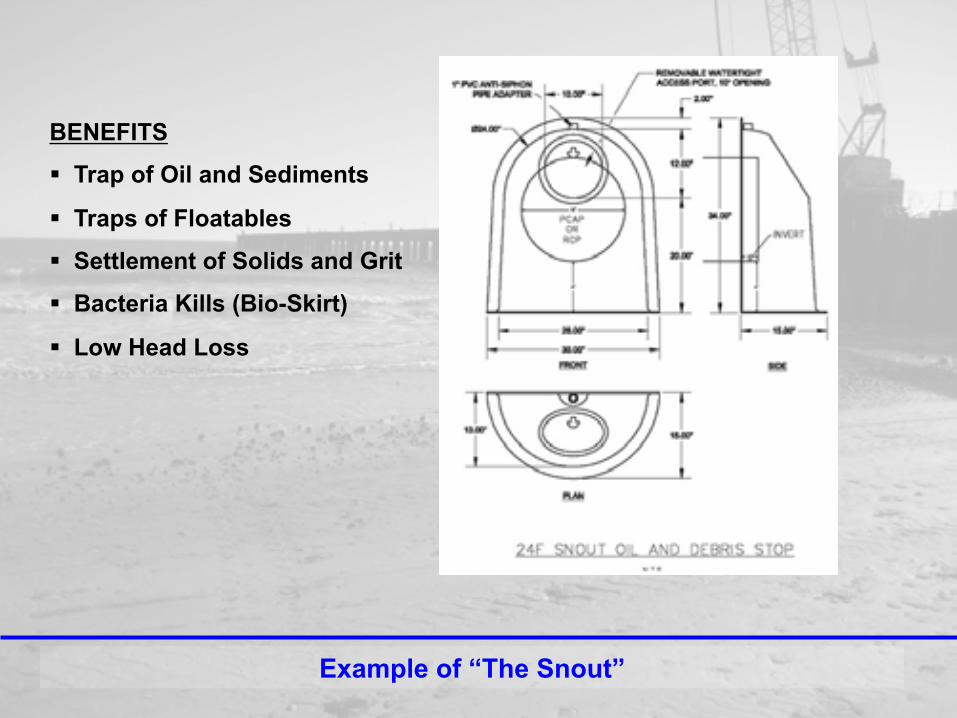
Example of “The Snout”
BENEFITS
!! Trap of Oil and Sediments
!! Traps of Floatables
!! Settlement of Solids and Grit
!! Bacteria Kills (Bio-Skirt)
!! Low Head Loss


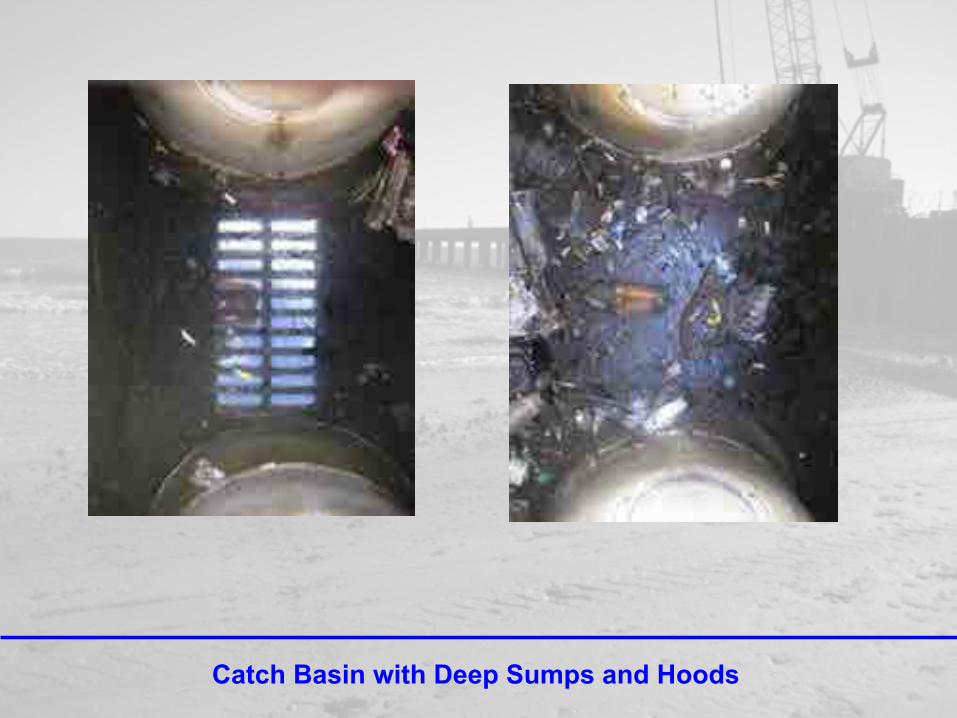
Catch Basin with Deep Sumps and Hoods
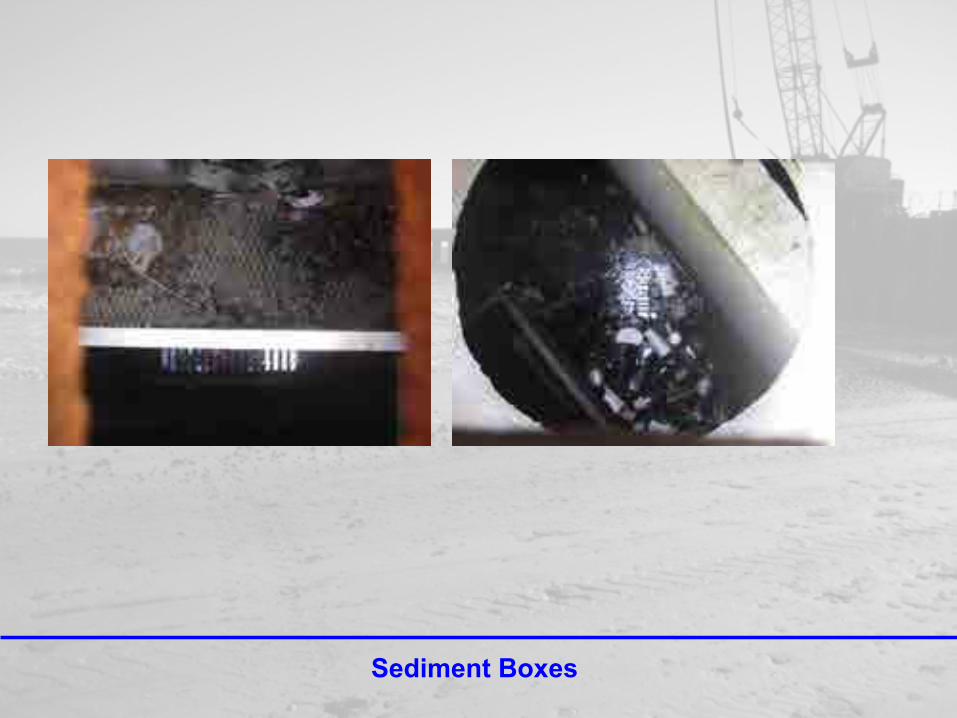
Sediment Boxes
WQ Sampling Protocol
Dr.SusanLibesDirector,WaccamawWatershedAcademyProfessorofMarineScienceandChemistry
Burroughs&ChapinCenterforMarine&WetlandStudies
CoastalCarolinaUniversity
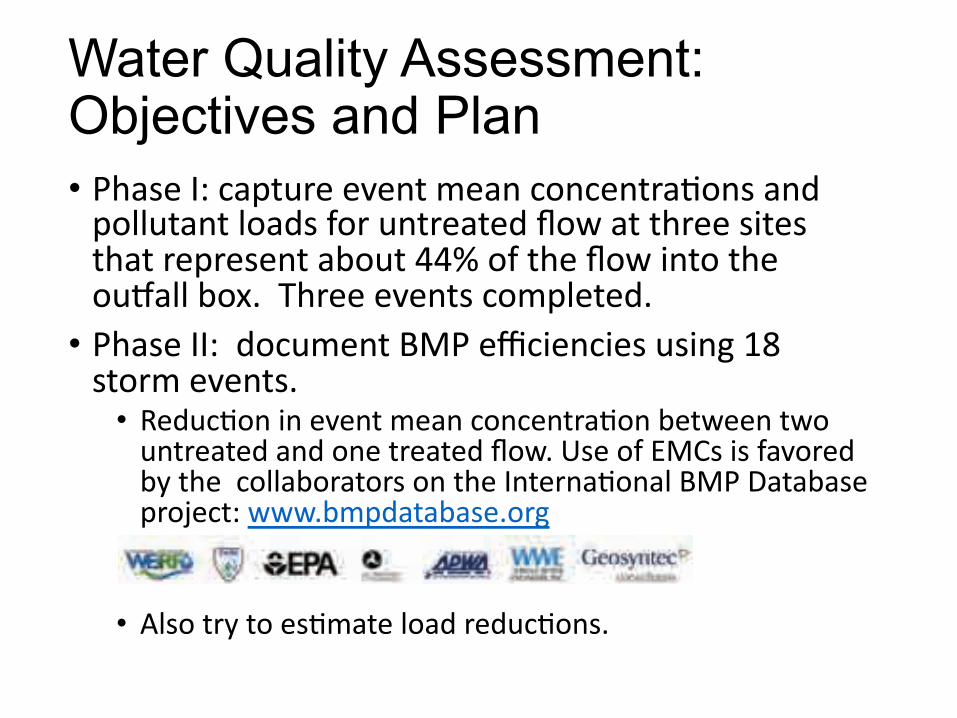
Water Quality Assessment: Objectives and Plan •!!"#$%&'(&)#*+,-%&%.%/+&0%#/&)1/)%/+-#21/$&#/3&*144,+#/+&41#3$&51-&,/+-%#+%3&617&#+&+"-%%&$8+%$&+"#+&-%*-%$%/+[,+&::;&15&+"%&617&8/+1&+"%&1,<#44&91=>&&?"-%%&%.%/+$&)10*4%+%3>&
•!!"#$%&''(&&31),0%/+&@A!&%B)8%/)8%$&,$8/C&DE&$+1-0&%.%/+$>&
•! F%3,)21/&8/&%.%/+&0%#/&)1/)%/+-#21/&9%+7%%/&+71&,/+-%#+%3&#/3&1/%&+-%#+%3&617>&G$%&15&HAI$&8$&5#.1-%3&9J&+"%&&)144#91-#+1-$&1/&+"%&'/+%-/#21/#4&@A!&K#+#9#$%&*-1L%)+(&777>90*3#+#9#$%>1-C&&
&&
•! M4$1&+-J&+1&%$20#+%&41#3&-%3,)21/$>&
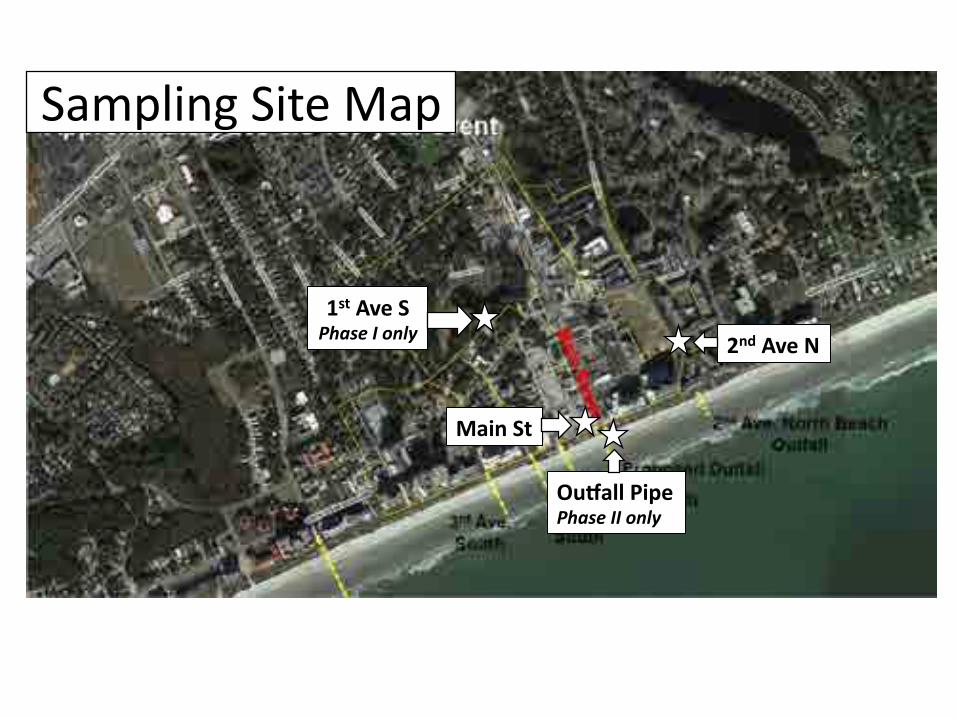
SamplingSiteMap
1stAveSPhaseIonly
MainSt
OuFallPipePhaseIIonly
2ndAveN
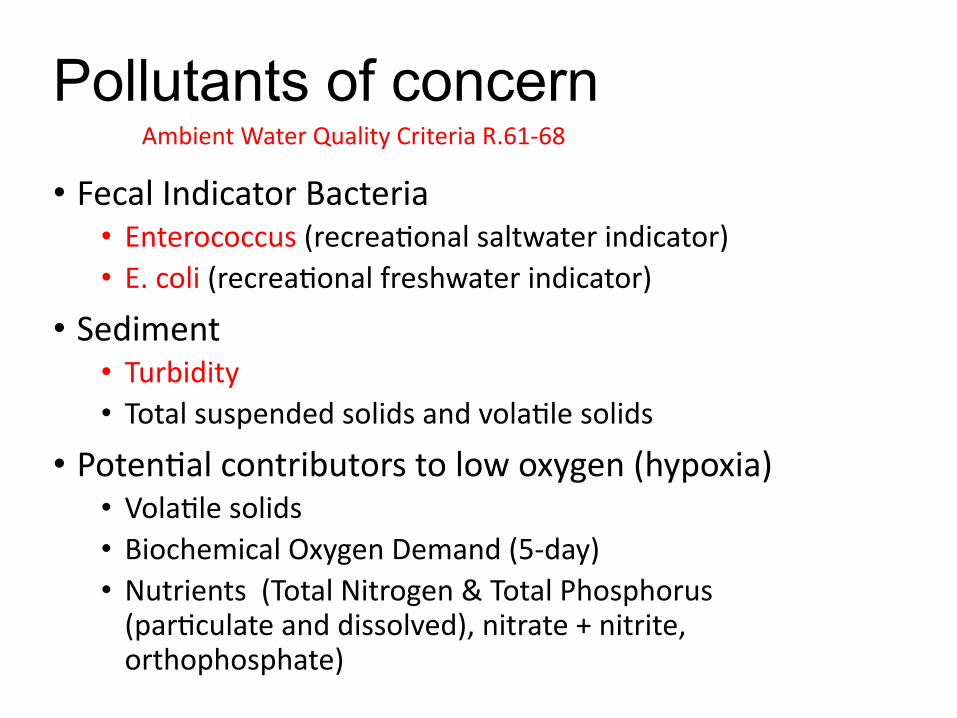
Pollutants of concern
• FecalIndicatorBacteria• Enterococcus(recrea2onalsaltwaterindicator)• E.coli(recrea2onalfreshwaterindicator)
• Sediment• Turbidity• Totalsuspendedsolidsandvola2lesolids
• Poten2alcontributorstolowoxygen(hypoxia)• Vola2lesolids• BiochemicalOxygenDemand(5-day)• Nutrients(TotalNitrogen&TotalPhosphorus(par2culateanddissolved),nitrate+nitrite,orthophosphate)
AmbientWaterQualityCriteriaR.61-68

In-situmeasurements• Measuredinone-minuteintervals• Parameters:
• Waterlevel• Watervelocity• Waterdischarge• Temperature• Conduc2vity• Dissolvedoxygen
Equipment deployment
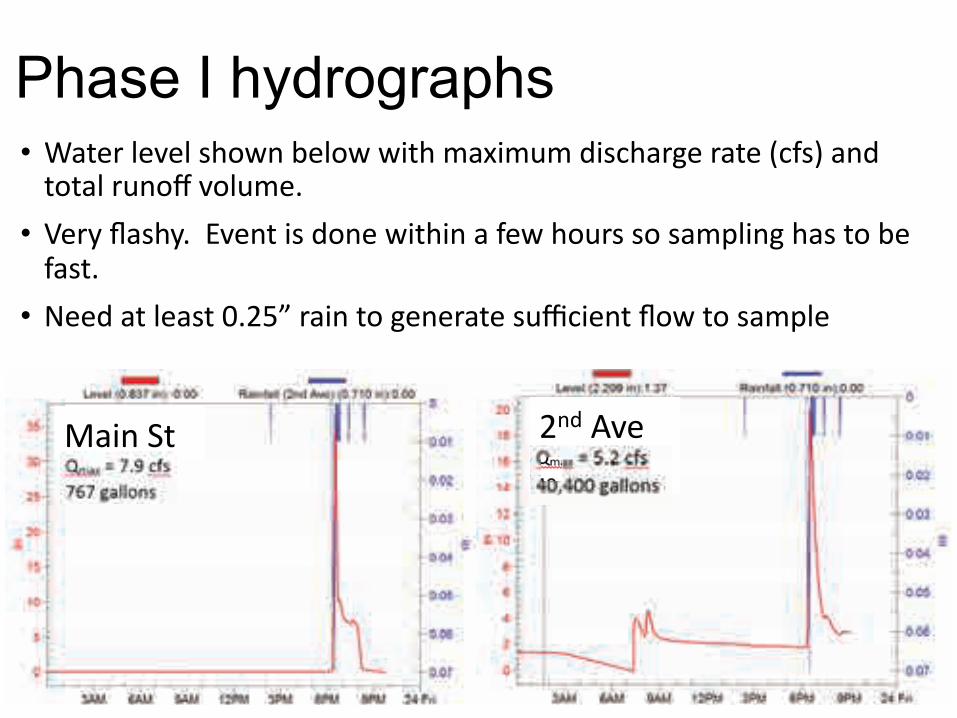
Phase I hydrographs •!Z#+%-&4%.%4&$"17/&9%417&78+"&0#=80,0&38$)"#-C%&-#+%&P)5$Q&#/3&+1+#4&-,/1]&.14,0%>&&
•! R%-J&6#$"J>&&H.%/+&8$&31/%&78+"8/&#&5%7&"1,-$&$1&$#0*48/C&"#$&+1&9%&5#$+>&
•! V%%3&#+&4%#$+&^>_T`&-#8/&+1&C%/%-#+%&$,B)8%/+&617&+1&$#0*4%&
A#8/&N+& _/3&M.%&V&V&

Pollutant behavior in untreated flows NSQD=EPA’sNa,onalStormwaterQualityDatabase
• Fecalbacteria:consistentlycontravenewaterqualitycriteria,especiallyatMainStreet.AllE.coliaboveNSQDmedian.
• Totalsuspendedsolids:maximumloadsof30to35lbsperevent.Concentra2onsaboveNSQDmedianatMainStreet.
• VolaLlesolids:30to100%ofTSS,averaging50%=>organicrich!• BOD:mostly>5mg/Lwithmaxof25mg/L.AboveNSQDmedianatMainStreet.
• Nutrients:20%ofnitrogenand40to60%ofphosphorusispar2culateandshouldbesehable.LevelsgenerallyaboveUSEPAeutrophica2oncriteria.TPandOrthophosphateaboveNSQDmedian.
• Onesitewasapondthathadnoou<lowduringPhaseI.Elevatedbacteriaandnutrients.PerfectBMP!

Outfall pipe results • SensorshavebeeninplacesinceDec2015withsomeinterrup2onsforcomple2onofoverlandconstruc2on.
• Preliminaryobserva2ons• “Tidal”behaviorwhichcomplicatesloadreduc2onassessments• Resultedinsomeupstreamflowadjustments
• Currentconfigura2on• Maximumvelocity=2.8j/s• “Tidal”range=10to15inches• Conduc2vityissimilartountreatedflows,butshowssomebriefincreasesonthestartoftheebb2dethatmightbebackflow.
• Oxygenlevelsareverylowpriortoini2a2onofflows.
0.00
0.05
0.10
0.15
0.20
0.25
0.30-10
0
10
20
30
40
50
60
1:12
6:00
10:48
15:36
20:24
1:12
6:00
10:48
15:36
WaterLevel(in)
Velocityx10(X/s)
Rainfall(in)
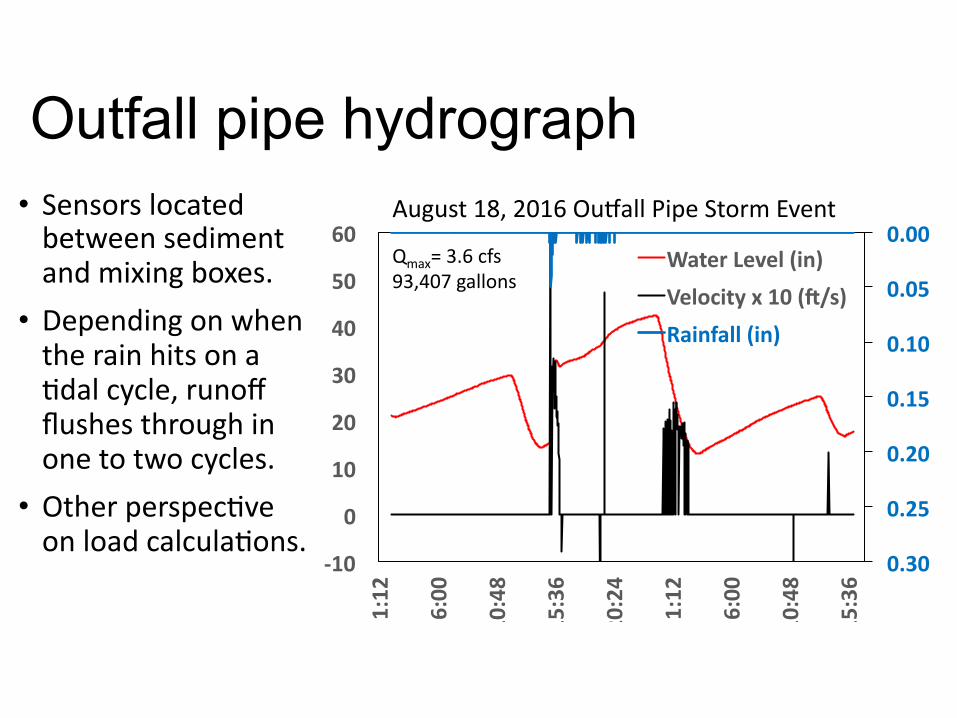
Outfall pipe hydrograph • Sensorslocatedbetweensedimentandmixingboxes.
• Dependingonwhentherainhitsona2dalcycle,runoffflushesthroughinonetotwocycles.
• Otherperspec2veonloadcalcula2ons.
August18,2016Ou<allPipeStormEvent
Qmax=3.6cfs93,407gallons

Current status •! V17&1/&$+#/39J&+1&)#*+,-%&a,#485J8/C&-#8/&%.%/+$>&
•! !,44%3&#/3&-%*4#)%3&C%#-&8/&S)+19%-&+1&#))10013#+%&n,--8)#/%&A#h"%7>&
•! @%417U0%38#/&*-%)8*8+#21/&*-%38)+%3&51-&+"8$&78/+%-&3,%&+1&g#&V8o#&)1/3821/$>&
•! H=*%)+%3&+1&9%&$"1-+&48.%3p&
n,--8)#/%&q1#a,8/&S)+19%-&_^DT&

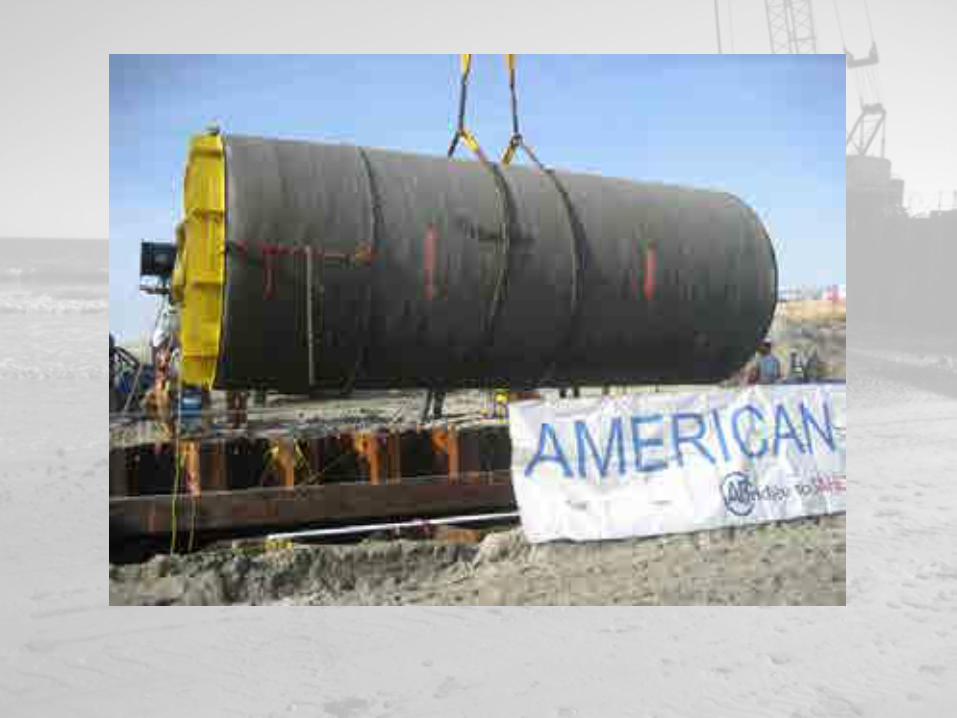
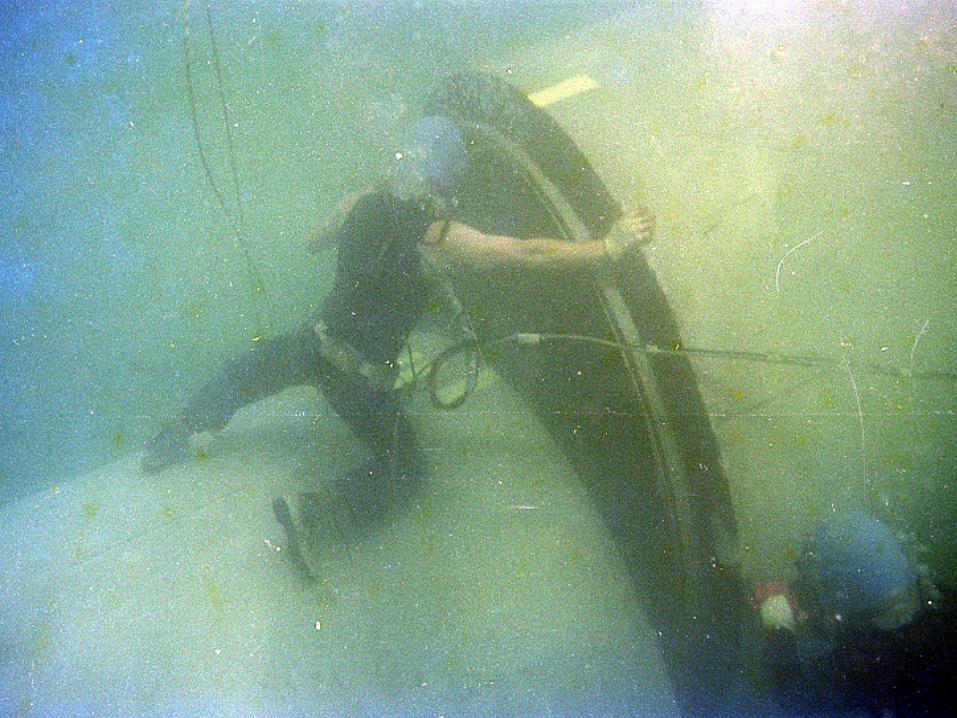
Construction
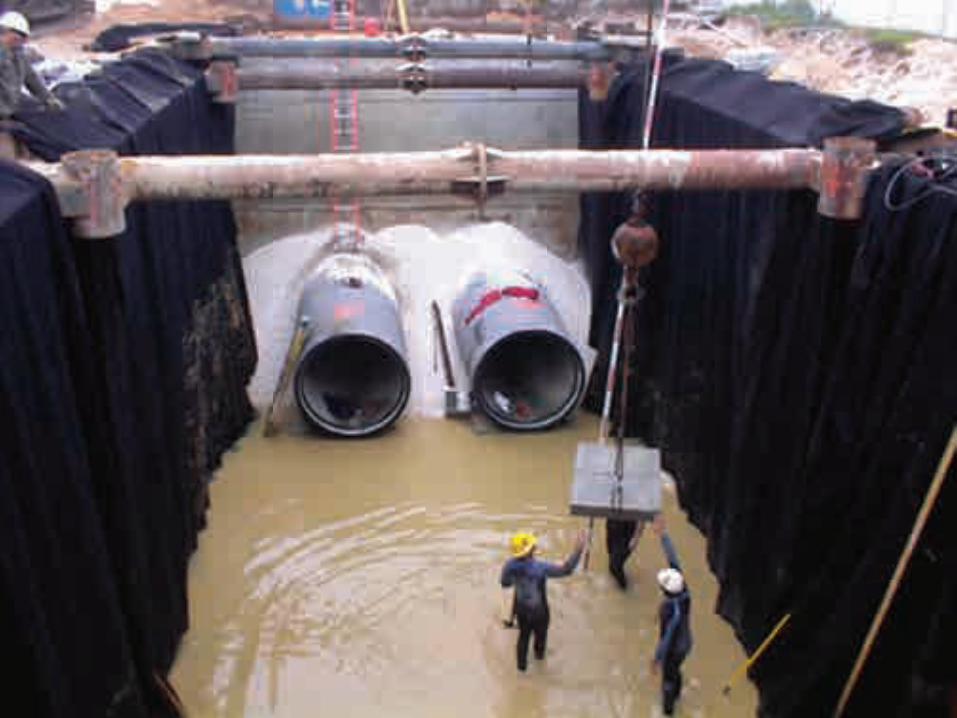

INSTALLED SMALLER SNOUT WITH BIO-SKIRT
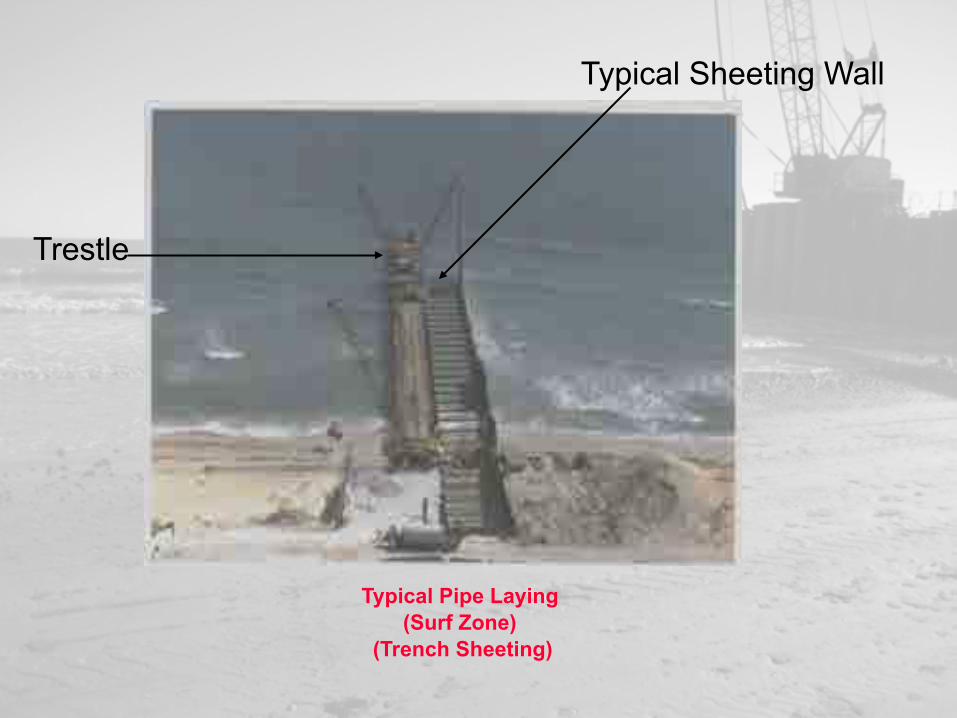
Typical Pipe Laying (Surf Zone)
(Trench Sheeting)
Trestle
Typical Sheeting Wall
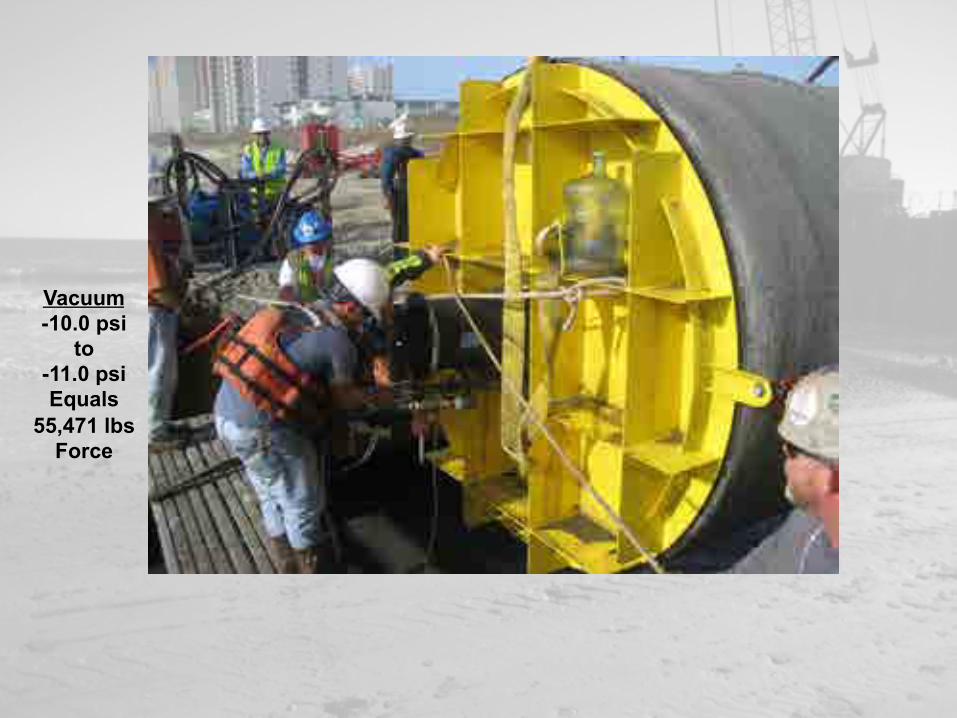
Vacuum -10.0 psi
to -11.0 psi Equals
55,471 lbs Force


Sleepers
Pipe
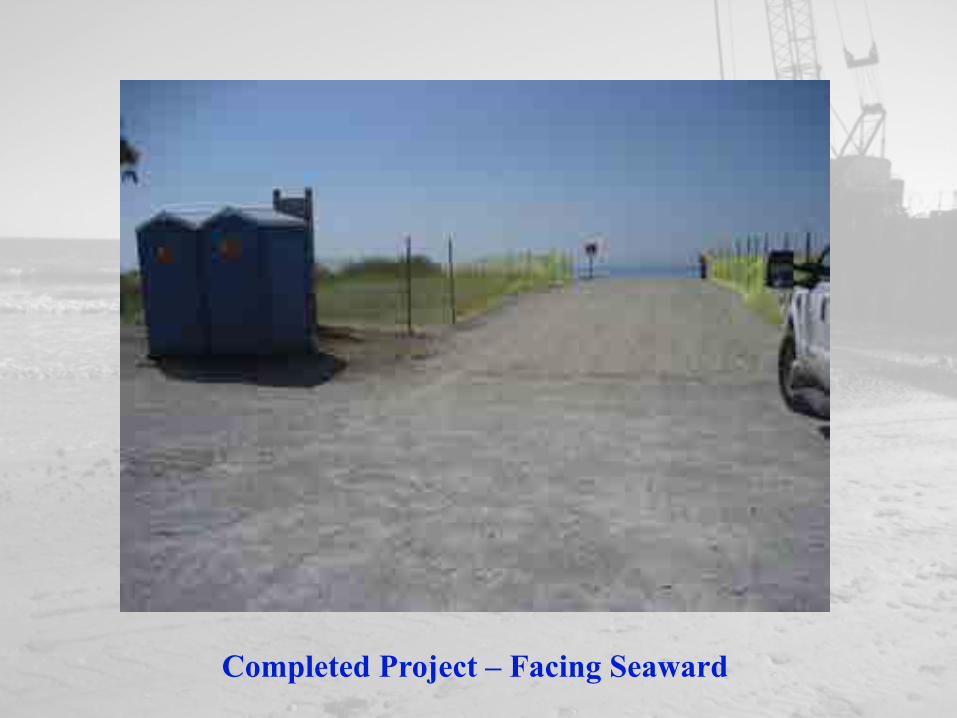
Completed Project – Facing Seaward

Completed Project – Facing Landward
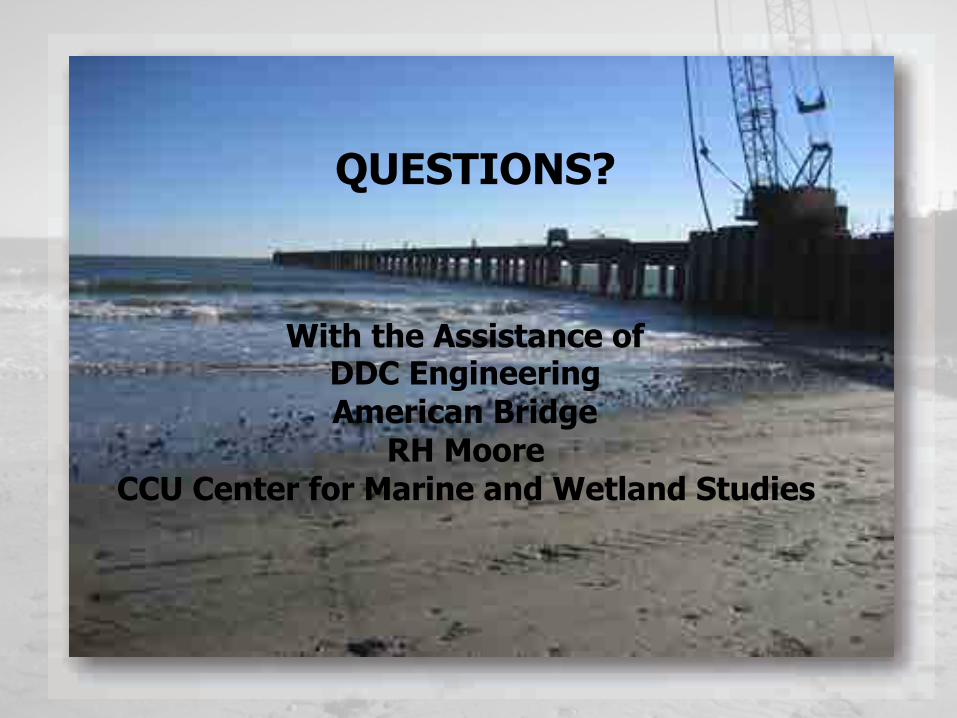
QUESTIONS?
With the Assistance of DDC Engineering American Bridge
RH Moore CCU Center for Marine and Wetland Studies


![Chapter 3 Design of Ocean Wastewater Outfall Systemsocw.snu.ac.kr/sites/default/files/NOTE/7429.pdf · Ch 3. Design of Ocean Wastewater Discharge System 3−19 [Example 3.2] Estimate](https://static.fdocuments.net/doc/165x107/5f69370b113d6c3fb5156a52/chapter-3-design-of-ocean-wastewater-outfall-ch-3-design-of-ocean-wastewater-discharge.jpg)