Miami-Water and Sewer Department · Miami-Water and Sewer Department Ocean Outfall Legislation...
18
Miami-Water and Sewer Department Ocean Outfall Legislation Draft Plan June 5, 2013
-
Upload
truongdiep -
Category
Documents
-
view
212 -
download
0
Transcript of Miami-Water and Sewer Department · Miami-Water and Sewer Department Ocean Outfall Legislation...

Miami-Water and Sewer Department
Ocean Outfall Legislation Draft Plan
June 5, 2013

2008 Ocean Outfall Legislation
• By July 1, 2013, submit implementation plan to Florida Department of Environmental Protection (FDEP)
• Reduce nutrient loading to the ocean• Reduce nutrient loading to the ocean
�Meet Advance Wastewater Treatment (AWT) by Dec 31, 2018, or
�Reduce cumulative outfall loadings (from 2008-2025) equivalent to AWT from 2018-2025
• December 31, 2025, stop using outfall and implement 60% reuse
2013 Legislation Amendment
On April 24, 2013, the Governor signed amendment to the law including:
• Allowing use of outfall after 2025, as back-up for wet weather flows (up to 5% of baseline flow)flow)
• Giving credit for reuse at other facilities
�MDWASD/FPL 90 MGD reuse project
• By July 1, 2016 submit update of plan documenting any refinements in:�Costs
�Actions
�Financing

July 1, 2013 Plan
• Technical, environmental, and economic feasibility of reuse
• Land acquisition
• Facilities necessary to provide for • Facilities necessary to provide for reuse of the domestic wastewater & costs to meet the requirements (treatment levels...)
• Cost comparison
• Financing plan
• Detailed schedule

South West
Wellfield
West
Wellfield & Wellfield
Snapper Creek
Wellfield
& Wellfields
Miami Springs
Wellfields
Northwest
Wellfield
MDWASDTreatment
& Wellfield
& Wellfield
& Wellfield
& Wellfield
& Wellfield
Wellfields
Facilities

Existing Outfall Facilities
Wastewater
Treatment Plant (WWTP)
Current
Rated Capacity
(mgd)
Baseline
Flow (1)
(mgd)
North District 120 81.0
Central District 143 114.8
Total 263 195.8
(1) Baseline flow is the average from 2003 to 2007
mgd = million gallons per day

Planning Criteria
• Projected demands to year 2035
� Including conservation
• Peak flows meeting EPA criteria
• 60% reuse
• Remaining flows disposed to the Boulder Zone thru deep injections wells or outfall backup
• All new flow diversion from outfall will meet High Level Disinfection (HLD) level of treatment

Planning Criteria (Cont.)
• Reduction of flows at existing North and Central WWTPs require new infrastructure to reverse flows in collection system (east to west)
• Land acquisition for proposed West District • Land acquisition for proposed West District WWTP and transmission system included in costs
• 50-yr life for new treatment facilities
• Climate change impacts
�Sea Level Rise (3 ft by 2075)
�Storm Surge

Reuse Feasibility Evaluations
• 60% of baseline flow = 117.5 mgd� Already committed to 90 mgd for FPL cooling
� Need to address feasibility of 27.5 mgd
• Considered options in 2007 Reuse Feasibility Study� Public access reuse� Public access reuse
� Aquifer recharge
� Wetlands rehydration
� Industrial
• Based on cost and feasibility of implementation Floridan aquifer (FA) recharge proposed
• Reuse not needed to meet water supply prior to 2035
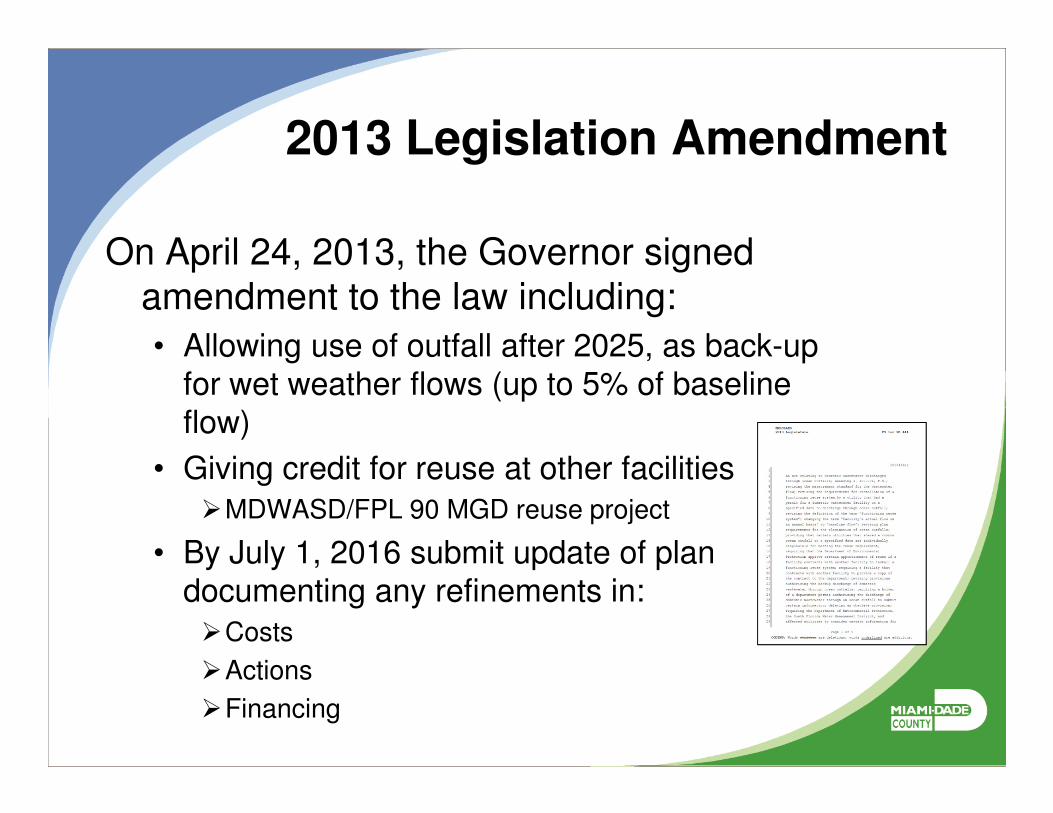
Nutrient Reduction Implementation
• December 2008, started using injections wells at NDWWTP to remove flow from outfall (reducing loadings)
• Total cumulative loading reduction as of 2012:• Total cumulative loading reduction as of 2012:
• At CDWWTP, planning installation of injection well to remove nutrients from dewatering, instead of sending back to head of plant
(operational by Dec 2015)
Nutrient Cumulative Target (lbs) Actual (lbs)
TN 59,874,077 6,954,437
TP 1,661,217 548,777

Alternative A-1
• All flows to existing WWTPs
• Reuse to FPL from
WWTP Design Flow (mgd)
Avg Peak
ND 120 372• Reuse to FPL from SDWWTP
• FA recharge at CDWWTP & SDWWTP
• Total cost $4.00 Billion
ND 120 372
CD 150 496
SD 131 312
WD - -
Total 401 1180

Alternative 2A-1 (Subs 1-2)
• New West District WWTP
• Average flow reduction at ND & CD WWTPs, less peaks at ND
WWTP DesignFlow (mgd)
Avg Peak
ND 85 317
CD 83 333• Reuse to FPL from SDWWTP
& FA recharge at CD, SD, & WD WWTPs
• 2-subalternatives/options for peak flow treatment (high rate
clarification)
• Total cost $4.40 – $4.46 Billion
CD 83 333
SD 131 305
WD 102 225
Total 401 1180

Alternative 2A-2 (Subs 1-2)
• New West District WWTP
• Average flow reduction at ND & CD WWTPs, more peaks at ND
WWTP Design
Flow (mgd)
Avg Peak
ND 85 327
CD 83 333• Reuse to FPL from SDWWTP
& FA recharge at CD, SD, & WD WWTPs
• 2-subalternatives/options for peak flow treatment (high rate
clarification)
• Total cost $4.42 - $4.58 Billion
CD 83 333
SD 131 305
WD 102 215
Total 401 1180

Alternative 2B-1
• New West District WWTP/higher
peak flows
• Average & peak flow reduction at ND & CD WWTPs
WWTP DesignFlow (mgd)
Avg Peak
ND 85 206
CD 83 203ND & CD WWTPs
• Reuse to FPL from SDWWTP & FA recharge at CD, SD, & WD WWTPs
• 2-subalternatives/options for peak flow treatment
• Total cost $5.83 Billion
CD 83 203
SD 131 384
WD 102 387
Total 401 1180

Alternative 2B-2
• New West District WWTP/higher
peak flows
• Average & peak flow reduction at ND & CD WWTPs
WWTP DesignFlow (mgd)
Avg Peak
ND 85 262
CD 83 234ND & CD WWTPs
• Reuse to FPL from SDWWTP & FA recharge at CD, SD, & WD WWTPs
• 2-subalternatives/options for peak flow treatment
• Total cost $5.16 Billion
CD 83 234
SD 131 300
WD 102 384
Total 401 1180

Recommending Alternative 2A-2-2
• Average flow reduction near the coast (ND & CD)
• Optimum peak flow diversion to minimize cost
WWTP DesignFlow (mgd)
Avg Peak
ND 85 327
CD 83 333diversion to minimize cost
• More climate change resilient alternative
• Cost comparable to other 2A alternatives, but less than 2Bs
CD 83 333
SD 131 305
WD 102 215
Total 401 1180
Total cost $4.42 Billion

• All proposed facilities to be in service by 2025
• Land acquisition for West District WWTP to
Schedule
West District WWTP to be completed in FY2014
• Finalizing detail schedule

Financial Plan
• Financing Options:
− Building Better Communities General Obligation Bonds (GOB)
− Rate supported Revenue Bonds
− State and Federal loans and grants, as available− State and Federal loans and grants, as available
− Explore public/private partnership opportunities
• On June 4, 2013, Board of County Commissioners approved the issuance of not to exceed $4.245 Billion Water and Sewer Revenue Bonds
• Rate increases over time to support required financing