CITY OF MONTEBELLO, CALIFORNIA … and Financial... · Government-wide Financial Statements:...
186
CITY OF MONTEBELLO, CALIFORNIA COMPREHENSIVE ANNUAL FINANCIAL REPORT WITH INDEPENDENT AUDITORS' REPORT FOR THE FISCAL YEAR ENDED JUNE 30, 2010
Transcript of CITY OF MONTEBELLO, CALIFORNIA … and Financial... · Government-wide Financial Statements:...
CITY OF MONTEBELLO, CALIFORNIA
COMPREHENSIVE ANNUAL FINANCIAL REPORT
WITH INDEPENDENT AUDITORS' REPORT
FOR THE FISCAL YEAR ENDED
JUNE 30, 2010

CITY OF MONTEBELLO
COMPREHENSIVE ANNUAL FINANCIAL REPORT
TABLE OF CONTENTS
For the fiscal year ended June 30, 2010
Page Number INTRODUCTORY SECTION: Letter of Transmittal i Table of Organization vi Officials of the City of Montebello vii GFOA Certificate of Achievement for Excellence in Financial Reporting viii FINANCIAL SECTION: Independent Auditors' Report 1 - 2 Management's Discussion and Analysis (Required Supplementary Information) 3 - 17 Basic Financial Statements: Government-wide Financial Statements: Statement of Net Assets 19 Statement of Activities 20 - 21 Fund Financial Statements: Governmental Funds: Balance Sheet 22 - 23 Reconciliation of the Governmental Funds Balance Sheet to the Statement of Net Assets 25 Statement of Revenues, Expenditures, and Changes in Fund Balances 26 - 27 Reconciliation of the Statement of Revenues, Expenditures and Changes in Fund Balances of Governmental Funds to the Statement of Activities 29 Proprietary Funds: Statement of Net Assets 30 - 31 Statement of Revenues, Expenses, and Changes in Fund Net Assets 32 - 33 Statement of Cash Flows 34 - 37 Fiduciary Fund: Statement of Fiduciary Assets and Liabilities 38 Notes to Basic Financial Statements 39 - 95

CITY OF MONTEBELLO
COMPREHENSIVE ANNUAL FINANCIAL REPORT
TABLE OF CONTENTS (CONTINUED)
For the fiscal year ended June 30, 2010
Page Number FINANCIAL SECTION (CONTINUED): Required Supplementary Information: 96 Schedules of Funding Progress: CalPERS Defined Benefit Pension Plans 97 Other-Post Employment Benefit Plan 97 Budgetary Comparison Schedule: General Fund 98 - 99 Note to Required Supplementary Information 100 Supplementary Schedules: 101 Other Governmental Funds: 102 Combining Balance Sheet 103 Combining Statement of Revenues, Expenditures, and Changes in Fund Balances 104 Other Special Revenue Funds: 105 Combining Balance Sheet 106 - 107 Combining Statement of Revenues, Expenditures, and Changes in Fund Balances 108 - 109 Schedules of Revenues, Expenditures, and Changes in Fund Balance - Budget and Actual: Special Gas Tax Special Revenue Fund 110 Park Development Special Revenue Fund 111 Retirement Special Revenue Fund 112 Prop A Special Revenue Fund 113 Drug Enforcement Special Revenue Fund 114 Prop C Special Revenue Fund 115 Metro Station Special Revenue Fund 116 Air Quality Special Revenue Fund 117 Supplemental Law Enforcement Special Revenue Fund 118 Grants Special Revenue Fund 119

CITY OF MONTEBELLO
COMPREHENSIVE ANNUAL FINANCIAL REPORT
TABLE OF CONTENTS (CONTINUED)
For the fiscal year ended June 30, 2010
Page Number FINANCIAL SECTION (CONTINUED): Supplementary Schedules (Continued): Other and Major Debt Service Funds: 120 Combining Balance Sheet 121 Combining Statement of Revenues, Expenditures, and Changes in Fund Balances 122 Schedules of Revenues, Expenditures and Changes in Fund Balance - Budget and Actual: City Debt Service Fund 123 Public Financing Authority Debt Service Fund 124 Redevelopment Agency Debt Service Fund 125 Other and Major Capital Projects Funds: 126 Schedules of Revenues, Expenditures, and Changes in Fund Balance - Budget and Actual: Public Financing Authority Capital Projects Fund 127 Capital Improvements Capital Projects Fund 128 Redevelopment Agency Capital Projects Fund 129 Other Enterprise Funds: 130 Combining Statement of Net Assets 131 Combining Statement of Revenues, Expenses, and Changes in Fund Net Assets 132 Combining Statement of Cash Flows 133 Internal Service Funds: 134 Combining Statement of Net Assets 135 Combining Statement of Revenues, Expenses, and Changes in Fund Net Assets 136 Combining Statement of Cash Flows 137 Agency Fund: 138 Statement of Changes in Assets and Liabilities 139
CITY OF MONTEBELLO
COMPREHENSIVE ANNUAL FINANCIAL REPORT
TABLE OF CONTENTS (CONTINUED)
For the fiscal year ended June 30, 2010
Page Number STATISTICAL SECTION (UNAUDITED): Description of Statistical Section Contents 141 Financial Trends: Net Assets by Component - Last Seven Fiscal Years 142 - 143 Changes in Net Assets - Expense and Program Revenues - Last Seven Fiscal Years 144 - 145 Changes in Net Assets - General Revenues - Last Seven Fiscal Years 146 - 147 Fund Balances - Governmental Funds - Last Seven Fiscal Years 148 - 149 Governmental Activities Tax Revenues by Sources - Last Ten Fiscal Years 151 Revenue Capacity: Assessed Value and Estimated Actual Value of Taxable Property - Last Ten Fiscal Years 152 - 153 Direct and Overlapping Property Tax Rates - Last Ten Fiscal Years 154 - 155 Principal Property Tax Payers 156 Property Tax Levies and Collections - Last Ten Fiscal Years 157 Debt Capacity: Ratios of Outstanding Debt by Type - Last Ten Fiscal Years 158 Ratios of General Bonded Debt Outstanding - Last Ten Fiscal Years 159 Direct and Overlapping Debt 160 Legal Debt Margin Information - Last Ten Fiscal Years 161 Pledged-Revenue Bond Coverage: Golf Revenue Bonds - Last Ten Fiscal Years 162 Demographic and Economic Information: Demographic and Economic Statistics - Last Ten Calendar Years 163 Principal Employers - Current Fiscal Year and Nine Fiscal Years Ago 164 Operating Information: Full-Time and Part-Time City Employees by Function - Last Eight Fiscal Years 165 Operating Indicators by Function - Last Ten Calendar Years 166 - 167 Capital Asset Statistics by Function - Last Ten Fiscal Years 168 - 169

- i -
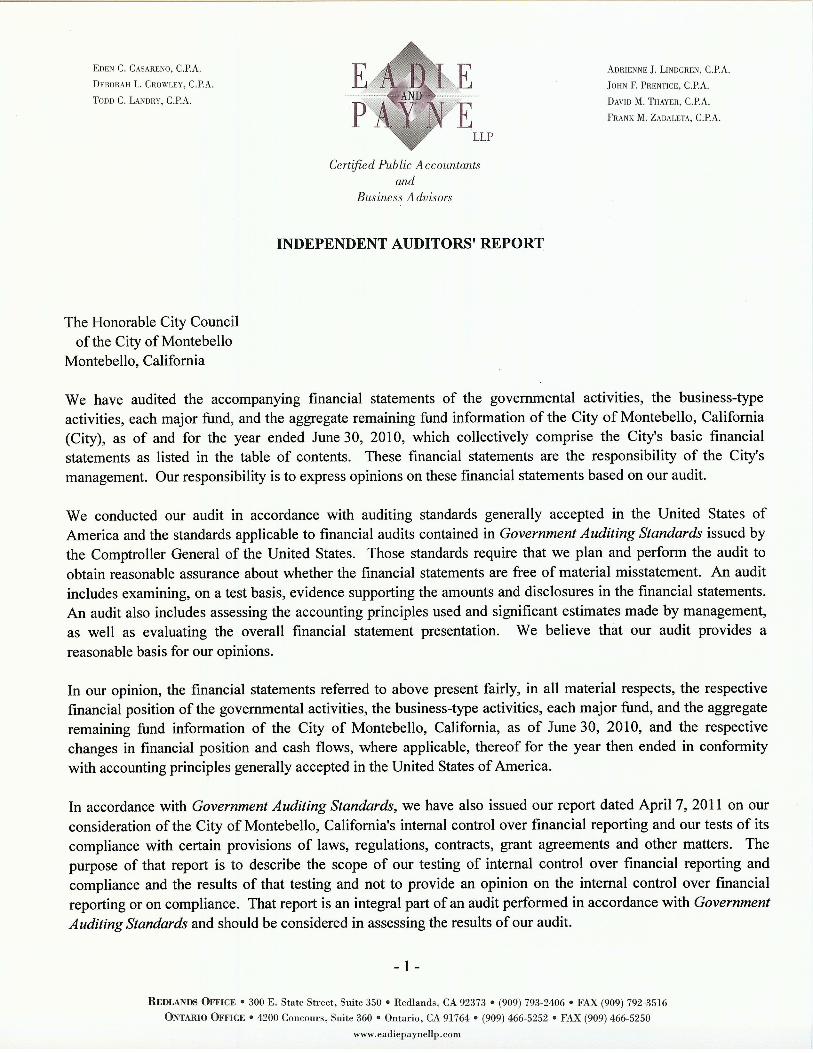
April 7, 2011 Honorable Mayor, Members of the City Council City of Montebello The Comprehensive Annual Financial Report (CAFR) of the City of Montebello (City) for the fiscal year ended June 30, 2010 is submitted as prepared by the City's Finance Department. The report is published to provide to our citizens, the City Council, and the investment community detailed information about the financial condition and operating results of the City as measured by the financial activity of its various funds. The CAFR is presented in three (3) sections: the Introductory Section, the Financial Section, and the Statistical Section. The Introductory Section contains a table of contents, this letter of transmittal, a list of elected officials, and an organization chart. The Financial Section contains our independent auditors', Eadie and Payne LLP, opinion letter, the general purpose financial statements, and the relevant supplemental financial statements and schedules for 2009-10. The Statistical Section presents historical, financial, analytical, economic, and demographic information, which may be useful for further analysis and comparisons. Responsibility for both the accuracy of the financial report and the completeness and fairness of the presentation rests with the City. To the best of our knowledge, the information presented is accurate in all material aspects and includes all disclosures necessary to enable the reader to gain an understanding of the City's financial activities. The City prepared the CAFR using the financial reporting requirements outlined in the Governmental Accounting Standards Board (GASB) Statement No. 34. This statement requires that management provide a narrative introduction, overview, and analysis to accompany the basic financial statements in the form of Management's Discussion and Analysis (MD&A). This letter of transmittal is designed to complement the MD&A and should be read in conjunction with it. The City's MD&A can be found immediately following the report of the independent auditors in the financial section of the CAFR. GENERAL INFORMATION AND ECONOMIC OUTLOOK The City of Montebello was incorporated on October 16, 1920, and conducts its operations as a general law, Council/Administrator City. The City is governed by a Council of five members elected at large and serve for staggered four-year terms. The City Clerk and City Treasurer are also elected to four-year terms. The City Mayor, Mayor Pro Tem, City Administrator, and City Attorney are appointed by the Council.

- ii -
GENERAL INFORMATION AND ECONOMIC OUTLOOK (CONTINUED) Montebello is located nine miles east of the Los Angeles Civic Center and has access to three freeways - the Santa Ana Freeway to the south, the Pomona Freeway to the north, and the San Gabriel River Freeway to the east. The City has a population of approximately 66,000 living in an area of 8.2 square miles. The City is a balanced community with light industry, residential areas, and commercial centers. According to the 2010 estimate of the California Department of Finance, the City's population showed an increase of 0.55 percent over last year. The 2009-10 assessed valuation of $4.6 billion represents a decrease of 1.3 percent over last year. Increases during the past five years have averaged 6.6 percent. The Consumer Price Index for the Los Angeles-Riverside-Orange County area of which Montebello is a part of, increased 0.9 percent over 2008-09. Sales Tax revenue of $8.4 million for 2009-10 reflects a decrease of 19.1 percent when compared to 2008-09; this represents the third straight year where sales tax revenue has decreased from the preceding year. Sales tax revenues during the past five years have decreased an average of 4.8 percent per year. Sales tax is a major revenue source for the City and is broad based with a major shopping mall anchored by Macy's and Penney's, another shopping center anchored by Sears and Costco, a large petroleum company, a major paper products distributor, and two auto agencies. While sales tax provides a solid revenue source, the economic downturn has had an impact on the amount of sales tax revenue collected by the City, even though Montebello historically has had the ability to attract strong sales tax producers to the City. REDEVELOPMENT AGENCY Capital Asset and Debt Administration In the South Montebello Industrial Redevelopment Project Area (SMIRP), the Montebello Redevelopment Agency (Agency) continues to pursue economic development strategies that concentrate in job creation. Some of the activities pursued within the area include the US-EPA Brownfield Pilot Grant and DTSE Target Site Investigation Grant to assess need remediation. The City's Brownfield program is intended to improve quality of life, property values, which result in greater property tax revenues, and land uses, which are highest and best used without limitation by contamination. Additionally, the Agency continues to seek opportunities for development projects along Telegraph Road and Slauson Avenue, and throughout the SMIRP. The Agency is also exploring options to bring a Holiday Inn Express to the City. This project is still in the planning and design stage and various funding sources are being considered. The Montebello Economic Revitalization Project Area (MERP) continues to maintain a high level of activity. Chief amongst the activities is publication of the Whittier Boulevard Corridor Development Code to facilitate mixed-use development, including urban housing and transit-oriented development, in the City's downtown corridor. The Agency has also implemented a streetscape program on Whittier Boulevard that includes sidewalks, landscape, and irrigation improvements, the installation of street furniture such as bicycle racks, tree grates and guards, pavers, and exterior lighting on Whittier Boulevard between 4th Street and the easterly City limits. Other activities within the MERP include request for proposals to develop Agency property at 701-705 West Whittier Boulevard with a desirable restaurant tenant, and explore development opportunities on Whittier Boulevard at 5th and 6th Streets and at 18th and 19th Streets. These activities are strategically implemented to eliminate blight, enhance quality of life, and generate greater property tax and sales tax revenues for the State, City, and Agency.

- iii -
REDEVELOPMENT AGENCY (CONTINUED) Capital Asset and Debt Administration (Continued) The City's Montebello Hills Redevelopment Project Area (MHRP) has historically yielded the greatest tax increment revenues for the Agency and sales tax revenues for the State and City. The City is in the midst of reviewing the Draft Montebello Hills Specific Plan and the corresponding Draft Environmental Impact Report for the Montebello Hills Specific Plan as well as corresponding public comments. The Montebello Hills Specific Plan proposes to develop 1,200 housing units and several acres of open space in the MHRP and would generate property tax and sales tax revenues. The Agency also continues to seek opportunities to enhance the regional shopping center in the MHRP and is currently working with the City and Costco to pursue the construction of a gas station on the Costco site to generate revenue for Costco and additional tax revenues for the State and the City. FINANCIAL INFORMATION THE FINANCIAL REPORTING ENTITY This report includes all funds and account groups of the City, including the Agency, Montebello Public Improvement Corporation, and Montebello Public Financing Authority. The City provides a full range of municipal services including police and fire protection, street maintenance, planning and development, parks and recreation services, and general administration. Montebello also operated its golf course, transportation system, detention facility, water services, and the Hilton Garden Hotel as enterprise funds. Enterprise funds are financed from user fees and subsidies from other governmental agencies. ACCOUNTING SYSTEM The modified accrual basis of accounting is followed for government fund types and the accrual basis of accounting is followed for proprietary fund types. In developing and changing the City's accounting system, consideration is given to the adequacy of internal accounting controls. Internal accounting controls are designed to provide reasonable, but not absolute, assurance regarding:
The safeguarding of assets against losses from unauthorized use or disposition and the reliability of
financial records for preparing financial statements and maintaining accountability for assets.
The concept of reasonable assurance recognized that the cost control procedures should not exceed the benefits likely to be derived and that the evaluation of costs and benefits require estimates and judgments by management.
All internal control evaluations occur within the above framework.
- iv -
BUDGETARY CONTROL In addition to internal accounting controls, the City also maintains budgetary controls. The objective of these budgetary controls is to ensure compliance with the City's budget policy embodied in the annual appropriated budget approved by the City Council. Activities of the General Fund, Special Revenue Funds, Debt Service Funds, and Capital Project Funds are included in the annual approved budget. Budgetary control is maintained at a functional level by division within the department through the use of object level accounting appropriations. Actual expenditures are compared to these appropriations. When purchase orders, contracts, and other commitments are approved, appropriations are encumbered. Encumbrances and expenditures, which would cause an overrun of appropriations, require an approved budget transfer. Encumbrances at year-end are reported as reservations of fund balance. A three-year capital plan is included in the City's published budget with each improvement monitored on a project-by-project basis. Capital projects are further appropriated annually. Encumbrances and expenditures, which would cause an annual project appropriation overrun, require an approved budget transfer. Encumbrances at year-end are reported as reservations of fund balance. In 1979, Proposition 4, the "Gann Initiative" was passed. This measure, which was intended to control government spending, established a limit calculated on a fiscal year 1978-1979 base year amount adjusted each succeeding year by the Consumer Price Index and population changes. In 1989-90, Proposition 111 was passed, which changed the base year to 1987-88 and allowed cities to adjust their limit annually by either the change in the California per-capita income or the percentage change in growth in total assessed valuation due to nonresidential construction. For population changes, cities now have the option of using either the percentage increase of the City or the percent increase of the entire county. The law also allows for the exclusion from the limit of "qualified capital outlay," which includes any appropriation for fixed assets costing over $100,000. The limit has increased steadily from its base of $7.5 million to $44.8 million. PENSION PLAN The City of Montebello is covered under the Public Employee Retirement System (PERS), which is administered by the State. Nonsafety employees are also covered under the PERS, which is administered by the Social Security System. The City's share of contributions to the pension plans for all employees are covered by a voter approval levy. DEBT ADMINISTRATION At June 30, 2010, the City had general long-term debt amounting to $125.9 million, which is detailed in the Notes to the Basic Financial Statements. This includes $67.0 million for tax allocation bonds, $25.5 million for Certificates of Participation, $15.1 million for Revenue Bonds, $12.3 million for notes payable, $2.2 million for other post-employment benefit obligation, and $3.8 million for the noncurrent portion of accumulative vacation and sick leave. The City has no general obligation debt.

- v -

- vi -
- vii -
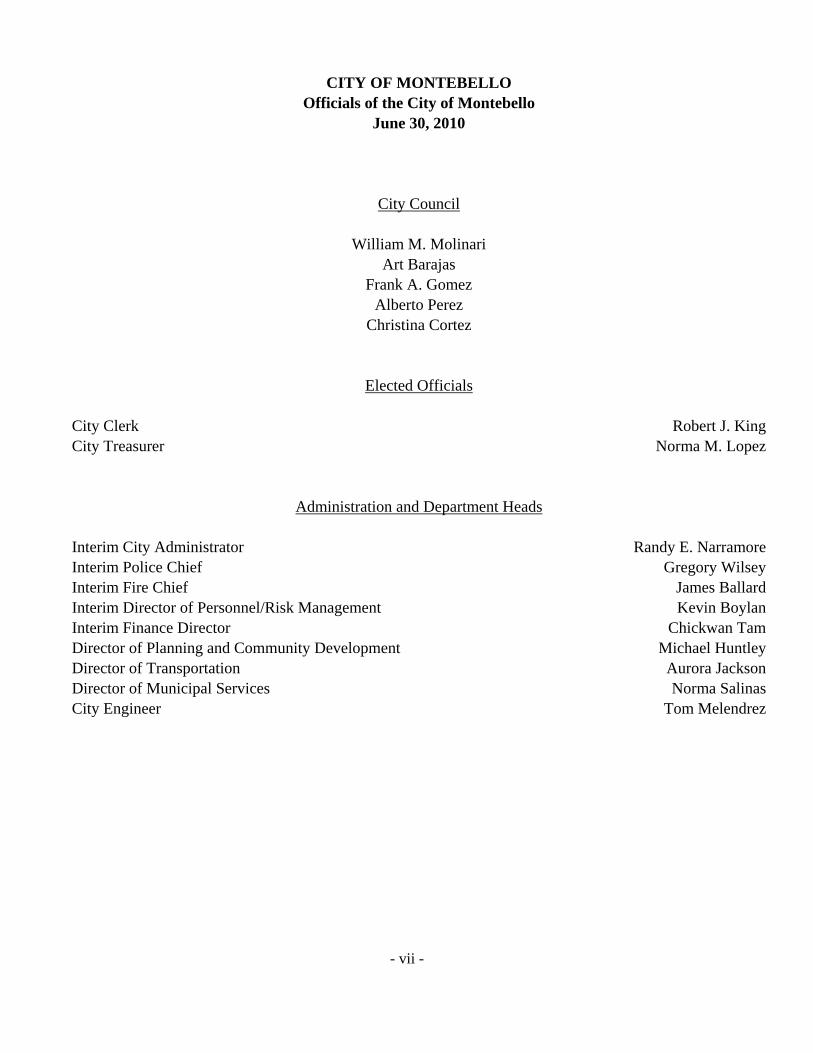
CITY OF MONTEBELLO Officials of the City of Montebello
June 30, 2010
City Council
William M. Molinari Art Barajas
Frank A. Gomez Alberto Perez
Christina Cortez
Elected Officials City Clerk Robert J. King City Treasurer Norma M. Lopez
Administration and Department Heads Interim City Administrator Randy E. Narramore Interim Police Chief Gregory Wilsey Interim Fire Chief James Ballard Interim Director of Personnel/Risk Management Kevin Boylan Interim Finance Director Chickwan Tam Director of Planning and Community Development Michael Huntley Director of Transportation Aurora Jackson Director of Municipal Services Norma Salinas City Engineer Tom Melendrez

- viii -


See independent auditors' report - 3 -
CITY OF MONTEBELLO
MANAGEMENT'S DISCUSSION AND ANALYSIS
June 30, 2010 As management of the City of Montebello, California (the City), we offer readers of the City of Montebello's financial statements this narrative overview and analysis of the financial activities of the City for the fiscal year ended June 30, 2010. We encourage readers to consider the information presented here in conjunction with additional information that we have furnished in our letter of transmittal, which can be found in the introductory section of this report, and with the City's financial statements, which follow this discussion. Financial Highlights
• The assets of the City exceeded its liabilities, at June 30, 2010, by $76.8 million (net assets) and the government's total net assets increased by $9.0 million during the fiscal year ended June 30, 2010.
• As of June 30, 2010, the City's governmental funds reported combined ending fund balances of $54.5
million, a decrease of $10.1 million in comparison with the prior year. Approximately 32.5% of this total amount, $17.7 million, is available for spending at the City's discretion (unreserved fund balance).
• At the end of the current fiscal year, the General Fund had an unreserved fund balance deficit of $6.9
million and the general fund reserve (Capital Improvement Capital Projects Fund) had an unreserved fund balance deficit of $1.2 million.
• The City's total long-term liabilities decreased by $1.9 million during the current fiscal year.
Overview of the Financial Statements This discussion and analysis is intended to serve as an introduction to the City's basic financial statements. The City's basic financial statements consist of three components: 1) government-wide financial statements; 2) fund financial statements; and 3) notes to the basic financial statements. This report also contains other supplementary information in addition to the basic financial statements themselves. Government-wide Financial Statements The government-wide financial statements are designed to provide readers with a broad overview of the City's finances, in a manner similar to a private-sector business. The statement of net assets presents information on all of the City's assets and liabilities, with the difference between the two reported as net assets. Over time, increases or decreases in the net assets may serve as a useful indicator of whether the financial position of the City is improving or deteriorating.

CITY OF MONTEBELLO
MANAGEMENT'S DISCUSSION AND ANALYSIS (CONTINUED)
June 30, 2010
- 4 -
Government-wide Financial Statements (Continued) The statement of activities presents information showing how the government's net assets changed during the most recent fiscal year. All changes in net assets are reported as soon as the underlying event giving rise to the change occurs, regardless of the timing of related cash flows. Revenues and expenses are reported in this statement for some items that will only result in cash flows in future fiscal periods (e.g., uncollected taxes and earned but unused vacation leave). The government-wide financial statements present information about the functions of the City that is principally supported by taxes and intergovernmental revenues (governmental activities). The governmental activities of the City and the Montebello Redevelopment Agency (Agency), a blended component unit, include general government, public safety, public works, parks, recreation and culture, and housing and community development. Business-type activities of the City include the water, golf course, transportation, hotel, and detention operations. The government-wide financial statements can be found immediately following this discussion and analysis. Fund Financial Statements A fund is a grouping of related accounts that is used to maintain control over resources that have been segregated for specific activities or objectives. The City, like other state and local governments, uses fund accounting to ensure and demonstrate compliance with finance-related legal requirements. All of the funds of the City can be divided into three categories: governmental funds, proprietary funds, and fiduciary funds. Governmental funds. Governmental funds are used to account for essentially the same functions reported as governmental activities in the government-wide financial statements. However, unlike the government-wide financial statements, governmental fund financial statements focus on near-term inflows and outflows of spendable resources, as well as on balances of spendable resources available at the end of the fiscal year. Such information may be useful in evaluating a government's near-term financing requirements. Because the focus of governmental funds is narrower than that of the government-wide financial statements, it is useful to compare the information presented for governmental funds with similar information presented for governmental activities in the government-wide financial statements. By doing so, readers may better understand the long-term impact of the government's near-term financing decisions. Both the Governmental Fund Balance Sheet and the Governmental Fund Statement of Revenues, Expenditures, and Changes in Fund Balances provide a reconciliation to facilitate this comparison between governmental funds and governmental activities.

CITY OF MONTEBELLO
MANAGEMENT'S DISCUSSION AND ANALYSIS (CONTINUED)
June 30, 2010
- 5 -
Fund Financial Statements (Continued) Governmental funds (Continued). The City maintains various individual governmental funds. Information is presented separately in the Governmental Funds Balance Sheet, and in the Governmental Funds Statement of Revenues, Expenditures, and Changes in Fund Balances, for the General Fund, the Montebello Redevelopment Agency Debt Service, the Capital Improvements Capital Projects Fund, and the Montebello Redevelopment Agency Capital Projects Fund, all of which are considered to be major funds. Data from other governmental funds are combined into a single, aggregated presentation. Individual fund data for each of these other governmental funds is provided in the form of combining statements elsewhere in this report. The City adopts an annual appropriated budget for its major funds. The financial statements include a budgetary comparison schedule for the General Fund. The budgetary comparison schedule has been provided to demonstrate compliance with this budget. The basic governmental fund financial statements can be found immediately following the government-wide financial statements. Proprietary funds. Proprietary funds are generally used to account for services for which the City charges outside customers or internal departments of the City. Proprietary funds provide the same type of information as shown in the government-wide financial statements, only in more detail. The City maintains the following two types of proprietary funds.
• Enterprise funds are used to report the same functions presented as business-type activities in the government-wide financial statements. The City uses enterprise funds to account for the operations of the water and transportation systems and the Montebello Hilton, golf course, and detention facilities.
• Internal service funds are used to report activities that provide internal services for the City. The City
uses internal service funds to account for its liabilities, workers' compensation, and vehicle maintenance and replacement. Because internal service funds predominantly benefit governmental rather than business-type functions, they have been included within governmental activities in the government-wide financial statements. The internal service funds are combined into a single, aggregated presentation in the proprietary fund financial statements. Individual fund data for the internal service funds is provided in the form of combining statements elsewhere in this report.
The proprietary fund financial statements can be found immediately following the governmental funds financial statements. Fiduciary funds. Fiduciary funds are used to account for resources held for the benefit of parties outside the government. Fiduciary funds are not reflected in the government-wide financial statements because the resources of those funds are not available to support the City's own programs. The basic fiduciary fund financial statements can be found immediately following the basic proprietary fund financial statements.

CITY OF MONTEBELLO
MANAGEMENT'S DISCUSSION AND ANALYSIS (CONTINUED)
June 30, 2010
- 6 -
Notes to the Basic Financial Statements The notes to the basic financial statements provide additional information that is essential to a full understanding of the data provided in the government-wide and fund financial statements. The notes to the basic financial statements can be found immediately following the basic fiduciary fund financial statements. Other Information The combining statements referred to earlier in connection with other governmental funds and internal service funds are presented for all other Special Revenue Funds, all other Debt Service Funds, all other Capital Projects Funds, and all Internal Service Funds. These combining fund statements and Schedules of Revenues, Expenditures, and Changes in Fund Balance - Budget and Actual for individual funds can be found immediately following the required supplementary information. The blended component units referred to earlier in connection with the government-wide financial statements, although legally separate, function at the discretion and direction of the City's management. Their financial position and results of operations, therefore, have been included as an integral part of the primary government, and are presented in the fund financial statements. Government-wide Financial Analysis The government wide financial statements provide long-term and short-term information about the City's overall financial condition. This analysis addresses the financial statements of the City as a whole. The largest portion of the City's net assets of $76.8 million reflects its investment in capital assets (e.g., land, buildings, improvements other than buildings, equipment, infrastructure, and construction in progress), less any related debt used to acquire those assets that is still outstanding. The City uses these capital assets to provide services to citizens; consequently, these assets are not available for future spending. Although the City's investment in its capital assets is reported net of related debt, it should be noted that the resources needed to repay this debt must be provided from other sources, since the capital assets themselves cannot be used to liquidate these liabilities.
CITY OF MONTEBELLO
MANAGEMENT'S DISCUSSION AND ANALYSIS (CONTINUED)
June 30, 2010
- 7 -
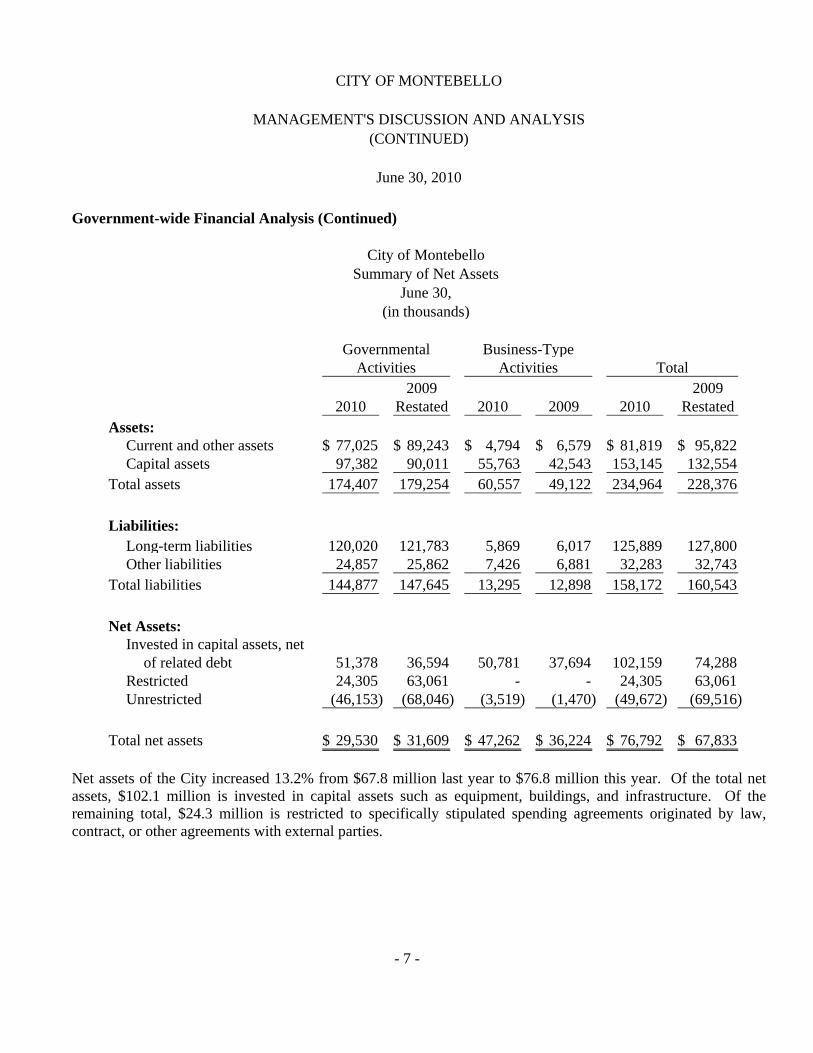
Government-wide Financial Analysis (Continued)
City of MontebelloSummary of Net Assets
June 30,(in thousands)
Governmental Business-TypeActivities Activities Total
2009 20092010 Restated 2010 2009 2010 Restated
Assets:Current and other assets 77,025$ 89,243$ 4,794$ 6,579$ 81,819$ 95,822$ Capital assets 97,382 90,011 55,763 42,543 153,145 132,554
Total assets 174,407 179,254 60,557 49,122 234,964 228,376
Liabilities:Long-term liabilities 120,020 121,783 5,869 6,017 125,889 127,800 Other liabilities 24,857 25,862 7,426 6,881 32,283 32,743
Total liabilities 144,877 147,645 13,295 12,898 158,172 160,543
Net Assets:Invested in capital assets, net
of related debt 51,378 36,594 50,781 37,694 102,159 74,288 Restricted 24,305 63,061 - - 24,305 63,061 Unrestricted (46,153) (68,046) (3,519) (1,470) (49,672) (69,516)
Total net assets 29,530$ 31,609$ 47,262$ 36,224$ 76,792$ 67,833$ Net assets of the City increased 13.2% from $67.8 million last year to $76.8 million this year. Of the total net assets, $102.1 million is invested in capital assets such as equipment, buildings, and infrastructure. Of the remaining total, $24.3 million is restricted to specifically stipulated spending agreements originated by law, contract, or other agreements with external parties.
CITY OF MONTEBELLO
MANAGEMENT'S DISCUSSION AND ANALYSIS (CONTINUED)
June 30, 2010
- 8 -
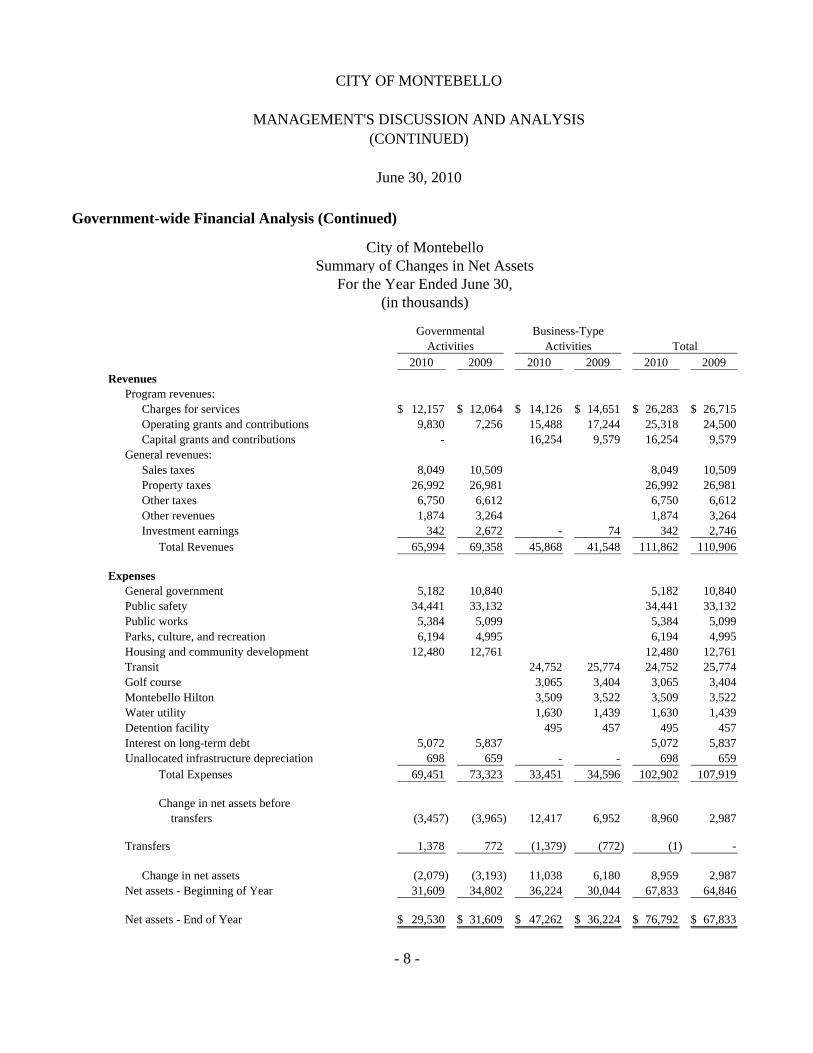
Government-wide Financial Analysis (Continued)
City of MontebelloSummary of Changes in Net Assets
For the Year Ended June 30,(in thousands)
Governmental Business-TypeActivities Activities Total
2010 2009 2010 2009 2010 2009Revenues
Program revenues:Charges for services 12,157$ 12,064$ 14,126$ 14,651$ 26,283$ 26,715$ Operating grants and contributions 9,830 7,256 15,488 17,244 25,318 24,500 Capital grants and contributions - 16,254 9,579 16,254 9,579
General revenues:Sales taxes 8,049 10,509 8,049 10,509 Property taxes 26,992 26,981 26,992 26,981 Other taxes 6,750 6,612 6,750 6,612 Other revenues 1,874 3,264 1,874 3,264 Investment earnings 342 2,672 - 74 342 2,746
Total Revenues 65,994 69,358 45,868 41,548 111,862 110,906
ExpensesGeneral government 5,182 10,840 5,182 10,840 Public safety 34,441 33,132 34,441 33,132 Public works 5,384 5,099 5,384 5,099 Parks, culture, and recreation 6,194 4,995 6,194 4,995 Housing and community development 12,480 12,761 12,480 12,761 Transit 24,752 25,774 24,752 25,774 Golf course 3,065 3,404 3,065 3,404 Montebello Hilton 3,509 3,522 3,509 3,522 Water utility 1,630 1,439 1,630 1,439 Detention facility 495 457 495 457 Interest on long-term debt 5,072 5,837 5,072 5,837 Unallocated infrastructure depreciation 698 659 - - 698 659
Total Expenses 69,451 73,323 33,451 34,596 102,902 107,919
Change in net assets before transfers (3,457) (3,965) 12,417 6,952 8,960 2,987
Transfers 1,378 772 (1,379) (772) (1) -
Change in net assets (2,079) (3,193) 11,038 6,180 8,959 2,987 Net assets - Beginning of Year 31,609 34,802 36,224 30,044 67,833 64,846
Net assets - End of Year 29,530$ 31,609$ 47,262$ 36,224$ 76,792$ 67,833$
CITY OF MONTEBELLO
MANAGEMENT'S DISCUSSION AND ANALYSIS (CONTINUED)
June 30, 2010
- 9 -
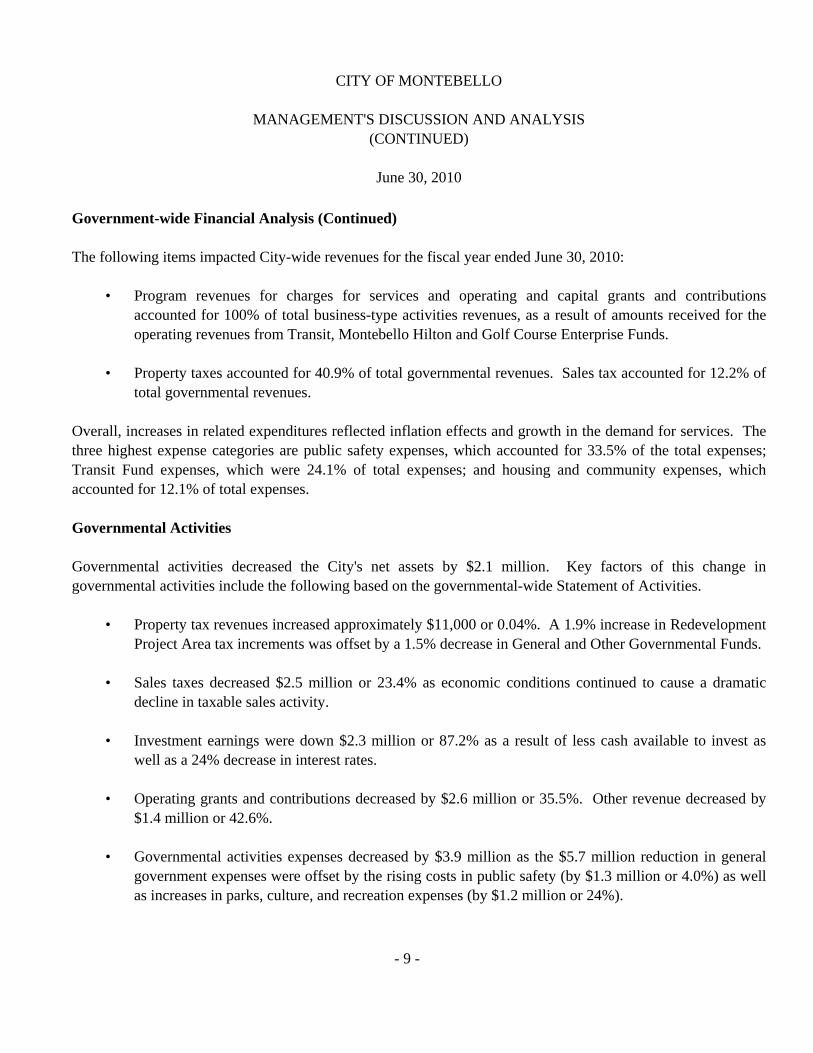
Government-wide Financial Analysis (Continued) The following items impacted City-wide revenues for the fiscal year ended June 30, 2010:
• Program revenues for charges for services and operating and capital grants and contributions accounted for 100% of total business-type activities revenues, as a result of amounts received for the operating revenues from Transit, Montebello Hilton and Golf Course Enterprise Funds.
• Property taxes accounted for 40.9% of total governmental revenues. Sales tax accounted for 12.2% of
total governmental revenues.
Overall, increases in related expenditures reflected inflation effects and growth in the demand for services. The three highest expense categories are public safety expenses, which accounted for 33.5% of the total expenses; Transit Fund expenses, which were 24.1% of total expenses; and housing and community expenses, which accounted for 12.1% of total expenses. Governmental Activities Governmental activities decreased the City's net assets by $2.1 million. Key factors of this change in governmental activities include the following based on the governmental-wide Statement of Activities.
• Property tax revenues increased approximately $11,000 or 0.04%. A 1.9% increase in Redevelopment Project Area tax increments was offset by a 1.5% decrease in General and Other Governmental Funds.
• Sales taxes decreased $2.5 million or 23.4% as economic conditions continued to cause a dramatic
decline in taxable sales activity. • Investment earnings were down $2.3 million or 87.2% as a result of less cash available to invest as
well as a 24% decrease in interest rates. • Operating grants and contributions decreased by $2.6 million or 35.5%. Other revenue decreased by
$1.4 million or 42.6%. • Governmental activities expenses decreased by $3.9 million as the $5.7 million reduction in general
government expenses were offset by the rising costs in public safety (by $1.3 million or 4.0%) as well as increases in parks, culture, and recreation expenses (by $1.2 million or 24%).

CITY OF MONTEBELLO
MANAGEMENT'S DISCUSSION AND ANALYSIS (CONTINUED)
June 30, 2010
- 10 -
Government-wide Financial Analysis (Continued) Business-type Activities Business-type activities increased the City of Montebello's net assets by $11.0 million. The City's Transit System is the largest business-type operation, followed by the Montebello Hilton and the Golf Course Facilities. Approximately 28.4% of Transit Fund financing for operations is generated from bus fares and special contracts, with the remaining 71.6% coming from State and federal subsidies. The total fiscal year operating revenues decreased $2.0 million or 8.4% from last year as a result of less general ridership. The Transit Fund operating expenses show a decrease from $25.5 million to $24.8 million, down $0.7 million or 3.0%. The Golf Course has shown a decrease in net assets of $0.8 million compared to a decrease in net assets of $0.9 million for the same period last year. Revenues were down $270,000 primarily due to decreases in revenues for rents and concessions and other revenues. Expenses, including depreciation expense, which is included in enterprise funds' operating expenses, showed a decrease of $339,000 as costs for contract services, materials and supplies, and utility expenses all were reduced. Labor and fringe benefits remained the same as last year. The Montebello Hilton reflected net income before transfers of capital for debt service of $337,000 for the fiscal year compared to net income of $470,000 for the same period last year. Operating revenues decreased by $150,000. Expenses remained essentially the same in all expense categories over the same period last year. Financial Analysis of the Government's Funds As noted earlier, the City uses fund accounting to ensure and demonstrate compliance with finance-related legal requirements. Governmental funds. The focus of the City's governmental funds is to provide information on near-term inflows, outflows, and balances of spendable resources. Such information may be useful in assessing the City's financing requirements. In particular, the unreserved fund balance may serve as a useful measure of a government's net resources available for spending at the end of the fiscal year. As of the end of the current fiscal year, the City's governmental funds reported total combined ending fund balances of $54.5 million, a decrease of $10.1 million in comparison with the prior year. Approximately 32.5% of this total amount constitutes unreserved fund balance, which is available for spending at the City's direction. The remainder of the fund balance, $36.8 million, is reserved to indicate that it is not available for new spending, because it has already been committed to: 1) liquidate contracts and purchase orders of the prior period of $1.5 million; 2) pay debt service of $20.9 million; 3) reserve for long-term notes receivable of $4.2 million; 4) for a variety of other restricted purposes of $8.2 million; or 5) advances to other funds of $2.0 million.

CITY OF MONTEBELLO
MANAGEMENT'S DISCUSSION AND ANALYSIS (CONTINUED)
June 30, 2010
- 11 -
Financial Analysis of the Government's Funds (Continued) Governmental funds (Continued). The General Fund is the City's main operating fund. In 2009-2010, the General Fund ended the year with a deficit of $6.7 million, compared to no fund balance in 2008-2009. It was the City's policy prior to 2009-2010 to end the year with zero General Fund fund balance. In order to accomplish this, the City's General Fund reserve, if any, was transferred into the Capital Improvement Fund. The 2008-2009 General Fund deficit of $2.9 million was transferred to the Capital Improvement Fund at June 30, 2009. For fiscal year ended June 30, 2010, General Fund activities were reflected in the General Fund and not transferred out into the Capital Improvement Fund. Factors which contributed to this were a $2.4 million or 7.1% decrease in revenues after offsetting prior-year interfund revenue of $3.2 million from revenues against general government expenses. General Fund expenditures increased $.4 million or 0.8%.
City of MontebelloGeneral Fund
For the Years Ended June 30,(in thousands)
2010 2009 ChangeOperating revenues 31,535$ 33,935$ -7.1%Operating expenditures 46,944 46,577 0.8%
Excess of revenues over (under) expenditures (15,409) (12,642) 21.9%Net operating transfers and other 8,727 9,681 -9.9%
Surplus (deficit) (6,682) (2,961) 125.7%
Transfer from reserve - 2,961 -100.0%
Beginning fund balance - - 0%
Ending fund balance (6,682)$ -$
The Montebello Redevelopment Agency Debt Service Fund has a total fund balance of $13.9 million, all of which is reserved for the payment of debt service. The net decrease in fund balance during the current year was $7.7 million. This decrease was due to additional transfers of funds to cover $12.7 million of capital projects within the Agency's Capital Projects Fund.
CITY OF MONTEBELLO
MANAGEMENT'S DISCUSSION AND ANALYSIS (CONTINUED)
June 30, 2010
- 12 -
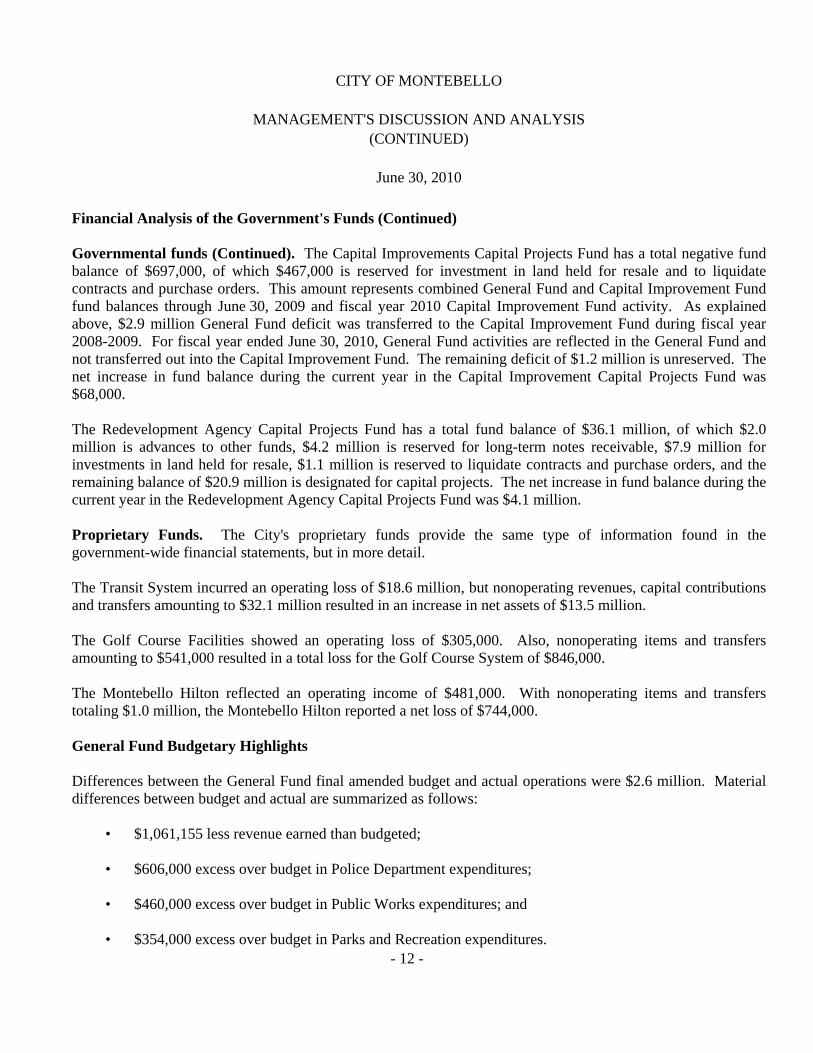
Financial Analysis of the Government's Funds (Continued) Governmental funds (Continued). The Capital Improvements Capital Projects Fund has a total negative fund balance of $697,000, of which $467,000 is reserved for investment in land held for resale and to liquidate contracts and purchase orders. This amount represents combined General Fund and Capital Improvement Fund fund balances through June 30, 2009 and fiscal year 2010 Capital Improvement Fund activity. As explained above, $2.9 million General Fund deficit was transferred to the Capital Improvement Fund during fiscal year 2008-2009. For fiscal year ended June 30, 2010, General Fund activities are reflected in the General Fund and not transferred out into the Capital Improvement Fund. The remaining deficit of $1.2 million is unreserved. The net increase in fund balance during the current year in the Capital Improvement Capital Projects Fund was $68,000. The Redevelopment Agency Capital Projects Fund has a total fund balance of $36.1 million, of which $2.0 million is advances to other funds, $4.2 million is reserved for long-term notes receivable, $7.9 million for investments in land held for resale, $1.1 million is reserved to liquidate contracts and purchase orders, and the remaining balance of $20.9 million is designated for capital projects. The net increase in fund balance during the current year in the Redevelopment Agency Capital Projects Fund was $4.1 million. Proprietary Funds. The City's proprietary funds provide the same type of information found in the government-wide financial statements, but in more detail. The Transit System incurred an operating loss of $18.6 million, but nonoperating revenues, capital contributions and transfers amounting to $32.1 million resulted in an increase in net assets of $13.5 million. The Golf Course Facilities showed an operating loss of $305,000. Also, nonoperating items and transfers amounting to $541,000 resulted in a total loss for the Golf Course System of $846,000. The Montebello Hilton reflected an operating income of $481,000. With nonoperating items and transfers totaling $1.0 million, the Montebello Hilton reported a net loss of $744,000. General Fund Budgetary Highlights Differences between the General Fund final amended budget and actual operations were $2.6 million. Material differences between budget and actual are summarized as follows:
• $1,061,155 less revenue earned than budgeted; • $606,000 excess over budget in Police Department expenditures; • $460,000 excess over budget in Public Works expenditures; and • $354,000 excess over budget in Parks and Recreation expenditures.

CITY OF MONTEBELLO
MANAGEMENT'S DISCUSSION AND ANALYSIS (CONTINUED)
June 30, 2010
- 13 -
Capital Asset and Debt Administration Capital Assets The City's investment in capital assets for its governmental- and business-type activities as of June 30, 2010 amounts to $153.1 million, net of accumulated depreciation. This investment in capital assets includes land, buildings, systems, improvements, machinery and equipment, park facilities, roads, highways, and bridges. The total increase in the City's investment in capital assets for the current fiscal year was 15.5%. The implementation of Governmental Accounting Standards Board (GASB) Statement No. 34 required the City to perform an inventory of its capital assets. The objective of this inventory was to develop cost data that could be used to comply with the infrastructure and capital asset reporting requirements. The following asset classes were inventoried:
• Sewer system, including sewer pipes, pumping stations, manholes, and laterals; • Storm drain system, including storm drain pipes, flood control channels, and catch basins; • Streets, including pavement, curbs and gutters, sidewalks, medians, greenways, block walls, and traffic
signals; • Buildings, including buildings, building remodels, building lighting systems, building equipment, and
building roofs; and • Parks, including associated structures and infrastructure assets.

CITY OF MONTEBELLO
MANAGEMENT'S DISCUSSION AND ANALYSIS (CONTINUED)
June 30, 2010
- 14 -
Capital Asset and Debt Administration (Continued) Capital Assets (Continued)
City of MontebelloSummary of Capital Assets, Net of Depreciation
For the Year Ended June 30,(in thousands)
Governmental Business-TypeActivities Activities Total
2009 20092010 Restated 2010 2009 2010 Restated
Land 8,666$ 8,666$ 6,306$ 6,307$ 14,972$ 14,973$ Rights of way 14,392 14,392 14,392 14,392 Buildings and improvements 43,073 35,959 15,954 16,323 59,027 52,282 Machinery and equipment 11,955 14,008 33,503 19,913 45,458 33,921 Infrastructure 19,296 16,986 - - 19,296 16,986
Total Net Capital Assets 97,382$ 90,011$ 55,763$ 42,543$ 153,145$ 132,554$
Major capital asset transactions during the current fiscal year included the following:
• Additions to equipment acquisitions were $12.3 million, primarily due to street improvements, the completion of construction of the City-wide communication system, vehicles, telephone equipment, and Strategic Technology Plan hardware and software.
• Major bus replacements in the Transit Department cost $16.2 million.
Additional information on the City's capital assets can be found in the Note 3 to the basic financial statements section of this report.

CITY OF MONTEBELLO
MANAGEMENT'S DISCUSSION AND ANALYSIS (CONTINUED)
June 30, 2010
- 15 -
Capital Asset and Debt Administration (Continued) Long-term Debt At the end of fiscal year 2009-2010, the City had total debt outstanding after eliminations of $125.9 million. Of this amount, $67.0 million comprises debt backed by pledged tax revenues and $58.9 million relates to revenue bond, certificates of participation, note payable, other post-employment benefit obligation, and noncurrent compensated leave. Outstanding debt is summarized below.
City of MontebelloSummary of Long-term DebtFor the Year Ended June 30,
(in thousands)
Governmental Business-TypeActivities Activities Total
2010 2009 2010 2009 2010 2009
Tax allocation bonds 67,022$ 69,300$ 67,022$ 69,300$ Certificate of participation 20,468 21,671 4,982 5,154$ 25,450 26,825 Revenue bonds, net 15,100 15,278 15,100 15,278 Other post-employment
benefit obligation 2,215 1,112 2,215 1,112 Note payable 12,253 10,753 12,253 10,753 Compensated absences 2,962 3,669 887 863 3,849 4,532
Totals 120,020$ 121,783$ 5,869$ 6,017$ 125,889$ 127,800$ Additional information on the City's long-term debt can be found in the Note 7 to the basic financial statements section of this report. Economic Factors and Next Year's Budgets and Rates
• Since 1992-1993, the State Legislature has passed legislation to reallocate funds from local government and redevelopment agencies to school districts by shifting a portion of each agency's property tax revenue, net of amount due to other taxing agencies, to school districts for deposit in the Education Revenue Augmentation Fund (ERAF). The City and Montebello Redevelopment Agency lost a combined $5.5 million in fiscal years 2009 and 2010. The City and Agency will lose a combined $1.1 million a year in fiscal year 2010-2011.

CITY OF MONTEBELLO
MANAGEMENT'S DISCUSSION AND ANALYSIS (CONTINUED)
June 30, 2010
- 16 -
Economic Factors and Next Year's Budgets and Rates (Continued) • Inflation in the region for the year ended June 30, 2010 was 0.83% in comparison with the national
index of 0.97%. • Several business development plans are underway in the City of Montebello. This positive trend in the
business market should lead to increased property and sales tax revenues to the City in the coming years.
In the South Montebello Industrial Redevelopment Project Area (SMIRP), the City and the Agency continue to pursue economic development strategies that concentrate in job creation. Some of the activities pursued within the area include the US-EPA Brownfield Pilot Grant and DTSE Target Site Investigation Grant to assess need remediation. The City's Brownfield program is intended to improve quality of life; increase property values, which results in greater property tax revenues; and encourage land uses that are the highest and best use without limitation by contamination. Additionally, the Agency continues to seek opportunities for development projects along Telegraph Road and Slauson Avenue, and throughout the SMIRP. The Agency is also exploring options to bring a Holiday Inn Express to the City. This project is still in the planning and design stage and various funding sources are being considered. The Montebello Economic Revitalization Project Area (MERP) continues to maintain a high level of activity. Chief among its activities is the publication of the Whittier Boulevard Corridor Development Code to facilitate mixed-use development, including urban housing and transit-oriented development, in the City's downtown corridor. The Agency has also implemented a streetscape program on Whittier Boulevard that includes sidewalks, landscape, and irrigation improvements, the installation of street furniture such as bicycle racks, tree grates and guards, pavers, and exterior lighting on Whittier Boulevard between 4th Street and the easterly City limits. Other activities within the MERP include request for proposals to develop property at 701-705 West Whittier Boulevard with a desirable restaurant tenant, and explore development opportunities on Whittier Boulevard at 5th and 6th Streets and at 18th and 19th Streets. These activities are strategically implemented to eliminate blight, enhance quality of life, and generate greater property tax and sales tax revenues.

CITY OF MONTEBELLO
MANAGEMENT'S DISCUSSION AND ANALYSIS (CONTINUED)
June 30, 2010
- 17 -
Economic Factors and Next Year's Budgets and Rates (Continued) The City's Montebello Hills Redevelopment Project Area (MHRP) has historically yielded the greatest tax increment revenues for the Agency and sales tax revenues for the State and City. The City is in the midst of reviewing the Draft Montebello Hills Specific Plan and the corresponding Draft Environmental Impact Report for the Montebello Hills Specific Plan as well as corresponding public comments. The Montebello Hills Specific Plan proposes to develop 1,200 housing units and several acres of open space in the MHRP and would generate property tax and sales tax revenues. The City also continues to seek opportunities to enhance the regional shopping center in the MHRP and is currently working with Costco to pursue the construction of a gas station on the Costco site to generate revenue for Costco and additional tax revenues for the State and the City.
• A constitutional amendment (Proposition 1A), passed by State voters on November 2, 2004, limits the amount the State can reduce revenues to local governments in 2009 and future years.
• Retirement and health benefit costs will continue to increase as the City's PERS rate increases due to
actuarial data and investment rate changes. Requests for Information This financial report is designed to provide a general overview of the City's finances for all those with an interest in the government's finances. Questions concerning any of the information provided in this report or requests for additional financial information should be addressed to the Finance Department, 1600 W. Beverly Blvd., Montebello, CA 90640.

- 18 -
THIS PAGE LEFT INTENTIONALLY BLANK
- 19 -
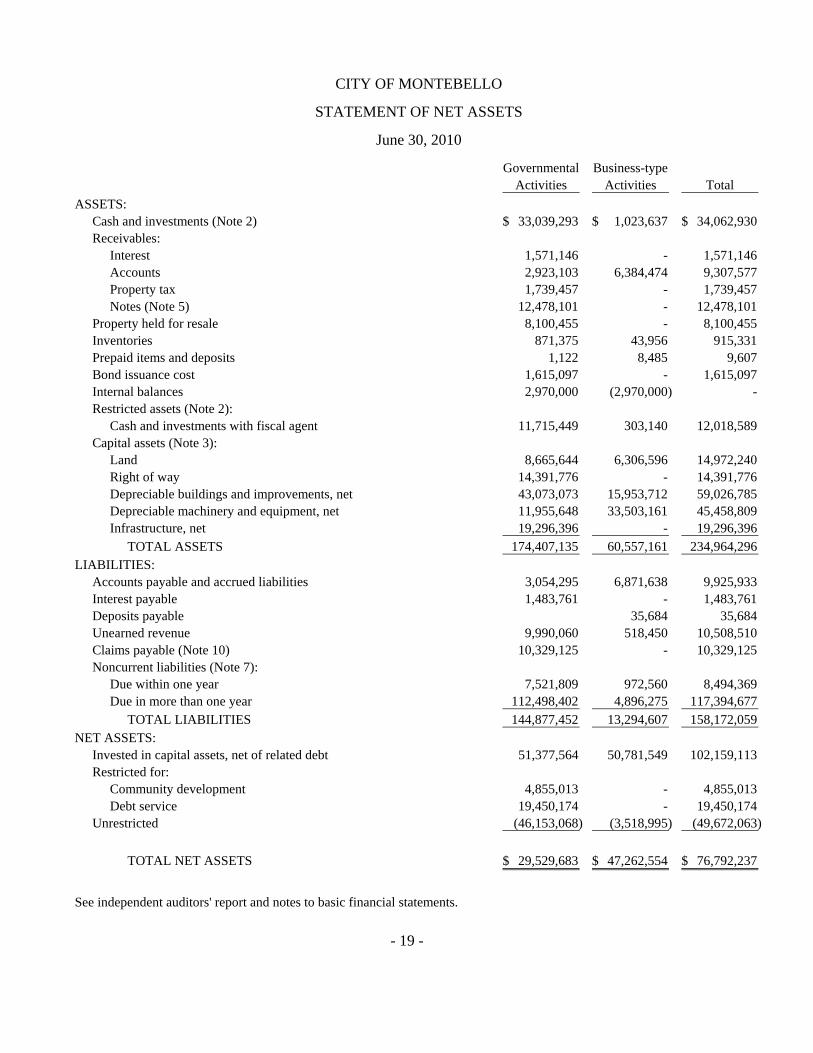
CITY OF MONTEBELLO
STATEMENT OF NET ASSETS
June 30, 2010
Governmental Business-typeActivities Activities Total
ASSETS:Cash and investments (Note 2) 33,039,293$ 1,023,637$ 34,062,930$ Receivables:
Interest 1,571,146 - 1,571,146 Accounts 2,923,103 6,384,474 9,307,577 Property tax 1,739,457 - 1,739,457 Notes (Note 5) 12,478,101 - 12,478,101
Property held for resale 8,100,455 - 8,100,455 Inventories 871,375 43,956 915,331 Prepaid items and deposits 1,122 8,485 9,607 Bond issuance cost 1,615,097 - 1,615,097 Internal balances 2,970,000 (2,970,000) - Restricted assets (Note 2):
Cash and investments with fiscal agent 11,715,449 303,140 12,018,589 Capital assets (Note 3):
Land 8,665,644 6,306,596 14,972,240 Right of way 14,391,776 - 14,391,776 Depreciable buildings and improvements, net 43,073,073 15,953,712 59,026,785 Depreciable machinery and equipment, net 11,955,648 33,503,161 45,458,809 Infrastructure, net 19,296,396 - 19,296,396
TOTAL ASSETS 174,407,135 60,557,161 234,964,296 LIABILITIES:
Accounts payable and accrued liabilities 3,054,295 6,871,638 9,925,933 Interest payable 1,483,761 - 1,483,761 Deposits payable 35,684 35,684 Unearned revenue 9,990,060 518,450 10,508,510 Claims payable (Note 10) 10,329,125 - 10,329,125 Noncurrent liabilities (Note 7):
Due within one year 7,521,809 972,560 8,494,369 Due in more than one year 112,498,402 4,896,275 117,394,677
TOTAL LIABILITIES 144,877,452 13,294,607 158,172,059 NET ASSETS:
Invested in capital assets, net of related debt 51,377,564 50,781,549 102,159,113 Restricted for:
Community development 4,855,013 - 4,855,013 Debt service 19,450,174 - 19,450,174
Unrestricted (46,153,068) (3,518,995) (49,672,063)
TOTAL NET ASSETS 29,529,683$ 47,262,554$ 76,792,237$
See independent auditors' report and notes to basic financial statements.

- 20 -
CITY OF MONTEBELLO
STATEMENT OF ACTIVITIES
For the year ended June 30, 2010
Program RevenuesCharges Operating Capital
for Grants and Grants and Functions/Programs Expenses Services Contributions Contributions
PRIMARY GOVERNMENT:Government activities:
General government 5,181,691$ 3,854,697$ 208,071$ - Public safety 34,440,947 2,741,147 293,709 - Public works 5,383,610 5,059,588 4,312,630 - Parks, recreation, and culture 6,194,042 501,801 3,111 - Housing and community
development 12,479,919 - 5,012,173 - Unallocated infrastructure
depreciation 698,249 - - - Interest on long-term debt 5,072,065 - - -
Total government activities 69,450,523 12,157,233 9,829,694 -
Business-type activities:Transit 24,752,340 6,156,991 15,487,526 16,253,784$ Golf course 3,064,788 2,537,564 - - Hilton 3,509,164 3,846,393 - - Water utility 1,630,000 1,412,695 - - Detention facility 495,401 172,943 - -
Total business-type activities 33,451,693 14,126,586 15,487,526 16,253,784
TOTAL PRIMARYGOVERNMENT 102,902,216$ 26,283,819$ 25,317,220$ 16,253,784$
General revenues:Taxes:
Property taxes, levied for general purposesFranchise taxesSales taxTransient occupancy taxOther taxes
Other revenuesInvestment earnings
TransfersTotal general revenues and transfers
Change in net assets
Net assets - Beginning of year, as restated (Note 15)
Net assets - End of year
See independent auditors' report and notes to basic financial statements.
- 21 -
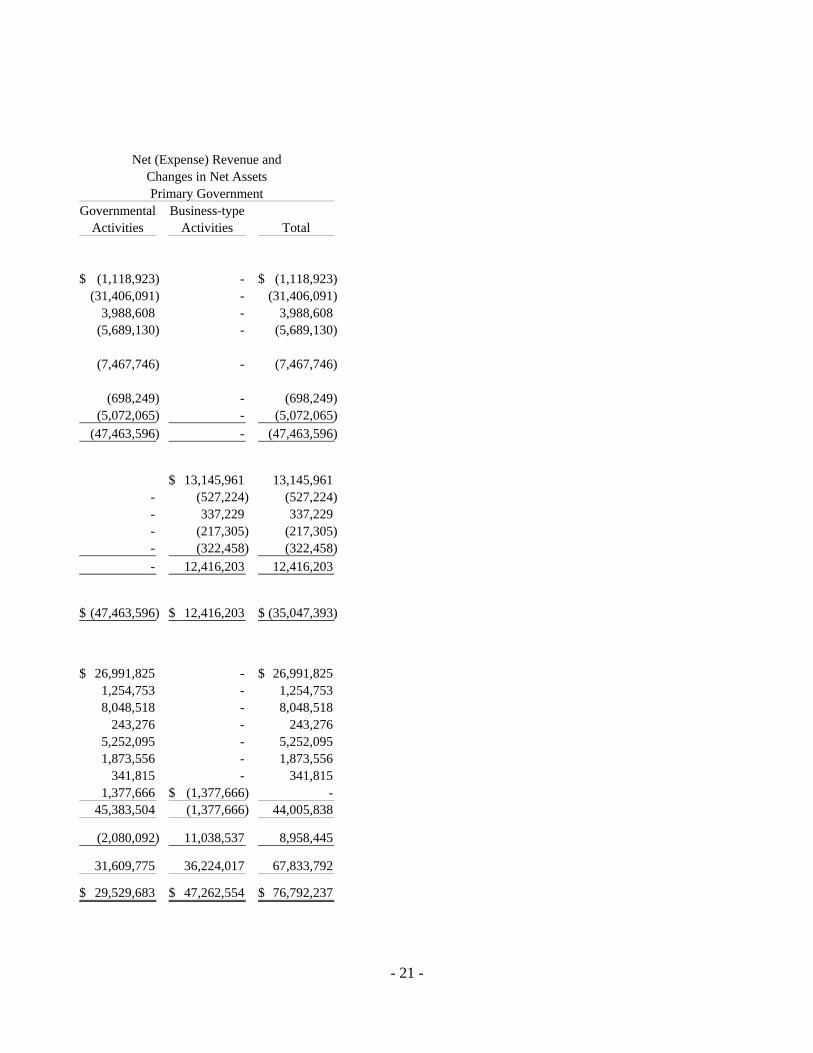
Net (Expense) Revenue andChanges in Net AssetsPrimary Government
Governmental Business-typeActivities Activities Total
(1,118,923)$ - (1,118,923)$ (31,406,091) - (31,406,091)
3,988,608 - 3,988,608 (5,689,130) - (5,689,130)
(7,467,746) - (7,467,746)
(698,249) - (698,249) (5,072,065) - (5,072,065)
(47,463,596) - (47,463,596)
13,145,961$ 13,145,961 - (527,224) (527,224) - 337,229 337,229 - (217,305) (217,305) - (322,458) (322,458) - 12,416,203 12,416,203
(47,463,596)$ 12,416,203$ (35,047,393)$
26,991,825$ - 26,991,825$ 1,254,753 - 1,254,753 8,048,518 - 8,048,518
243,276 - 243,276 5,252,095 - 5,252,095 1,873,556 - 1,873,556
341,815 - 341,815 1,377,666 (1,377,666)$ -
45,383,504 (1,377,666) 44,005,838
(2,080,092) 11,038,537 8,958,445
31,609,775 36,224,017 67,833,792
29,529,683$ 47,262,554$ 76,792,237$
- 22 -
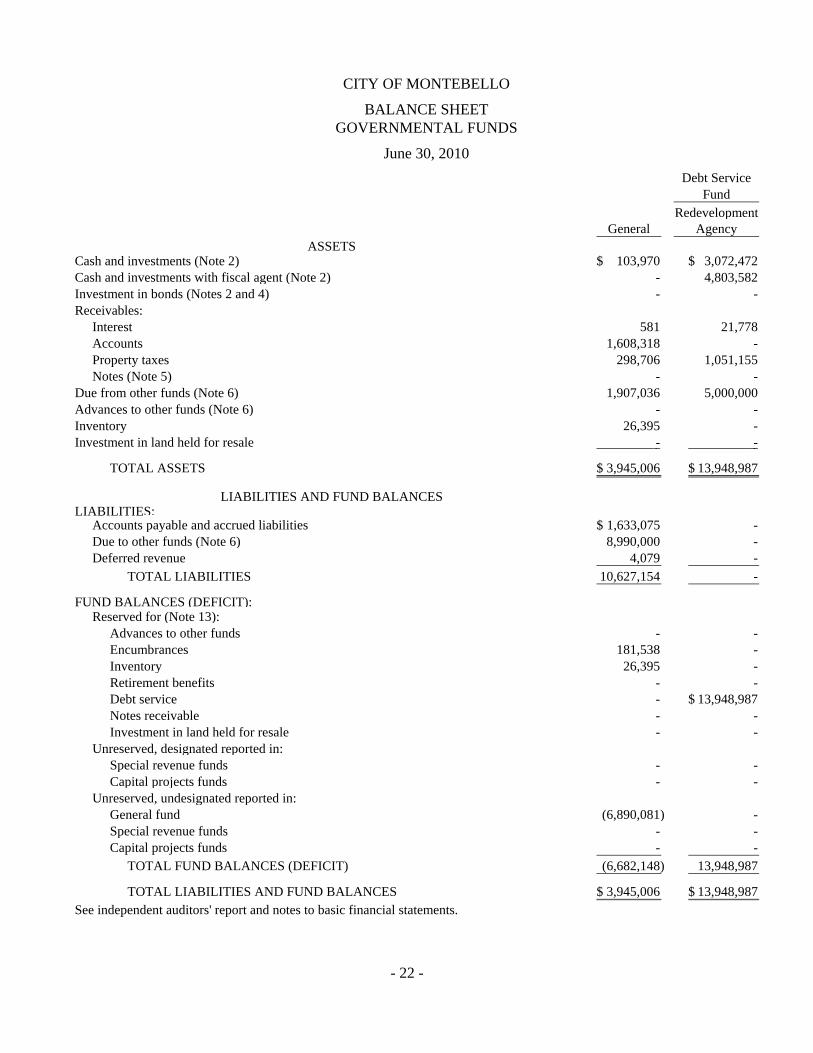
CITY OF MONTEBELLO
BALANCE SHEETGOVERNMENTAL FUNDS
June 30, 2010
Debt ServiceFund
RedevelopmentGeneral Agency
ASSETSCash and investments (Note 2) 103,970$ 3,072,472$ Cash and investments with fiscal agent (Note 2) - 4,803,582 Investment in bonds (Notes 2 and 4) - - Receivables:
Interest 581 21,778 Accounts 1,608,318 - Property taxes 298,706 1,051,155 Notes (Note 5) - -
Due from other funds (Note 6) 1,907,036 5,000,000 Advances to other funds (Note 6) - - Inventory 26,395 - Investment in land held for resale - -
TOTAL ASSETS 3,945,006$ 13,948,987$
LIABILITIES AND FUND BALANCESLIABILITIES:
Accounts payable and accrued liabilities 1,633,075$ - Due to other funds (Note 6) 8,990,000 - Deferred revenue 4,079 -
TOTAL LIABILITIES 10,627,154 -
FUND BALANCES (DEFICIT):Reserved for (Note 13):
Advances to other funds - - Encumbrances 181,538 - Inventory 26,395 - Retirement benefits - - Debt service - 13,948,987$Notes receivable - - Investment in land held for resale - -
Unreserved, designated reported in:Special revenue funds - - Capital projects funds - -
Unreserved, undesignated reported in:General fund (6,890,081) - Special revenue funds - - Capital projects funds - -
TOTAL FUND BALANCES (DEFICIT) (6,682,148) 13,948,987
TOTAL LIABILITIES AND FUND BALANCES 3,945,006$ 13,948,987$ See independent auditors' report and notes to basic financial statements.

- 23 -
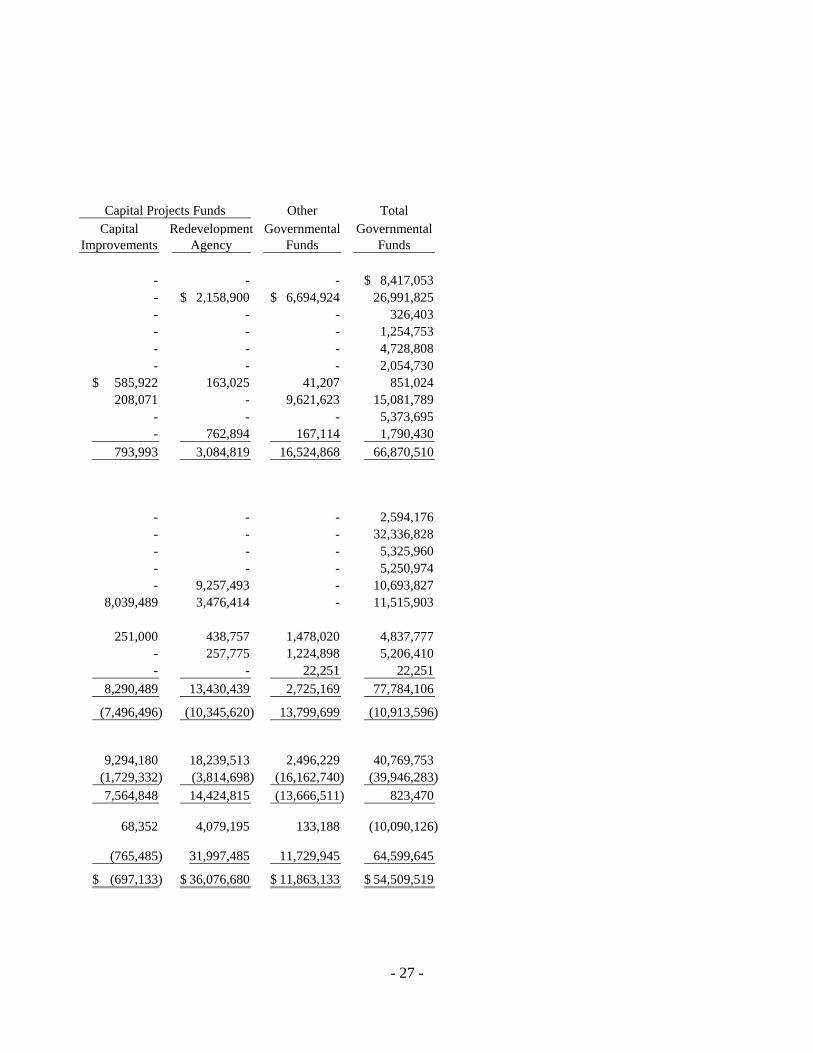
Capital Projects Funds Other Total
Capital Redevelopment Governmental GovernmentalImprovements Agency Funds Funds
72,187$ 28,872,292$ 792,108$ 32,913,029$- 3,651 6,908,216 11,715,449
4,757,015 - - 4,757,015
- 1,548,787 - 1,571,146 - 23,099 1,063,686 2,695,103 - 110,983 278,613 1,739,457
1,300,000 10,132,367 1,045,734 12,478,101 1,000,000 - 5,430,000 13,337,036
- 2,000,000 - 2,000,000 - - - 26,395
247,228 7,853,227 - 8,100,455
7,376,430$ 50,544,406$ 15,518,357$ 91,333,186$
1,063,563$ 103,477$ 151$ 2,800,266$ 5,710,000 6,907,037 900,000 22,507,037 1,300,000 7,457,212 2,755,073 11,516,364 8,073,563 14,467,726 3,655,224 36,823,667
- 2,000,000 - 2,000,000 220,156 1,072,557 - 1,474,251
- - - 26,395 - - 23,172 23,172 - - 6,984,948 20,933,935 - 4,226,459 - 4,226,459
247,228 7,853,227 - 8,100,455
- - 1,938,666 1,938,666 - 20,924,437 - 20,924,437
- - - (6,890,081) - - 2,916,347 2,916,347
(1,164,517) - - (1,164,517) (697,133) 36,076,680 11,863,133 54,509,519
7,376,430$ 50,544,406$ 15,518,357$ 91,333,186$

- 24 -
THIS PAGE LEFT INTENTIONALLY BLANK

- 25 -
CITY OF MONTEBELLO
RECONCILIATION OF THE GOVERNMENTAL FUNDSBALANCE SHEET TO THE STATEMENT OF NET ASSETS
June 30, 2010
Fund balance - total governmental funds 54,509,519$
Amounts reported for governmental activities in the Statement of Net Assets aredifferent because:
Capital assets used in governmental activities are not current financial resourcesand, therefore, are not reported in the governmental fund balance sheet. 97,257,329
Long-term assets are not available as current resources, therefore, are reportedas deferred in the governmental funds:
Accounts receivable 218,000
Long-term liabilities and related items are not due and payable in the current periodand, therefore, are not reported in the governmental funds. Bond issuance costsare not current financial resources and are not reported in the governmental funds.Balances at June 30, 2010 are:
Certificates of participation (20,468,080) Tax allocation bonds (71,779,239) Revenue bonds (15,895,000) Loans payable (12,252,515) Compensated absences (2,671,347) Other post-benefit obligation (2,215,494) Bond issuance costs 1,615,097 Bond issuance discount 122,263 Deferred amount on refunding 673,596
Total long-term liabilities and related items (122,870,719)
Interest receivable, which is not considered to be available to finance currentexpenditures, is reported as unearned revenue in the governmental funds. For thegovernment-wide financial statements, this amount is recognized as the amountpertains to the current fiscal year.
Unearned revenue 1,526,304
Internal service funds are used by management to charge the costs of various Cityactivities to individual governmental and business-like funds. The assets andliabilities of the internal service funds are included in governmental activities in theStatement of Net Assets, but are not included in the governmental funds balance 373,011
Interest on long-term debt is not accrued in governmental funds, but rather isrecognized as an expenditure when due. (1,483,761)
Net assets of governmental activities 29,529,683$
See independent auditors' report and notes to basic financial statements.

- 26 -
CITY OF MONTEBELLO
STATEMENT OF REVENUES, EXPENDITURES, AND CHANGES IN FUND BALANCESGOVERNMENTAL FUNDS
For the year ended June 30, 2010
Debt ServiceFund
RedevelopmentGeneral Agency
REVENUES:Sales taxes 8,417,053$ - Property taxes 3,260,436 14,877,565$ Other taxes 326,403 - Franchise taxes 1,254,753 - Licenses and permits 4,728,808 - Fines and forfeitures 2,054,730 - Investment income 6,785 54,085Revenue from other agencies 5,252,095 - Charges for services 5,373,695 - Other revenue 860,422 -
TOTAL REVENUES 31,535,180 14,931,650
EXPENDITURES:Current:
General government 2,594,176 - Public safety 32,336,828 - Public works 5,325,960 - Parks and recreation 5,250,974 - Housing and community development 1,436,334 -
Capital outlay - - Debt service:
Principal payments - 2,670,000Interest and fees - 3,723,737Other - -
TOTAL EXPENDITURES 46,944,272 6,393,737
EXCESS OF REVENUES OVER (UNDER) EXPENDITURES (15,409,092) 8,537,913
OTHER FINANCING SOURCES (USES):Transfers in 8,726,944 2,012,887Transfers out - (18,239,513)
TOTAL OTHER FINANCING SOURCES (USES) 8,726,944 (16,226,626)
NET CHANGE IN FUND BALANCES (6,682,148) (7,688,713)
FUND BALANCES - BEGINNING OF YEAR, AS RESTATED (NOTE 15) - 21,637,700
FUND BALANCES (DEFICIT) - END OF YEAR (6,682,148)$ 13,948,987$
See independent auditors' report and notes to basic financial statements.
- 27 -
Capital Projects Funds Other Total
Capital Redevelopment Governmental GovernmentalImprovements Agency Funds Funds
- - - 8,417,053$ - 2,158,900$ 6,694,924$ 26,991,825 - - - 326,403 - - - 1,254,753 - - - 4,728,808 - - - 2,054,730
585,922$ 163,025 41,207 851,024 208,071 - 9,621,623 15,081,789
- - - 5,373,695 - 762,894 167,114 1,790,430
793,993 3,084,819 16,524,868 66,870,510
- - - 2,594,176 - - - 32,336,828 - - - 5,325,960 - - - 5,250,974 - 9,257,493 - 10,693,827
8,039,489 3,476,414 - 11,515,903
251,000 438,757 1,478,020 4,837,777 - 257,775 1,224,898 5,206,410 - - 22,251 22,251
8,290,489 13,430,439 2,725,169 77,784,106
(7,496,496) (10,345,620) 13,799,699 (10,913,596)
9,294,180 18,239,513 2,496,229 40,769,753 (1,729,332) (3,814,698) (16,162,740) (39,946,283) 7,564,848 14,424,815 (13,666,511) 823,470
68,352 4,079,195 133,188 (10,090,126)
(765,485) 31,997,485 11,729,945 64,599,645
(697,133)$ 36,076,680$ 11,863,133$ 54,509,519$

- 28 -
THIS PAGE LEFT INTENTIONALLY BLANK

- 29 -
CITY OF MONTEBELLO
RECONCILIATION OF THE STATEMENT OF REVENUES, EXPENDITURES,AND CHANGES IN FUND BALANCES OF GOVERNMENTAL FUNDS
TO THE STATEMENT OF ACTIVITIES
For the year ended June 30, 2010
Net change in fund balances - total governmental funds (10,090,126)$
Amounts reported for governmental activities in the Statement of Activities aredifferent because:
Governmental funds report capital outlays as expenditures. However, in the Statementof Activities, the cost of those assets is allocated over their estimated useful livesas depreciation expense.
Capital outlay 12,256,193$ Depreciation expense (4,883,289)
7,372,904 The issuance of long-term debt provides current financial resources to governmental
funds, while the repayment of the principal of long-term debt consumes the currentfinancial resources of governmental funds. Neither transaction, however, has anyeffect on net assets. Also, governmental funds report the effect of issuance costs,premiums, discounts, and similar items when debt is first issued, whereas theseamounts are deferred and amortized in the Statement of Activities. These amountsare the net effect of these differences in the treatment of long-term debt:
Capital accretion (392,027) Principal payments on bonds and notes 4,837,777
4,445,750 Some expenses reported in the Statement of Activities do not require the use of
current financial resources and, therefore, are not reported as expenditures ingovernmental funds.
Net change in compensated absences for the current period 674,368Net change in accrued interest for the current period 203,388 Amortization of deferred amount on refunding (88,187) Amortization of bond issuance costs (128,892) Amortization of bond discount (8,530) Current-year expense for notes payable (2,189,106) Current-year expense for other post-employment benefits (1,103,636)
(2,640,595) Some revenues reported in the Statement of Activities are not considered to be
available to finance current expenditures and, therefore, are not reported asrevenues in the governmental funds:
Investment income 61,633Sales tax (368,535)
(306,902) Internal service funds are used by management to charge the costs of self-insurance
and capital replacements to individual funds. Net income of the internal servicefunds is reported with governmental activities. (1,415,320)
Correction of prior-year discrepancies in transfers between fund financial statements
and government-wide financial statements 554,197
Change in net assets of governmental activities (2,080,092)$
See independent auditors' report and notes to basic financial statements.

- 30 -
CITY OF MONTEBELLO
STATEMENT OF NET ASSETSPROPRIETARY FUNDS
June 30, 2010
Business-type ActivitiesEnterprise Funds
Golf MontebelloASSETS: Transit Course Hilton
CURRENT ASSETS:Cash and investments 581,395$ 133,033$ 247,645$ Cash and investments with fiscal agent - 303,140 - Accounts receivable 5,972,575 68,384 119,318 Due from other funds - - - Inventories - 42,358 1,598 Prepaid expenses and other current assets - - 8,485
TOTAL CURRENT ASSETS 6,553,970 546,915 377,046
NONCURRENT ASSETS:Capital assets:
Land 3,901,596 2,370,000 - Buildings and improvements 21,036,582 8,763,738 1,570,262 Machinery and equipment 51,707,181 1,867,603 - Less: Allowance for depreciation (29,283,585) (6,383,792) (185,635)
NET CAPITAL ASSETS 47,361,774 6,617,549 1,384,627
TOTAL ASSETS 53,915,744 7,164,464 1,761,673
LIABILITIES:CURRENT LIABILITIES:
Accounts payable and accrued liabilities 1,906,544 113,967 4,625,249 Due to other funds 1,000,000 1,200,000 - Deposits payable 400 400 3,209 Claims payable - - - Advances from other funds 2,000,000 - - Compensated absences 727,679 63,372 - Unearned revenue 518,450 - - Certificates of participation - 180,520 -
TOTAL CURRENT LIABILITIES 6,153,073 1,558,259 4,628,458
LONG-TERM LIABILITIES:Compensated absences 57,270 37,605 - Certificates of participation - 4,801,400 -
TOTAL LONG-TERM LIABILITIES 57,270 4,839,005 -
TOTAL LIABILITIES 6,210,343 6,397,264 4,628,458
NET ASSETS (DEFICIT):Invested in capital assets, net of related debt 47,361,774 1,635,629 1,384,627 Unrestricted 343,627 (868,429) (4,251,412)
TOTAL NET ASSETS (DEFICIT) 47,705,401$ 767,200$ (2,866,785)$
See independent auditors' report and notes to basic financial statements.

- 31 -
Business-type Activities GovernmentalEnterprise Funds (Continued) Activities
Other Total Internal Enterprise Enterprise Service
Funds Funds Funds
$ 61,564 1,023,637$ 126,264$ - 303,140 224,197 6,384,474 10,000
1,230,000 1,230,000 10,140,000 - 43,956 844,981
- 8,485 1,122
1,515,761 8,993,692 11,122,367
35,000 6,306,596 108,369 141,284 31,511,866 428,794 2,204,818 55,779,602 643,651 (1,981,583) (37,834,595) (1,055,606)
399,519 55,763,469 125,208
1,915,280 64,757,161 11,247,575
225,878 6,871,638 254,029 - 2,200,000 - 31,675 35,684 - - - 10,329,125 - 2,000,000 - 989 792,040 243,707 - 518,450 -
- 180,520 -
258,542 12,598,332 10,826,861
- 94,875 47,703 - 4,801,400 -
- 4,896,275 47,703
258,542 17,494,607 10,874,564
399,519 50,781,549 125,208 1,257,219 (3,518,995) 247,803
1,656,738$ 47,262,554$ 373,011$
- 32 -
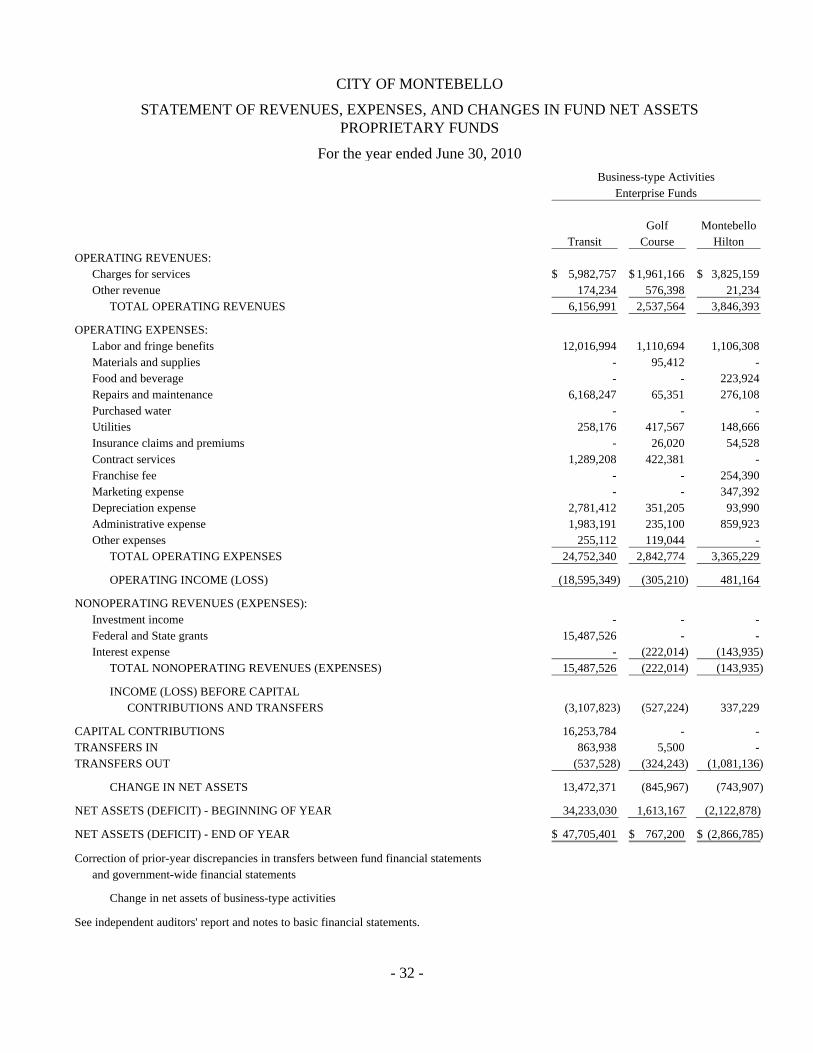
CITY OF MONTEBELLO
STATEMENT OF REVENUES, EXPENSES, AND CHANGES IN FUND NET ASSETSPROPRIETARY FUNDS
For the year ended June 30, 2010
Business-type ActivitiesEnterprise Funds
Golf MontebelloTransit Course Hilton
OPERATING REVENUES:Charges for services 5,982,757$ 1,961,166$ 3,825,159$ Other revenue 174,234 576,398 21,234
TOTAL OPERATING REVENUES 6,156,991 2,537,564 3,846,393
OPERATING EXPENSES:Labor and fringe benefits 12,016,994 1,110,694 1,106,308 Materials and supplies - 95,412 - Food and beverage - - 223,924 Repairs and maintenance 6,168,247 65,351 276,108 Purchased water - - - Utilities 258,176 417,567 148,666 Insurance claims and premiums - 26,020 54,528 Contract services 1,289,208 422,381 - Franchise fee - - 254,390 Marketing expense - - 347,392 Depreciation expense 2,781,412 351,205 93,990 Administrative expense 1,983,191 235,100 859,923 Other expenses 255,112 119,044 -
TOTAL OPERATING EXPENSES 24,752,340 2,842,774 3,365,229
OPERATING INCOME (LOSS) (18,595,349) (305,210) 481,164
NONOPERATING REVENUES (EXPENSES):Investment income - - - Federal and State grants 15,487,526 - - Interest expense - (222,014) (143,935)
TOTAL NONOPERATING REVENUES (EXPENSES) 15,487,526 (222,014) (143,935)
INCOME (LOSS) BEFORE CAPITALCONTRIBUTIONS AND TRANSFERS (3,107,823) (527,224) 337,229
CAPITAL CONTRIBUTIONS 16,253,784 - - TRANSFERS IN 863,938 5,500 - TRANSFERS OUT (537,528) (324,243) (1,081,136)
CHANGE IN NET ASSETS 13,472,371 (845,967) (743,907)
NET ASSETS (DEFICIT) - BEGINNING OF YEAR 34,233,030 1,613,167 (2,122,878)
NET ASSETS (DEFICIT) - END OF YEAR 47,705,401$ 767,200$ (2,866,785)$
Correction of prior-year discrepancies in transfers between fund financial statementsand government-wide financial statements
Change in net assets of business-type activities
See independent auditors' report and notes to basic financial statements.
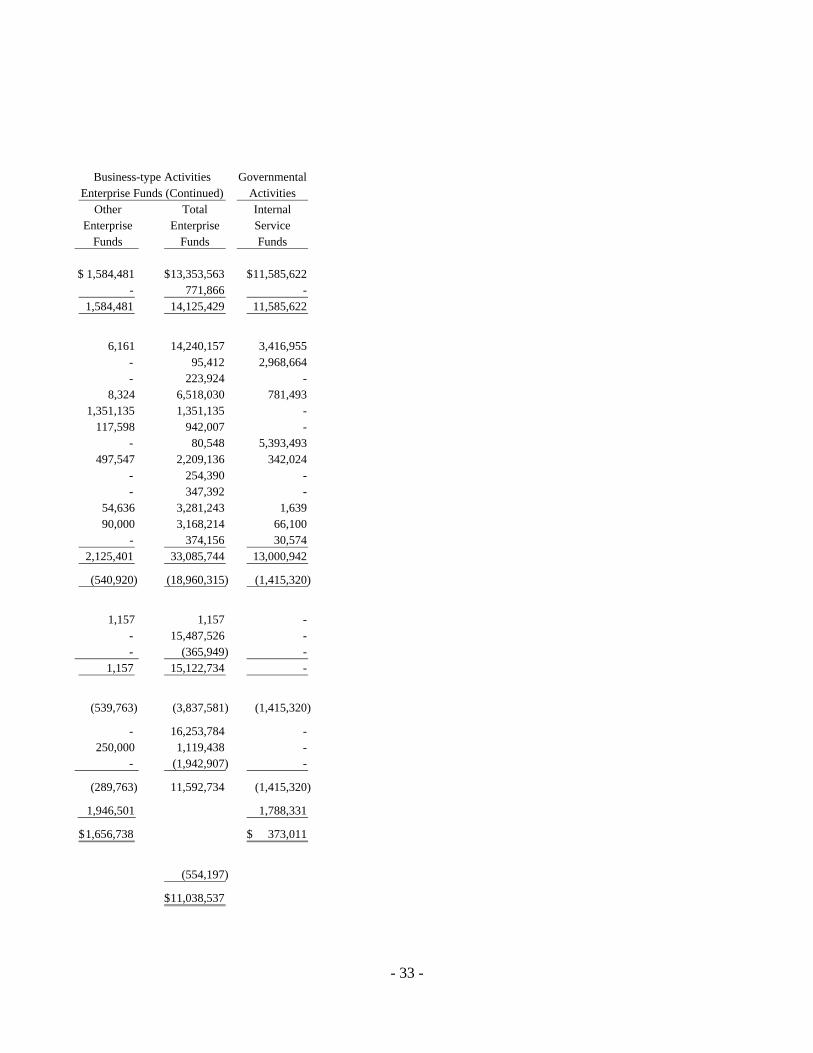
- 33 -
Business-type Activities GovernmentalEnterprise Funds (Continued) Activities
Other Total Internal Enterprise Enterprise Service
Funds Funds Funds
$ 1,584,481 13,353,563$ 11,585,622$ - 771,866 -
1,584,481 14,125,429 11,585,622
6,161 14,240,157 3,416,955 - 95,412 2,968,664 - 223,924 - 8,324 6,518,030 781,493 1,351,135 1,351,135 - 117,598 942,007 - - 80,548 5,393,493 497,547 2,209,136 342,024 - 254,390 - - 347,392 - 54,636 3,281,243 1,639 90,000 3,168,214 66,100
- 374,156 30,574 2,125,401 33,085,744 13,000,942
(540,920) (18,960,315) (1,415,320)
1,157 1,157 - - 15,487,526 - - (365,949) -
1,157 15,122,734 -
(539,763) (3,837,581) (1,415,320)
- 16,253,784 - 250,000 1,119,438 - - (1,942,907) -
(289,763) 11,592,734 (1,415,320)
1,946,501 1,788,331
1,656,738$ 373,011$
(554,197)
11,038,537$

- 34 -
CITY OF MONTEBELLO
STATEMENT OF CASH FLOWSPROPRIETARY FUNDS
For the year ended June 30, 2010
Business-type ActivitiesEnterprise Funds
Golf MontebelloTransit Course Hilton
CASH FLOWS FROM OPERATING ACTIVITIES:Receipts from customers 5,982,757$ 1,989,781$ 3,849,870$ Other receipts 174,234 576,398 21,234 Payments to suppliers (8,981,386) (1,474,898) (1,503,871) Payments to employees (12,008,595) (1,095,685) (1,105,817)
NET CASH PROVIDED (USED) BYOPERATING ACTIVITIES (14,832,990) (4,404) 1,261,416
CASH FLOWS FROM NONCAPITALFINANCING ACTIVITIES:
Operating grants received from federal and State 15,772,679 - - Cash received from other funds 863,938 1,005,500 - Cash paid to other funds (537,528) (324,243) (1,081,136)
NET CASH PROVIDED (USED) BYNONCAPITAL FINANCING ACTIVITIES 16,099,089 681,257 (1,081,136)
CASH FLOWS FROM CAPITAL ANDRELATED FINANCING ACTIVITIES:
Interest paid - (222,014) (143,935) Principal paid - (171,980) - Acquisition of capital assets (16,253,784) (184,629) (63,087) Federal and State capital grants 14,793,348 - -
NET CASH PROVIDED (USED) BY CAPITAL AND RELATED FINANCING ACTIVITIES (1,460,436) (578,623) (207,022)
CASH FLOWS FROM INVESTING ACTIVITIES:Interest received - - -
NET INCREASE (DECREASE) INCASH AND CASH EQUIVALENTS (194,337) 98,230 (26,742)
CASH AND CASH EQUIVALENTS - BEGINNING OF YEAR 775,732 337,943 274,387
CASH AND CASH EQUIVALENTS - END OF YEAR 581,395$ 436,173$ 247,645$
See independent auditors' report and notes to basic financial statements.
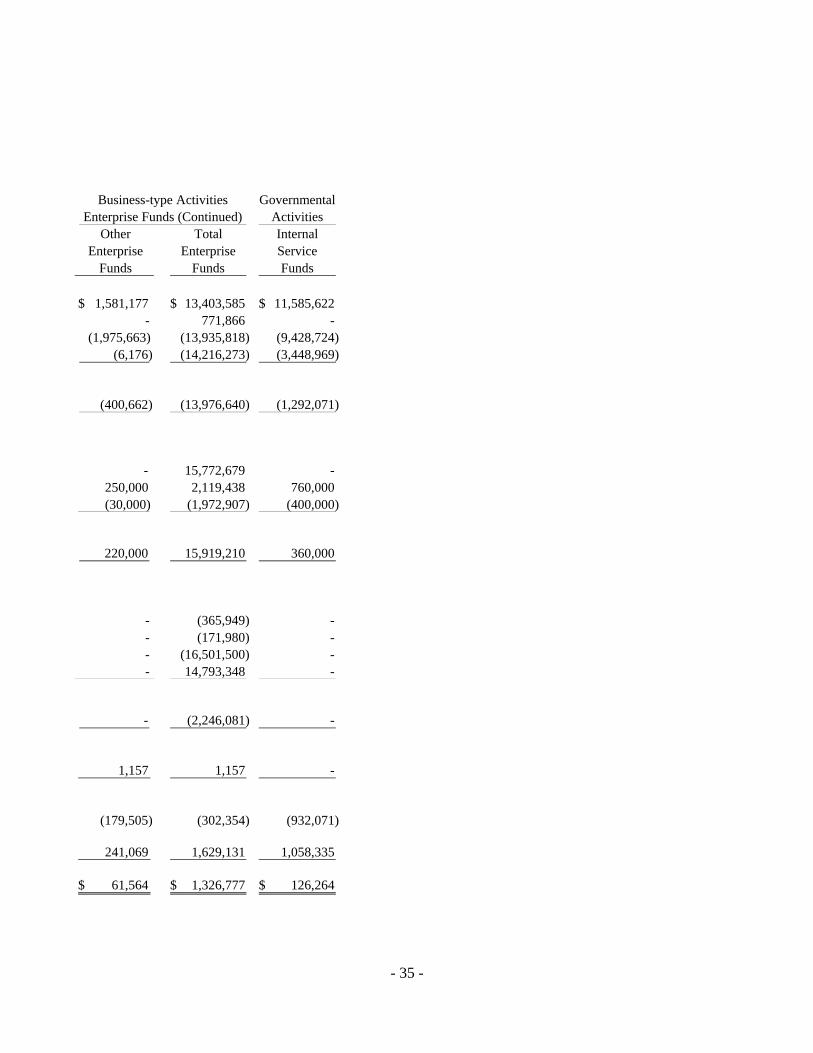
- 35 -
Business-type Activities GovernmentalEnterprise Funds (Continued) Activities
Other Total Internal Enterprise Enterprise Service
Funds Funds Funds
$ 1,581,177 13,403,585$ 11,585,622$ - 771,866 - (1,975,663) (13,935,818) (9,428,724)
(6,176) (14,216,273) (3,448,969)
(400,662) (13,976,640) (1,292,071)
- 15,772,679 - 250,000 2,119,438 760,000 (30,000) (1,972,907) (400,000)
220,000 15,919,210 360,000
- (365,949) - - (171,980) - - (16,501,500) - - 14,793,348 -
- (2,246,081) -
1,157 1,157 -
(179,505) (302,354) (932,071)
241,069 1,629,131 1,058,335
$ 61,564 1,326,777$ 126,264$

- 36 -
CITY OF MONTEBELLO
STATEMENT OF CASH FLOWSPROPRIETARY FUNDS (Continued)
For the year ended June 30, 2010
Business-type ActivitiesEnterprise Funds
Golf MontebelloTransit Course Hilton
RECONCILIATION OF OPERATING INCOME (LOSS)TO NET CASH PROVIDED (USED) BY OPERATINGACTIVITIES:
Operating income (loss) (18,595,349)$ (305,210)$ 481,164$ Depreciation and amortization 2,781,412 351,205 93,990 Changes in assets and liabilities:
(Increase) decrease in accounts receivable - 28,615 24,711 (Increase) decrease in inventories - (4,798) (817) (Increase) decrease in prepaid expenses - - 46,825 Increase (decrease) in accounts payable and
accrued liabilities including compensated absences 980,947 (74,216) 615,052 Increase (decrease) in deposits payable - - 491 Increase (decrease) in claims payable - - -
NET CASH PROVIDED (USED) BY OPERATING ACTIVITIES $ (14,832,990) $ (4,404) $ 1,261,416
See independent auditors' report and notes to basic financial statements.

- 37 -
Business-type Activities GovernmentalEnterprise Funds (Continued) Activities
Other Total Internal Enterprise Enterprise Service
Funds Funds Funds
$ (540,920) (18,960,315)$ (1,415,320)$ 54,636 3,281,243 1,639
(3,304) 50,022 - - (5,615) (267,829) - 46,825 -
88,926 1,610,709 (88,075) - 491 -
- - 477,514
$ (400,662) $ (13,976,640) (1,292,071)$

- 38 -
CITY OF MONTEBELLO
STATEMENT OF FIDUCIARY ASSETS AND LIABILITIESAGENCY FUND
June 30, 2010
DepositsAgency
FundASSETS:
Cash and investments 1,471,851$
LIABILITIES:Deposits payable 1,471,851$
See independent auditors' report and notes to basic financial statements.

See independent auditors' report - 39 -
CITY OF MONTEBELLO
NOTES TO BASIC FINANCIAL STATEMENTS
June 30, 2010 1. SUMMARY OF SIGNIFICANT ACCOUNTING POLICIES A. Description of Financial Reporting Entity
The basic financial statements of the City of Montebello include the activities of the City of Montebello (City), Montebello Redevelopment Agency (Agency), Montebello Public Improvement Corporation (MPIC), Montebello Public Financing Authority (Authority), and Water System Improvement Corporation (WSIC). The criteria used in determining the scope of the reporting entity are based on the provisions of Governmental Accounting Standards Board (GASB) Statement No. 14. The City of Montebello is the primary government unit. Component units are those entities that are financially accountable to the primary government, either because the governing board of the component units and the City are the same, or because the component unit will provide a financial benefit or impose a financial burden on the City. The City has accounted for the Agency, MPIC, the Authority, and WSIC as "blended" component units because the governing board of the component units are substantially the same as the City and the component units provide services exclusively to the City. Accordingly, these financial statements present the City and its component units, the Agency, MPIC, the Authority, and WSIC. Each blended component unit has a June 30 year-end.
The City of Montebello
The City of Montebello was incorporated on October 16, 1920 and conducts its operations as a general law, Council/Administrator City.
Montebello Redevelopment Agency
The Montebello Redevelopment Agency was formed in May 1969. The primary purpose of the Agency is to eliminate blighted areas by encouraging development of residential, commercial, industrial, recreational, and public facilities. The Agency has established three redevelopment project areas encompassing approximately 1,615 acres. The activities of the Agency are reported in the Debt Service and Capital Project Funds.
Montebello Public Improvement Corporation
The Montebello Public Improvement Corporation was formed in June 1990 as a nonprofit corporation. MPIC was formed for the purpose of acquisition and construction of various projects to be leased to the City under a Lease Agreement. The MPIC is not active.

CITY OF MONTEBELLO
NOTES TO BASIC FINANCIAL STATEMENTS (CONTINUED)
June 30, 2010
See independent auditors' report - 40 -
1. SUMMARY OF SIGNIFICANT ACCOUNTING POLICIES (CONTINUED) A. Description of Financial Reporting Entity (Continued) Montebello Public Financing Authority
The Montebello Public Financing Authority was established pursuant to a Joint Exercise of Powers Agreement, dated September 2, 1997, entered into by the City and the Agency for the purpose, among others, of issuing bonds to be used to provide financial assistance to its members. The activities of the Authority are reported in the Debt Service and Capital Projects Funds.
Water System Improvement Corporation
The Water System Improvement Corporation was formed in July 1972. The WSIC was formed for the purpose of rendering assistance to the City by leasing to the City any asset acquired or improvement to the City's Water System facilities. The WSIC is not active. Complete financial statements for the Montebello Redevelopment Agency may be obtained from the City of Montebello, Finance Department, 1600 W. Beverly Boulevard, Montebello, CA 90640. Separate financial statements are not prepared for the Montebello Public Financing Authority, Montebello Public Improvement Corporation, and the Water System Improvement Corporation.
B. Government-wide and Fund Financial Statements
The government-wide financial statements (i.e., the Statement of Net Assets and the Statement of Activities) report information about the reporting government as a whole, except for its fiduciary activities. Governmental activities, which normally are supported by taxes and intergovernmental revenues, are reported separately from business-type activities, which rely to a significant extent on fees and charges for support. Likewise, the primary government (including its blended component units) is reported separately from discretely presented component units for which the primary government is financially accountable. The City has no discretely presented component units. As a general rule, the effect of interfund activity has been eliminated from the government-wide financial statements. Exceptions to this general rule are payments-in-lieu of taxes where the amounts are reasonably equivalent in value to the interfund services provided and other charges between the government's enterprise activities and various functions of the government. Elimination of these charges would distort the direct costs and program revenues reported for the various functions concerned.

CITY OF MONTEBELLO
NOTES TO BASIC FINANCIAL STATEMENTS (CONTINUED)
June 30, 2010
See independent auditors' report - 41 -
1. SUMMARY OF SIGNIFICANT ACCOUNTING POLICIES (CONTINUED) B. Government-wide and Fund Financial Statements (Continued)
The Statement of Activities demonstrates the degree to which the direct expenses of a given function or segment are offset by program revenues. Direct expenses are those that are clearly identifiable with a specific function or segment. Program revenues include: 1) charges to customers or applicants who purchase, use, or directly benefit from goods, services, or privileges provided by a given function or segment and 2) grants and contributions that are restricted to meeting the operational or capital requirements of a particular function or segment. Taxes and other items not properly included among program revenues are reported as general revenues. The underlying accounting system of the City is organized and operated on the basis of separate funds, each of which is considered to be a separate accounting entity. The operations of each fund are accounted for with a separate set of self-balancing accounts that comprise its assets, liabilities, fund equity, revenues, and expenditures or expenses, as appropriate. Governmental resources are allocated to and accounted for in individual funds based upon the purposes for which they are to be spent and the means by which spending activities are controlled. Separate financial statements for the City's governmental, proprietary, and fiduciary funds are presented after the government-wide financial statements. These statements display information about major funds individually and other funds in the aggregate for governmental and enterprise funds. Fiduciary statements, even though excluded from the government-wide financial statements, include financial information that primarily represents assets held by the City in a custodial capacity for other individuals or organizations.
C. Measurement Focus, Basis of Accounting, and Financial Statement Presentation
The government-wide financial statements are reported using the economic resources measurement focus and the accrual basis of accounting, as are the proprietary fund financial statements. Under the economic resources measurement focus, all assets and liabilities (whether current or noncurrent) associated with their activity are included on their balance sheets. Operating statements present increases (revenues) and decreases (expenses) in total net assets. Under the accrual basis of accounting, revenues are recorded when earned and expenses are recorded when a liability is incurred, regardless of the timing of related cash flows. Proprietary funds distinguish operating revenues and expenses from nonoperating items. Operating revenues and expenses generally result from providing services and producing and delivering goods in connection with a proprietary fund's principal ongoing operations.

CITY OF MONTEBELLO
NOTES TO BASIC FINANCIAL STATEMENTS (CONTINUED)
June 30, 2010
See independent auditors' report - 42 -
1. SUMMARY OF SIGNIFICANT ACCOUNTING POLICIES (CONTINUED) C. Measurement Focus, Basis of Accounting, and Financial Statement Presentation (Continued)
Nonexchange transactions, in which the City gives (or receives) value without directly receiving (or giving) equal value in exchange include property taxes, grants, entitlements, and donations. Revenue from grants, entitlements, and donations is recognized in the fiscal year in which all the eligibility requirements have been satisfied. Operating expenses for proprietary funds include the cost of sales and services, administrative expenses, and depreciation on capital assets. All revenues and expenses not meeting this definition are reported as nonoperating revenues and expenses.
When both restricted and unrestricted resources are available for use, it is the City's policy to use restricted resources first, then unrestricted resources as they are needed. Governmental fund financial statements are reported using the current financial resources measurement focus and the modified accrual basis of accounting. Under the current financial resources measurement focus, only current assets and current liabilities are generally included on their balance sheets. The reported fund balance (net current assets) is considered to be a measure of "available spendable resources." Governmental fund operating statements present increases (revenues and other financing sources) and decreases (expenditures and other financing uses) in net current assets. Accordingly, they are said to present a summary of sources and uses of "available spendable resources" during a period. Noncurrent portions of long-term receivables due to governmental funds are reported on their balance sheets in spite of their spending measurement focus. However, special reporting treatments are used to indicate that they should not be considered "available spendable resources" since they do not represent net current assets. Recognition of governmental fund type revenue represented by noncurrent receivables is deferred until they become current receivables. Noncurrent portions of other long-term receivables are offset by fund balance reserve accounts.
Under the modified accrual basis of accounting, revenues are considered to be available when they are collectible within the current period or soon enough thereafter to pay liabilities of the current period. For this purpose, the government considers revenues to be available if they are collected within 60 days of the end of the current fiscal period. Expenditures generally are recorded when a liability is incurred, except for principal and interest on general long-term liabilities, claims and judgments, and compensated absences, which are recognized as expenditures to the extent they have matured. General capital asset acquisitions are reported as expenditures in governmental funds. Proceeds of general long-term liabilities are reported as other financing sources.

CITY OF MONTEBELLO
NOTES TO BASIC FINANCIAL STATEMENTS (CONTINUED)
June 30, 2010
See independent auditors' report - 43 -
1. SUMMARY OF SIGNIFICANT ACCOUNTING POLICIES (CONTINUED) C. Measurement Focus, Basis of Accounting, and Financial Statement Presentation (Continued)
Property taxes, franchise taxes, licenses, and interest associated with the current fiscal period are all considered to be susceptible to accrual and so have been recognized as revenues of the current fiscal period with the exception of interest not expected to be received within 60 days. Only the portion of special assessments receivable due within the current fiscal period is considered to be susceptible to accrual as revenue of the current period. All other revenue items are considered to be measurable and available only when cash is received by the City. All government-wide and business-type activities of the City follow Financial Accounting Standards Board (FASB) Statements and Interpretations issued on or before November 30, 1989, Accounting Principles Board Opinions, and Accounting Research Bulletins, unless those pronouncements conflict with GASB pronouncements.
D. Fund Classifications
The funds designated as major funds are determined by a mathematical calculation consistent with GASB Statement No. 34. The City reports the following major governmental funds: The General Fund is the primary operating fund of the City. It is used to account for all revenues and expenditures that are not required to be accounted for in another fund. The Redevelopment Agency Debt Service Fund is used to account for the accumulation of resources required for the payment of interest and principal on all Agency tax allocation bonds. The Capital Improvements Capital Projects Fund is used to account for financial resources segregated for the acquisition of major capital facilities other than those financed by proprietary funds. The Redevelopment Agency Capital Projects Fund is used to account for financial resources segregated for the acquisition of and rehabilitation of capital facilities within the redevelopment project areas.
The City reports the following major enterprise funds: The Transit Fund is used to account for all revenues and expenses related to the operations of the City's transit service.

CITY OF MONTEBELLO
NOTES TO BASIC FINANCIAL STATEMENTS (CONTINUED)
June 30, 2010
See independent auditors' report - 44 -
1. SUMMARY OF SIGNIFICANT ACCOUNTING POLICIES (CONTINUED) D. Fund Classifications (Continued)
The Golf Course Fund is used to account for all revenues and expenses related to the operations of the Montebello Municipal Golf Course. The Montebello Hilton is used to account for revenues and expenses related to the operations of the Montebello Hilton. Capital assets and related debt are not reported in the fund as any shortfall related to debt service payments are payable from tax revenues of the Montebello Redevelopment Agency. The City's fund structure also includes the following fund types: Governmental Funds:
The Special Revenue Funds are used to account for proceeds of specific revenue sources that are legally restricted or otherwise designated for specific purposes. The Debt Service Funds are used to account for the accumulation of resources required for the payment of principal and interest on the City's and Authority's debt. The Capital Projects Fund is used to account for proceeds received and issuance of bonds for capital improvements. Proprietary Funds: The Enterprise Funds are used to account for operations that provide services to the general public that are financed primarily by user charges or where the periodic measurement of net increase is deemed appropriate. The Internal Service Funds are used to account for the financing of special activities that provide services within the City. These activities include vehicle, equipment, and insurance services. Fiduciary Fund: The Agency Fund is used to account for the resources (deposits) held by the City in a fiduciary capacity for individuals, governmental entities, and others.

CITY OF MONTEBELLO
NOTES TO BASIC FINANCIAL STATEMENTS (CONTINUED)
June 30, 2010
See independent auditors' report - 45 -
1. SUMMARY OF SIGNIFICANT ACCOUNTING POLICIES (CONTINUED) E. Capital Assets
Capital assets (including infrastructure) are recorded at cost where historical records are available and at an estimated original cost where no historical records exist. Contributed capital assets are valued at their estimated fair market value at the date of contribution. Generally, capital asset purchases in excess of $5,000 are capitalized if they have an expected useful life of one year or more. Capital assets include additions to public domain (infrastructure), certain improvements including pavement, curb and gutter, sidewalks, traffic control devices, streetlights, sewers, bridges, and right-of-way corridors within the City. The City has valued and recorded all infrastructure asset data as of June 30, 2010. Capital assets used in operations are depreciated over their estimated useful lives using the straight-line method in the government-wide financial statements and in the fund financial statements of the proprietary funds. Depreciation is charged as an expense against operations and accumulated depreciation is reported on the respective balance sheet. The lives used for depreciation purposes of each capital asset class are:
Buildings 10 to 50 years Machinery 5 to 30 years Equipment 5 to 10 years
Infrastructure 20 to 50 years
F. Encumbrances
Encumbrance accounting for the expenditure of funds is recorded in order to indicate outstanding commitments as of June 30, 2010 and is employed in the governmental fund types. Encumbrances outstanding at year-end are reported as reservations of fund balances since they do not constitute expenditures or liabilities. These items are carried over to the subsequent year in order to complete these transactions.

CITY OF MONTEBELLO
NOTES TO BASIC FINANCIAL STATEMENTS (CONTINUED)
June 30, 2010
See independent auditors' report - 46 -
1. SUMMARY OF SIGNIFICANT ACCOUNTING POLICIES (CONTINUED) G. Cash and Cash Equivalents
For purposes of the Statement of Cash Flows the City considers all highly liquid investments with a maturity of three months or less when purchased to be cash equivalents. In addition, cash invested in the City's cash management pool is considered to be a cash equivalent.
H. Investments
Investments are reported at fair value, except for the investment contracts with fiscal agents and the investment in Redevelopment Agency bonds that are reported at cost because they are not transferable and they have terms that are not affected by changes in market interest rates.
I. Land Held For Resale Land held for resale is carried at the lower of cost or estimated realizable value. Fund balances are reserved in amounts equal to the carrying value of land held for resale because such assets are not available to finance the City's current operations.
J. Inventories In governmental funds, inventories are valued at cost on a first-in, first-out basis. The City follows the consumption method for inventory control. Inventory items are reported as expenditures when consumed. In proprietary funds, inventories are valued at the lower of cost or market on a first-in, first-out basis.
K. Vacation and Sick Leave Compensated absences are accounted for in accordance with GASB Code Section C60. It is the City's policy to permit employees to accumulate limited amounts of earned but unused vacation and sick leave benefits, which will be paid to employees upon separation from City service. In governmental fund types, the cost of vacation and sick leave benefits are recognized when payments are made to employees. Proprietary fund types accrue vacation and sick leave benefits in the period they are earned. The total compensated absences liability of $2,962,757 reported in the governmental activities includes $2,671,347 to be paid by governmental funds and $291,410 accrued in the internal service funds.

CITY OF MONTEBELLO
NOTES TO BASIC FINANCIAL STATEMENTS (CONTINUED)
June 30, 2010
See independent auditors' report - 47 -
1. SUMMARY OF SIGNIFICANT ACCOUNTING POLICIES (CONTINUED) L. Property Taxes
The assessment, levy, and collection of property taxes are the responsibility of the County of Los Angeles. The City records property taxes as revenue when received from the County, except at year-end, when property taxes received within 60 days are accrued as revenue. Property taxes are assessed and collected each fiscal year according to the following property tax calendar: Lien date January 1 Levy date July 1 Due date November 1 - 1st installment March 1 - 2nd installment Collection date December 10 - 1st installment April 10 - 2nd installment
M. Use of Estimates The preparation of financial statements in conformity with accounting principles generally accepted in the United States of America requires management to make estimates and assumptions that affect the reported amounts of assets and liabilities and disclosure of contingent assets and liabilities at the date of the financial statements and the reported amounts of revenues and expenditures during the reporting period. Specifically, the City has made certain estimates and assumptions relating to the collectability of its receivables (including accounts receivable and notes receivable), the valuation of property held for resale, and the ultimate outcome of claims and judgments. Actual results could differ from those estimates and assumptions.

CITY OF MONTEBELLO
NOTES TO BASIC FINANCIAL STATEMENTS (CONTINUED)
June 30, 2010
See independent auditors' report - 48 -
2. CASH AND INVESTMENTS Cash and investments at June 30, 2010 consisted of the following:
FiduciaryGovernment- Fund
Wide Statement ofStatement of Assets and Net Assets Liabilities Total
Unrestricted assets:Cash and investments 34,062,930$ 1,471,851$ 35,534,781$
Restricted assets:Cash and investments with fiscal agents 12,018,589 - 12,018,589
Total Cash and Investments 46,081,519$ 1,471,851$ 47,553,370$
Cash and investments at June 30, 2010 consisted of the following:
AmountCash on hand 13,480$ Deposits with financial institutions 2,933,561Investments 44,606,329
Total 47,553,370$

CITY OF MONTEBELLO
NOTES TO BASIC FINANCIAL STATEMENTS (CONTINUED)
June 30, 2010
See independent auditors' report - 49 -
2. CASH AND INVESTMENTS (CONTINUED) Investments Authorized by the California Government Code and the City's Investment Policy
The table below identifies the investment types that are authorized for the City by the California Government Code (or the City's investment policy, where more restrictive). The table also identifies certain provisions of the California Government Code (or the City's investment policy, where more restrictive) that address interest rate risk, credit risk, and concentration of credit risk. This table does not address investments of debt proceeds held by bond trustee that are governed by the provisions of debt agreements of the City, rather than the general provisions of the California Government Code or the City's investment policy.
MaximumMaximum Percentage
Authorized Investment Type Maturity of Portfolio*
United States Treasury Obligations 5 years 80%United States Government Sponsored
Enterprises Securities 365 days 50%Banker's Acceptances 180 days 40%Commercial Paper 270 days 25%Negotiable Certificates of Deposit 5 years 30%Repurchase Agreements 1 day 40%Money Market Mutual Funds (1) 15%**Certificates of Deposit (2) NoneCounty Pooled Investment Funds (1) 10%Local Agency Investment Fund (LAIF) (1) lesser of 60%
or$20,000,000
State and Local Obligations N/A 30%(1) Not applicable/on demand(2) Subject to agreement entered into with depository* - Excluding amounts held by bond trustee that are not subject to California Government Code
restrictions.** - 5% of the City's surplus funds.N/A - Not applicable

CITY OF MONTEBELLO
NOTES TO BASIC FINANCIAL STATEMENTS (CONTINUED)
June 30, 2010
See independent auditors' report - 50 -
2. CASH AND INVESTMENTS (CONTINUED)
Investments Authorized by Debt Agreements
Investments of debt proceeds held by bond trustee are governed by provisions of the debt agreements, rather than the general provisions of the California Government Code or the City's investment policy. The table below identifies the investment types that are authorized for investments held by bond trustee. The table also identifies certain provisions of these debt agreements that address interest rate risk, credit risk, and concentrations of credit risk.
Maximum MaximumMaximum Percentage Investment
Authorized Investment Type Maturity Allowed in One IssuerUnited States Treasury Obligations None None NoneUnited States Government Sponsored
Enterprises Securities None None NoneBanker's Acceptances 30 days None NoneCommercial Paper 270 days None NoneMoney Market Mutual Funds N/A None NoneInvestment Contracts 30 years None None
N/A - Not applicable

CITY OF MONTEBELLO
NOTES TO BASIC FINANCIAL STATEMENTS (CONTINUED)
June 30, 2010
See independent auditors' report - 51 -
2. CASH AND INVESTMENTS (CONTINUED) Disclosures Relating to Interest Rate Risk Interest rate risk is the risk that changes in market interest rates will adversely affect the fair value of an investment. Generally, the longer the maturity of an investment, the greater the sensitivity of its fair value to changes in market interest rates. The City does not have a formal policy to manage interest rate risk. However, one of the ways that the City manages its exposure to interest rate risk is by purchasing a combination of shorter term and longer term investments and by timing cash flows from maturities so that a portion of the portfolio is maturing or coming close to maturity evenly over time as necessary to provide the cash flow and liquidity needed for operations. Information about the sensitivity of the fair values of the City's investments (including investments held by bond trustee) to market interest rate fluctuations is provided by the following table that shows the distribution of the City's investments by maturity:
Remaining Maturity (in Months)
12 Months 13-60 More ThanInvestment Type or Less Months 60 Months Total
United States TreasuryObligations 8,997,574$ - - 8,997,574$
Local Agency InvestmentFund (LAIF) 16,783,660 - - 16,783,660
Certificates of Deposit 1,950,000 - - 1,950,000 Investment in Redevelopment
Agency (RDA) Bonds (A) - 4,757,015$ - 4,757,015 Money Market Mutual Funds 4,856,506 - - 4,856,506 Cash and investments with
fiscal agents:Investment Contracts 802,791$ 802,791 Money Market Mutual Funds 11,215,798 - - 11,215,798
Totals 43,803,538$ 4,757,015$ 802,791$ 49,363,344$
(A) Eliminated in the government-wide financial statements (Note 4).

CITY OF MONTEBELLO
NOTES TO BASIC FINANCIAL STATEMENTS (CONTINUED)
June 30, 2010
See independent auditors' report - 52 -
2. CASH AND INVESTMENTS (CONTINUED) Disclosures Relating to Credit Risk Generally, credit risk is the risk that an issuer of an investment will not fulfill its obligation to the holder of the investment. This is measured by the assignment of a rating by a nationally recognized statistical rating organization. Presented below is the minimum rating required by (where applicable) the California Government Code, the City's investment policy, or debt agreements, and the actual rating - by Standard and Poor's - as of year-end for each investment type:
Total Minimum Not Required as of Legal to be
Investment Type June 30, 2010 Rating AAA Rated UnratedUnited States Treasury N/A
Obligations 8,997,574$ N/A 8,997,574$ Local Agency
Investment Fund(LAIF) 16,783,660 N/A 16,783,660$
Certificates of Deposit 1,950,000 N/A 1,950,000 Investment in RDA
Bonds (A) 4,757,015 N/A 4,757,015 Money Market Mutual
Funds 4,856,506 A 4,856,506$ Cash and investments
with fiscal agents: Investment
Contracts 802,791 N/A 802,791 Money Market
Mutual Funds 11,215,798 A 11,215,798 -
Totals 49,363,344$ 16,072,304$ 15,704,589$ 17,586,451$
N/A - Not Applicable
(A) Eliminated in the government-wide financial statements (Note 4).

CITY OF MONTEBELLO
NOTES TO BASIC FINANCIAL STATEMENTS (CONTINUED)
June 30, 2010
See independent auditors' report - 53 -
2. CASH AND INVESTMENTS (CONTINUED) Custodial Credit Risk
Custodial credit risk for deposits is the risk that, in the event of the failure of a depository financial institution, a government will not be able to recover its deposits or will not be able to recover collateral securities that are in the possession of an outside party. The custodial credit risk for investments is the risk that, in the event of the failure of the counterparty (e.g., broker-dealer) to a transaction, a government will not be able to recover the value of its investment or collateral securities that are in the possession of another party. The California Government Code and the City's investment policy do not contain legal or policy requirements that would limit the exposure to custodial credit risk for deposits or investments, other than the following provision for deposits: The California Government Code requires that a financial institution secure deposits made by state or local governmental units by pledging securities in an undivided collateral pool held by a depository regulated under state law (unless so waived by the governmental unit). The market value of the pledged securities in the collateral pool must equal at least 110% of the total amount deposited by the public agencies. California law also allows financial institutions to secure City deposits by pledging first trust deed mortgage notes having a value of 150% of the secured public deposits. At June 30, 2010, the City deposits (bank balances) were insured by the Federal Depository Insurance Corporation up to $250,000 and the remaining balance of the deposits was collateralized as required by California Law. Investment in State Investment Pool
The City is a voluntary participant in the Local Agency Investment Fund (LAIF) that is regulated by California Government Code Section 16429 under the oversight of the Treasurer of the State of California. The fair value of the City's investment in this pool is reported in the accompanying financial statements at amounts based upon the City's pro-rata share of the fair value provided by LAIF for the entire LAIF portfolio (in relation to the amortized cost of that portfolio). The balance available for withdrawal is based on the accounting records maintained by LAIF, which are recorded on an amortized cost basis.

CITY OF MONTEBELLO
NOTES TO BASIC FINANCIAL STATEMENTS (CONTINUED)
June 30, 2010
See independent auditors' report - 54 -
3. CAPITAL ASSETS A summary of changes in the governmental activities capital assets at June 30, 2010 is as follows:
Balance at Balance atJuly 1, 2009 Additions Deletions June 30, 2010
Governmental Activities:
Capital assets, not being depreciated:Land 8,665,644$ - - 8,665,644$ Right of way 14,391,776 - - 14,391,776
Total capital assets,not being depreciated 23,057,420 - - 23,057,420
Capital assets, being depreciated:Buildings and improvements 47,501,720 8,512,495$ 56,014,215 Machinery and equipment 43,161,275 734,989 (216,730)$ 43,679,534 Infrastructure 44,287,743 3,008,709 - 47,296,452
Total capital assets,being depreciated 134,950,738 12,256,193 (216,730) 146,990,201
Less: Accumulated depreciation for:Buildings and improvements (11,542,426) (1,398,716) - (12,941,142) Machinery and equipment (29,152,653) (2,787,963) 216,730 (31,723,886) Infrastructure (27,301,807) (698,249) - (28,000,056)
Total accumulated depreciation (67,996,886) (4,884,928) 216,730 (72,665,084)
Total capital assets,being depreciated, net 66,953,852 7,371,265 - 74,325,117
Governmental activitiescapital assets, net 90,011,272$ 7,371,265$ -$ 97,382,537$

CITY OF MONTEBELLO
NOTES TO BASIC FINANCIAL STATEMENTS (CONTINUED)
June 30, 2010
See independent auditors' report - 55 -
3. CAPITAL ASSETS (CONTINUED)
A summary of changes in the business-type activities capital assets at June 30, 2010 is as follows:
Balance at Balance atJuly 1, 2009 Additions Deletions June 30, 2010
Business-type Activities:
Capital assets, not being depreciated:Land 6,306,596$ - - 6,306,596$
Total capital assets,not being depreciated 6,306,596 - - 6,306,596
Capital assets, being depreciated:Buildings and improvements 30,860,032 651,834$ - 31,511,866 Machinery and equipment 39,997,657 15,849,666 (67,721)$ 55,779,602
Total capital assets,being depreciated 70,857,689 16,501,500 (67,721) 87,291,468
Less: Accumulated depreciation for:Buildings and improvements (14,536,593) (1,021,561) - (15,558,154) Machinery and equipment (20,084,480) (2,259,682) 67,721 (22,276,441)
Total accumulated depreciation (34,621,073) (3,281,243) 67,721 (37,834,595)
Total capital assets,being depreciated, net 36,236,616 13,220,257 - 49,456,873
Business-type activitiescapital assets, net 42,543,212$ 13,220,257$ -$ 55,763,469$

CITY OF MONTEBELLO
NOTES TO BASIC FINANCIAL STATEMENTS (CONTINUED)
June 30, 2010
See independent auditors' report - 56 -
3. CAPITAL ASSETS (CONTINUED)
Depreciation Expense:
Depreciation expense was charged to City functions/programs as follows:
AmountGeneral government 742,927$ Public safety 2,104,119 Public works 57,650 Parks, recreation, and culture 943,068 Housing and community development 337,276 Internal service funds depreciation charged
to programs based on asset usage 1,639 Allocated depreciation 4,186,679 Unallocated infrastructure depreciation 698,249
Total depreciation expense - governmental activities 4,884,928$
Depreciation expense was charged to the business-type activities as follows:
AmountTransit 2,781,412$ Golf Course 351,205 Montebello Hilton 93,990 Other programs 54,636
Total depreciation expense - business-type activities 3,281,243$

CITY OF MONTEBELLO
NOTES TO BASIC FINANCIAL STATEMENTS (CONTINUED)
June 30, 2010
See independent auditors' report - 57 -
4. INVESTMENT IN BONDS
On June 30, 1993, the Montebello Redevelopment Agency issued $12,263,133 of tax allocation bonds. The City's Capital Improvements Capital Projects Fund purchased the entire bond issue. These bonds are nonrated and were not publicly offered at the time of issuance. The City accepted these bonds, issued by the Agency, as repayment to the City for certain loans, advances, and indebtedness incurred by the Agency. These bonds could be structured so as to be marketable. Therefore, the City considers the bonds to be marketable and no reservation of fund balance will be recognized. As of June 30, 2010, $4,757,015 of the bonds are outstanding. The investment and the outstanding debt as well as interest were eliminated from the government-wide financial statements.
5. NOTES RECEIVABLE
Notes receivable at June 30, 2010 include the following:
AmountQuiet Cannon, Inc. 2,376,281$ Casa La Merced 666,308 Whittier project 629,600 Business assistance program 746,476 Home improvement loans 437,394 Montebello Downtown Plaza 5,276,308 Community Development Block Grant loans 1,045,734 HOME Program loan 1,300,000
Total 12,478,101$ A. Quiet Cannon, Inc.
The Agency leases a facility to Quiet Cannon, Inc. The Agency agreed to provide financing for the renovation and improvement of the leased facility and in return Quiet Cannon, Inc. agreed to make additional rental payments. As of June 30, 2010, $2,376,281 remains outstanding on the note receivable.

CITY OF MONTEBELLO
NOTES TO BASIC FINANCIAL STATEMENTS (CONTINUED)
June 30, 2010
See independent auditors' report - 58 -
5. NOTES RECEIVABLE (CONTINUED)
B. Casa La Merced
Casa La Merced entered into an agreement on September 24, 1985 with the Agency. The agreement with Casa La Merced was for the development of a parcel of land. Casa La Merced agreed to a note payable to the Agency for $666,308 that matures February 1, 2027. The note has a simple interest rate of 9.25% and the Agency has accrued interest revenue of $1,526,304 on the note receivable, which is recorded as deferred revenue on the balance sheet.
C. Whittier Project
In March 2000, the Agency entered into an Owner Participation Agreement with Garfield Financial Corporation (Owner) whereby the Agency is to loan the Owner money for the construction of an affordable housing project. In accordance with the agreement, the amounts disbursed shall accrue interest at the rate of 7% compounded annually. The principal and accrued interest was originally payable within two years from the effective date and was later amended to July 23, 2002. In fiscal year 2005, the terms of the note were changed to forgive the loan over a period of 99 years. The loan balance is offset by reporting deferred revenue of a similar amount. The balance of the note receivable at June 30, 2010 was $629,600.
D. Business Assistance Program
Business improvement loans were made in the current year and prior years between the Agency and local merchants. As of June 30, 2010, $746,476 remained outstanding on the business improvement loans.
E. Home Improvement Loans
During the current and prior fiscal years, the Agency made home improvement loans to low- and moderate-income households. These loans accrue interest of 4% and are payable in ten years or when the borrower sells their property, whichever comes first. The total outstanding balance as of June 30, 2010 was $437,394.

CITY OF MONTEBELLO
NOTES TO BASIC FINANCIAL STATEMENTS (CONTINUED)
June 30, 2010
See independent auditors' report - 59 -
5. NOTES RECEIVABLE (CONTINUED) F. Montebello Downtown Plaza LLC
On December 26, 2001, the Agency entered into an Owner Participation Agreement (the Agreement) with Montebello Downtown Plaza LLC (Participant) for the acquisition, development, and operation of affordable senior citizen rental units and retail commercial buildings. The Agreement was amended and restated on October 26, 2005. The amended Agreement provides that the Agency is to loan a total amount of $6,250,000 from the Low- and Moderate-Income Housing Fund for the acquisition of property and construction of affordable senior housing units only. The Participant will provide financing for costs in excess of $6,250,000. Of this amount, the Agency's balance of the loan outstanding at June 30, 2010 was $5,276,308. The loan is to be forgiven over a period of 99 years. The loan balance is offset by reporting deferred revenue of a similar amount.
G. Community Development Block Grant Loans
At June 30, 2010, loans made to individual homeowners under the Community Development Block Grant program amounted to $1,045,734. These loans are payable when the borrowers sell the property.
H. HOME Program Loan
On February 10, 2009, the City entered into a loan agreement with Ku & Associates, Inc. (Developer) whereby the City provided financial assistance of $1,300,000 in the form of a forgivable loan in exchange for housing units in the Developer's proposed multi-family housing project. The occupancy of the housing units will be restricted for very low and low income households only. The City originally received the $1,300,000 from the US Department of Housing and Urban Development under the HOME Investment Partnership (HOME) Program. The Agency's financial assistance will be secured by a lien recorded against real property the Developer purchased with the funds. In accordance with the agreement, the loan shall be repaid by the Developer as an interest-bearing loan, but if the Developer causes all housing units to adhere to affordability requirements for the period required by HOME Program regulations, the loan and all accrued interest will be forgiven.

CITY OF MONTEBELLO
NOTES TO BASIC FINANCIAL STATEMENTS (CONTINUED)
June 30, 2010
See independent auditors' report - 60 -
6. INTERFUND RECEIVABLES, PAYABLES, AND TRANSFERS
The composition of interfund balances as of June 30, 2010, is as follows:
Due To/From Other Funds:
Receivable Fund Payable Fund AmountGeneral Fund Redevelopment Agency
Capital Projects Fund 1,907,036$ Redevelopment Agency Redevelopment Agency
Debt Service Fund Capital Projects Fund 5,000,000 Capital Improvements
Capital Projects Fund Golf Course Enterprise Fund 1,000,000 Other Governmental Funds Capital Improvements
Capital Projects Fund 4,580,000 General Fund 350,000 Public Financing Authority
Capital Projects Fund 200,000 Other Governmental Funds 300,000
Other Enterprise Funds Transit Enterprise Fund 1,000,000 Golf Course Enterprise Fund 200,000 Capital Improvements
Capital Projects Fund 30,000 Internal Service Funds General Fund 8,640,000
Capital ImprovementsCapital Projects Fund 1,100,000
Public Financing AuthorityCapital Projects Fund 400,000
Total 24,707,036$

CITY OF MONTEBELLO
NOTES TO BASIC FINANCIAL STATEMENTS (CONTINUED)
June 30, 2010
See independent auditors' report - 61 -
6. INTERFUND RECEIVABLES, PAYABLES, AND TRANSFERS (CONTINUED) The City has agreements with the Agency providing for the advance of funds to finance improvements and operations relating to and within the project areas. The agreements provide for reimbursement to the City from any and all funds legally available to the Agency for such payment plus interest at 12% computed from the time of the City's advance of funds to the date of repayment by the Agency. At fiscal year-end, interest is computed for open advances from the time of the City's advance of funds. No interest was charged for the fiscal year ended June 30, 2010. At June 30, 2010, the Agency owed the City $1,907,037, which is reported in due to other funds in the Redevelopment Agency Capital Projects Fund.
The other interfund payable balances represent routine and temporary cash flow assistance until amounts receivable from the other funds are collected to pay the amounts owed.
Advances To/From Other Funds:
Payable Fund AmountRedevelopment Agency Capital Projects Fund Transit Enterprise Fund 2,000,000$
Receivable Fund
The Montebello Redevelopment Agency entered into an agreement dated June 17, 2009 to provide $2,000,000 to the City of Montebello's Transit Fund to pay for operational expenses of the Transit Fund. The advance is secured by certain property owned by the Transit Fund. The advance is for a five-year term with no interest charged for the first three years and 4% interest for the last two years of the loan.
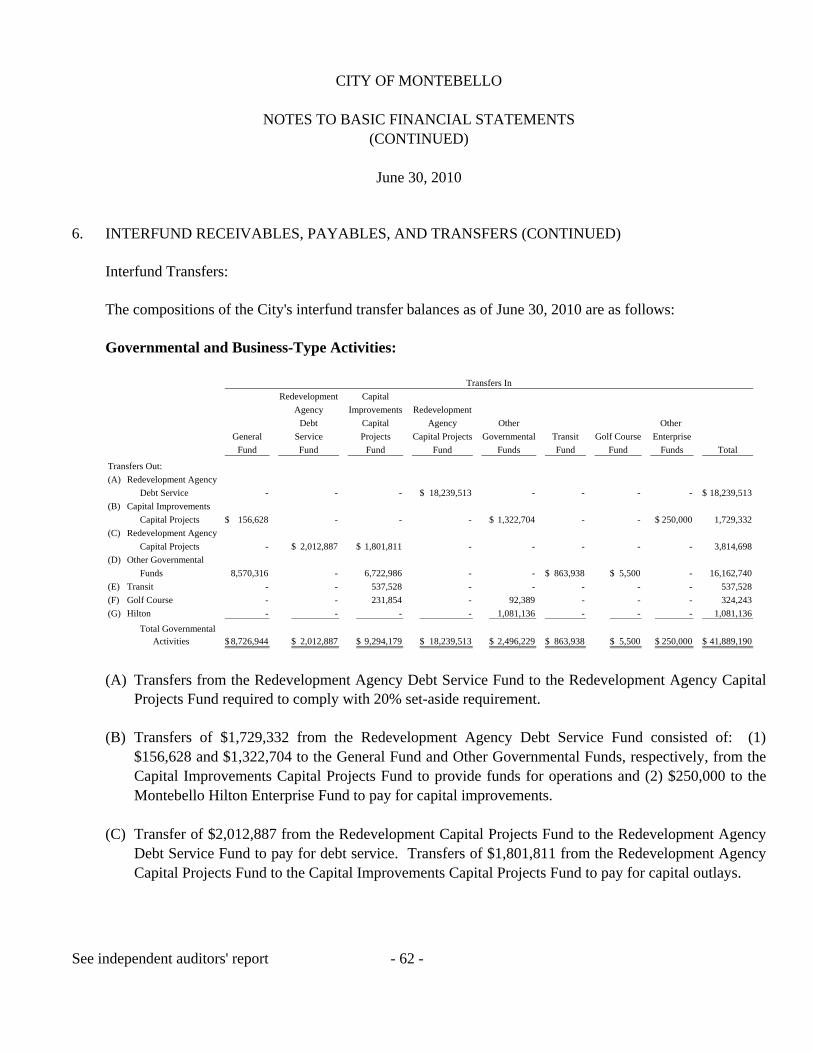
CITY OF MONTEBELLO
NOTES TO BASIC FINANCIAL STATEMENTS (CONTINUED)
June 30, 2010
See independent auditors' report - 62 -
6. INTERFUND RECEIVABLES, PAYABLES, AND TRANSFERS (CONTINUED) Interfund Transfers:
The compositions of the City's interfund transfer balances as of June 30, 2010 are as follows:
Governmental and Business-Type Activities:
Transfers In
Redevelopment Capital
Agency Improvements Redevelopment
Debt Capital Agency Other Other
General Service Projects Capital Projects Governmental Transit Golf Course Enterprise
Fund Fund Fund Fund Funds Fund Fund Funds Total
Transfers Out:
(A) Redevelopment Agency
Debt Service - - - 18,239,513$ - - - - 18,239,513$
(B) Capital Improvements
Capital Projects 156,628$ - - - 1,322,704$ - - 250,000$ 1,729,332
(C) Redevelopment Agency
Capital Projects - 2,012,887$ 1,801,811$ - - - - - 3,814,698
(D) Other Governmental
Funds 8,570,316 - 6,722,986 - - 863,938$ 5,500$ - 16,162,740
(E) Transit - - 537,528 - - - - - 537,528
(F) Golf Course - - 231,854 - 92,389 - - - 324,243
(G) Hilton - - - - 1,081,136 - - - 1,081,136
Total GovernmentalActivities 8,726,944$ 2,012,887$ 9,294,179$ 18,239,513$ 2,496,229$ 863,938$ 5,500$ 250,000$ 41,889,190$
(A) Transfers from the Redevelopment Agency Debt Service Fund to the Redevelopment Agency Capital
Projects Fund required to comply with 20% set-aside requirement.
(B) Transfers of $1,729,332 from the Redevelopment Agency Debt Service Fund consisted of: (1) $156,628 and $1,322,704 to the General Fund and Other Governmental Funds, respectively, from the Capital Improvements Capital Projects Fund to provide funds for operations and (2) $250,000 to the Montebello Hilton Enterprise Fund to pay for capital improvements.
(C) Transfer of $2,012,887 from the Redevelopment Capital Projects Fund to the Redevelopment Agency
Debt Service Fund to pay for debt service. Transfers of $1,801,811 from the Redevelopment Agency Capital Projects Fund to the Capital Improvements Capital Projects Fund to pay for capital outlays.

CITY OF MONTEBELLO
NOTES TO BASIC FINANCIAL STATEMENTS (CONTINUED)
June 30, 2010
See independent auditors' report - 63 -
6. INTERFUND RECEIVABLES, PAYABLES, AND TRANSFERS (CONTINUED)
Interfund Transfers (Continued): Governmental and Business-Type Activities (Continued):
(D) Transfers of $16,162,740 from the Other Governmental Funds consisted of: (1) $8,570,316 to the
General Fund for reimbursement of employee retirement benefits, street expenditures, and administrative expenditures; (2) $6,722,987 to the Capital Improvements Capital Projects Fund for capital expenditure reimbursement; (3) $863,938 to the Transit Enterprise Fund for capital expenditures reimbursement; and (4) $5,500 to the Golf Course Enterprise Fund to provide for operations.
(E) Transfers of $537,528 from the Transit Enterprise Fund to the Capital Improvements Capital Projects
Fund to pay for capital improvements. (F) Transfers of $324,243 from the Golf Enterprise Fund consisted of: (1) $231,854 to the Capital
Improvements Capital Projects Fund to pay for capital outlay and (2) $92,389 to the Other Governmental Funds for operating expenses.
(G) Transfers of $1,081,136 from the Hilton Fund to the Public Financing Authority to pay for debt service.

CITY OF MONTEBELLO
NOTES TO BASIC FINANCIAL STATEMENTS (CONTINUED)
June 30, 2010
See independent auditors' report - 64 -
7. LONG-TERM LIABILITIES
The following is a summary of long-term liability transactions for the year ended June 30, 2010: Governmental Activities:
Balance Balance AmountJuly 1, June 30, Due Within2009 Additions Reductions 2010 One Year
Bonds payable:Tax allocation bonds (A) 69,300,198$ 392,026$ (2,670,000)$ 67,022,224$ 2,835,000$ Revenue bonds 16,170,000 - (275,000) 15,895,000 320,000 Certificates of participation 21,671,100 - (1,203,020) 20,468,080 1,254,480
Subtotal bonds payable 107,141,298 392,026 (4,148,020) 103,385,304 4,409,480 Less: Deferred amounts:
On refunding (761,782) - 88,186 (673,596) - Issuance discounts (130,793) - 8,530 (122,263) -
Total bonds payable 106,248,723 392,026 (4,051,304) 102,589,445 4,409,480
Notes payable 10,753,166 2,189,106 (689,757) 12,252,515 2,868,622
Compensated absences 3,669,139 3,288,846 (3,995,228) 2,962,757 243,707
Other post-employmentbenefit obligation (Note 9) 1,111,858 1,295,206 (191,570) 2,215,494 -
Total governmentalactivities 121,782,886$ 7,165,184$ (8,927,859)$ 120,020,211$ 7,521,809$
(A) After the elimination of $4,757,015 Montebello Economic Revitalization Tax Allocation Bonds (Note 4)

CITY OF MONTEBELLO
NOTES TO BASIC FINANCIAL STATEMENTS (CONTINUED)
June 30, 2010
See independent auditors' report - 65 -
7. LONG-TERM LIABILITIES (CONTINUED)
Business-type Activities:
Balance Balance AmountJuly 1, June 30, Due Within2009 Additions Reductions 2010 One Year
Golf Enterprise Fund:Certificates of participation 5,153,900$ - (171,980)$ 4,981,920$ 180,520$
Compensated absences 863,523 945,501 (922,109) 886,915 792,040
Total business-typeactivities 6,017,423$ 945,501$ (1,094,089)$ 5,868,835$ 972,560$
Governmental Activities:
A. Tax Allocation Bonds
Nonhousing Tax Allocation Bonds:
Amount
4,000,000$
5,770,000
2,620,000
1,060,000
$7,160,000 1997 Montebello Hills Parity Refunding Bonds due in annualinstallments of $340,000 to $545,000 through March 1, 2019; interest rate at4.00% to 5.60%.
$7,960,000 1998 Series A Montebello Hills Refunding Bonds due in annualinstallments of $405,000 to $875,000 through March 1, 2019; interest at3.75% to 5.00%.
$4,285,000 1998 Series B Montebello Hills Taxable Tax Allocation ParityBonds due in annual installments of $205,000 to $375,000 through March 1,2019; interest at 5.50% to 6.75%.
$1,510,000 1999 Series A Montebello Hills Tax Allocation Parity Bonds duein annual installments of $50,000 to $105,000 through March 1, 2024; interestat 3.60% to 5.375%.

CITY OF MONTEBELLO
NOTES TO BASIC FINANCIAL STATEMENTS (CONTINUED)
June 30, 2010
See independent auditors' report - 66 -
7. LONG-TERM LIABILITIES (CONTINUED)
Governmental Activities (Continued):
A. Tax Allocation Bonds (Continued)
Nonhousing Tax Allocation Bonds (Continued):
Amount
5,564,022$
2,725,000
3,440,000
10,495,000
6,295,000
2,935,000
5,770,000
4,757,015
Total Nonhousing Tax Allocation Bonds 55,431,037$
$2,918,888 1999 Series B Montebello Hills Tax Allocation Parity Bondscomprised of Capital Appreciation Serial Bonds accreting semiannually;interest at 4.80% to 5.60%.
$2,905,000 2007 Series A Montebello Hills Tax Allocation Parity RefundingBonds due in annual installments of $95,000 to $440,000 through March 1,2019; interest at 3.35% to 4.00%.
$3,660,000 2007 Series B Montebello Hills Tax Allocation Parity RefundingBonds (Taxable) due in annual installments of $80,000 to $360,000 throughMarch 1, 2024; interest at 5.85%.
$10,495,000 2009 Series A Montebello Hills Tax Allocation Bonds due inannual installments of $340,000 to $1,350,000 through March 1, 2027;interest at 5.80% to 7.15%.
$8,260,000 1999 Series A South Montebello Parity Refunding Bonds due inannual installments of $345,000 to $665,000 through September 1, 2022;interest at 4.00% to 5.50%.
$4,145,000 1999 Series B South Montebello Parity Refunding Bonds due inannual installments of $165,000 to $655,000 through September 1, 2022;interest at 3.60% to 5.20%.
$6,065,000 2007 South Montebello Tax Allocation Parity Bonds, Series A(Taxable) due in annual installments of $160,000 to $675,000 throughSeptember 1, 2022; interest at 5.80%.
$4,757,015 1993 Montebello Economic Revitalization Tax Allocation Bondsdue in 2012; interest at 12%. (See Note 4).

CITY OF MONTEBELLO
NOTES TO BASIC FINANCIAL STATEMENTS (CONTINUED)
June 30, 2010
See independent auditors' report - 67 -
7. LONG-TERM LIABILITIES (CONTINUED) Governmental Activities (Continued): A. Tax Allocation Bonds (Continued)
Housing Tax Allocation Bonds Series 1997 - Series B: The Bonds are secured by incremental property taxes allocated to and received by the Agency. Interest on bonds is payable semiannually. Bonds are subject to mandatory redemption, without premium, on any interest payment date beginning September 1, 2007. 2002 Tax Allocation Parity Bonds:
The Bonds are secured by incremental property taxes allocated to and received by the Agency. Interest on bonds is payable semiannually. Bonds are subject to redemption on any interest payment date beginning September 1, 2007. The redemption prices (expressed as percentages of the principal amount of the Bonds to be redeemed) are set forth below:
RedemptionRedemption Dates Prices
September 1, 2010 and March 1, 2011 102 %September 1, 2011 and March 1, 2012 101 September 1, 2012 and thereafter 100
2007 Tax Allocation Refunding Bonds, Series A:
The Bonds are secured by incremental property taxes allocated to and received by the Agency. Interest on bonds is payable semiannually. Bonds are subject to redemption at the Agency's option on or after September 1, 2018 at a redemption price equal to the principal amount.
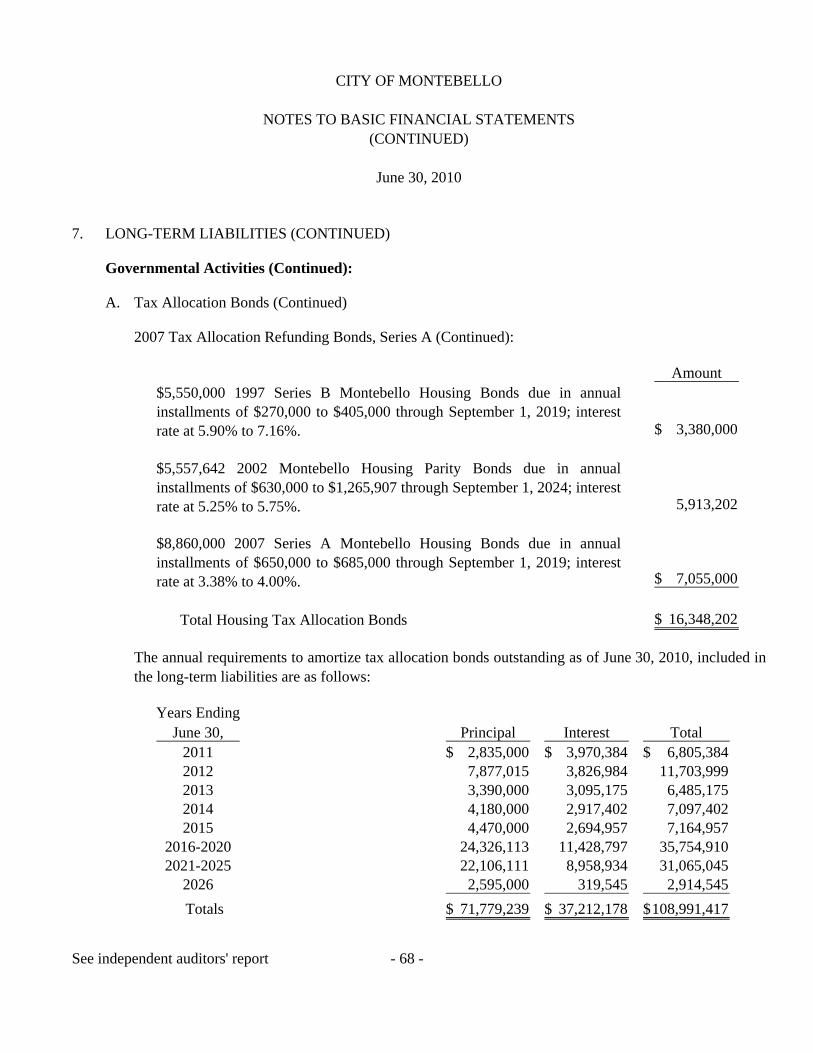
CITY OF MONTEBELLO
NOTES TO BASIC FINANCIAL STATEMENTS (CONTINUED)
June 30, 2010
See independent auditors' report - 68 -
7. LONG-TERM LIABILITIES (CONTINUED)
Governmental Activities (Continued):
A. Tax Allocation Bonds (Continued)
2007 Tax Allocation Refunding Bonds, Series A (Continued):
Amount
3,380,000$
5,913,202
7,055,000$
Total Housing Tax Allocation Bonds 16,348,202$
$5,550,000 1997 Series B Montebello Housing Bonds due in annualinstallments of $270,000 to $405,000 through September 1, 2019; interestrate at 5.90% to 7.16%.
$5,557,642 2002 Montebello Housing Parity Bonds due in annualinstallments of $630,000 to $1,265,907 through September 1, 2024; interestrate at 5.25% to 5.75%.
$8,860,000 2007 Series A Montebello Housing Bonds due in annualinstallments of $650,000 to $685,000 through September 1, 2019; interestrate at 3.38% to 4.00%.
The annual requirements to amortize tax allocation bonds outstanding as of June 30, 2010, included in the long-term liabilities are as follows:
Years EndingJune 30, Principal Interest Total
2011 2,835,000$ 3,970,384$ 6,805,384$ 2012 7,877,015 3,826,984 11,703,999 2013 3,390,000 3,095,175 6,485,175 2014 4,180,000 2,917,402 7,097,402 2015 4,470,000 2,694,957 7,164,957
2016-2020 24,326,113 11,428,797 35,754,910 2021-2025 22,106,111 8,958,934 31,065,045
2026 2,595,000 319,545 2,914,545
Totals 71,779,239$ 37,212,178$ 108,991,417$

CITY OF MONTEBELLO
NOTES TO BASIC FINANCIAL STATEMENTS (CONTINUED)
June 30, 2010
See independent auditors' report - 69 -
7. LONG-TERM LIABILITIES (CONTINUED) Governmental Activities (Continued): B. Revenue Bonds
On November 19, 2001, the Montebello Public Financing Authority (established pursuant to a joint exercise of powers agreement between the City of Montebello and the Community Redevelopment Agency of the City of Montebello) issued $15,830,000 of Revenue Bonds, Series A to: (a) finance the acquisition, construction, and equipping of a hotel facility (Project) located adjacent to the Montebello Country Club, a municipal golf course owned and operated by the City and the Quiet Cannon Restaurant and Conference Facility; (b) fund a reserve fund; (c) fund capitalized interest on the bonds through April 1, 2003; (d) fund an operating reserve; and (e) pay certain costs of issuance of the bonds. Concurrently with the issuance of the bonds, the Authority and City entered into an installment purchase agreement in which the Authority sold the Project to the City in consideration for the installment purchase payments to be made by the City in amounts sufficient to pay the debt service payments on the bonds. Pursuant to the installment purchase agreement, the City pledged all revenues received related to the ownership and operation of the hotel facility to make the installment purchase payments to the Authority for payment of the debt service. In addition, the City and the Agency have entered into a separate agreement dated November 1, 2000 in connection with the development and operation of the hotel facility. Pursuant to this agreement, the Agency has agreed to pay, solely from tax revenues from the Montebello Hills Redevelopment Project Area, any shortfall on the City's lease payments required to pay the debt service on the bonds. The hotel facility began operations in December 2002. In September 2004, the City issued $17,060,000 in Variable Rate Lease Revenue Refunding Bonds to advance refund $15,490,000 of outstanding Series 2001A Revenue Bonds as described above. The net proceeds were deposited in an irrevocable trust with an escrow agent to provide for all future debt service payments on the Series 2001A Revenue Bonds. The reacquisition price exceeded the net carrying amount by $604,199. This amount is being netted against the new debt and amortized over the remaining life of the refunded debt, which is shorter than the life of the new debt. As a result, the 2001A Revenue Bonds are considered to be defeased, and the liability for those bonds has been removed from the long-term liabilities.
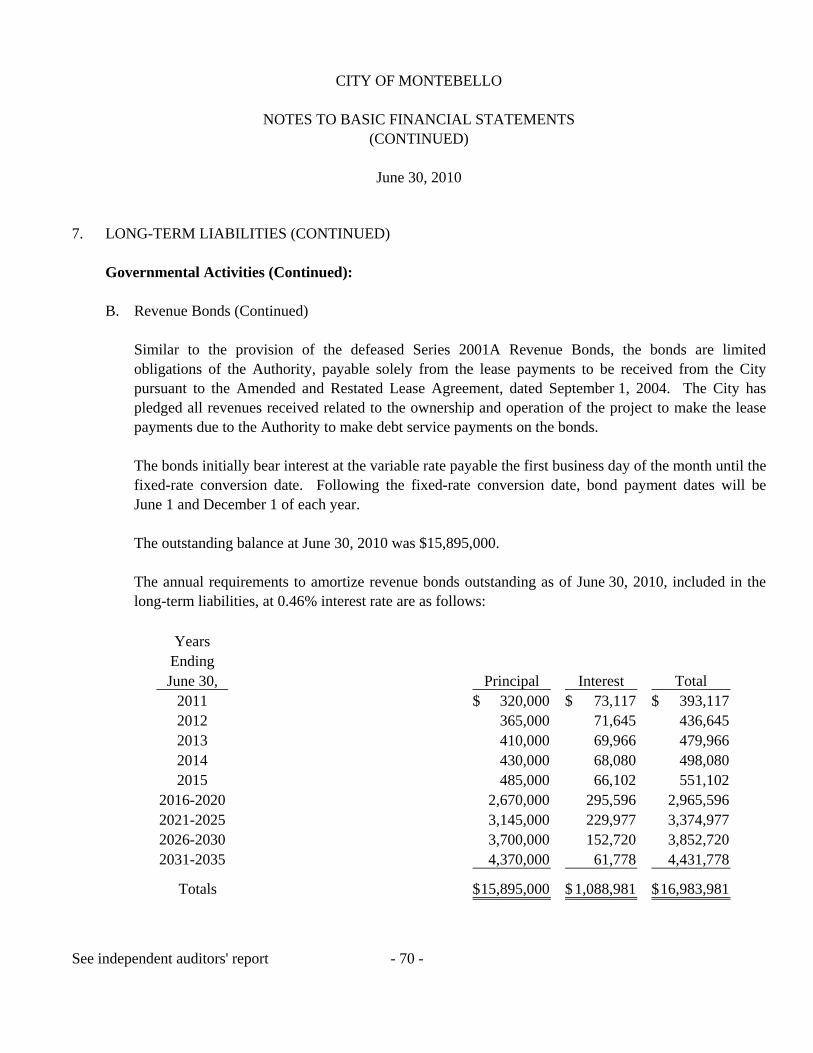
CITY OF MONTEBELLO
NOTES TO BASIC FINANCIAL STATEMENTS (CONTINUED)
June 30, 2010
See independent auditors' report - 70 -
7. LONG-TERM LIABILITIES (CONTINUED) Governmental Activities (Continued): B. Revenue Bonds (Continued)
Similar to the provision of the defeased Series 2001A Revenue Bonds, the bonds are limited obligations of the Authority, payable solely from the lease payments to be received from the City pursuant to the Amended and Restated Lease Agreement, dated September 1, 2004. The City has pledged all revenues received related to the ownership and operation of the project to make the lease payments due to the Authority to make debt service payments on the bonds. The bonds initially bear interest at the variable rate payable the first business day of the month until the fixed-rate conversion date. Following the fixed-rate conversion date, bond payment dates will be June 1 and December 1 of each year. The outstanding balance at June 30, 2010 was $15,895,000. The annual requirements to amortize revenue bonds outstanding as of June 30, 2010, included in the long-term liabilities, at 0.46% interest rate are as follows:
Years
EndingJune 30, Principal Interest Total
2011 320,000$ 73,117$ 393,117$ 2012 365,000 71,645 436,645 2013 410,000 69,966 479,966 2014 430,000 68,080 498,080 2015 485,000 66,102 551,102
2016-2020 2,670,000 295,596 2,965,596 2021-2025 3,145,000 229,977 3,374,977 2026-2030 3,700,000 152,720 3,852,720 2031-2035 4,370,000 61,778 4,431,778
Totals 15,895,000$ 1,088,981$ 16,983,981$

CITY OF MONTEBELLO
NOTES TO BASIC FINANCIAL STATEMENTS (CONTINUED)
June 30, 2010
See independent auditors' report - 71 -
7. LONG-TERM LIABILITIES (CONTINUED) Governmental Activities (Continued):
C. Certificates of Participation
2000 Certificates of Participation:
In October 2000, the Montebello Public Improvement Corporation issued $22,930,000 Certificates of Participation to refund the 1993 Certificates of Participation, acquire certain communication equipment, make a deposit to the reserve fund, and pay expenses in connection with the issuance of the Certificates. The Certificates are payable from lease payments to be made by the City to the MPIC as rental for certain public facilities consisting of a city hall, a fire station, and police facilities pursuant to a lease agreement. The City is required under the lease agreement to make payments in each fiscal year in consideration of use of the facilities from any source of available funds in an amount sufficient to pay the annual principal and interest due on the Certificates subject to abatement as described in the Certificate documents. Annual installments of $685,000 to $1,300,000 are due from November 1, 2001 through November 1, 2026. Interest rates range from 4.00% to 5.375%. The Certificates maturing on or after November 1, 2011 are subject to prepayment prior to maturity on any business day on or after November 1, 2010, as a whole or in part, in a manner determined by the City, at a prepayment price equal to the principal amount thereof to be prepaid, plus a premium (expressed as a percentage of the principal amount of Certificates to be prepaid), together with accrued interest thereon to the date fixed for prepayment as follows:
RedemptionPrepayment Dates Prices
November 1, 2010 and October 1, 2011 102 %November 1, 2011 and October 1, 2012 101 November 1, 2012 and thereafter 100
The outstanding balance at June 30, 2010 is $15,525,000.
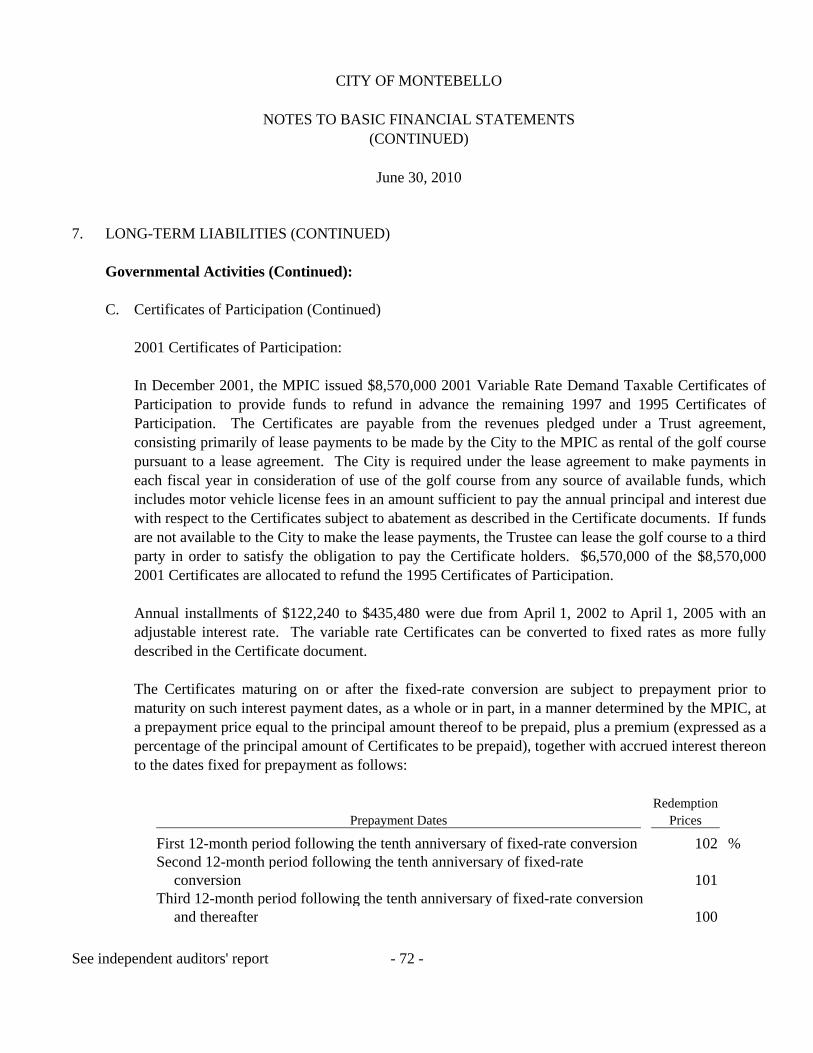
CITY OF MONTEBELLO
NOTES TO BASIC FINANCIAL STATEMENTS (CONTINUED)
June 30, 2010
See independent auditors' report - 72 -
7. LONG-TERM LIABILITIES (CONTINUED) Governmental Activities (Continued):
C. Certificates of Participation (Continued)
2001 Certificates of Participation:
In December 2001, the MPIC issued $8,570,000 2001 Variable Rate Demand Taxable Certificates of Participation to provide funds to refund in advance the remaining 1997 and 1995 Certificates of Participation. The Certificates are payable from the revenues pledged under a Trust agreement, consisting primarily of lease payments to be made by the City to the MPIC as rental of the golf course pursuant to a lease agreement. The City is required under the lease agreement to make payments in each fiscal year in consideration of use of the golf course from any source of available funds, which includes motor vehicle license fees in an amount sufficient to pay the annual principal and interest due with respect to the Certificates subject to abatement as described in the Certificate documents. If funds are not available to the City to make the lease payments, the Trustee can lease the golf course to a third party in order to satisfy the obligation to pay the Certificate holders. $6,570,000 of the $8,570,000 2001 Certificates are allocated to refund the 1995 Certificates of Participation. Annual installments of $122,240 to $435,480 were due from April 1, 2002 to April 1, 2005 with an adjustable interest rate. The variable rate Certificates can be converted to fixed rates as more fully described in the Certificate document.
The Certificates maturing on or after the fixed-rate conversion are subject to prepayment prior to maturity on such interest payment dates, as a whole or in part, in a manner determined by the MPIC, at a prepayment price equal to the principal amount thereof to be prepaid, plus a premium (expressed as a percentage of the principal amount of Certificates to be prepaid), together with accrued interest thereon to the dates fixed for prepayment as follows:
Redemption
Prepayment Dates Prices
First 12-month period following the tenth anniversary of fixed-rate conversion 102 %Second 12-month period following the tenth anniversary of fixed-rate
conversion 101 Third 12-month period following the tenth anniversary of fixed-rate conversion
and thereafter 100

CITY OF MONTEBELLO
NOTES TO BASIC FINANCIAL STATEMENTS (CONTINUED)
June 30, 2010
See independent auditors' report - 73 -
7. LONG-TERM LIABILITIES (CONTINUED) Governmental Activities (Continued):
C. Certificates of Participation (Continued)
2001 Certificates of Participation (Continued): The outstanding balance as of June 30, 2010 is $4,943,080. The annual requirements to amortize the certificates of participation outstanding as of June 30, 2010 included in the long-term liabilities are as follows:
Years Ending
June 30, Principal Interest Total2011 1,254,480$ 810,693$ 2,065,173$ 2012 862,120 772,423 1,634,543 2013 903,580 741,629 1,645,209 2014 945,040 708,715 1,653,755 2015 986,500 673,780 1,660,280
2016-2020 5,703,500 2,753,167 8,456,667 2021-2025 7,282,860 1,457,898 8,740,758 2026-2027 2,530,000 137,869 2,667,869
Totals 20,468,080$ 8,056,174$ 28,524,254$
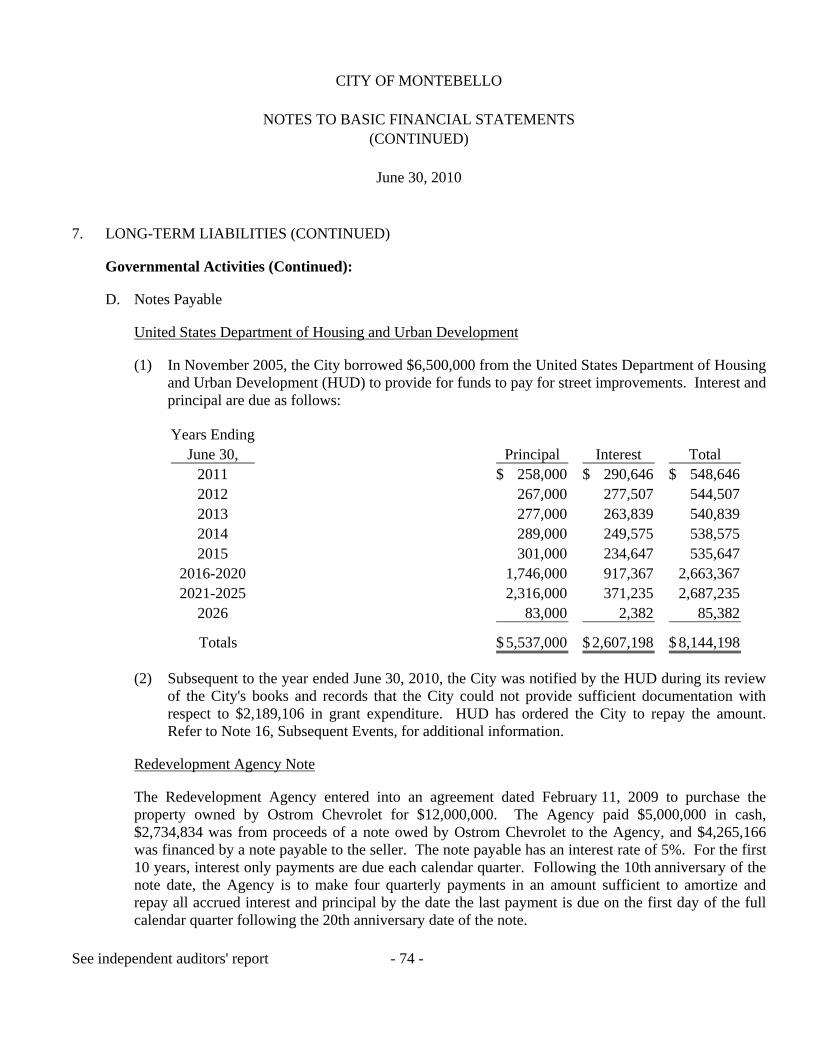
CITY OF MONTEBELLO
NOTES TO BASIC FINANCIAL STATEMENTS (CONTINUED)
June 30, 2010
See independent auditors' report - 74 -
7. LONG-TERM LIABILITIES (CONTINUED) Governmental Activities (Continued):
D. Notes Payable
United States Department of Housing and Urban Development (1) In November 2005, the City borrowed $6,500,000 from the United States Department of Housing
and Urban Development (HUD) to provide for funds to pay for street improvements. Interest and principal are due as follows:
Years EndingJune 30, Principal Interest Total
2011 258,000$ 290,646$ 548,646$ 2012 267,000 277,507 544,507 2013 277,000 263,839 540,839 2014 289,000 249,575 538,575 2015 301,000 234,647 535,647
2016-2020 1,746,000 917,367 2,663,367 2021-2025 2,316,000 371,235 2,687,235
2026 83,000 2,382 85,382
Totals 5,537,000$ 2,607,198$ 8,144,198$
(2) Subsequent to the year ended June 30, 2010, the City was notified by the HUD during its review of the City's books and records that the City could not provide sufficient documentation with respect to $2,189,106 in grant expenditure. HUD has ordered the City to repay the amount. Refer to Note 16, Subsequent Events, for additional information.
Redevelopment Agency Note
The Redevelopment Agency entered into an agreement dated February 11, 2009 to purchase the property owned by Ostrom Chevrolet for $12,000,000. The Agency paid $5,000,000 in cash, $2,734,834 was from proceeds of a note owed by Ostrom Chevrolet to the Agency, and $4,265,166 was financed by a note payable to the seller. The note payable has an interest rate of 5%. For the first 10 years, interest only payments are due each calendar quarter. Following the 10th anniversary of the note date, the Agency is to make four quarterly payments in an amount sufficient to amortize and repay all accrued interest and principal by the date the last payment is due on the first day of the full calendar quarter following the 20th anniversary date of the note.
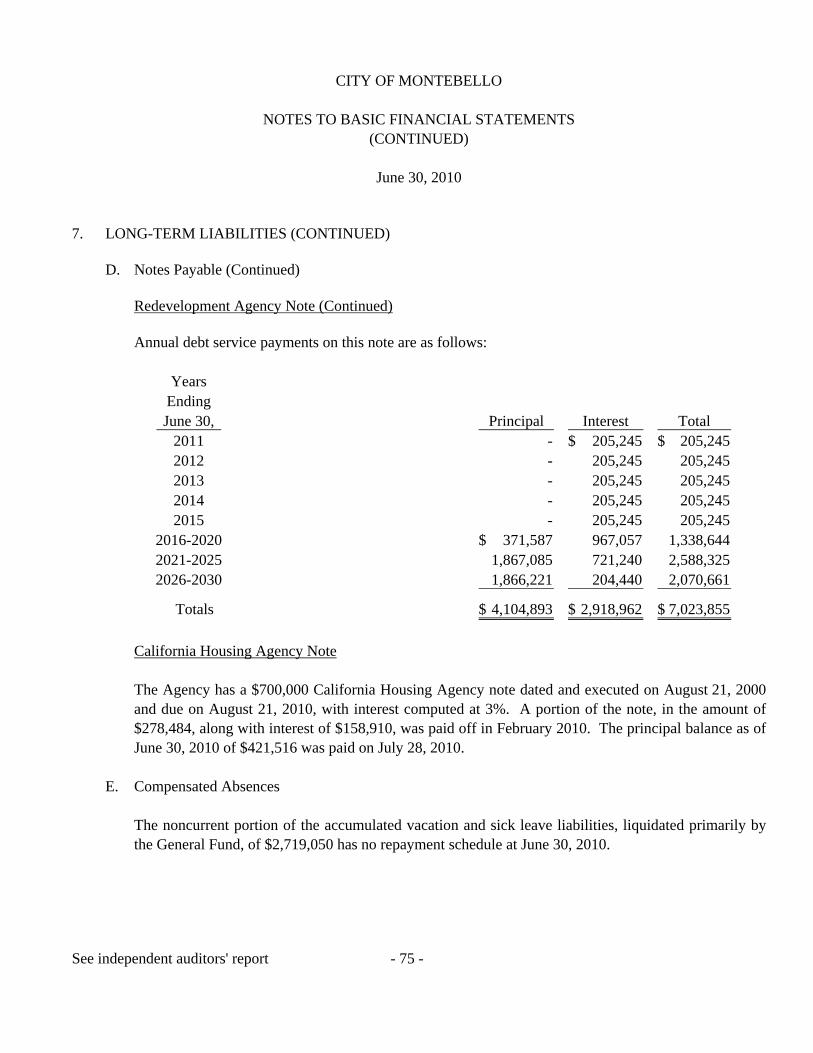
CITY OF MONTEBELLO
NOTES TO BASIC FINANCIAL STATEMENTS (CONTINUED)
June 30, 2010
See independent auditors' report - 75 -
7. LONG-TERM LIABILITIES (CONTINUED)
D. Notes Payable (Continued)
Redevelopment Agency Note (Continued) Annual debt service payments on this note are as follows:
Years
EndingJune 30, Principal Interest Total
2011 - 205,245$ 205,245$ 2012 - 205,245 205,245 2013 - 205,245 205,245 2014 - 205,245 205,245 2015 - 205,245 205,245
2016-2020 371,587$ 967,057 1,338,644 2021-2025 1,867,085 721,240 2,588,325 2026-2030 1,866,221 204,440 2,070,661
Totals 4,104,893$ 2,918,962$ 7,023,855$ California Housing Agency Note
The Agency has a $700,000 California Housing Agency note dated and executed on August 21, 2000 and due on August 21, 2010, with interest computed at 3%. A portion of the note, in the amount of $278,484, along with interest of $158,910, was paid off in February 2010. The principal balance as of June 30, 2010 of $421,516 was paid on July 28, 2010.
E. Compensated Absences
The noncurrent portion of the accumulated vacation and sick leave liabilities, liquidated primarily by the General Fund, of $2,719,050 has no repayment schedule at June 30, 2010.

CITY OF MONTEBELLO
NOTES TO BASIC FINANCIAL STATEMENTS (CONTINUED)
June 30, 2010
See independent auditors' report - 76 -
7. LONG-TERM LIABILITIES (CONTINUED)
Business-type Activities: A. 1999 Certificates of Participation
On March 30, 1999, the City of Montebello issued $4,275,000 1999 Refunding Certificates of Participation due in annual installments of $65,000 to $285,000 from April 1, 2001 to April 1, 2029 with variable interest between 4.00% to 5.625%. The purpose of the Certificates is to provide funds to prepay certain obligations of the City relating to the golf course renovation project, to make a deposit to the reserve fund and to pay the expenses incurred in connection with delivery of the Certificates. In addition, in accordance with a related lease agreement between the City and the MPIC, if the City fails to make payments on the Certificates, and motor vehicle license fees are not available, the trustee can lease the golf course property to a third party in order to satisfy the obligation to pay Certificate holders. The outstanding balance as of June 30, 2010 is $3,455,000.
B. 2001 Certificates of Participation
In December 2001, the MPIC issued $8,570,000 2001 Variable Rate Demand Taxable Certificates of Participation to provide funds to refund in advance the remaining 1997 and 1995 Certificates of Participation. The Certificates are payable from the revenues pledged under a Trust agreement, consisting primarily of lease payments to be made by the City to the MPIC as rental of the golf course pursuant to a lease agreement. The City is required under the lease agreement to make payments in each fiscal year in consideration of use of the golf course from any source of available funds, which includes motor vehicle license fees in an amount sufficient to pay the annual principal and interest due with respect to the Certificates subject to abatement as described in the Certificate documents. If funds are not available to the City to make the lease payments, the Trustee can lease the golf course to a third party in order to satisfy the obligation to pay the Certificate holders. $2,000,000 of the $8,570,000 2001 Certificates are allocated to refund the 1997 Certificates of Participation.
Annual installments of $37,760 to $134,520 are due from April 1, 2002 to April 1, 2005 with an adjustable interest rate. The variable-rate Certificates can be converted to fixed rates as more fully described in the Certificate documents.

CITY OF MONTEBELLO
NOTES TO BASIC FINANCIAL STATEMENTS (CONTINUED)
June 30, 2010
See independent auditors' report - 77 -
7. LONG-TERM LIABILITIES (CONTINUED) Business-type Activities (Continued): B. 2001 Certificates of Participation (Continued)
The Certificates maturing on or after the fixed-rate conversion are subject to prepayment prior to maturity on such interest payment dates, as a whole or in part, in a manner determined by the MPIC, at a prepayment price equal to the principal amount thereof to be prepaid, plus a premium (expressed as a percentage of the principal amount of Certificates to be prepaid), together with accrued interest thereon to the dates fixed for prepayment as follows:
Redemption
Prepayment Dates Prices
First 12-month period following the tenth anniversary of fixed-rate conversion 102 %Second 12-month period following the tenth anniversary of fixed-rate
conversion 101 Third 12-month period following the tenth anniversary of fixed-rate conversion
and thereafter 100 The outstanding balance as of June 30, 2010 is $1,526,920.

CITY OF MONTEBELLO
NOTES TO BASIC FINANCIAL STATEMENTS (CONTINUED)
June 30, 2010
See independent auditors' report - 78 -
7. LONG-TERM LIABILITIES (CONTINUED) Business-type Activities (Continued): C. Debt Service Requirements
The annual requirements to amortize the Certificates of Participation outstanding as of June 30, 2010 included in the long-term liabilities are as follows:
Years EndingJune 30, Principal Interest Total
2011 180,520$ 202,311$ 382,831$ 2012 192,880 196,067 388,947 2013 201,420 189,260 390,680 2014 209,960 182,155 392,115 2015 218,500 174,753 393,253
2016-2020 1,281,500 748,466 2,029,966 2021-2025 1,647,140 487,121 2,134,261 2026-2029 1,050,000 151,875 1,201,875
Totals 4,981,920$ 2,332,008$ 7,313,928$
D. Compensated Absences
The noncurrent portion of accumulated vacation and sick leave liability of $94,875 has no repayment schedule at June 30, 2010.
8. DEFINED BENEFIT PENSION PLAN Plan Description:
The City contributes to the California Public Employees' Retirement System (CalPERS), an agent multiple-employer public employee defined benefit pension plan. CalPERS provides retirement and disability benefits, annual cost-of-living adjustments, and death benefits to Plan members and beneficiaries. CalPERS acts as a common investment and administrative agent for participating public entities within the State of California.

CITY OF MONTEBELLO
NOTES TO BASIC FINANCIAL STATEMENTS (CONTINUED)
June 30, 2010
See independent auditors' report - 79 -
8. DEFINED BENEFIT PENSION PLAN (CONTINUED) Plan Description (Continued):
Benefit provisions and all other requirements are established by State statute and city ordinance. Copies of CalPERS' annual financial report may be obtained from their executive office: 400 P Street, Sacramento, CA 95814.
Funding Policy:
Participants are required to contribute 8% (9% for safety employees) of their annual covered salary. The City makes the contributions required of City employees on their behalf and for their account. The City is required to contribute at an actuarially determined rate. The current rates are 13.34% and 26.57% of annual covered payroll, for nonsafety and safety employees, respectively. The contribution requirements of Plan members and the City are established by, and may be amended by CalPERS.
Annual Pension Cost:
For fiscal year 2009/2010, the City's annual pension cost was $8,191,367 and the City actually contributed $8,121,901. The required contribution was determined as part of the June 30, 2008 actuarial valuation using the entry-age normal actuarial cost method. The actuarial assumptions included (a) 7.75% investment rate of return (net of administrative expenses), (b) projected annual salary increases of 3.25% to 14.45% that vary by duration of service, and (c) 2.0% per year cost-of-living adjustments. Both (a) and (b) included an inflation component of 3.0%. The actuarial value of CalPERS' assets was determined using techniques that smooth the effects of short-term volatility in the market value of investments over a four-year period (smoothed market value). CalPERS' unfunded actuarial accrued liability is being amortized as a level percentage of projected payroll on a closed basis over a 30-year period.

CITY OF MONTEBELLO
NOTES TO BASIC FINANCIAL STATEMENTS (CONTINUED)
June 30, 2010
See independent auditors' report - 80 -
8. DEFINED BENEFIT PENSION PLAN (CONTINUED) Three-Year Trend Information for CalPERS:
Schedule of Employer ContributionsMiscellaneous and Safety Employee
Fiscal Annual Pension Percentage Net PensionYear Cost (APC) APC Contributed Obligation
6/30/08 7,088,278$ 100 % - 6/30/09 8,609,524 100 % - 6/30/10 8,191,367 99 % 69,466$
Funded Status and Funding Progress for Miscellaneous Employees:
As of June 30, 2009, the most recent actuarial valuation date, the Plan was 83.7% funded. The actuarial accrued liability for benefits was $125,433,816 and the actuarial value of assets was $104,960,650, resulting in an unfunded actuarial accrued liability (UAAL) of $20,473,166. The covered payroll (annual payroll of active employees covered by the Plan) was $18,602,551 and the ratio of the UAAL to the covered payroll was 110.1%. The schedule of funding progress presented as required supplementary information, presents multi-year trend information about whether the actuarial value of Plan assets is increasing or decreasing over time relative to the actuarial accrued liability for benefits.
Funded Status and Funding Progress for Safety Employees:
As of June 30, 2009, the most recent actuarial valuation date, the Plan was 80.1% funded. The actuarial accrued liability for benefits was $167,396,133 and the actuarial value of assets was $134,012,195 resulting in an unfunded actuarial accrued liability of $33,383,938. The covered payroll (annual payroll of active employees covered by the Plan) was $12,513,128 and the ratio of the UAAL to the covered payroll was 266.8%. The schedule of funding progress presented as required supplementary information, presents multi-year trend information about whether the actuarial value of Plan assets is increasing or decreasing over time relative to the actuarial accrued liability for benefits.

CITY OF MONTEBELLO
NOTES TO BASIC FINANCIAL STATEMENTS (CONTINUED)
June 30, 2010
See independent auditors' report - 81 -
9. POST-EMPLOYMENT BENEFITS A. Plan Description
The City provides post-employment healthcare benefits to eligible employees at retirement through a single-employer defined benefit OPEB plan administered by the City. Benefit provisions are established through agreements and memorandums of agreement between the City, its management employees, and unions representing the City's employees.
Eligibility for the medical benefit requires retirement simultaneously from the City and CalPERS on or after age 50 with at least 15 consecutive years of service with the City. The City's contribution is $25 per month for each year of service up to 25 years or a maximum of $625. The City's contribution is payable for life for retirees who are members of MPOA, MPMA, and MFFA and to Medicare for all other employees. The City provides the CalPERS minimum required employer contribution ($105 per month in 2009 and indexed to medical CPI increases) for eligible retirees and surviving spouses continuing coverage in the CalPERS Health Program.
B. Funding Policy
The contribution requirements of Plan members and the City are established and may be amended by the City Council and/or the employee associations. The City is currently funding this OPEB obligation on a pay-as-you-go basis. For the year ended June 30, 2010, the City paid $191,570 in healthcare costs for its retirees and their covered dependents.
C. Annual OPEB Cost and Net OPEB Obligation
The City's annual OPEB cost (expense) is calculated based on the annual required contribution of the employer (ARC), an amount actuarially determined in accordance with parameters of GASB Statement No. 45. The ARC represents a level of funding that, if paid on an ongoing basis, is projected to cover normal cost each year and to amortize any unfunded liabilities of the Plan over a period not to exceed thirty years.

CITY OF MONTEBELLO
NOTES TO BASIC FINANCIAL STATEMENTS (CONTINUED)
June 30, 2010
See independent auditors' report - 82 -
9. POST-EMPLOYMENT BENEFITS (CONTINUED)
C. Annual OPEB Cost and Net OPEB Obligation (Continued)
The following table shows the components of the City's annual OPEB cost for the year, the amount actually contributed to the Plan, and changes in the City's net OPEB obligation to the Retiree Health Plan:
AmountAnnual required contribution 1,295,206$ Annual OPEB cost (expense) 1,295,206 Actual contributions made 191,570
Increase in net OPEB obligation 1,103,636 Net OPEB obligation - beginning of year 1,111,858
Net OPEB obligation - end of year 2,215,494$ The City's annual OPEB cost, the percentage of annual OPEB cost contributed to the plan, and the net OPEB obligation for the year ended June 30, 2010, as well as for the preceding years, was as follows:
Percentage
Fiscal Annual of Annual NetYears OPEB OPEB Cost OPEBEnded Cost Contributed Obligation
6/30/09 1,270,784$ 12.5 % 1,111,858$ 6/30/10 1,295,206 14.8 % 2,215,494

CITY OF MONTEBELLO
NOTES TO BASIC FINANCIAL STATEMENTS (CONTINUED)
June 30, 2010
See independent auditors' report - 83 -
9. POST-EMPLOYMENT BENEFITS (CONTINUED) D. Funded Status and Funding Progress
The UAAL as of July 1, 2008 amounted to $12,026,641.
AmountActuarial accrued liability (AAL) 12,026,641$ Actuarial value of Plan assets -
Unfunded actuarial accrued liability (UAAL) 12,026,641$
Funded ratio (actuarial value of Plan assets/AAL) 0%Covered payroll 57,739,000$ UAAL as a percentage of covered payroll 20.8%
E. Actuarial Methods and Assumptions
Actuarial valuations of an ongoing plan involve estimates of the value of reported amounts and assumptions about the probability of occurrence of events far into the future. Examples include assumptions about rates of employee turnover, retirement, mortality, as well as economic assumptions regarding claim costs per retiree, healthcare inflation, and interest rates. Amounts determined regarding the funded status of the plan and the annual required contributions of the employer are subject to continual revision as actual results are compared with past expectations and new estimates are made about the future. The schedule of funding progress, presented as required supplementary information following the notes to the basic financial statements, presents multi-year trend information about whether the actuarial value of plan assets is increasing or decreasing over time relative to the actuarial accrued liabilities for benefits.
Projections of benefits for financial reporting purposes are based on the substantive plan (the plan as understood by the employer and the plan members) and include the types of benefits provided at the time of each valuation and the historical pattern of sharing of benefit costs between the employer and plan members to that point. The actuarial methods and assumptions used include techniques that are designed to reduce the effects of short-term volatility in actuarial accrued liabilities and the actuarial value of assets, consistent with the long-term perspective of the calculations. In the July 1, 2008 actuarial valuation (the most current available), the entry-age normal cost method was used. The actuarial assumptions included an investment interest rate of 5.00% per year, a projected salary increase of 3.25% per annum, and a general inflation rate of 3.00% per year. The UAAL is being amortized as a level percentage of projected payroll over 30 years commencing in fiscal year 2009.

CITY OF MONTEBELLO
NOTES TO BASIC FINANCIAL STATEMENTS (CONTINUED)
June 30, 2010
See independent auditors' report - 84 -
10. SELF INSURANCE
The City provides self-insurance for general liability and workers' compensation claims. The City is partially self-insured for general liability programs. The City pays up to $1 million per occurrence and has excess insurance up to $10 million per occurrence. For workers' compensation, the City provides self-insurance up to $300,000 retention level and has acquired excess insurance coverage of $5 million for each claim. The City also purchases commercial insurance for other risks of loss, including property loss, earthquake, and vehicle physical damage. There have been no significant changes in insurance coverage as compared to last year, and the City has not experienced settlements in excess of insurance coverage during the past three fiscal years. At June 30, 2010, the present value of the estimated liability discounted at a five percent rate for claims payable is $10,329,125. The City liability for claims payable is based on an actuarial study. The liability includes an estimate for incurred, but not reported losses, and are based on past experience, modified for current trends and information.
2010 2009Insurance Claims Payable:
Claims payable at July 1 9,851,611$ 9,822,927$ Claims incurred during the fiscal year 4,672,101 4,214,368 Payments on claims during the fiscal year (4,194,587) (4,185,684)
Claims Payable at June 30 10,329,125$ 9,851,611$ There are no liabilities for which annuity contracts have been purchased in the claimant's names and for which the related liabilities have been removed from the balance sheet.
11. REQUIRED INDIVIDUAL FUND DISCLOSURES A. Deficity Fund Equity
The General Fund has a deficit of $6,682,148 and the Capital Improvements Capital Projects Fund has a deficit of $697,133. The City is currently working on a recovery plan that includes cost reduction and additional revenue options. A formal plan to eliminate the fund balance deficits is still being formulated and discussed. Council is conducting public meetings, on a weekly and on-going basis, to address the fund balance deficits. The City is also working with employees and its associations with respect to benefits including, but not limited to, the employee share of contributions to the pension plan.

CITY OF MONTEBELLO
NOTES TO BASIC FINANCIAL STATEMENTS (CONTINUED)
June 30, 2010
See independent auditors' report - 85 -
11. REQUIRED INDIVIDUAL FUND DISCLOSURES (CONTINUED) A. Deficit Fund Equity (Continued)
The Montebello Hilton Enterprise Fund (Hotel) has a net asset deficit of $2,866,785. The operating revenues are pledged for payment of debt service on the 2004 Revenue Bonds (see Note 7b). Since the Hotel started operations, cash flow has not been sufficient to pay all the debt service and the City has funded the difference to make the annual debt service payments. Under an agreement between the City and the management company of the Hotel, an annual management fee is to be paid unless cash flow is not sufficient to pay the debt service. If the cash flow is not sufficient, the management fee accrues and is to be paid at the end of the agreement. At June 30, 2010, $4,498,180 of the accounts payable and accrued liabilities is owed to the management company for the accumulated management fees and related items. The City will be required to pay this amount, which will remove the deficit. The Self-Insurance Internal Service Fund has a net asset deficit of $1,540,308. The deficit will be eliminated by future revenues or transfers from other funds.
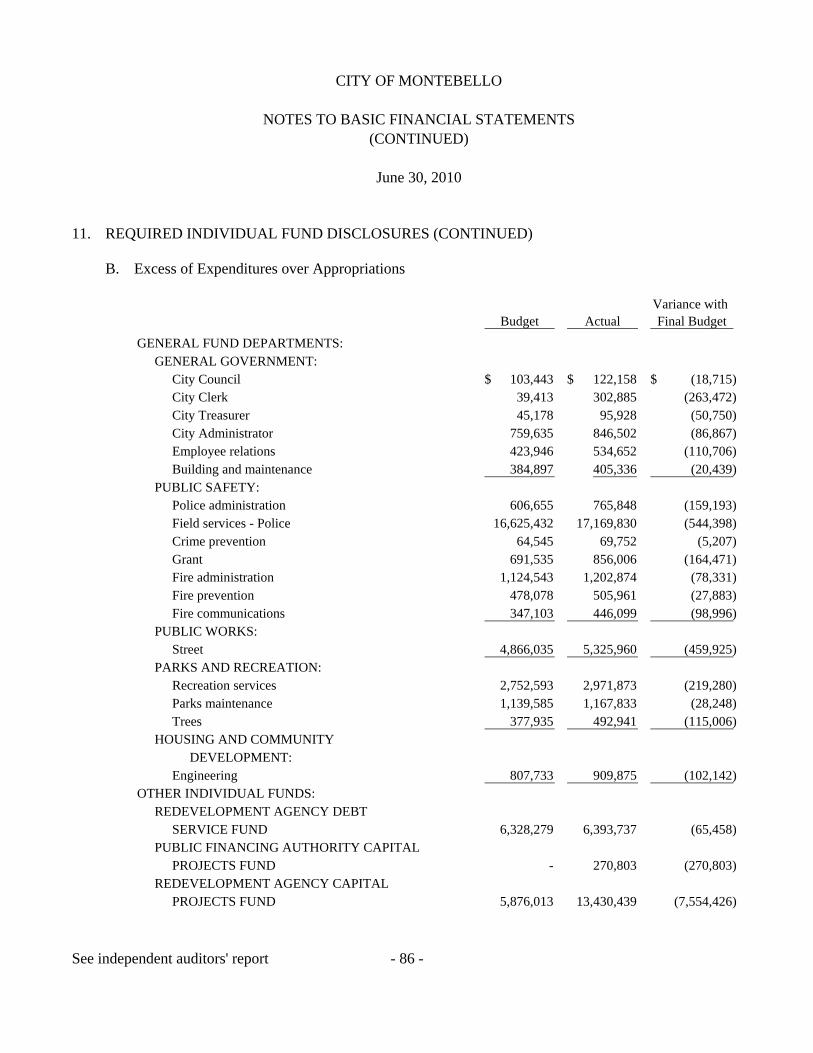
CITY OF MONTEBELLO
NOTES TO BASIC FINANCIAL STATEMENTS (CONTINUED)
June 30, 2010
See independent auditors' report - 86 -
11. REQUIRED INDIVIDUAL FUND DISCLOSURES (CONTINUED) B. Excess of Expenditures over Appropriations
Variance with Budget Actual Final Budget
GENERAL FUND DEPARTMENTS:GENERAL GOVERNMENT:
City Council 103,443$ 122,158$ (18,715)$ City Clerk 39,413 302,885 (263,472) City Treasurer 45,178 95,928 (50,750) City Administrator 759,635 846,502 (86,867) Employee relations 423,946 534,652 (110,706) Building and maintenance 384,897 405,336 (20,439)
PUBLIC SAFETY:Police administration 606,655 765,848 (159,193) Field services - Police 16,625,432 17,169,830 (544,398) Crime prevention 64,545 69,752 (5,207) Grant 691,535 856,006 (164,471) Fire administration 1,124,543 1,202,874 (78,331) Fire prevention 478,078 505,961 (27,883) Fire communications 347,103 446,099 (98,996)
PUBLIC WORKS:Street 4,866,035 5,325,960 (459,925)
PARKS AND RECREATION:Recreation services 2,752,593 2,971,873 (219,280) Parks maintenance 1,139,585 1,167,833 (28,248) Trees 377,935 492,941 (115,006)
HOUSING AND COMMUNITY DEVELOPMENT:
Engineering 807,733 909,875 (102,142) OTHER INDIVIDUAL FUNDS:
REDEVELOPMENT AGENCY DEBT SERVICE FUND 6,328,279 6,393,737 (65,458)
PUBLIC FINANCING AUTHORITY CAPITAL PROJECTS FUND - 270,803 (270,803)
REDEVELOPMENT AGENCY CAPITAL PROJECTS FUND 5,876,013 13,430,439 (7,554,426)

CITY OF MONTEBELLO
NOTES TO BASIC FINANCIAL STATEMENTS (CONTINUED)
June 30, 2010
See independent auditors' report - 87 -
12. REFUNDED AND REFUNDING DEBT A. Refunding 2000 Certificates of Participation and Refunded 1993 Certificates of Participation
On November 1, 2000, the City issued $22.9 million in Certificates of Participation with interest rates from 4.0% to 5.4% to advance refund $17.5 million of outstanding 1993 Certificates of Participation and provide additional funds for capital assets. Net proceeds of $16.8 million (after payment of: 1) $1.3 million in underwriting fees, insurance, and other issuance costs; 2) $1.8 million to establish a reserve fund; and 3) $3 million deposited in the acquisition and construction fund will be used to acquire public safety communication equipment) were used to purchase United States government securities. Those securities were deposited in an irrevocable trust with an escrow agent to provide for all future debt service payments in the 1993 Certificates of Participation. The 1993 Certificates of Participation are considered to be defeased and the liability for those bonds has been removed from the long-term liabilities. As of June 30, 2010, $14,025,000 remained outstanding on the refunded 1993 issue.
B. Refunding 1993 Certificates of Participation and Refunded 1990 and 1992 Certificates of Participation
On November 1, 1993, the City issued $22.3 million in Certificates of Participation with interest rates from 4.00% to 6.08% to advance refund $7,850,000 of outstanding 1990 Certificates of Participation and $12,345,000 of outstanding 1992 Certificates of Participation with interest rates from 6.40% to 7.00% and 4.90% to 7.10%, respectively. The net proceeds of $16.2 million (after payment of $0.4 million in underwriting fees, insurance, and other issuance costs, plus an additional $0.9 million in 1990 and 1992 issues sinking fund monies, $1.8 million to establish a reserve fund, and $3 million deposited in the acquisition and construction fund) were used to purchase United States government securities. Those securities were deposited in an irrevocable trust with an escrow agent to provide for all future debt service payments on the 1990 and 1992 Certificates of Participation. As a result, the 1990 and 1992 Certificates of Participation are considered to be defeased and the liability for those issues have been removed from the long-term liabilities. As of June 30, 2010, $1,350,000 and $9,415,000 remained outstanding on the 1990 and 1992 issues, respectively.
C. 1999 Refunding Certificates of Participation
On December 1, 1998, the City issued $4.3 million in Certificates of Participation with interest rates from 4.00% to 5.625% to refund $3.6 million of outstanding 1997 Certificates of Participation with variable interest rate. The net proceeds of $4.0 million (after payment of $0.3 million in underwriting fees, insurance, and other issuance costs) were used to purchase United States government securities. Those securities were deposited in an irrevocable trust with an escrow agent to provide for all future debt service payments on the 1997 Certificates of Participation. As of June 30, 2010, $2,550,000 remained outstanding on the 1997 Certificates of Participation.

CITY OF MONTEBELLO
NOTES TO BASIC FINANCIAL STATEMENTS (CONTINUED)
June 30, 2010
See independent auditors' report - 88 -
12. REFUNDED AND REFUNDING DEBT (CONTINUED)
D. 1997 Montebello Hills Parity Refunding Bonds
On June 1, 1997, the Agency issued $7.2 million in tax allocation bonds with interest rates from 4.00% to 5.60% to advance partial refund $6.3 million of outstanding 1989 Series Bonds with interest rates from 6.20% to 7.20%. The net proceeds of $6.8 million (after payment of $0.4 million in underwriting fees, insurance, and other issuance costs) were used to purchase United States government securities. Those securities were deposited in an irrevocable trust with an escrow agent to provide for all future debt service payments on the 1989 Series Bonds. As a result, part of the 1989 Series Bonds are considered to be defeased and the liability for those bonds has been removed from the long-term liabilities. As of June 30, 2010, the refunded 1989 Series Bonds have been redeemed.
E. 1998 Montebello Hills Parity Refunding Bonds
On December 1, 1998, the Agency issued $8.0 million in tax allocation bonds with interest rates from 3.75% to 5.00% to advance partial refund $6.2 million of outstanding 1989 Series Bonds with interest rates from 6.20% to 7.60%. The net proceeds of $6.5 million (after payment of $0.5 million in underwriting fees, insurance, and other issuance costs and $1 million deposited in the redevelopment fund) were used to purchase United States government securities. Those securities were deposited in an irrevocable trust with an escrow agent to provide for all future debt service payments on the 1989 Series Bonds. As a result, part of the 1989 Series Bonds are considered to be defeased and the liability for those bonds has been removed from the long-term liabilities. As of June 30, 2010, the refunded 1989 Series Bonds have been redeemed.
F. 1999 South Montebello Industrial Parity Refunding Bonds
On April 15, 1999, the Agency issued $8.3 million in tax allocation bonds with interest rates from 4.00% to 5.50% to advance partial refund $2.3 million of outstanding 1989 Series Bonds with interest rates from 6.20% to 7.60%. The net proceeds of $2.4 million (after payment of $0.5 million in underwriting fees, insurance, and other issuance costs, $4.7 million deposited in the Agency's Low- and Moderate-Income Housing Fund, and $0.7 million deposited in the reserve fund) were used to purchase United States government securities. Those securities were deposited in an irrevocable trust with an escrow agent to provide for all future debt service payments on the 1989 Series Bonds. As a result, part of the 1989 Series Bonds are considered to be defeased and the liability for those bonds has been removed from the long-term liabilities. As of June 30, 2010, the refunded 1989 Series Bonds were redeemed.

CITY OF MONTEBELLO
NOTES TO BASIC FINANCIAL STATEMENTS (CONTINUED)
June 30, 2010
See independent auditors' report - 89 -
12. REFUNDED AND REFUNDING DEBT (CONTINUED)
F. 1999 South Montebello Industrial Parity Refunding Bonds (Continued) On July 1, 1999, the Agency issued $4.1 million in tax allocation bonds with interest rates from 3.6% to 5.2% to advance partial refund $3.5 million of outstanding 1989 Series Bonds with interest rates from 6.20% to 7.60%. The net proceeds of $3.7 million (after payment of $0.3 million in underwriting fees, insurance, and other issuance costs) were used to purchase United States government securities. Those securities were deposited in an irrevocable trust with an escrow agent to provide for all future debt service payments on the 1989 Series Bonds. The 1989 Series Bonds are considered to be defeased and the liability for those bonds has been removed from the long-term liabilities. As of June 30, 2010, the refunded 1989 Series Bonds were redeemed.
G. Refunding 2001 Certificates of Participation and Refunded 1995 and 1997 Certificates of Participation
On December 10, 2001, the City issued $8.75 million Variable Rate Certificates of Participation to advance refund $7,090,000 of outstanding 1995 Certificates of Participation and $1,965,000 of outstanding 1997 Certificates of Participation with an adjustable interest rate equal to the total of LIBOR plus one percent and LIBOR plus three tenths of one percent, respectively. The net proceeds of $9.1 million (after payment of $0.4 million in underwriting fees, insurance, and other issuance costs, plus an additional $0.7 million in 1995 and 1997 issues sinking fund monies) were used to purchase United States government securities. Those securities were deposited in an irrevocable trust with an escrow agent to provide for all future debt service payments on the 1995 and 1997 Certificates of Participation. As a result, the 1995 and 1997 Certificates of Participation are considered defeased and the liability for those issues have been removed from the long-term liabilities. As of June 30, 2010, $1,520,000 remained outstanding on the 1997 issues. The refunded 1995 certificates were redeemed.
H. Refunding 2004 Revenue Bonds
In September 2004, the City issued $17,060,000 in Variable Rate Lease Revenue Refunding Bonds to advance refund $15,490,000 of outstanding Series 2001A Revenue Bonds. The net proceeds of $16.1 million (after payment of $0.8 million in underwriting fees, insurance, and other issuance costs; $1 million deposited in reserve funds; and $0.5 million and $0.4 million deposited in the hotel construction fund and Quiet Cannon construction fund, respectively, plus $1.6 million in the prior bond issue sinking fund) were deposited in an irrevocable trust with an escrow agent to provide for all future debt service payments on the Series 2001A Revenue Bonds. As a result, the 2001A Revenue Bonds and the liability has been removed from the long-term liabilities of the governmental activities. As of June 30, 2010, $12,800,000 remained outstanding on the 2001A Revenue Bonds.
CITY OF MONTEBELLO
NOTES TO BASIC FINANCIAL STATEMENTS (CONTINUED)
June 30, 2010
See independent auditors' report - 90 -
12. REFUNDED AND REFUNDING DEBT (CONTINUED)
I. 2007 Series A Housing Tax Allocation Bonds
In April 2007, the Agency issued $8.9 million in tax allocation bonds with interest rates from 3.375% to 4.00% to refund $8.8 million of outstanding 1997 Series A Housing Tax Allocation Bonds with interest rates from 4.50% to 5.45%. The net proceeds of $8.6 million and $0.9 million of reserve funds on the 1997 Series A Housing Tax Allocation Bonds (after payment of $0.3 million in underwriting fees, insurance, and other issuance costs) were used to purchase United States government securities. Those securities were deposited in an irrevocable trust with an escrow agent to provide amounts sufficient to pay on September 1, 2007, and to redeem on September 1, 2007 the 1997 Housing Tax Allocation Bonds maturing after such date by payment of the principal of such bonds, together with a redemption premium of 2% thereon. As a result, all of the 1997 Series A Housing Tax Allocation Bonds are considered to be defeased and the liability for those bonds has been removed from the long-term liabilities. As of June 30, 2010, $6,755,000 remained outstanding on the 1997 Series A Housing Tax Allocation Bonds.
J. 2007 Series A Montebello Hills Refunding Bonds
In October 2007, the Agency issued $2.9 million in tax allocation bonds with interest rates from 3.35% to 4.00% to refund a portion ($2.67 million) of the outstanding 1999 Series A Tax Allocation Bonds. The net proceeds of $2.75 million (after payment of $0.15 million in underwriting fees, insurance, and other issuance costs) were used to purchase United States government securities. Those securities were deposited in an irrevocable trust with an escrow agent to provide amounts sufficient to pay on March 1, 2009, and to redeem on March 1, 2009 a portion of the 1999 Series A Tax Allocation Bonds, together with a redemption premium of 2% thereon. As a result, a portion of the 1999 Series A Tax Allocation Bonds are considered to be defeased and the liability has been removed from long-term liabilities. At June 30, 2010, the portion of the 1999 Series A Tax Allocation Bonds retired by the 2007 Series A Bonds have been redeemed.

CITY OF MONTEBELLO
NOTES TO BASIC FINANCIAL STATEMENTS (CONTINUED)
June 30, 2010
See independent auditors' report - 91 -
12. REFUNDED AND REFUNDING DEBT (CONTINUED) K. 2007 Series B (Taxable) Montebello Hills Refunding Bonds
In October 2007, the Agency issued $3.66 million in tax allocation bonds with interest rates of 5.80% to refund $3.30 million of the outstanding 1999 Series C Tax Allocation Bonds. The net proceeds of $3.50 million (after payment of $0.16 million in underwriting fees, insurance, and other issuance costs) were used to purchase United States government securities. Those securities were deposited in an irrevocable trust with an escrow agent to provide amounts sufficient to pay on March 1, 2009, and to redeem on March 1, 2009 a portion of the 1999 Series C Tax Allocation Bonds, together with a redemption premium of 2% thereon. As a result, a portion of the 1999 Series C Tax Allocation Bonds are considered to be defeased and the liability has been removed from long-term liabilities. As of June 30, 2010, the refunded 1999 Series C Tax Allocation Bonds were redeemed.
13. FUND BALANCE RESERVES AND DESIGNATIONS The various reserves established as of June 30, 2010 are as follows:
Reserved for Advances - This reserve is to indicate that these amounts are not available to meet expenditures of the current period. Reserved for Encumbrances - This reserve is to indicate commitments for material and services on purchase orders. Reserved for Inventory - This reserve is to indicate that these amounts are not available to meet expenditures of the current period. Reserved for Retirement Benefits - This reserve is to indicate that these amounts are to be used to pay for retirement benefits.
Reserved for Debt Service - This reserve is the amount accumulated by the City that is restricted to the payment of long-term debt principal and interest amounts that mature in future years. Reserved for Notes Receivable - This reserve is provided to indicate that the amounts that are to be paid on the notes are not considered "available" to meet the expenditures of the current period.

CITY OF MONTEBELLO
NOTES TO BASIC FINANCIAL STATEMENTS (CONTINUED)
June 30, 2010
See independent auditors' report - 92 -
13. FUND BALANCE RESERVES AND DESIGNATIONS (CONTINUED) Reserved for Investment in Land Held for Resale - This reserve is provided to indicate that land held for resale is not "available" as a resource to meet the expenditures of the current period. The designations established as of June 30, 2010 are as follows:
Planned CapitalImprovements
Special Revenue Funds:Special Gas Tax 826,426$ Drug Enforcement 89,183 Proposition C 1,010,335 Grants 12,722
1,938,666 Redevelopment Agency Capital Project Fund 20,924,437
Total Designations 22,863,103$ 14. CONTINGENCIES
A. The City is involved in several pending lawsuits of a nature common to many similar jurisdictions. City management estimates that potential claims against the City, not covered by insurance, will not have a material adverse effect on the financial statements of the City.
B. SERAF Contingency
On July 28, 2009, the Governor of the State of California signed into law Assembly Bill No. 26 (AB 26) modifying the Community Redevelopment Law (Health and Safety Code Sections 3300, et seq.). The general effect of the AB 26 amendment is to shift approximately two billion fifty million dollars ($2,050,000,000) away from redevelopment agencies to K-12 school districts and county offices of education located entirely or partially within the redevelopment project areas. To accomplish this shift, AB 26 establishes a "Supplemental Educational Revenue Augmentation Fund" (SERAF) in each county and requires each redevelopment agency to pay into its county's SERAF during both fiscal years 2009-2010 and 2010-2011. The largest redevelopment agency payments into SERAF occurred during fiscal year 2009-2010 and resulted in a shift of approximately one billion seven hundred million ($1,700,000,000) from redevelopment agencies to K-12 school districts and county offices of education. The shift of money in fiscal year 2010-2011 will be approximately three hundred fifty million dollars ($350,000,000).
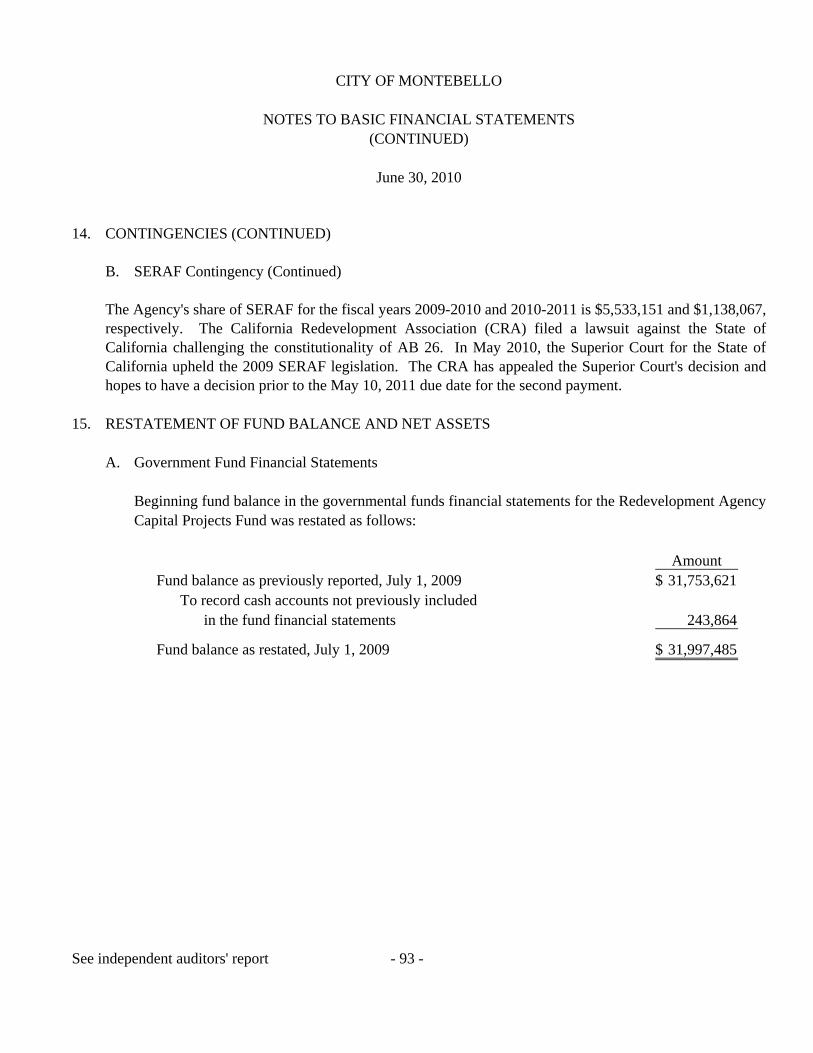
CITY OF MONTEBELLO
NOTES TO BASIC FINANCIAL STATEMENTS (CONTINUED)
June 30, 2010
See independent auditors' report - 93 -
14. CONTINGENCIES (CONTINUED)
B. SERAF Contingency (Continued) The Agency's share of SERAF for the fiscal years 2009-2010 and 2010-2011 is $5,533,151 and $1,138,067, respectively. The California Redevelopment Association (CRA) filed a lawsuit against the State of California challenging the constitutionality of AB 26. In May 2010, the Superior Court for the State of California upheld the 2009 SERAF legislation. The CRA has appealed the Superior Court's decision and hopes to have a decision prior to the May 10, 2011 due date for the second payment.
15. RESTATEMENT OF FUND BALANCE AND NET ASSETS A. Government Fund Financial Statements
Beginning fund balance in the governmental funds financial statements for the Redevelopment Agency Capital Projects Fund was restated as follows:
AmountFund balance as previously reported, July 1, 2009 31,753,621$
To record cash accounts not previously includedin the fund financial statements 243,864
Fund balance as restated, July 1, 2009 31,997,485$

CITY OF MONTEBELLO
NOTES TO BASIC FINANCIAL STATEMENTS (CONTINUED)
June 30, 2010
See independent auditors' report - 94 -
15. RESTATEMENT OF FUND BALANCE AND NET ASSETS (CONTINUED)
B. Government-wide Financial Statements
Beginning net assets in the government-wide financial statements for the governmental activities was restated as follows:
AmountNet assets as previously reported, July 1, 2009 23,763,459$
To record cash accounts not previously includedin the fund financial statements 243,864
To adjust for capital assets purchased in prior years on the government-wide financial statements 7,602,452
Net assets as restated, July 1, 2009 31,609,775$
The total enterprise funds beginning net assets in the Statement of Revenues, Expenses, and Changes in Fund Net Assets - Proprietary Funds did not agree with the sum of the individual funds' net assets (deficits) by $554,197. An adjustment to correct the discrepancy was made in the current period.
16. SUBSEQUENT EVENTS
On December 22, 2010, the City was notified by the U.S. Department of Housing and Urban Development during its review of the City's books and records that the City could not provide sufficient documentation with respect to a $1,300,000 HOME expenditure. The City was ordered to repay HUD $1,300,000. The City has demanded payment from the developer who failed to provide the City the proper documentation to support the expenditure and has recorded a $1,300,000 receivable in its Capital Projects Fund. On February 18, 2011, the City was notified by HUD during its review of acquisition and related costs of property located at 124 South Sixth Street, Montebello, CA, that the City could not provide documentation and support regarding the City's acquisition of the property. The City was ordered to repay HUD $889,106. The City is currently negotiating a payment plan with respect to the above amounts due. The City has reflected these amounts due as notes payable - due within one year in the Statement of Net Assets - governmental activities.

CITY OF MONTEBELLO
NOTES TO BASIC FINANCIAL STATEMENTS (CONTINUED)
June 30, 2010
See independent auditors' report - 95 -
17. UNCERTAINTIES
The Capital Improvements Capital Projects Fund and the General Fund are the focal points in analyzing the financial health of the City because the Capital Improvements Capital Projects Fund is expected to cover both its costs and act as a financial backstop for the General Fund and other funds in the event of an insufficiency in those funds. For fiscal year 2008-2009, the Capital Improvements Capital Projects Fund's expenditures have exceeded revenues and transfers by $4,893,948, resulting in a deficit fund balance of $765,485 as of June 30, 2009. For fiscal year 2009-2010, the Capital Improvements Capital Projects Fund's deficit fund balance decreased to $697,133. However, the General Fund's expenditures have exceeded revenues and transfers by $6,682,148, resulting in a deficit fund balance of $6,682,148 as of June 30, 2010. The Capital Improvements Capital Projects Fund and the General Fund do not have the ability to provide any resources to other funds in fiscal year 2010-2011. The City has not adopted a final budget for fiscal year 2010-2011. City management has estimated that the General Fund's resources will not meet the estimated appropriations resulting in a deficit of approximately $2,100,000 for fiscal year 2010-2011. The Capital Improvements Capital Projects Fund and the General Fund are expected to have liquidity problems and the need to borrow cash from other outside sources. The current economic conditions have caused significant decreases in revenues collected by the City and is affecting the ability of the City to pay for expenditures for public services. In addition to the decline in revenues, the City is also faced with higher costs for pension and retirement benefits. The City is working on a recovery plan that includes cost reduction and additional revenue options to realign future expenditures with lower revenue streams. The projection of the financial data for future periods must recognize the factors discussed above and consider the effect of these factors on the City's operations.

- 96 -
REQUIRED SUPPLEMENTARY INFORMATION
FOR THE YEAR ENDED JUNE 30, 2010

- 97 -
CITY OF MONTEBELLO
SCHEDULES OF FUNDING PROGRESS
For the year ended June 30, 2010
CalPERS MISCELLANEOUS EMPLOYEES PLAN($ amount in Thousands)
Note 8
Actuarial UAAL as a Actuarial Accrued Unfunded % of
Actuarial Value of Liability AAL Funded Covered CoveredValuation Assets (AAL) (UAAL) Ratio Payroll Payroll
Date (a) (b) (b)-(a) (a)/(b) (c) [(b)-(a)]/(c)
6/30/2007 92,258$ 100,067$ 7,809$ 92.2 % 16,823$ 46.4 %6/30/2008 99,478 112,618 13,140 88.3 20,500 64.1 6/30/2009 104,961 125,434 20,473 83.7 18,603 110.1
CalPERS SAFETY EMPLOYEES PLAN($ amount in Thousands)
Note 8
Actuarial UAAL as a Actuarial Accrued Unfunded % of
Actuarial Value of Liability AAL Funded Covered CoveredValuation Assets (AAL) (UAAL) Ratio Payroll Payroll
Date (a) (b) (b)-(a) (a)/(b) (c) [(b)-(a)]/(c)
6/30/2007 121,959$ 139,867$ 17,908$ 87.2 % 10,831$ 165.3 %6/30/2008 128,706 152,656 23,950 84.3 12,786 187.3 6/30/2009 134,012 167,396 33,384 80.1 12,513 266.8
OTHER POST-EMPLOYMENT BENEFITS PLAN($ amount in Thousands)
Note 9
UnfundedActuarial Actuarial UAAL as a
Actuarial Accrued Accrued % ofActuarial Asset Liability Liability Funded Covered CoveredValuation Value (AAL) (UAAL) Ratio Payroll Payroll
Date (a) (b) (b)-(a) (a)/(b) (c) [(b)-(a)]/(c)
6/30/2008 - 12,026,641$ 12,026,641$ - % 57,739,000$ 20.8 %
See independent auditors' report and notes to financial statements.
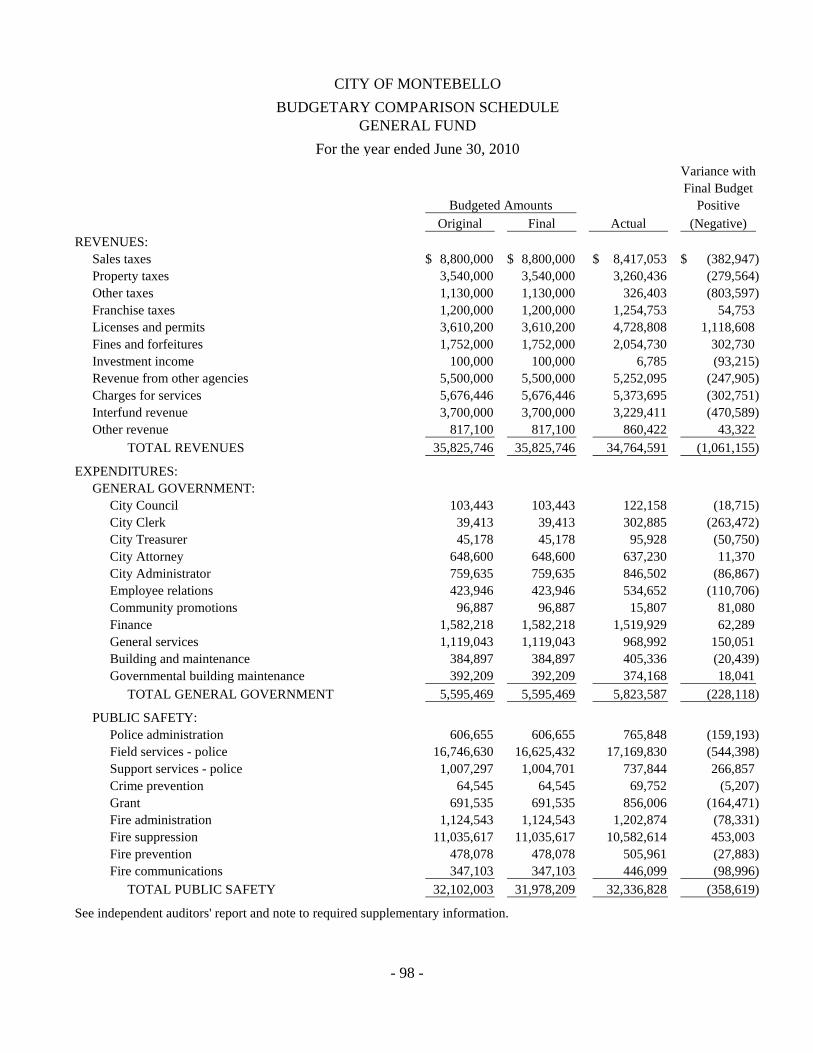
- 98 -
CITY OF MONTEBELLO
BUDGETARY COMPARISON SCHEDULEGENERAL FUND
For the year ended June 30, 2010
Variance withFinal Budget
Budgeted Amounts PositiveOriginal Final Actual (Negative)
REVENUES:Sales taxes 8,800,000$ 8,800,000$ 8,417,053$ (382,947)$ Property taxes 3,540,000 3,540,000 3,260,436 (279,564) Other taxes 1,130,000 1,130,000 326,403 (803,597) Franchise taxes 1,200,000 1,200,000 1,254,753 54,753 Licenses and permits 3,610,200 3,610,200 4,728,808 1,118,608 Fines and forfeitures 1,752,000 1,752,000 2,054,730 302,730 Investment income 100,000 100,000 6,785 (93,215) Revenue from other agencies 5,500,000 5,500,000 5,252,095 (247,905) Charges for services 5,676,446 5,676,446 5,373,695 (302,751) Interfund revenue 3,700,000 3,700,000 3,229,411 (470,589) Other revenue 817,100 817,100 860,422 43,322
TOTAL REVENUES 35,825,746 35,825,746 34,764,591 (1,061,155)
EXPENDITURES:GENERAL GOVERNMENT:
City Council 103,443 103,443 122,158 (18,715) City Clerk 39,413 39,413 302,885 (263,472) City Treasurer 45,178 45,178 95,928 (50,750) City Attorney 648,600 648,600 637,230 11,370 City Administrator 759,635 759,635 846,502 (86,867) Employee relations 423,946 423,946 534,652 (110,706) Community promotions 96,887 96,887 15,807 81,080 Finance 1,582,218 1,582,218 1,519,929 62,289 General services 1,119,043 1,119,043 968,992 150,051 Building and maintenance 384,897 384,897 405,336 (20,439) Governmental building maintenance 392,209 392,209 374,168 18,041
TOTAL GENERAL GOVERNMENT 5,595,469 5,595,469 5,823,587 (228,118)
PUBLIC SAFETY:Police administration 606,655 606,655 765,848 (159,193) Field services - police 16,746,630 16,625,432 17,169,830 (544,398) Support services - police 1,007,297 1,004,701 737,844 266,857 Crime prevention 64,545 64,545 69,752 (5,207) Grant 691,535 691,535 856,006 (164,471) Fire administration 1,124,543 1,124,543 1,202,874 (78,331) Fire suppression 11,035,617 11,035,617 10,582,614 453,003 Fire prevention 478,078 478,078 505,961 (27,883) Fire communications 347,103 347,103 446,099 (98,996)
TOTAL PUBLIC SAFETY 32,102,003 31,978,209 32,336,828 (358,619)
See independent auditors' report and note to required supplementary information.
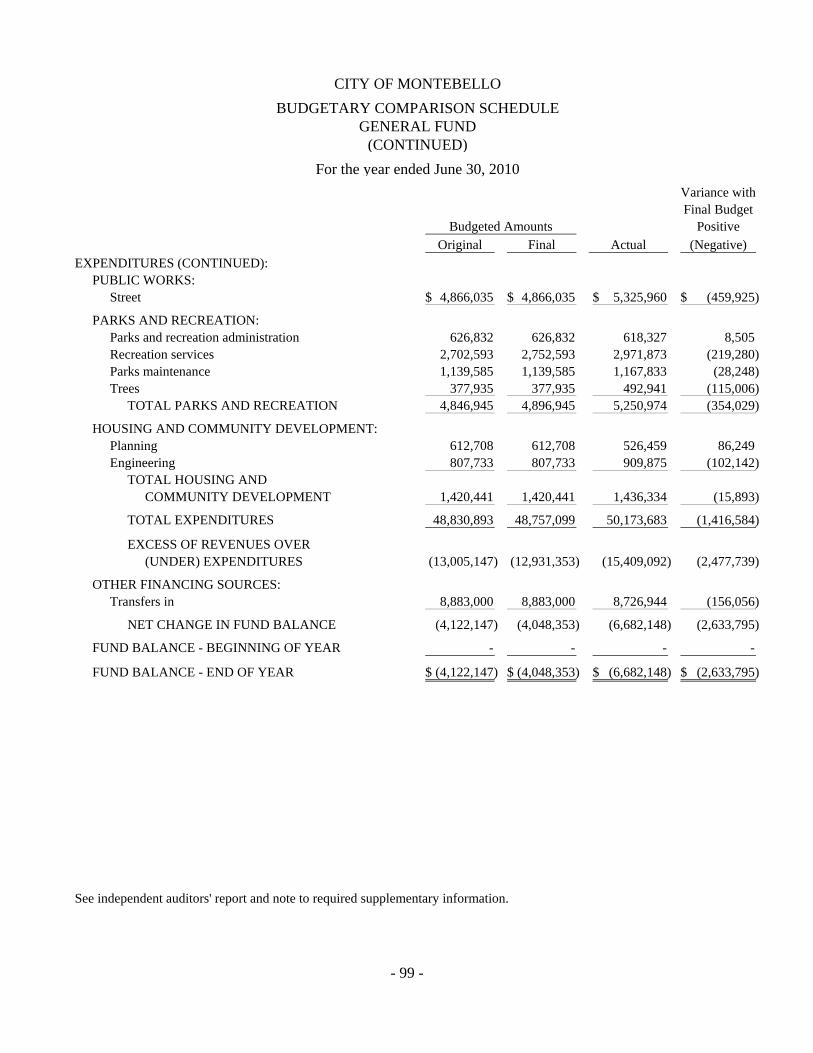
- 99 -
CITY OF MONTEBELLO
BUDGETARY COMPARISON SCHEDULEGENERAL FUND
(CONTINUED)
For the year ended June 30, 2010
Variance withFinal Budget
Budgeted Amounts PositiveOriginal Final Actual (Negative)
EXPENDITURES (CONTINUED):PUBLIC WORKS:
Street 4,866,035$ 4,866,035$ 5,325,960$ (459,925)$
PARKS AND RECREATION:Parks and recreation administration 626,832 626,832 618,327 8,505 Recreation services 2,702,593 2,752,593 2,971,873 (219,280) Parks maintenance 1,139,585 1,139,585 1,167,833 (28,248) Trees 377,935 377,935 492,941 (115,006)
TOTAL PARKS AND RECREATION 4,846,945 4,896,945 5,250,974 (354,029)
HOUSING AND COMMUNITY DEVELOPMENT:Planning 612,708 612,708 526,459 86,249 Engineering 807,733 807,733 909,875 (102,142)
TOTAL HOUSING ANDCOMMUNITY DEVELOPMENT 1,420,441 1,420,441 1,436,334 (15,893)
TOTAL EXPENDITURES 48,830,893 48,757,099 50,173,683 (1,416,584)
EXCESS OF REVENUES OVER(UNDER) EXPENDITURES (13,005,147) (12,931,353) (15,409,092) (2,477,739)
OTHER FINANCING SOURCES:Transfers in 8,883,000 8,883,000 8,726,944 (156,056)
NET CHANGE IN FUND BALANCE (4,122,147) (4,048,353) (6,682,148) (2,633,795)
FUND BALANCE - BEGINNING OF YEAR - - - -
FUND BALANCE - END OF YEAR (4,122,147)$ (4,048,353)$ (6,682,148)$ (2,633,795)$
See independent auditors' report and note to required supplementary information.

See independent auditors' report - 100 -
CITY OF MONTEBELLO
NOTE TO REQUIRED SUPPLEMENTARY INFORMATION
June 30, 2010
BUDGETARY DATA:
The City adheres to the following general procedures in establishing the budgetary data reflected in the combined financial statements:
1) The annual budget adopted by the City Council provides for the general operation of the City. It includes
proposed expenditures and estimated revenues for all governmental fund types.
2) The City Administrator is authorized to transfer certain appropriations between activities within any department in accordance with the budget resolution. Any revisions that alter the total expenditures of any department must be approved by the City Council.
3) The budget is formally integrated into the accounting system.
4) Budgets for the governmental fund types are adopted on a basis consistent with accounting principles generally accepted in the United States of America. The modified accrual basis of accounting is employed in the preparation of the budget.
5) At fiscal year-end, operating budget appropriations lapse. Capital projects are budgeted on an annual basis. Encumbrances and expenditures, which would cause an annual budget appropriations overrun, require an approved budget transfer. Incomplete capital improvement budget appropriations are rebudgeted in the following fiscal year. Projects that are not started during the budget year are reevaluated in the following year.

- 101 -
SUPPLEMENTARY SCHEDULES

- 102 -
OTHER GOVERNMENTAL FUNDS Special Revenue Funds are used to account for the proceeds of specific revenue sources that are restricted by law or administrative action for a specified purpose. Debt Service Funds are used to account for the accumulation of resources for, and the payment of, long-term liabilities, interest, and related fiscal agent costs. Public Financing Authority Capital Projects Fund is used to account for financial resources segregated for the acquisition of capital facilities financed by the Public Financing Authority debt.
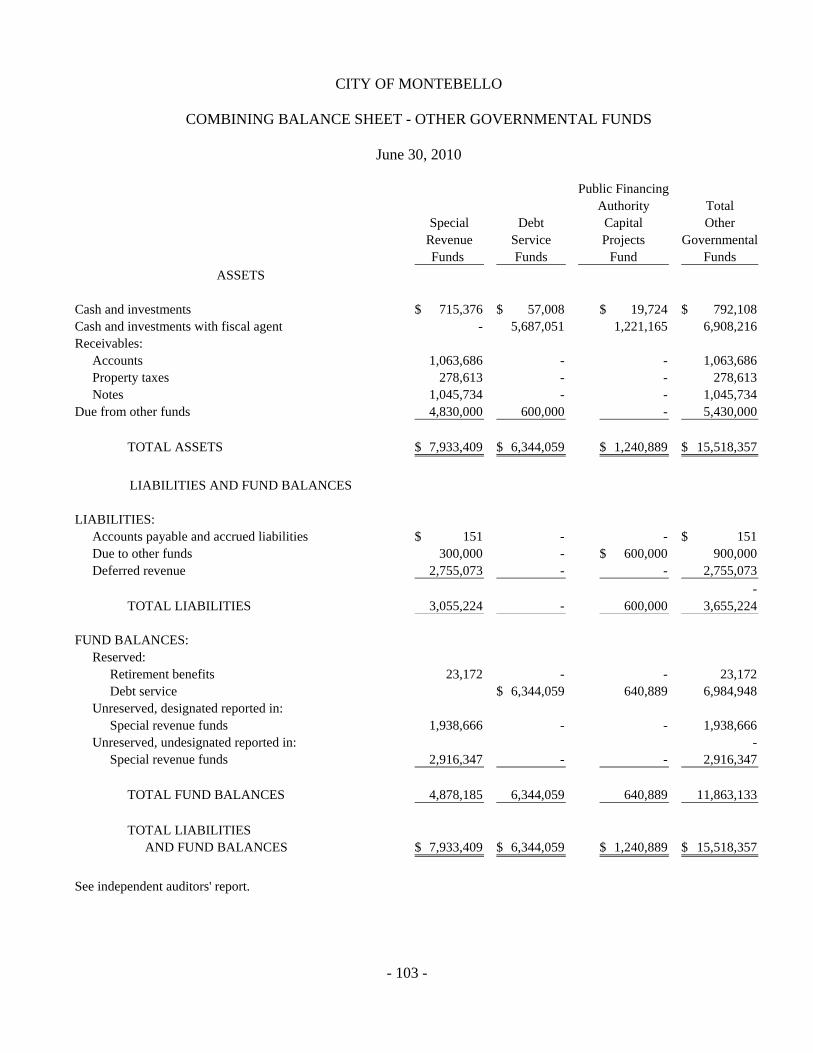
- 103 -
CITY OF MONTEBELLO
COMBINING BALANCE SHEET - OTHER GOVERNMENTAL FUNDS
June 30, 2010
Public FinancingAuthority Total
Special Debt Capital OtherRevenue Service Projects GovernmentalFunds Funds Fund Funds
ASSETS
Cash and investments 715,376$ 57,008$ 19,724$ 792,108$ Cash and investments with fiscal agent - 5,687,051 1,221,165 6,908,216 Receivables:
Accounts 1,063,686 - - 1,063,686 Property taxes 278,613 - - 278,613 Notes 1,045,734 - - 1,045,734
Due from other funds 4,830,000 600,000 - 5,430,000
TOTAL ASSETS 7,933,409$ 6,344,059$ 1,240,889$ 15,518,357$
LIABILITIES AND FUND BALANCES
LIABILITIES:Accounts payable and accrued liabilities 151$ - - 151$ Due to other funds 300,000 - 600,000$ 900,000 Deferred revenue 2,755,073 - - 2,755,073
- TOTAL LIABILITIES 3,055,224 - 600,000 3,655,224
FUND BALANCES:Reserved:
Retirement benefits 23,172 - - 23,172 Debt service 6,344,059$ 640,889 6,984,948
Unreserved, designated reported in:Special revenue funds 1,938,666 - - 1,938,666
Unreserved, undesignated reported in: - Special revenue funds 2,916,347 - - 2,916,347
TOTAL FUND BALANCES 4,878,185 6,344,059 640,889 11,863,133
TOTAL LIABILITIESAND FUND BALANCES 7,933,409$ 6,344,059$ 1,240,889$ 15,518,357$
See independent auditors' report.
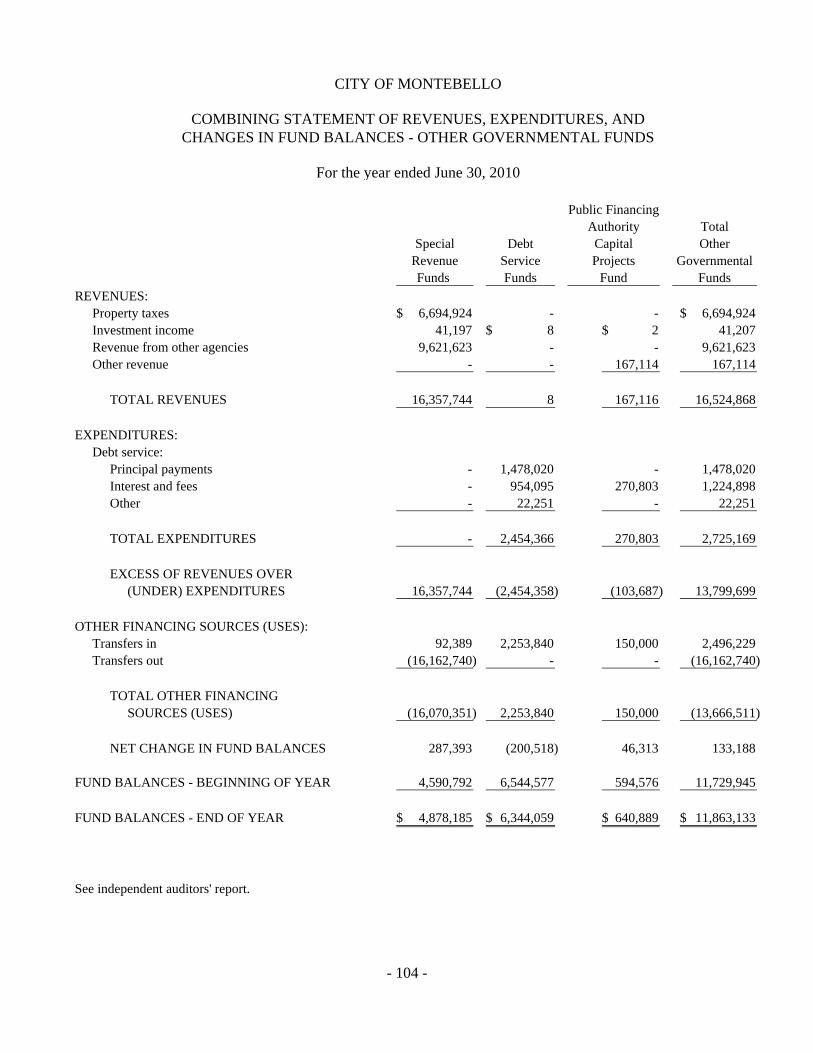
- 104 -
CITY OF MONTEBELLO
COMBINING STATEMENT OF REVENUES, EXPENDITURES, ANDCHANGES IN FUND BALANCES - OTHER GOVERNMENTAL FUNDS
For the year ended June 30, 2010
Public FinancingAuthority Total
Special Debt Capital OtherRevenue Service Projects GovernmentalFunds Funds Fund Funds
REVENUES:Property taxes 6,694,924$ - - 6,694,924$ Investment income 41,197 8$ 2$ 41,207 Revenue from other agencies 9,621,623 - - 9,621,623 Other revenue - - 167,114 167,114
TOTAL REVENUES 16,357,744 8 167,116 16,524,868
EXPENDITURES:Debt service:
Principal payments - 1,478,020 - 1,478,020 Interest and fees - 954,095 270,803 1,224,898 Other - 22,251 - 22,251
TOTAL EXPENDITURES - 2,454,366 270,803 2,725,169
EXCESS OF REVENUES OVER(UNDER) EXPENDITURES 16,357,744 (2,454,358) (103,687) 13,799,699
OTHER FINANCING SOURCES (USES):Transfers in 92,389 2,253,840 150,000 2,496,229 Transfers out (16,162,740) - - (16,162,740)
TOTAL OTHER FINANCINGSOURCES (USES) (16,070,351) 2,253,840 150,000 (13,666,511)
NET CHANGE IN FUND BALANCES 287,393 (200,518) 46,313 133,188
FUND BALANCES - BEGINNING OF YEAR 4,590,792 6,544,577 594,576 11,729,945
FUND BALANCES - END OF YEAR 4,878,185$ 6,344,059$ 640,889$ 11,863,133$
See independent auditors' report.

- 105 -
OTHER SPECIAL REVENUE FUNDS
Special Gas Tax Fund - To account for the City's share of state and county gas tax allocations. The tax allocations are expended on street maintenance and street construction. Park Development Fund - To account for new construction license fees received. These fees are used for the maintenance and improvement of the City's parks. Retirement Fund - To account for the receipt of property taxes allocated for retirement expenditures. These funds are used to pay the City's cost of retirement for general governmental employees. Prop A Fund - To account for the receipt of the half-cent sales tax allocated by Los Angeles County Metropolitan Transportation Authority (LACMTA). These funds are to be used for public transit related expenditures. Drug Enforcement Fund - To account for the revenues resulting from the seizure of assets in conjunction with criminal cases (primarily drug related). These funds are used for enhancement of law enforcement programs. Prop C Fund - To account for the receipt of the half-cent sales tax allocated by LACMTA. These funds are to be used to reduce traffic congestion, improve air quality, improve conditions of streets/freeways utilized by public transit, and reduce foreign fuel dependence. Metro Station Fund - Funds for this rail station are generated from Prop C Local Return, Prop C Discretionary, and Transportation Capital Improvement grants. The station will serve as a component of the regional Metrolink commuter rail network. Shared by the Cities of Montebello and Commerce, the station will be located at the Chevron Marketing Terminal at 600 South Vail Avenue, Montebello, California. Air Quality Fund - To account for monies received through the South Coast Air Quality Management District to be used for the purpose of reducing air pollution. Supplemental Law Enforcement - To account for certain grant funds received. These funds are used for the enhancement of law enforcement programs. Grants - To account for Housing and Community Development Funds for neighborhood and commercial improvement purposes.
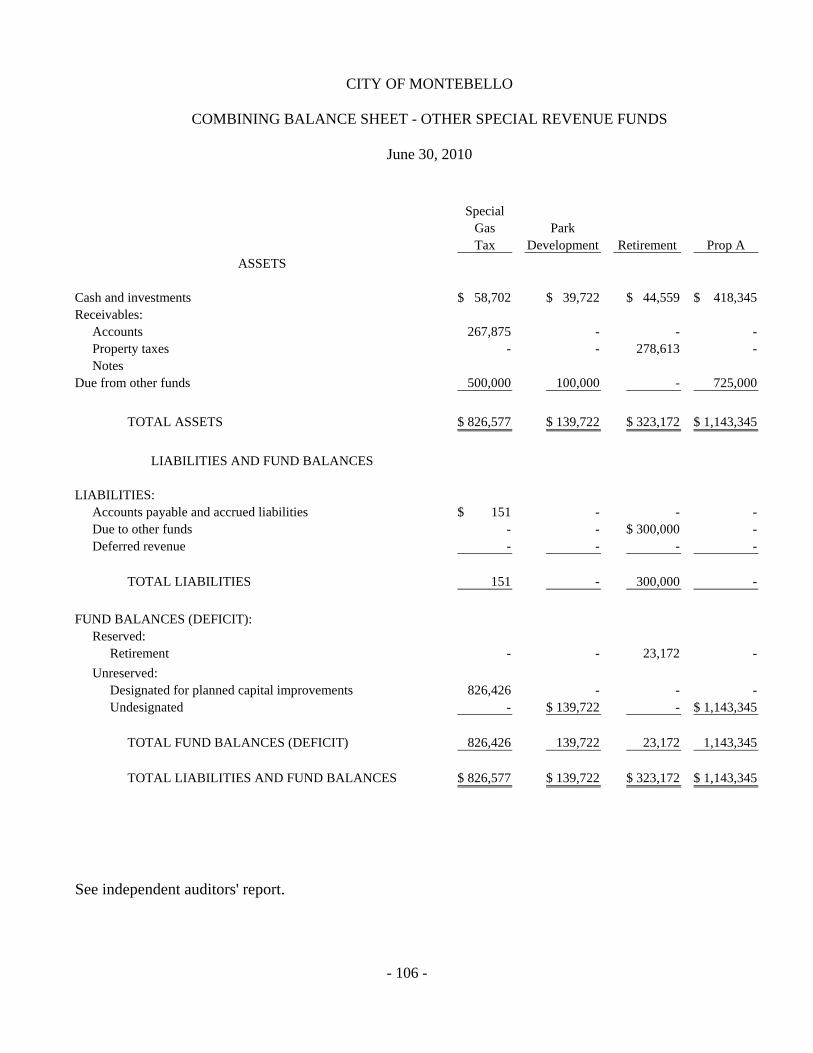
- 106 -
CITY OF MONTEBELLO
COMBINING BALANCE SHEET - OTHER SPECIAL REVENUE FUNDS
June 30, 2010
SpecialGas ParkTax Development Retirement Prop A
ASSETS
Cash and investments 58,702$ 39,722$ 44,559$ 418,345$ Receivables:
Accounts 267,875 - - - Property taxes - - 278,613 - Notes
Due from other funds 500,000 100,000 - 725,000
TOTAL ASSETS 826,577$ 139,722$ 323,172$ 1,143,345$
LIABILITIES AND FUND BALANCES
LIABILITIES:Accounts payable and accrued liabilities 151$ - - - Due to other funds - - 300,000$ - Deferred revenue - - - -
TOTAL LIABILITIES 151 - 300,000 -
FUND BALANCES (DEFICIT):Reserved:
Retirement - - 23,172 -
Unreserved:Designated for planned capital improvements 826,426 - - - Undesignated - 139,722$ - 1,143,345$
TOTAL FUND BALANCES (DEFICIT) 826,426 139,722 23,172 1,143,345
TOTAL LIABILITIES AND FUND BALANCES 826,577$ 139,722$ 323,172$ 1,143,345$
See independent auditors' report.

- 107 -
Total
Supplemental OtherDrug Metro Air Law Special
Enforcement Prop C Station Quality Enforcement Grants Revenue Funds
75,000$ 57,222$ 9,501$ 1,852$ 6,707$ 3,766$ 715,376$
- - - 19,968 7,548 768,295 1,063,686 - - - - - - 278,613
1,045,734 1,045,734 300,000 1,785,000 170,000 200,000 100,000 950,000 4,830,000
375,000$ 1,842,222$ 179,501$ 221,820$ 114,255$ 2,767,795$ 7,933,409$
- - - - - - 151$ - - - - - - 300,000 - - - - - 2,755,073$ 2,755,073
- - - - - - 2,755,073 3,055,224
- - - - - - 23,172
89,183$ 1,010,335$ - - - 12,722 1,938,666 285,817 831,887 179,501$ 221,820$ 114,255$ - 2,916,347
375,000 1,842,222 179,501 221,820 114,255 12,722 4,878,185
375,000$ 1,842,222$ 179,501$ 221,820$ 114,255$ 2,767,795$ 7,933,409$

- 108 -
CITY OF MONTEBELLO
COMBINING STATEMENT OF REVENUES, EXPENDITURES, ANDCHANGES IN FUND BALANCES - OTHER SPECIAL REVENUE FUNDS
For the year ended June 30, 2010
SpecialGas ParkTax Development Retirement Prop A
REVENUES:Property taxes 6,694,924$ Investment income 4,033$ - 8,274$ Revenue from other agencies 2,655,458 3,111$ - 835,474
TOTAL REVENUES 2,659,491 3,111 6,694,924 843,748
OTHER FINANCING SOURCES (USES):Transfers in 92,389 - - - Transfers out (2,471,704) - (7,250,000) (244,485)
TOTAL OTHER FINANCING SOURCES (USES) (2,379,315) - (7,250,000) (244,485)
NET CHANGE IN FUND BALANCES 280,176 3,111 (555,076) 599,263
FUND BALANCES (DEFICIT) - BEGINNING OF YEAR 546,250 136,611 578,248 544,082
FUND BALANCES (DEFICIT) - END OF YEAR 826,426$ 139,722$ 23,172$ 1,143,345$
See independent auditors' report.

- 109 -
Total
Supplemental OtherDrug Metro Air Law Special
Enforcement Prop C Station Quality Enforcement Grants Revenue Funds
6,694,924$ 3,271$ 21,049$ 1,812$ 2,063$ 695$ 41,197
193,709 747,345 - 74,353 100,000 5,012,173$ 9,621,623
196,980 768,394 1,812 76,416 100,695 5,012,173 16,357,744
- - - - - - 92,389 (89,183) (1,232,205) - (58,984) (40,915) (4,775,264) (16,162,740)
(89,183) (1,232,205) - (58,984) (40,915) (4,775,264) (16,070,351)
107,797 (463,811) 1,812 17,432 59,780 236,909 287,393
267,203 2,306,033 177,689 204,388 54,475 (224,187) 4,590,792
375,000$ 1,842,222$ 179,501$ 221,820$ 114,255$ 12,722$ 4,878,185$
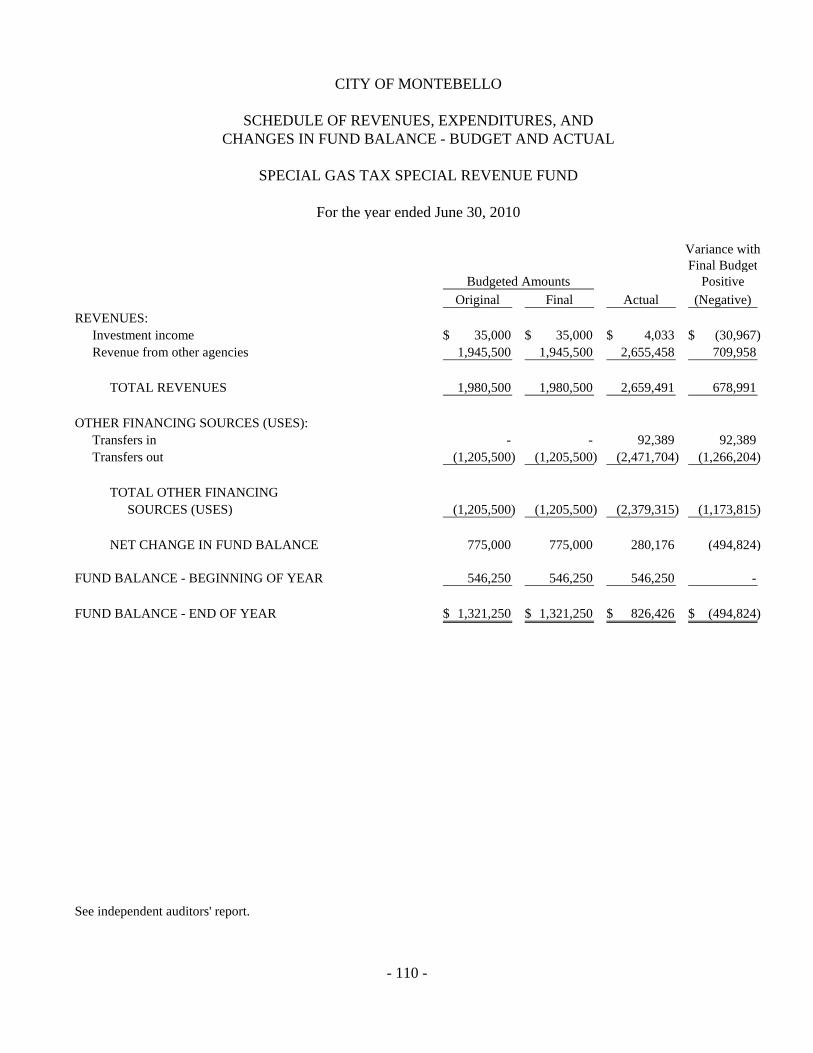
- 110 -
CITY OF MONTEBELLO
SCHEDULE OF REVENUES, EXPENDITURES, ANDCHANGES IN FUND BALANCE - BUDGET AND ACTUAL
SPECIAL GAS TAX SPECIAL REVENUE FUND
For the year ended June 30, 2010
Variance withFinal Budget
Budgeted Amounts PositiveOriginal Final Actual (Negative)
REVENUES:Investment income 35,000$ 35,000$ 4,033$ (30,967)$ Revenue from other agencies 1,945,500 1,945,500 2,655,458 709,958
TOTAL REVENUES 1,980,500 1,980,500 2,659,491 678,991
OTHER FINANCING SOURCES (USES):Transfers in - - 92,389 92,389 Transfers out (1,205,500) (1,205,500) (2,471,704) (1,266,204)
TOTAL OTHER FINANCINGSOURCES (USES) (1,205,500) (1,205,500) (2,379,315) (1,173,815)
NET CHANGE IN FUND BALANCE 775,000 775,000 280,176 (494,824)
FUND BALANCE - BEGINNING OF YEAR 546,250 546,250 546,250 -
FUND BALANCE - END OF YEAR 1,321,250$ 1,321,250$ 826,426$ (494,824)$
See independent auditors' report.
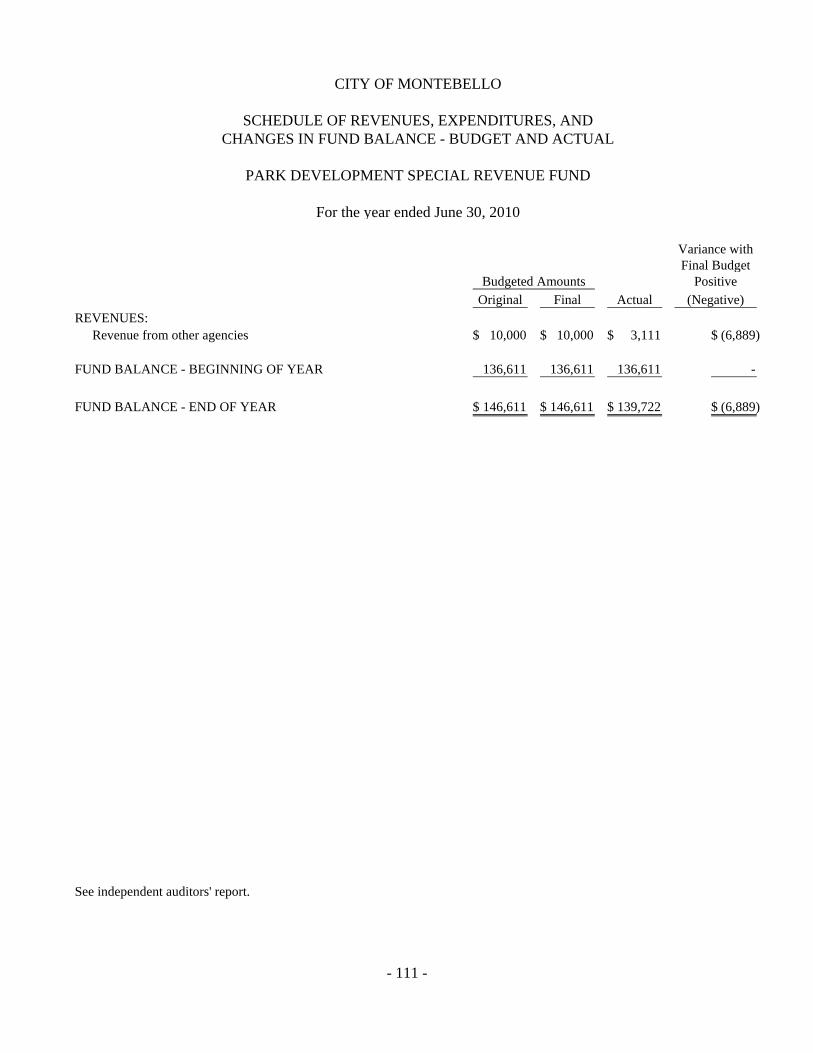
- 111 -
CITY OF MONTEBELLO
SCHEDULE OF REVENUES, EXPENDITURES, ANDCHANGES IN FUND BALANCE - BUDGET AND ACTUAL
PARK DEVELOPMENT SPECIAL REVENUE FUND
For the year ended June 30, 2010
Variance withFinal Budget
Budgeted Amounts PositiveOriginal Final Actual (Negative)
REVENUES:Revenue from other agencies 10,000$ 10,000$ 3,111$ (6,889)$
FUND BALANCE - BEGINNING OF YEAR 136,611 136,611 136,611 -
FUND BALANCE - END OF YEAR 146,611$ 146,611$ 139,722$ (6,889)$
See independent auditors' report.

- 112 -
CITY OF MONTEBELLO
SCHEDULE OF REVENUES, EXPENDITURES, ANDCHANGES IN FUND BALANCE - BUDGET AND ACTUAL
RETIREMENT SPECIAL REVENUE FUND
For the year ended June 30, 2010
Variance withFinal Budget
Budgeted Amounts PositiveOriginal Final Actual (Negative)
REVENUES:Property taxes 6,876,000$ 6,876,000$ 6,694,924$ (181,076)$
OTHER FINANCING USES:Transfers out (7,300,000) (7,300,000) (7,250,000) 50,000
NET CHANGE IN FUND BALANCE (424,000) (424,000) (555,076) (131,076)
FUND BALANCE - BEGINNING OF YEAR 578,248 578,248 578,248 -
FUND BALANCE - END OF YEAR 154,248$ 154,248$ 23,172$ (131,076)$
See independent auditors' report.

- 113 -
CITY OF MONTEBELLO
SCHEDULE OF REVENUES, EXPENDITURES, ANDCHANGES IN FUND BALANCE - BUDGET AND ACTUAL
PROP A SPECIAL REVENUE FUND
For the year ended June 30, 2010
Variance withFinal Budget
Budgeted Amounts PositiveOriginal Final Actual (Negative)
REVENUES:Investment income - - 8,274$ 8,274$ Revenue from other agencies 928,085$ 928,085$ 835,474 (92,611)
TOTAL REVENUES 928,085 928,085 843,748 (84,337)
OTHER FINANCING USES:Transfers out (303,170) (303,170) (244,485) 58,685
NET CHANGE IN FUND BALANCE 624,915 624,915 599,263 (25,652)
FUND BALANCE - BEGINNING OF YEAR 544,082 544,082 544,082 -
FUND BALANCE - END OF YEAR 1,168,997$ 1,168,997$ 1,143,345$ (25,652)$
See independent auditors' report.

- 114 -
CITY OF MONTEBELLO
SCHEDULE OF REVENUES, EXPENDITURES, ANDCHANGES IN FUND BALANCE - BUDGET AND ACTUAL
DRUG ENFORCEMENT SPECIAL REVENUE FUND
For the year ended June 30, 2010
Variance withFinal Budget
Budgeted Amounts PositiveOriginal Final Actual (Negative)
REVENUES:Investment income 26,000$ 26,000$ 3,271$ (22,729)$ Revenue from other agencies 325,000 325,000 193,709 (131,291)
TOTAL REVENUES 351,000 351,000 196,980 (154,020)
OTHER FINANCING USES:Transfers out (50,000) (50,000) (89,183) (39,183)
NET CHANGE IN FUND BALANCE 301,000 301,000 107,797 (193,203)
FUND BALANCE - BEGINNING OF YEAR 267,203 267,203 267,203 -
FUND BALANCE - END OF YEAR 568,203$ 568,203$ 375,000$ (193,203)$
See independent auditors' report.

- 115 -
CITY OF MONTEBELLO
SCHEDULE OF REVENUES, EXPENDITURES, ANDCHANGES IN FUND BALANCE - BUDGET AND ACTUAL
PROP C SPECIAL REVENUE FUND
For the year ended June 30, 2010
Variance withFinal Budget
Budgeted Amounts PositiveOriginal Final Actual (Negative)
REVENUES:Investment income - - 21,049$ 21,049$ Revenue from other agencies 770,023$ 770,023$ 747,345 (22,678)
TOTAL REVENUES 770,023 770,023 768,394 (1,629)
OTHER FINANCING USES:Transfers out (661,751) (661,751) (1,232,205) (570,454)
NET CHANGE IN FUND BALANCE 108,272 108,272 (463,811) (572,083)
FUND BALANCE - BEGINNING OF YEAR 2,306,033 2,306,033 2,306,033 -
FUND BALANCE - END OF YEAR 2,414,305$ 2,414,305$ 1,842,222$ (572,083)$
See independent auditors' report.

- 116 -
CITY OF MONTEBELLO
SCHEDULE OF REVENUES, EXPENDITURES, ANDCHANGES IN FUND BALANCE - BUDGET AND ACTUAL
METRO STATION SPECIAL REVENUE FUND
For the year ended June 30, 2010
Variance withFinal Budget
Budgeted Amounts PositiveOriginal Final Actual (Negative)
REVENUES:Investment income 7,000$ 7,000$ 1,812$ (5,188)$
FUND BALANCE - BEGINNING OF YEAR 177,689 177,689 177,689 -
FUND BALANCE - END OF YEAR 184,689$ 184,689$ 179,501$ (5,188)$
See independent auditors' report.
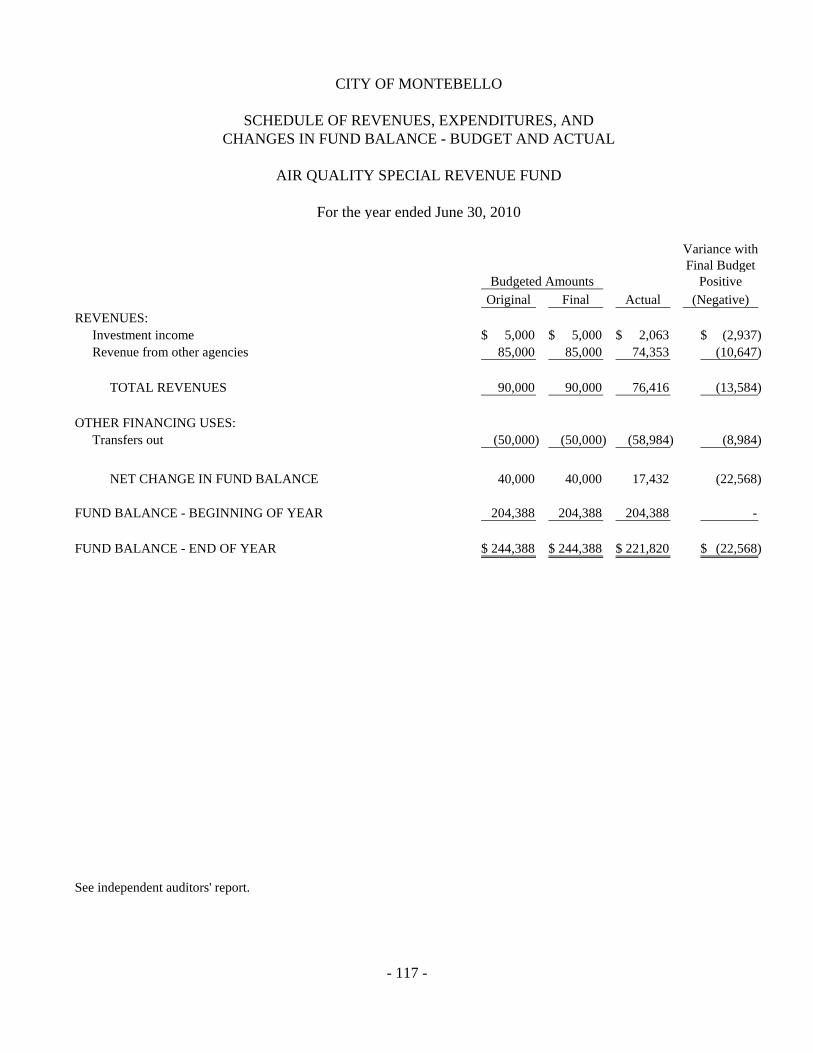
- 117 -
CITY OF MONTEBELLO
SCHEDULE OF REVENUES, EXPENDITURES, ANDCHANGES IN FUND BALANCE - BUDGET AND ACTUAL
AIR QUALITY SPECIAL REVENUE FUND
For the year ended June 30, 2010
Variance withFinal Budget
Budgeted Amounts PositiveOriginal Final Actual (Negative)
REVENUES:Investment income 5,000$ 5,000$ 2,063$ (2,937)$ Revenue from other agencies 85,000 85,000 74,353 (10,647)
TOTAL REVENUES 90,000 90,000 76,416 (13,584)
OTHER FINANCING USES:Transfers out (50,000) (50,000) (58,984) (8,984)
NET CHANGE IN FUND BALANCE 40,000 40,000 17,432 (22,568)
FUND BALANCE - BEGINNING OF YEAR 204,388 204,388 204,388 -
FUND BALANCE - END OF YEAR 244,388$ 244,388$ 221,820$ (22,568)$
See independent auditors' report.
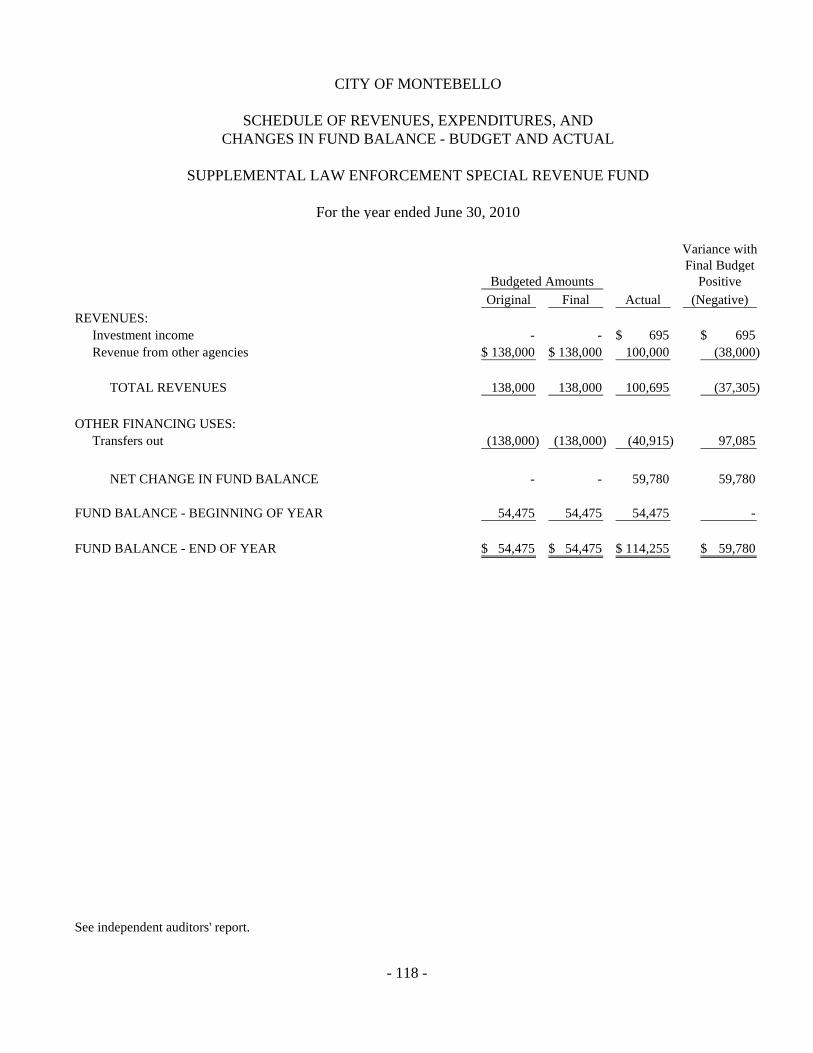
- 118 -
CITY OF MONTEBELLO
SCHEDULE OF REVENUES, EXPENDITURES, ANDCHANGES IN FUND BALANCE - BUDGET AND ACTUAL
SUPPLEMENTAL LAW ENFORCEMENT SPECIAL REVENUE FUND
For the year ended June 30, 2010
Variance withFinal Budget
Budgeted Amounts PositiveOriginal Final Actual (Negative)
REVENUES:Investment income - - 695$ 695$ Revenue from other agencies 138,000$ 138,000$ 100,000 (38,000)
TOTAL REVENUES 138,000 138,000 100,695 (37,305)
OTHER FINANCING USES:Transfers out (138,000) (138,000) (40,915) 97,085
NET CHANGE IN FUND BALANCE - - 59,780 59,780
FUND BALANCE - BEGINNING OF YEAR 54,475 54,475 54,475 -
FUND BALANCE - END OF YEAR 54,475$ 54,475$ 114,255$ 59,780$
See independent auditors' report.
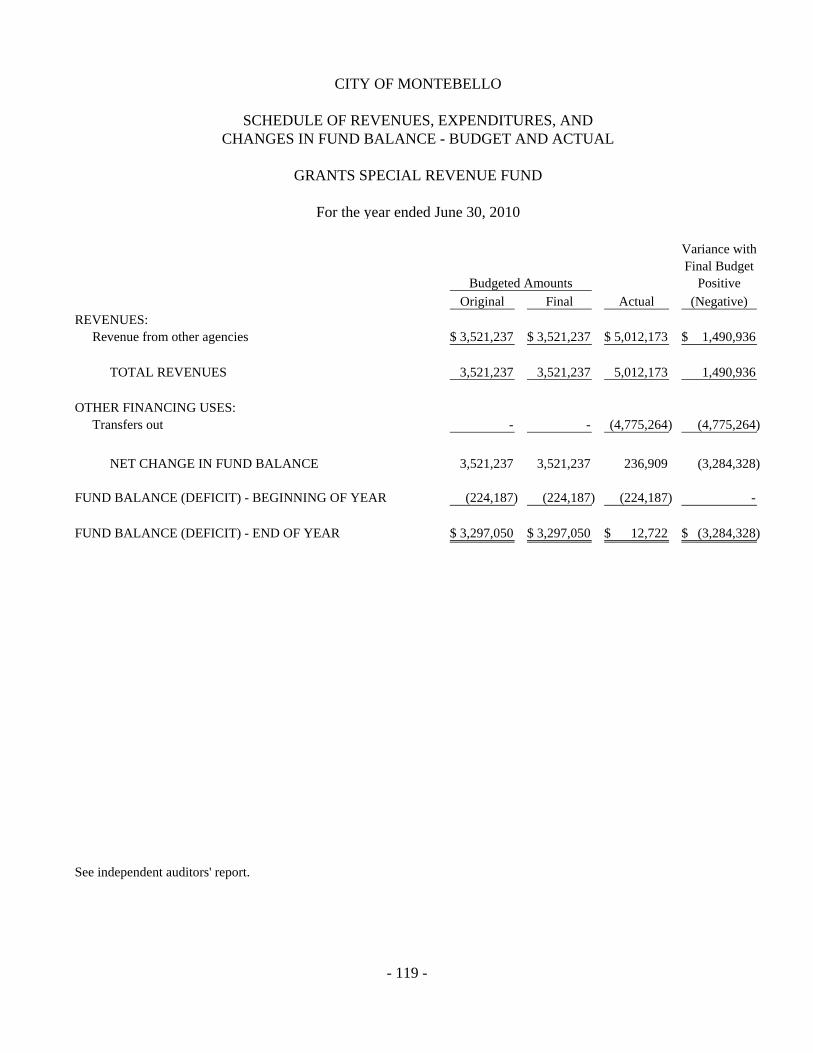
- 119 -
CITY OF MONTEBELLO
SCHEDULE OF REVENUES, EXPENDITURES, ANDCHANGES IN FUND BALANCE - BUDGET AND ACTUAL
GRANTS SPECIAL REVENUE FUND
For the year ended June 30, 2010
Variance withFinal Budget
Budgeted Amounts PositiveOriginal Final Actual (Negative)
REVENUES:Revenue from other agencies 3,521,237$ 3,521,237$ 5,012,173$ 1,490,936$
TOTAL REVENUES 3,521,237 3,521,237 5,012,173 1,490,936
OTHER FINANCING USES:Transfers out - - (4,775,264) (4,775,264)
NET CHANGE IN FUND BALANCE 3,521,237 3,521,237 236,909 (3,284,328)
FUND BALANCE (DEFICIT) - BEGINNING OF YEAR (224,187) (224,187) (224,187) -
FUND BALANCE (DEFICIT) - END OF YEAR 3,297,050$ 3,297,050$ 12,722$ (3,284,328)$
See independent auditors' report.
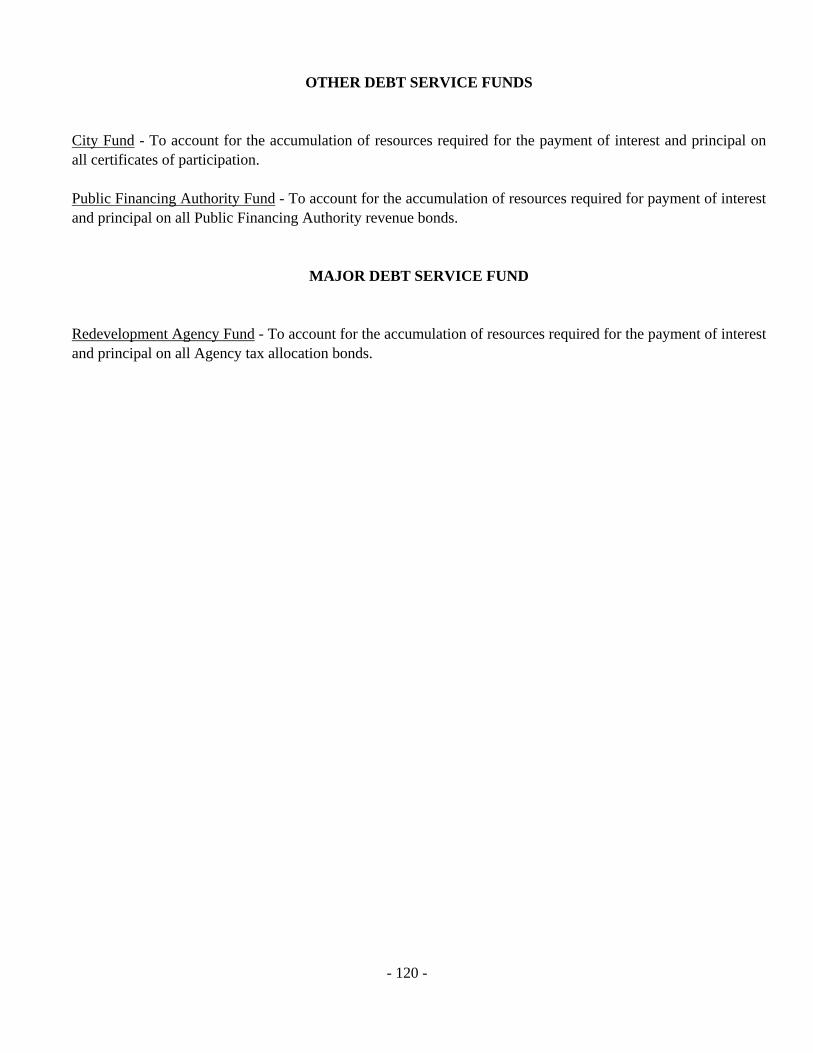
- 120 -
OTHER DEBT SERVICE FUNDS City Fund - To account for the accumulation of resources required for the payment of interest and principal on all certificates of participation. Public Financing Authority Fund - To account for the accumulation of resources required for payment of interest and principal on all Public Financing Authority revenue bonds.
MAJOR DEBT SERVICE FUND
Redevelopment Agency Fund - To account for the accumulation of resources required for the payment of interest and principal on all Agency tax allocation bonds.
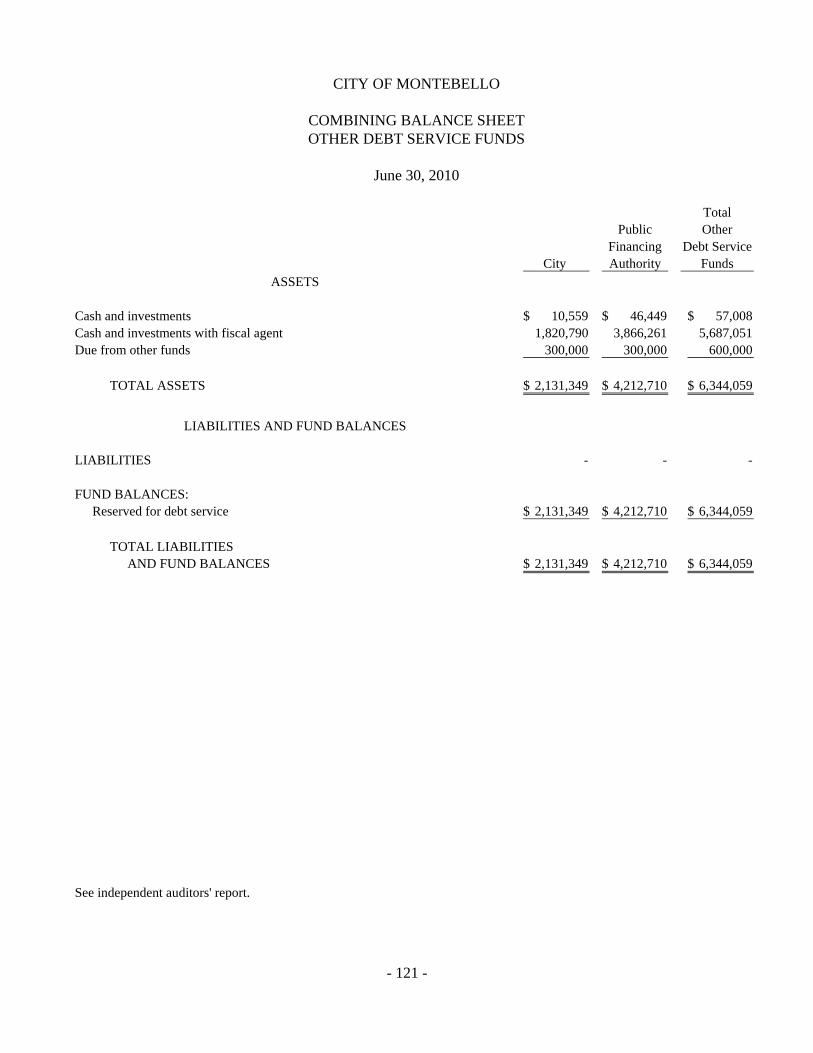
- 121 -
CITY OF MONTEBELLO
COMBINING BALANCE SHEETOTHER DEBT SERVICE FUNDS
June 30, 2010
TotalPublic Other
Financing Debt ServiceCity Authority Funds
ASSETS
Cash and investments 10,559$ 46,449$ 57,008$ Cash and investments with fiscal agent 1,820,790 3,866,261 5,687,051 Due from other funds 300,000 300,000 600,000
TOTAL ASSETS 2,131,349$ 4,212,710$ 6,344,059$
LIABILITIES AND FUND BALANCES
LIABILITIES - - -
FUND BALANCES:Reserved for debt service 2,131,349$ 4,212,710$ 6,344,059$
TOTAL LIABILITIESAND FUND BALANCES 2,131,349$ 4,212,710$ 6,344,059$
See independent auditors' report.

- 122 -
CITY OF MONTEBELLO
COMBINING STATEMENT OF REVENUES, EXPENDITURES, ANDCHANGES IN FUND BALANCES - OTHER DEBT SERVICE FUNDS
For the year ended June 30, 2010
TotalPublic Other
Financing Debt ServiceCity Authority Funds
REVENUES:Investment income - 8$ 8$
EXPENDITURES:Debt service:
Principal payments 1,203,020$ 275,000 1,478,020 Interest and fees 873,921 80,174 954,095 Other 19,251 3,000 22,251
TOTAL EXPENDITURES 2,096,192 358,174 2,454,366
EXCESS OF REVENUES OVER(UNDER) EXPENDITURES (2,096,192) (358,166) (2,454,358)
OTHER FINANCING SOURCES:Transfers in 1,322,704 931,136 2,253,840
NET CHANGE IN FUND BALANCE (773,488) 572,970 (200,518)
FUND BALANCES - BEGINNING OF YEAR 2,904,837 3,639,740 6,544,577
FUND BALANCES - END OF YEAR 2,131,349$ 4,212,710$ 6,344,059$
See independent auditors' report.

- 123 -
CITY OF MONTEBELLO
SCHEDULE OF REVENUES, EXPENDITURES, ANDCHANGES IN FUND BALANCE - BUDGET AND ACTUAL
CITY DEBT SERVICE FUND
For the year ended June 30, 2010
Variance withFinal Budget
Budgeted Amounts PositiveOriginal Final Actual (Negative)
REVENUES:Investment income 120,000$ 120,000$ - (120,000)$
EXPENDITURES:Debt Service:
Principal payments 1,203,020 1,203,020 1,203,020$ - Interest and fees 1,119,684 1,119,684 873,921 245,763 Other - - 19,251 (19,251)
TOTAL EXPENDITURES 2,322,704 2,322,704 2,096,192 226,512
EXCESS OF REVENUES OVER(UNDER) EXPENDITURES (2,202,704) (2,202,704) (2,096,192) 106,512
OTHER FINANCING SOURCES:Transfers in 1,122,704 1,122,704 1,322,704 200,000
NET CHANGE IN FUND BALANCE (1,080,000) (1,080,000) (773,488) 306,512
FUND BALANCE - BEGINNING OF YEAR 2,904,837 2,904,837 2,904,837 -
FUND BALANCE - END OF YEAR 1,824,837$ 1,824,837$ 2,131,349$ 306,512$
See independent auditors' report.

- 124 -
CITY OF MONTEBELLO
SCHEDULE OF REVENUES, EXPENDITURES, ANDCHANGES IN FUND BALANCE - BUDGET AND ACTUAL
PUBLIC FINANCING AUTHORITY DEBT SERVICE FUND
For the year ended June 30, 2010
Variance withFinal Budget
Budgeted Amounts PositiveOriginal Final Actual (Negative)
REVENUES:Investment income 60,000$ 60,000$ 8$ (59,992)$
EXPENDITURES:Debt Service:
Principal payments 275,000 275,000 275,000 - Interest and fees 323,400 323,400 80,174 243,226 Other - - 3,000 (3,000)
TOTAL EXPENDITURES 598,400 598,400 358,174 240,226
EXCESS OF REVENUES OVER(UNDER) EXPENDITURES (538,400) (538,400) (358,166) 180,234
OTHER FINANCING SOURCES:Transfer in - - 931,136 931,136
NET CHANGE IN FUND BALANCE (538,400) (538,400) 572,970 1,111,370
FUND BALANCE - BEGINNING OF YEAR 3,639,740 3,639,740 3,639,740 -
FUND BALANCE - END OF YEAR 3,101,340$ 3,101,340$ 4,212,710$ 1,111,370$
See independent auditors' report.

- 125 -
CITY OF MONTEBELLO
SCHEDULE OF REVENUES, EXPENDITURES, ANDCHANGES IN FUND BALANCE - BUDGET AND ACTUAL
REDEVELOPMENT AGENCY DEBT SERVICE FUND - MAJOR FUND
For the year ended June 30, 2010
Variance withFinal Budget
Budgeted Amounts PositiveOriginal Final Actual (Negative)
REVENUES:Property taxes 13,731,000$ 13,731,000$ 14,877,565$ 1,146,565$ Investment income 300,000 300,000 54,085 (245,915)
TOTAL REVENUES 14,031,000 14,031,000 14,931,650 900,650
EXPENDITURES:Debt Service:
Principal payments 2,510,000 2,510,000 2,670,000 (160,000) Interest and fees 3,818,279 3,818,279 3,723,737 94,542
TOTAL EXPENDITURES 6,328,279 6,328,279 6,393,737 (65,458)
EXCESS OF REVENUES OVER(UNDER) EXPENDITURES 7,702,721 7,702,721 8,537,913 835,192
OTHER FINANCING SOURCES:Transfers in 4,046,000 4,046,000 2,012,887 (2,033,113) Transfers out (8,946,000) (8,946,000) (18,239,513) (9,293,513)
OTHER FINANCING SOURCES (USES): (4,900,000) (4,900,000) (16,226,626) (11,326,626)
NET CHANGE IN FUND BALANCE 2,802,721 2,802,721 (7,688,713) (10,491,434)
FUND BALANCE - BEGINNING OF YEAR 21,637,700 21,637,700 21,637,700 -
FUND BALANCE - END OF YEAR 24,440,421$ 24,440,421$ 13,948,987$ (10,491,434)$
See independent auditors' report.

- 126 -
OTHER CAPITAL PROJECTS FUND Public Financing Authority Fund - To account for the proceeds received and issuance of bonds for capital improvements.
MAJOR CAPITAL PROJECTS FUNDS Capital Improvements Fund - To account for financial resources segregated for the acquisition of major general City capital facilities other than those financed by special assessment and proprietary funds. Redevelopment Agency Fund - To account for financial resources segregated for the acquisition of and rehabilitation of capital facilities within the redevelopment project areas.
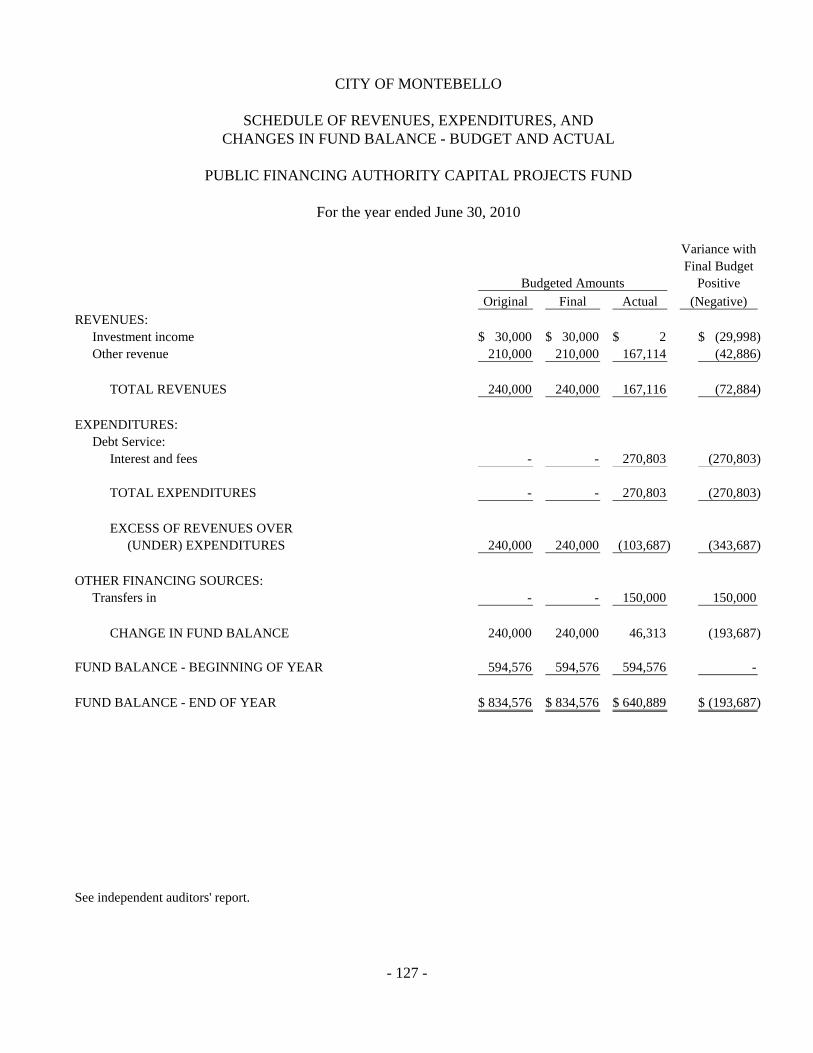
- 127 -
CITY OF MONTEBELLO
SCHEDULE OF REVENUES, EXPENDITURES, ANDCHANGES IN FUND BALANCE - BUDGET AND ACTUAL
PUBLIC FINANCING AUTHORITY CAPITAL PROJECTS FUND
For the year ended June 30, 2010
Variance withFinal Budget
Budgeted Amounts PositiveOriginal Final Actual (Negative)
REVENUES:Investment income 30,000$ 30,000$ 2$ (29,998)$ Other revenue 210,000 210,000 167,114 (42,886)
TOTAL REVENUES 240,000 240,000 167,116 (72,884)
EXPENDITURES:Debt Service:
Interest and fees - - 270,803 (270,803)
TOTAL EXPENDITURES - - 270,803 (270,803)
EXCESS OF REVENUES OVER(UNDER) EXPENDITURES 240,000 240,000 (103,687) (343,687)
OTHER FINANCING SOURCES:Transfers in - - 150,000 150,000
CHANGE IN FUND BALANCE 240,000 240,000 46,313 (193,687)
FUND BALANCE - BEGINNING OF YEAR 594,576 594,576 594,576 -
FUND BALANCE - END OF YEAR 834,576$ 834,576$ 640,889$ (193,687)$
See independent auditors' report.

- 128 -
CITY OF MONTEBELLO
SCHEDULE OF REVENUES, EXPENDITURES, ANDCHANGES IN FUND BALANCE - BUDGET AND ACTUAL
CAPITAL IMPROVEMENTS CAPITAL PROJECTS FUND
For the year ended June 30, 2010
Variance withFinal Budget
Budgeted Amounts PositiveOriginal Final Actual (Negative)
REVENUES:Investment income 1,100,000$ 1,100,000$ 585,922$ (514,078)$ Revenue from other agencies - - 208,071 208,071 Other revenue 100,000 100,000 - (100,000)
TOTAL REVENUES 1,200,000 1,200,000 793,993 (406,007)
EXPENDITURES:Capital outlay 32,926,251 32,926,251 8,039,489 24,886,762 Debt Service:
Principal payments - - 251,000 (251,000)
TOTAL EXPENDITURES 32,926,251 32,926,251 8,290,489 24,635,762
EXCESS OF REVENUES OVER(UNDER) EXPENDITURES (31,726,251) (31,726,251) (7,496,496) 24,229,755
OTHER FINANCING SOURCES (USES):Transfers in - - 9,294,180 9,294,180 Transfers out - - (1,729,332) (1,729,332)
TOTAL OTHER FINANCINGSOURCES (USES) - - 7,564,848 7,564,848
NET CHANGE IN FUND BALANCE (31,726,251) (31,726,251) 68,352 31,794,603
FUND BALANCE - BEGINNING OF YEAR (765,485) (765,485) (765,485) -
FUND BALANCE - END OF YEAR (32,491,736)$ (32,491,736)$ (697,133)$ 31,794,603$
See independent auditors' report.

- 129 -
CITY OF MONTEBELLO
SCHEDULE OF REVENUES, EXPENDITURES, ANDCHANGES IN FUND BALANCE - BUDGET AND ACTUAL
REDEVELOPMENT AGENCY CAPITAL PROJECTS FUND
For the year ended June 30, 2010
Variance withFinal Budget
Budgeted Amounts PositiveOriginal Final Actual (Negative)
REVENUES:Property taxes 2,240,000$ 2,240,000$ 2,158,900$ (81,100)$ Investment income 590,000 590,000 163,025 (426,975) Other revenue 530,000 530,000 762,894 232,894
TOTAL REVENUES 3,360,000 3,360,000 3,084,819 (275,181)
EXPENDITURES:Current:
Housing and community development 5,876,013 5,876,013 9,257,493 (3,381,480) Capital outlay - - 3,476,414 (3,476,414) Debt service:
Principal payments - - 438,757 (438,757) Other - - 257,775 (257,775)
TOTAL EXPENDITURES 5,876,013 5,876,013 13,430,439 (7,554,426)
EXCESS OF REVENUES OVER(UNDER) EXPENDITURES (2,516,013) (2,516,013) (10,345,620) (7,829,607)
OTHER FINANCING SOURCES (USES):Transfers in 6,200,000 6,200,000 18,239,513 12,039,513 Transfers out (3,101,811) (3,101,811) (3,814,698) (712,887)
TOTAL OTHER FINANCINGSOURCES (USES) 3,098,189 3,098,189 14,424,815 11,326,626
NET CHANGE IN FUND BALANCE 582,176 582,176 4,079,195 3,497,019
FUND BALANCE - BEGINNING OF YEAR 31,997,485 31,997,485 31,997,485 -
FUND BALANCE - END OF YEAR 32,579,661$ 32,579,661$ 36,076,680$ 3,497,019$
See independent auditors' report.
- 130 -
OTHER ENTERPRISE FUNDS Water Utility Fund - To account for the provision of water to the residents of the City. All activities necessary to provide such service are accounted for in this fund, including, but not limited to, administration, operations, maintenance, financing, and billing and collection. Detention Facility Fund - To account for all revenues and expenses related to the operations of the Montebello Police Department jail.

- 131 -
CITY OF MONTEBELLO
COMBINING STATEMENT OF NET ASSETS - OTHER ENTERPRISE FUNDS
June 30, 2010
TotalOther
Water Detention EnterpriseUtility Facility Funds
ASSETSCURRENT ASSETS:
Cash and investments 5,081$ 56,483$ 61,564$ Accounts receivable 224,197 - 224,197 Due from other funds 1,230,000 - 1,230,000
TOTAL CURRENT ASSETS 1,459,278 56,483 1,515,761
NONCURRENT ASSETS:Capital assets:
Land 35,000 - 35,000 Buildings and improvements 141,284 - 141,284 Machinery and equipment 2,185,927 18,891 2,204,818 Less: Allowance for depreciation (1,967,974) (13,609) (1,981,583)
NET CAPITAL ASSETS 394,237 5,282 399,519
TOTAL ASSETS 1,853,515 61,765 1,915,280
LIABILITIESLIABILITIES:
CURRENT LIABILITIES:Accounts payable and accrued liabilities 184,772 41,106 225,878 Deposits payable 31,675 - 31,675 Compensated absences 989 - 989
TOTAL CURRENT LIABILITIES 217,436 41,106 258,542
NET ASSETS:Invested in capital assets 394,237 5,282 399,519 Unrestricted 1,241,842 15,377 1,257,219
TOTAL NET ASSETS 1,636,079$ 20,659$ 1,656,738$
See independent auditors' report.

- 132 -
CITY OF MONTEBELLO
COMBINING STATEMENT OF REVENUES, EXPENSES, ANDCHANGES IN FUND NET ASSETS - OTHER ENTERPRISE FUNDS
For the year ended June 30, 2010
TotalOther
Water Detention EnterpriseUtility Facility Funds
OPERATING REVENUES:Charges for services 1,412,456$ 172,025$ 1,584,481$
OPERATING EXPENSES:Labor and fringe benefits 6,161 - 6,161 Repairs and maintenance 42 8,282 8,324 Purchased water 1,351,135 - 1,351,135 Utilities 117,598 - 117,598 Contract services 11,389 486,158 497,547 Depreciation expense 53,675 961 54,636 Administrative expense 90,000 - 90,000
TOTAL OPERATING EXPENSES 1,630,000 495,401 2,125,401
OPERATING LOSS (217,544) (323,376) (540,920)
NONOPERATING REVENUES:Investment income 239 918 1,157
LOSS BEFORE TRANSFERS (217,305) (322,458) (539,763)
TRANSFERS IN - 250,000 250,000
CHANGE IN NET ASSETS (217,305) (72,458) (289,763)
NET ASSETS - BEGINNING OF YEAR 1,853,384 93,117 1,946,501
NET ASSETS - END OF YEAR 1,636,079$ 20,659$ 1,656,738$
See independent auditors' report.

- 133 -
CITY OF MONTEBELLO
COMBINING STATEMENT OF CASH FLOWS - OTHER ENTERPRISE FUNDS
For the year ended June 30, 2010
TotalOther
Water Detention EnterpriseUtility Facility Funds
CASH FLOWS FROM OPERATING ACTIVITIES:Receipts from customers 1,409,152$ 172,025$ 1,581,177$ Payments to suppliers (1,484,811) (490,852) (1,975,663) Payments to employees (6,176) - (6,176)
NET CASH USED BYOPERATING ACTIVITIES (81,835) (318,827) (400,662)
CASH FLOWS FROM NONCAPITALFINANCING ACTIVITIES:
Cash received from other funds - 250,000 250,000 Cash paid to other funds (30,000) - (30,000)
NET CASH PROVIDED (USED) BYNONCAPITAL FINANCING ACTIVITIES (30,000) 250,000 220,000
CASH FLOWS FROM INVESTING ACTIVITIES:Interest received 239 918 1,157
NET DECREASE IN CASH AND CASH EQUIVALENTS (111,596) (67,909) (179,505)
CASH AND CASH EQUIVALENTS - BEGINNING OF YEAR 116,677 124,392 241,069
CASH AND CASH EQUIVALENTS - END OF YEAR 5,081$ 56,483$ 61,564$
RECONCILIATION OF OPERATING LOSS TO NET CASH USED BY OPERATING ACTIVITIES:
Operating loss (217,544)$ (323,376)$ (540,920)$ Adjustments to reconcile operating loss
to net cash used by operating activities:Depreciation and amortization 53,675 961 54,636 Changes in operating assets and liabilities:
(Increase) decrease in accounts receivable (3,304) - (3,304) Increase (decrease) in accounts payable and
accrued liabilities including compensated absences 85,338 3,588 88,926
NET CASH USED BYOPERATING ACTIVITIES (81,835)$ (318,827)$ (400,662)$
See independent auditors' report.

- 134 -
INTERNAL SERVICE FUNDS Corporate Shop Fund - To account for the costs of operating a maintenance facility for automotive equipment used by City departments. Equipment Reserve Fund - To account for the financing for replacement of all equipment used by City departments. Self-Insurance Fund - To account for the accumulation of resources for and liquidation of the City's self-insurance claims.

- 135 -
CITY OF MONTEBELLO
COMBINING STATEMENT OF NET ASSETS - ALL INTERNAL SERVICE FUNDS
June 30, 2010
Corporate EquipmentShop Reserve Self-Insurance Totals
ASSETSCURRENT ASSETS:
Cash and investments 56,808$ 22,952$ 46,504$ 126,264$ Accounts receivable 10,000 10,000 Due from other funds 300,000 1,100,000 8,740,000 10,140,000Inventories 844,981 - - 844,981 Prepaid expenses - - 1,122 1,122
TOTAL CURRENT ASSETS 1,201,789 1,122,952 8,797,626 11,122,367
NONCURRENT ASSETS:Capital assets:
Land 108,369 - - 108,369 Buildings and improvements 428,794 - - 428,794 Machinery and equipment 643,651 - - 643,651 Less: Allowance for depreciation (1,055,606) - - (1,055,606)
NET CAPITAL ASSETS 125,208 - - 125,208
TOTAL ASSETS 1,326,997 1,122,952 8,797,626 11,247,575
LIABILITIES AND NET ASSETS
LIABILITIES:CURRENT LIABILITIES:
Accounts payable and accrued liabilities 245,637 - 8,392 254,029 Claims payable - - 10,329,125 10,329,125Compensated absences 243,290 - 417 243,707
TOTAL CURRENT LIABILITIES 488,927 - 10,337,934 10,826,861
LONG-TERM LIABILITIES:Compensated absences 47,703 - - 47,703
TOTAL LIABILITIES 536,630 - 10,337,934 10,874,564
NET ASSETS (DEFICIT):Invested in capital assets 125,208 - - 125,208 Unrestricted 665,159 1,122,952 (1,540,308) 247,803
TOTAL NET ASSETS (DEFICIT) 790,367$ 1,122,952$ (1,540,308)$ 373,011$
See independent auditors' report.

- 136 -
CITY OF MONTEBELLO
COMBINING STATEMENT OF REVENUES, EXPENSES, AND CHANGES IN FUND NET ASSETS - ALL INTERNAL SERVICE FUNDS
For the year ended June 30, 2010
Corporate EquipmentShop Reserve Self-Insurance Totals
OPERATING REVENUES:Charges for services 7,165,703$ - 4,419,919$ 11,585,622$
OPERATING EXPENSES:Labor and fringe benefits 3,194,735 - 222,220 3,416,955 Materials and supplies 2,729,982 238,121$ 561 2,968,664 Repairs and maintenance 781,493 781,493 Insurance claims and premiums 5,393,493 5,393,493 Contractual services 229,147 112,877 342,024 Depreciation expense 1,639 1,639 Administrative expense 66,100 66,100 Other expenses 26,604 - 3,970 30,574
TOTAL OPERATING EXPENSES 6,963,600 238,121 5,799,221 13,000,942
OPERATING INCOME (LOSS)BEFORE TRANSFERS 202,103 (238,121) (1,379,302) (1,415,320)
TRANSFERS IN - - - -
TRANSFERS OUT - - - -
CHANGE IN NET ASSETS 202,103 (238,121) (1,379,302) (1,415,320)
NET ASSETS (DEFICIT) - BEGINNING OF YEAR 588,264 1,361,073 (161,006) 1,788,331
NET ASSETS (DEFICIT) - END OF YEAR 790,367$ 1,122,952$ (1,540,308)$ 373,011$
See independent auditors' report.

- 137 -
CITY OF MONTEBELLO
COMBINING STATEMENT OF CASH FLOWS - ALL INTERNAL SERVICE FUNDS
For the year ended June 30, 2010
Corporate EquipmentShop Reserve Self-Insurance Totals
CASH FLOWS FROM OPERATING ACTIVITIES:Receipts from customers 7,165,703$ - 4,419,919$ 11,585,622$ Payments to suppliers (4,046,854) (281,996)$ (5,099,874) (9,428,724) Payments to employees (3,197,781) - (251,188) (3,448,969)
NET CASH USED BYOPERATING ACTIVITIES (78,932) (281,996) (931,143) (1,292,071)
CASH FLOWS FROM NONCAPITALFINANCING ACTIVITIES:
Cash received from other funds - - 760,000 760,000 Cash paid to other funds (300,000) (100,000) - (400,000)
NET CASH PROVIDED (USED) BYNONCAPITAL FINANCING ACTIVITIES (300,000) (100,000) 760,000 360,000
NET DECREASE IN CASHAND CASH EQUIVALENTS (378,932) (381,996) (171,143) (932,071)
CASH AND CASH EQUIVALENTS - BEGINNING OF YEAR 435,740 404,948 217,647 1,058,335
CASH AND CASH EQUIVALENTS - END OF YEAR 56,808$ 22,952$ 46,504$ 126,264$
RECONCILIATION OF OPERATING INCOME (LOSS) TO NET CASH USED BY OPERATING ACTIVITIES:
Operating income (loss) 202,103$ (238,121)$ (1,379,302)$ (1,415,320)$ Adjustments to reconcile operating income (loss)
to net cash used by operating activities:Depreciation and amortization 1,639 - - 1,639 Changes in operating assets and liabilities:
(Increase) decrease in inventories (267,829) - - (267,829) Increase (decrease) in accrued liabilities
including compensated absences (14,845) (43,875) (29,355) (88,075) Increase in claims payable - - 477,514 477,514
NET CASH USED BYOPERATING ACTIVITIES (78,932)$ (281,996)$ (931,143)$ (1,292,071)$
See independent auditors' report.

- 138 -
AGENCY FUND Deposits Agency Fund - To account for money and property held by the City as a custodian.

- 139 -
CITY OF MONTEBELLO
STATEMENT OF CHANGES IN ASSETS AND LIABILITIESDEPOSITS AGENCY FUND
For the year ended June 30, 2010
Balance BalanceJuly 1, 2009 Additions Deletions June 30, 2010
ASSETS:Cash and investments 1,331,282$ 224,581$ (84,012)$ 1,471,851$
LIABILITIES:Deposits payable 1,331,282$ 224,581$ (84,012)$ 1,471,851$
See independent auditors' report.

- 140 -
THIS PAGE LEFT INTENTIONALLY BLANK


- 141 -
CITY OF MONTEBELLO
DESCRIPTION OF STATISTICAL SECTION CONTENTS
June 30, 2010 STATISTICAL SECTION (Unaudited) This part of the City of Montebello's comprehensive annual financial report presents detailed information as a context for understanding what the information in the financial statements, note disclosures, and required supplementary information say about the government's overall financial health. Contents: Pages
Financial Trends these schedules contain trend information to help the reader understand how the City's financial performance and well-being have changed over time. 142 - 151 Revenue Capacity these schedules contain information to help the reader assess the City's most significant local revenue source, the property tax. 152 - 157 Debt Capacity these schedules present information to help the reader assess the affordability of the City's current levels of outstanding debt and the City's ability to issue additional debt in the future. 158 -162 Demographic and Economic Information these schedules offer demographic and economic indicators to help the reader understand the environment within which the City's financial activities take place. 163 - 164 Operating Information these schedules contain service and infrastructure data to help the reader understand how the information in the City's financial report relates to the services the City provides and the activities it performs. 165 - 169

- 142 -
CITY OF MONTEBELLO
Net Assets by ComponentLast Seven Fiscal Years
(accrual basis of accounting)
Fiscal Year2003-04 2004-05 2005-06 2006-07
Governmental ActivitiesInvested in capital assets, net of related debt 33,660,258$ 16,757,420$ 16,757,420$ 16,757,420$ Restricted 19,658,192 46,255,503 45,942,363 51,949,836 Unrestricted (49,100,210) (61,733,648) (57,664,431) (52,527,623)
Total governmental activities net assets 4,218,240 1,279,275 5,035,352 16,179,633
Business-Type ActivitiesInvested in capital assets, net of related debt 30,552,511 29,488,367 30,705,710 28,924,295 Restricted - - - - Unrestricted 1,235,097 1,395,613 2,418,506 2,818,773
31,787,608 30,883,980 33,124,216 31,743,068 Primary Government
Invested in capital assets, net of related debt 64,212,769 46,245,787 47,463,130 45,681,715 Restricted 19,658,192 46,255,503 45,942,363 51,949,836 Unrestricted (47,865,113) (60,338,035) (55,245,925) (49,708,850)
36,005,848$ 32,163,255$ 38,159,568$ 47,922,701$
Source: City Financial Statements

- 143 -
Fiscal Year2007-08 2008-09 2009-10
16,757,420$ 28,992,463$ 51,377,564$ 61,999,161 63,061,184 24,305,187
(51,800,615) (68,290,188) (46,153,068)
26,955,966 23,763,459 29,529,683
29,084,971 37,693,683 50,781,549
- - - 959,454 (1,469,666) (3,518,995)
30,044,425 36,224,017 47,262,554
45,842,391 66,686,146 102,159,113 61,999,161 63,061,184 24,305,187
(50,841,161) (69,759,854) (49,672,063) 57,000,391$ 59,987,476$ 76,792,237$

- 144 -
CITY OF MONTEBELLO
Changes in Net Assets - Expense and Program RevenuesLast Seven Fiscal Years
(accrual basis of accounting)
Fiscal Year2003-04 2004-05 2005-06 2006-07
Expenses:Governmental Activities:
General government 7,059,326$ 6,365,313$ 7,327,350$ 7,665,115$ Public safety 26,445,568 25,540,413 25,635,372 26,246,104 Public works 7,791,284 7,141,347 8,349,482 4,454,728 Parks, recreation, and culture 3,813,647 5,776,598 6,932,418 4,628,107 Housing and community development 4,755,509 10,324,816 3,129,908 7,245,302 Unallocated infrastructure depreciation 748,396 746,251 506,840 582,928 Interest on long-term debt 6,138,798 5,104,601 5,725,349 5,987,723
Total governmental activities and expenses 56,752,528 60,999,339 57,606,719 56,810,007
Business-Type Activities:Transit 20,409,101 21,132,477 24,540,700 26,033,078 Golf course 2,968,708 2,884,869 3,035,806 3,310,810 Hilton - - 3,209,676 3,411,125 Other programs 3,785,343 4,254,116 1,644,374 1,630,225
Total business-type activities and expenses 27,163,152 28,271,462 32,430,556 34,385,238 Total primary government expenses 83,915,680$ 89,270,801$ 90,037,275$ 91,195,245$
Program revenues:Governmental Activities:
Charges for servicesGeneral government 2,662,230$ 2,833,351$ 2,892,218$ 3,135,760$ Public safety 1,101,733 1,025,580 1,156,226 1,437,604 Public works 4,031,728 4,432,232 4,948,126 5,464,663 Parks, recreation, and culture 513,121 497,942 468,623 476,112 Housing and community development - - - 107,737
Operating grants and contributions 5,735,847 7,775,862 6,006,905 9,040,588 Total governmental activities program revenues 14,044,659 16,564,967 15,472,098 19,662,464
Business-Type Activities:Charges for services
Transit 6,667,857 5,332,698 5,570,132 5,896,805 Golf course 3,300,271 2,323,086 3,370,757 3,399,226 Hilton 4,517,465 5,099,245 4,157,197 4,391,536 Other Programs - - 1,487,036 1,702,443
Operating grants and contributions 11,031,142 13,498,708 16,944,255 15,746,472 Capital grants and contributions 1,388,760 955,190 3,357,984 122,409
Total business-type activities program revenues 26,905,495 27,208,927 34,887,361 31,258,891 Primary government program revenues 40,950,154$ 43,773,894$ 50,359,459$ 50,921,355$
Net (Expense) Revenue:Governmental activities: (42,707,869)$ (44,434,372)$ (42,134,621)$ (37,147,543)$ Business-type activities: (257,657) (1,062,535) 2,456,805 (3,126,347)
Total primary government net (expense) revenue (42,965,526)$ (45,496,907)$ (39,677,816)$ (40,273,890)$
Source: City Financial Statements

- 145 -
Fiscal Year2007-08 2008-09 2009-10
8,793,934$ 10,840,411$ 5,181,691$ 29,893,922 33,131,797 34,440,947
5,375,202 5,098,404 5,383,610 5,014,204 4,994,538 6,194,042 5,533,866 12,760,934 12,479,919
612,202 659,156 698,249 6,425,606 5,837,489 5,072,065
61,648,936 73,322,729 69,450,523
28,483,736 25,773,717 24,752,340 3,044,757 3,404,206 3,064,788 3,774,282 3,521,600 3,509,164 2,245,349 1,895,974 2,125,401
37,548,124 34,595,497 33,451,693 99,197,060$ 107,918,226$ 102,902,216$
3,230,738$ 3,293,527$ 3,854,697$ 2,222,811 2,383,579 2,741,147 5,793,246 5,651,310 5,059,588
721,531 735,910 501,801 - -
9,074,067 7,256,003 9,829,694 21,042,393 19,320,329 21,986,927
5,856,016 6,391,094 6,156,991 3,178,243 2,806,983 2,537,564 4,590,851 3,994,972 3,846,393 1,722,561 1,457,989 1,585,638
19,462,038 17,243,596 15,487,526 938,311 9,578,566 16,253,784
35,748,020 41,473,200 45,867,896 56,790,413$ 60,793,529$ 67,854,823$
(40,606,543)$ (54,002,400)$ (47,463,596)$ (1,800,104) 6,877,703 12,416,203
(42,406,647)$ (47,124,697)$ (35,047,393)$

- 146 -
CITY OF MONTEBELLO
Changes in Net Assets - General RevenuesLast Seven Fiscal Years
(accrual basis of accounting)
Fiscal Year2003-04 2004-05 2005-06 2006-07
General Revenues and Other Changes in Net Assets:Governmental Activities:
Property taxes, levied for general purposes 19,533,005$ 19,651,384$ 21,695,458$ 22,851,037$ Franchise taxes 1,091,014 942,645 1,059,921 1,228,866 Sales tax 9,968,228 11,620,826 12,119,985 12,620,273 Transient Occupancy tax 263,947 261,501 299,819 263,457 Unrestricted intergovernmental revenue 4,060,037 4,128,660 4,611,374 4,768,533 Rental income 97,335 79,597 93,037 - Other revenues 2,091,489 2,924,572 3,147,168 4,578,393 Investment earnings 1,711,674 2,011,649 2,591,235 3,052,086 Transfers (380,371) (125,427) 272,701 (1,070,821)
Total governmental activities 38,436,358 41,495,407 45,890,698 48,291,824
Business-Type Activities:Other revenues - 921,990 - - Investment earnings 4,374 25,477 56,132 114,890 Transfers 380,371 125,427 (272,701) 1,070,821
Total business-type activities 384,745 1,072,894 (216,569) 1,185,711
Total primary government 38,821,103$ 42,568,301$ 45,674,129$ 49,477,535$
Change in Net Assets:Governmental Activities: (4,251,511)$ (2,938,965)$ 3,756,077$ 11,144,281$ Business-Type Activities: 127,088 10,359 2,240,236 (1,940,636)
Total primary government (4,124,423)$ (2,928,606)$ 5,996,313$ 9,203,645$
Source: City Financial Statements

- 147 -
Fiscal Year2007-08 2008-09 2009-10
25,324,813$ 26,981,166$ 26,991,825$ 1,220,316 1,088,537 1,254,753
11,390,099 10,509,273 8,048,518 288,514 234,980 243,276
5,037,324 5,288,610 5,252,095 - - -
3,474,114 3,264,050 1,873,556 4,446,085 2,671,569 341,815
201,611 771,708 1,377,666
51,382,876 50,809,893 45,383,504
- - - 75,421 73,597 -
(201,611) (771,708) (1,377,666)
(126,190) (698,111) (1,377,666)
51,256,686$ 50,111,782$ 44,005,838$
10,776,333$ (3,192,507)$ (2,080,092)$ (1,926,294) 6,179,592 11,038,537
8,850,039$ 2,987,085$ 8,958,445$
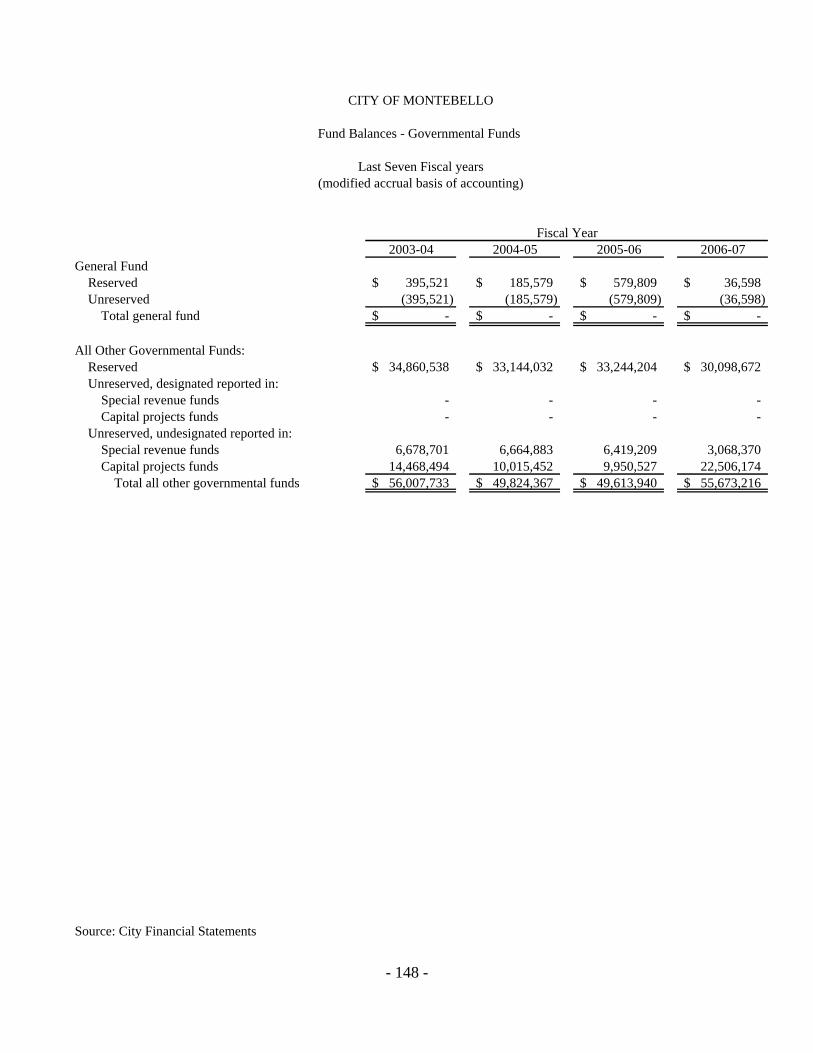
- 148 -
CITY OF MONTEBELLO
Fund Balances - Governmental Funds
Last Seven Fiscal years(modified accrual basis of accounting)
Fiscal Year2003-04 2004-05 2005-06 2006-07
General FundReserved 395,521$ 185,579$ 579,809$ 36,598$ Unreserved (395,521) (185,579) (579,809) (36,598)
Total general fund -$ -$ -$ -$
All Other Governmental Funds:Reserved 34,860,538$ 33,144,032$ 33,244,204$ 30,098,672$ Unreserved, designated reported in:
Special revenue funds - - - - Capital projects funds - - - -
Unreserved, undesignated reported in:Special revenue funds 6,678,701 6,664,883 6,419,209 3,068,370 Capital projects funds 14,468,494 10,015,452 9,950,527 22,506,174
Total all other governmental funds 56,007,733$ 49,824,367$ 49,613,940$ 55,673,216$
Source: City Financial Statements
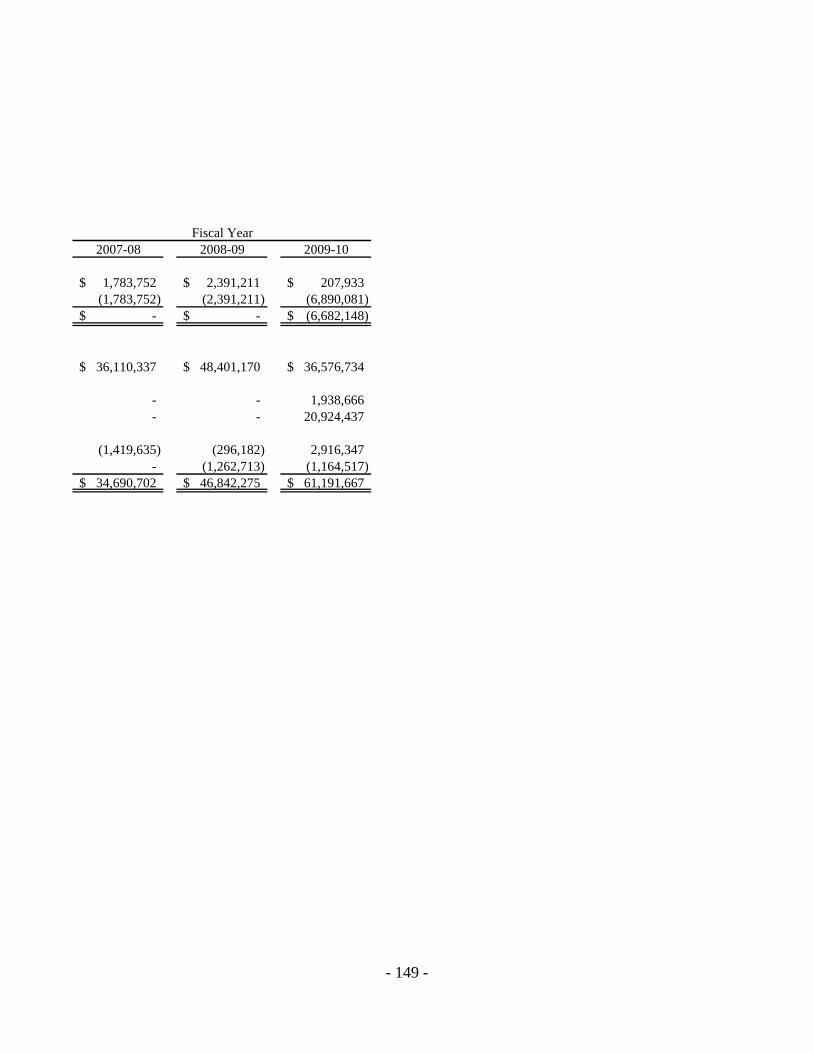
- 149 -
Fiscal Year2007-08 2008-09 2009-10
1,783,752$ 2,391,211$ 207,933$ (1,783,752) (2,391,211) (6,890,081)
-$ -$ (6,682,148)$
36,110,337$ 48,401,170$ 36,576,734$
- - 1,938,666 - - 20,924,437
(1,419,635) (296,182) 2,916,347 - (1,262,713) (1,164,517)
34,690,702$ 46,842,275$ 61,191,667$

- 150 -
THIS PAGE LEFT INTENTIONALLY BLANK

- 151 -
CITY OF MONTEBELLO
Governmental Activities Tax Revenues By Source
Last Ten Fiscal Years (accrual basis of accounting)
TransientFiscal Property Sales and Occupancy Franchise Other TotalYear Tax Use Tax Tax Tax Taxes Taxes
2000-01 14,319,369$ 9,803,116$ 248,186$ 854,461$ 260,890$ 25,486,022$
2001-02 16,296,780 9,246,622 224,688 976,677 300,912 27,045,679
2002-03 19,841,598 9,767,243 192,610 1,047,750 436,499 31,285,700
2003-04 19,623,358 9,968,228 263,947 1,091,014 361,019 31,307,566
2004-05 19,704,963 11,098,434 261,501 942,645 508,344 32,515,887
2005-06 21,759,482 12,072,217 299,819 1,059,921 977,578 36,169,017
2006-07 22,910,459 12,646,724 263,457 1,228,866 957,192 38,006,698
2007-08 25,510,627 11,686,503 288,514 1,220,316 1,212,604 39,918,564
2008-09 26,895,881 10,391,851 234,980 1,088,537 939,751 39,551,000
2009-10 26,991,825 8,417,053 243,276 1,254,753 961,373 37,868,280
Source: City Financial Statements

- 152 -
CITY OF MONTEBELLO
Assessed Value and Estimated Actual Value of Taxable Property
Last Ten Fiscal Years (rate per $1,000 of assessed value)
CityTaxable
Fiscal Less: Assessed Year Secured Unsecured Exemptions (1) Value
2000-01 1,706,196$ 140,032$ 26,844$ 1,819,384$
2001-02 1,787,430 148,709 20,907 1,915,232
2002-03 1,875,713 107,852 - 1,983,565
2003-04 2,084,644 46,023 - 2,130,667
2004-05 2,217,252 46,025 - 2,263,277
2005-06 2,414,667 47,403 - 2,462,070
2006-07 2,727,566 50,953 93,652 2,684,867
2007-08 2,944,225 93,142 85,955 2,951,412
2008-09 3,126,247 93,224 90,524 3,128,947
2009-10 3,075,831 94,754 97,719 3,072,866
Source: Los Angeles County Assessor and Auditor Combined

- 153 -
Redevelopment AgencyTaxable
Less: AssessedSecured Unsecured Exemptions (1) Value
962,758$ 102,977$ 11,623$ 1,054,112$
910,220 128,751 15,019 1,023,952
1,090,029 129,797 - 1,219,826
1,053,199 138,932 - 1,192,131
1,055,781 113,718 - 1,169,499
1,123,622 123,529 - 1,247,151
1,264,726 128,026 29,089 1,363,663
1,364,738 120,853 29,709 1,455,882
1,490,281 128,875 32,670 1,586,486
1,531,767 131,990 34,413 1,629,344

- 154 -
CITY OF MONTEBELLO
Direct and Overlapping Property Tax Rates
Last Ten Fiscal Years (rate per $100 of taxable value)
Fiscal Year 2000-01 2001-02 2002-03 2003-04 2004-05
City Direct Rate:
City basic rate 1.000000 1.000000 1.000000 1.000000 1.000000 Retirement 0.197875 0.197875 0.197875 0.197875 0.197875
Total City Direct Rate 1.197875 1.197875 1.197875 1.197875 1.197875
Overlapping Rates: L.A. County General 0.001314 0.001128 0.000992 0.000992 0.000923 Montebello USD 0.034233 0.043694 0.040764 0.040764 0.041717 L.A. County Flood Control 0.001552 0.001073 0.000462 0.000462 0.000245 Metropolitan Water District 0.008800 0.007700 0.006100 0.006100 0.005800
Community College n/a 0.015996 0.019857 0.019857 0.018098 Totals 1.243774 1.267466 1.266050 1.266050 1.264658
Source: Los Angeles County Assessor and Auditor Combined

- 155 -
Fiscal Year2005-06 2006-07 2007-08 2008-09 2009-10
1.000000 1.000000 1.000000 1.000000 1.000000
0.197875 0.197875 0.197875 0.197875 0.197875
1.197875 1.197875 1.197875 1.197875 1.197875
0.000795 - - - -
0.070539 0.066812 0.066812 0.066812 0.096730
0.000049 - - - -
0.005200 0.004500 0.004500 0.004500 0.004300
0.014288 0.008794 0.008794 0.008794 0.050250
1.288746 1.277981 1.277981 1.277981 1.349155

- 156 -
CITY OF MONTEBELLO
Principal Property Tax Payers
Current Fiscal Year and Nine Fiscal Years Ago
2009-10 2000-01Percentage Percentage
of Total City of Total CityTaxable Taxable Taxable Taxable
Assessed Assessed Assessed AssessedTaxpayer Value Rank Value Value Rank Value
Montebello Town CenterInvestor, LLC 171,360,035$ 1 3.63%
Plain Exploration and Production 103,869,782 2 2.20%
Bimbo Bakeries, USA 89,551,439 3 1.90%
Prologis California LLC 45,358,481 4 0.96% 39,974,418$ 2 1.52%
Advanced Group 0793 40,852,020 5 0.87%
Amcor Pet Packaging USA 40,603,427 6 0.86%
Excel Realty Partners, Ltd. 38,077,742 7 0.81% 35,499,203 3 1.35%
Macy California, Inc. 36,378,740 8 0.77%
Kir Montebello LP 35,970,658 9 0.76%
RREEF America Reit II 34,664,358 10 0.73%636,686,682$ 13.49% 75,473,621$ 2.87%
Source: HdL Coren ConeLos Angeles County Assessor and Auditor CombinedCalifornia Municipal Statistic, Inc.

- 157 -
CITY OF MONTEBELLO
Property Tax Levies and Collections
Last Ten Fiscal Years
Collected within the Fiscal Total Tax fiscal year of the levy Collections in Total collections to dateYear Levy Amount % of Levy Subsequent Years Amount % of Levy
2000-01 5,873,099$ 5,796,006$ 98.69% 174,721$ 5,970,727$ 101.66%
2001-02 6,478,670 5,915,031 91.30% 179,108 6,094,139 94.06%
2002-03 7,027,324 6,547,321 93.17% 98,462 6,645,783 94.57%
2003-04 7,339,427 6,893,691 93.93% 40,536 6,934,227 94.48%
2004-05 7,725,000 7,287,361 94.33% 137,839 7,425,200 96.12%
2005-06 7,950,087 8,053,932 101.31% 368,207 8,422,139 105.94%
2006-07 8,360,000 8,945,848 107.01% (1) 8,945,847 107.01%
2007-08 9,265,000 9,041,649 97.59% 504,542 9,546,191 103.03%
2008-09 9,799,000 9,143,220 93.31% 560,692 9,703,912 99.03%
2009-10 10,416,000 8,995,261 86.36% 474,808 9,470,069 90.92%
Note (1) Negative number not included
Source: City Finance Department

- 158 -
CITY OF MONTEBELLO
Ratios of Outstanding Debt by Type
Last Ten Fiscal Years
Governmental ActivitiesFiscal Certificates of Tax Total Primary Total DebtYear Participation Allocation Bonds Revenue Other Government Per Capita
2000-01 30,020,000$ 62,511,642$ - 2,123,015$ 94,654,657$ 1,457.35$
2001-02 28,807,760 67,052,635 15,830,000$ 2,119,139 113,809,534 1,750.92
2002-03 27,907,040 65,985,987 15,830,000 2,538,447 112,261,474 1,737.34
2003-04 26,972,500 64,736,819 15,490,000 2,792,949 109,992,268 1,685.73
2004-05 25,996,500 63,394,889 17,060,000 4,237,434 110,688,823 1,685.48
2005-06 24,977,860 61,956,272 16,785,000 10,327,648 114,046,780 1,740.96
2006-07 23,921,580 60,887,078 16,565,000 9,374,503 110,748,161 1,695.52
2007-08 22,817,660 65,708,636 16,400,000 9,313,087 114,239,383 1,750.77
2008-09 21,671,100 74,057,213 16,170,000 15,534,163 127,432,476 1,940.59
2009-10 20,468,080 71,779,239 15,895,000 15,273,662 123,415,981 N/A
Source: City Financial Statements

- 159 -
CITY OF MONTEBELLO
Ratios of General Bonded Debt Outstanding
Last Ten Fiscal Years (In Thousands, except Per Capita)
Outstanding General Bonded DebtFiscal Certificates of Tax Allocation Percent of Per Year Participation Bonds Revenue Total Assessed Value (1) Capita
2000-01 30,020$ 62,512$ - 92,532$ 3.22% 1,425$
2001-02 28,808 67,053 15,830$ 111,691 3.80% 1,718
2002-03 27,907 65,986 15,830 109,723 3.43% 1,698
2003-04 26,973 64,737 15,490 107,200 3.23% 1,643
2004-05 25,997 63,395 17,060 106,452 3.08% 1,621
2005-06 24,978 61,956 16,785 103,719 2.80% 1,583
2006-07 23,922 60,887 16,565 101,374 2.50% 1,552
2007-08 22,818 65,709 16,400 104,927 2.38% 1,608
2008-09 21,671 74,057 16,170 111,898 2.39% 1,704
2009-10 20,468 71,779 15,895 108,142 2.30% 1,653
(1) Assessed value has been used because the actual value of taxable property is not readily available in the State of California.
Source: City Finance Department
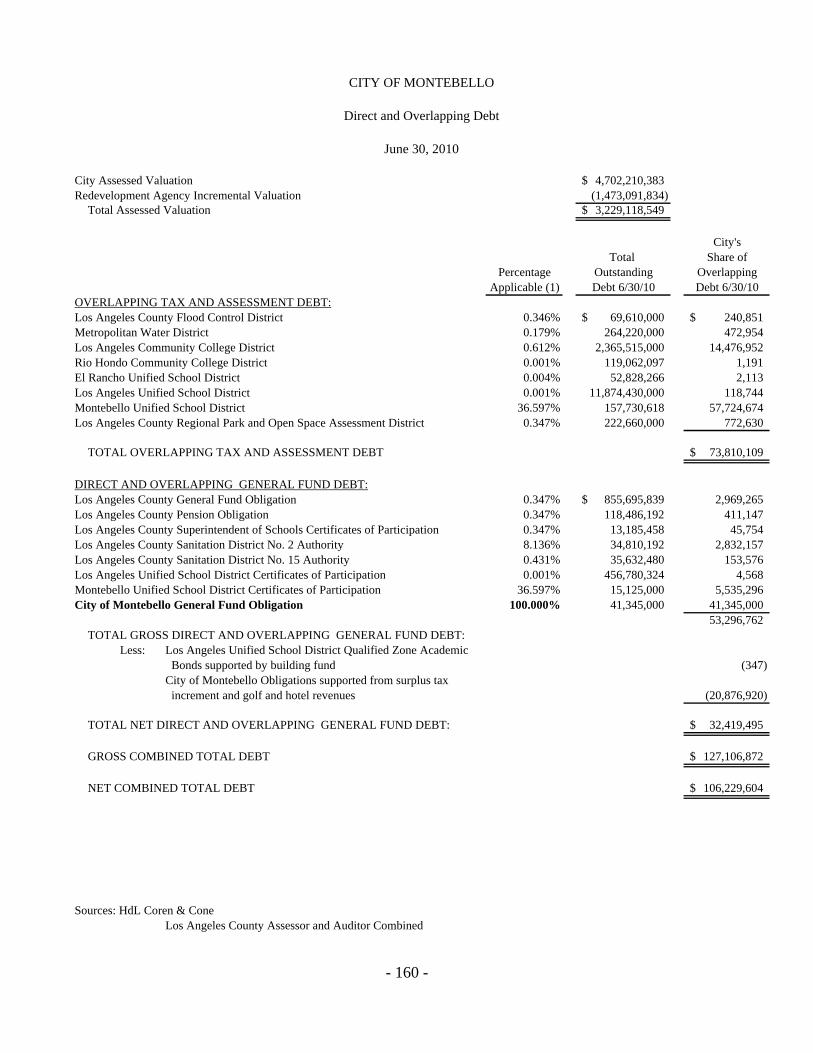
- 160 -
CITY OF MONTEBELLO
Direct and Overlapping Debt
June 30, 2010
City Assessed Valuation 4,702,210,383$ Redevelopment Agency Incremental Valuation (1,473,091,834)
Total Assessed Valuation 3,229,118,549$
City'sTotal Share of
Percentage Outstanding OverlappingApplicable (1) Debt 6/30/10 Debt 6/30/10
OVERLAPPING TAX AND ASSESSMENT DEBT:Los Angeles County Flood Control District 0.346% 69,610,000$ 240,851$ Metropolitan Water District 0.179% 264,220,000 472,954 Los Angeles Community College District 0.612% 2,365,515,000 14,476,952 Rio Hondo Community College District 0.001% 119,062,097 1,191 El Rancho Unified School District 0.004% 52,828,266 2,113 Los Angeles Unified School District 0.001% 11,874,430,000 118,744 Montebello Unified School District 36.597% 157,730,618 57,724,674 Los Angeles County Regional Park and Open Space Assessment District 0.347% 222,660,000 772,630
TOTAL OVERLAPPING TAX AND ASSESSMENT DEBT 73,810,109$
DIRECT AND OVERLAPPING GENERAL FUND DEBT:Los Angeles County General Fund Obligation 0.347% 855,695,839$ 2,969,265 Los Angeles County Pension Obligation 0.347% 118,486,192 411,147 Los Angeles County Superintendent of Schools Certificates of Participation 0.347% 13,185,458 45,754 Los Angeles County Sanitation District No. 2 Authority 8.136% 34,810,192 2,832,157 Los Angeles County Sanitation District No. 15 Authority 0.431% 35,632,480 153,576 Los Angeles Unified School District Certificates of Participation 0.001% 456,780,324 4,568 Montebello Unified School District Certificates of Participation 36.597% 15,125,000 5,535,296 City of Montebello General Fund Obligation 100.000% 41,345,000 41,345,000
53,296,762 TOTAL GROSS DIRECT AND OVERLAPPING GENERAL FUND DEBT:
Less: Los Angeles Unified School District Qualified Zone Academic Bonds supported by building fund (347) City of Montebello Obligations supported from surplus tax increment and golf and hotel revenues (20,876,920)
TOTAL NET DIRECT AND OVERLAPPING GENERAL FUND DEBT: 32,419,495$
GROSS COMBINED TOTAL DEBT 127,106,872$
NET COMBINED TOTAL DEBT 106,229,604$
Sources: HdL Coren & ConeLos Angeles County Assessor and Auditor Combined
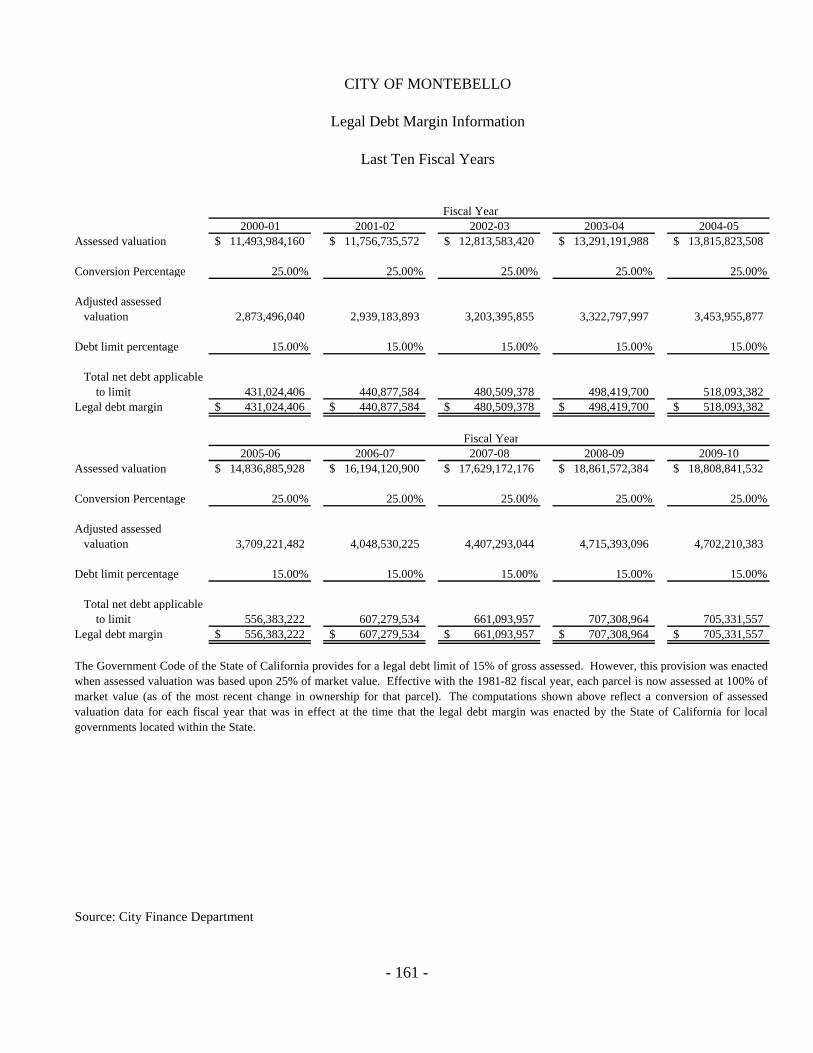
- 161 -
CITY OF MONTEBELLO
Legal Debt Margin Information
Last Ten Fiscal Years
Fiscal Year2000-01 2001-02 2002-03 2003-04 2004-05
Assessed valuation 11,493,984,160$ 11,756,735,572$ 12,813,583,420$ 13,291,191,988$ 13,815,823,508$
Conversion Percentage 25.00% 25.00% 25.00% 25.00% 25.00%
Adjusted assessed valuation 2,873,496,040 2,939,183,893 3,203,395,855 3,322,797,997 3,453,955,877
Debt limit percentage 15.00% 15.00% 15.00% 15.00% 15.00%
Total net debt applicable to limit 431,024,406 440,877,584 480,509,378 498,419,700 518,093,382 Legal debt margin 431,024,406$ 440,877,584$ 480,509,378$ 498,419,700$ 518,093,382$
Fiscal Year2005-06 2006-07 2007-08 2008-09 2009-10
Assessed valuation 14,836,885,928$ 16,194,120,900$ 17,629,172,176$ 18,861,572,384$ 18,808,841,532$
Conversion Percentage 25.00% 25.00% 25.00% 25.00% 25.00%
Adjusted assessed valuation 3,709,221,482 4,048,530,225 4,407,293,044 4,715,393,096 4,702,210,383
Debt limit percentage 15.00% 15.00% 15.00% 15.00% 15.00%
Total net debt applicable to limit 556,383,222 607,279,534 661,093,957 707,308,964 705,331,557 Legal debt margin 556,383,222$ 607,279,534$ 661,093,957$ 707,308,964$ 705,331,557$
Source: City Finance Department
The Government Code of the State of California provides for a legal debt limit of 15% of gross assessed. However, this provision was enactedwhen assessed valuation was based upon 25% of market value. Effective with the 1981-82 fiscal year, each parcel is now assessed at 100% ofmarket value (as of the most recent change in ownership for that parcel). The computations shown above reflect a conversion of assessedvaluation data for each fiscal year that was in effect at the time that the legal debt margin was enacted by the State of California for localgovernments located within the State.

- 162 -
CITY OF MONTEBELLO
Pledged-Revenue Bond Coverage
Last Ten Fiscal Years (In thousands)
Golf Revenue BondsFiscal Gross Less Operating Net Available Debt ServiceYear Revenue Expenses Revenue Principal Interest Total Coverage
2000-01 3,313,423$ (2,260,102)$ 1,053,321$ 100,000$ 399,675$ 499,675$ 210.80%
2001-02 3,241,173 (2,531,366) 709,807 107,760 312,346 420,106 168.96%
2002-03 3,223,541 (2,239,324) 984,217 129,280 321,293 450,573 218.44%
2003-04 3,302,588 (2,377,660) 924,928 130,460 257,203 387,663 238.59%
2004-05 3,150,664 (2,274,201) 876,463 139,000 276,272 415,272 211.06%
2005-06 3,399,967 (2,410,559) 989,408 146,360 293,190 439,550 225.10%
2006-07 3,457,820 (2,676,606) 781,214 148,720 306,999 455,719 171.42%
2007-08 3,216,356 (2,419,360) 796,996 156,080 286,019 442,099 180.28%
2008-09 2,823,898 (3,163,896) (339,998) 163,440 240,310 403,750 -84.21%
2009-10 2,538,595 (2,842,743) (304,148) 171,980 218,711 390,691 -77.85%
Source: City Finance Department

- 163 -
CITY OF MONTEBELLO
Demographic and Economic Statistics
Last Ten Calendar Years
Fiscal Personal Income Capita Personal UnemploymentYear Population (in millions) Income Rate
2000-01 64,950 403,519$ 32,152$ 5.70%
2001-02 65,000 412,753 32,522 6.80%
2002-03 64,617 427,041 33,318 7.00%
2003-04 65,249 453,902 33,034 6.50%
2004-05 65,672 N/A 35,022 5.30%
2005-06 65,508 505,197 37,362 5.40%
2006-07 65,318 N/A N/A 4.90%
2007-08 65,251 N/A N/A 7.10%
2008-09 65,424 N/A N/A 12.90%
2009-10 N/A N/A N/A 12.60%
Source: Bureau of Economic AnalysisState of California Employment Development Department(data shown if for the county)
Personal income, per capita personal income, and unemployment rate are the data shown for Los Angeles County from the Stateof California Employment Department.

- 164 -
CITY OF MONTEBELLO
Principal Employers
Current Fiscal Year and Nine Fiscal Years Ago
2009-10 2000-01Percent of Total Percent of Total
Employer Employees Employment * Employees Employment *Bimbo Company 730 0.0171% N/A N/A
Minson Corporation 629 0.0147% 702 N/A
Royal Paper Box Company 163 0.0038% 185 N/A
Mtb School District 3,500 0.0819% 1,430 N/A
City of Montebello 590 0.0138% 528 N/A
Montebello Town Center 1,897 0.0444% 1,980 N/A
Kaiser 3,120 0.0730% N/A N/A
Beverly Hospital 900 0.0211% 950 N/A
Monarch Litho 250 0.0059% N/A N/A
Price/Costco 281 0.0066% 200 N/ATotal Top Ten 12,060 0.2823% 5,975 N/A
Total Employment * 4,271,900
* "Total Employment" as used above represents the total employment of Los Angeles County.
Source: U.S. Department of Labor-Bureau of Labor StatisticsCity of Montebello

- 165 -
CITY OF MONTEBELLO
Full-Time and Part-time City Employees by Function
Last Eight Fiscal Years
Fiscal YearFunction 2002-03 2003-04 2004-05 2005-06 2006-07
General Government 33 37 41 38 28
Public Safety 220 229 199 202 180
Public Works 56 54 37 31 14
Parks and Recreation 83 82 61 60 119
Economic Development 20 20 17 14 17
Transit 213 222 247 250 236 Totals 625 644 602 595 594
Fiscal YearFunction 2007-08 2008-09 2009-10
General Government 33 53 42
Public Safety 201 197 182
Public Works 15 15 12
Parks and Recreation 138 115 123
Economic Development 7 6 7
Transit 254 215 217 Totals 648 601 583
Source: City Finance Department
The City of Montebello has elected to show only eight years of data for this schedule. Information prior to the 2002-03 fiscalyear is not available.
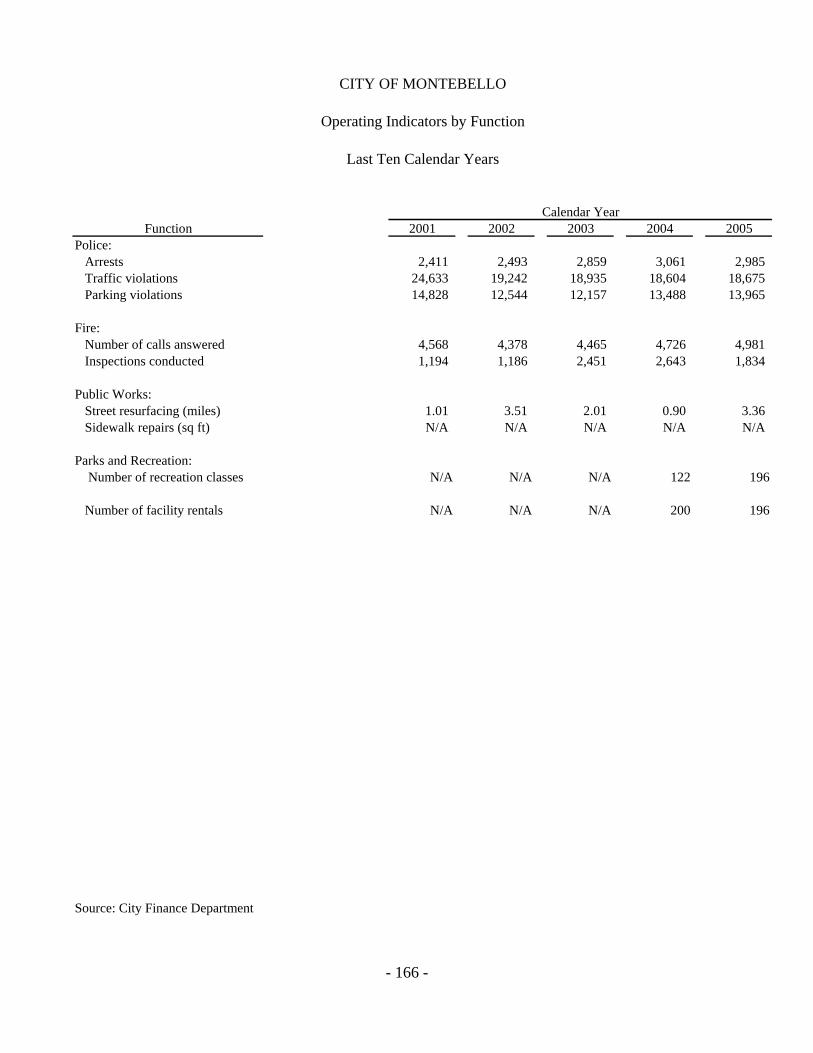
- 166 -
CITY OF MONTEBELLO
Operating Indicators by Function
Last Ten Calendar Years
Calendar YearFunction 2001 2002 2003 2004 2005
Police: Arrests 2,411 2,493 2,859 3,061 2,985 Traffic violations 24,633 19,242 18,935 18,604 18,675 Parking violations 14,828 12,544 12,157 13,488 13,965
Fire: Number of calls answered 4,568 4,378 4,465 4,726 4,981 Inspections conducted 1,194 1,186 2,451 2,643 1,834
Public Works: Street resurfacing (miles) 1.01 3.51 2.01 0.90 3.36 Sidewalk repairs (sq ft) N/A N/A N/A N/A N/A
Parks and Recreation: Number of recreation classes N/A N/A N/A 122 196
Number of facility rentals N/A N/A N/A 200 196
Source: City Finance Department
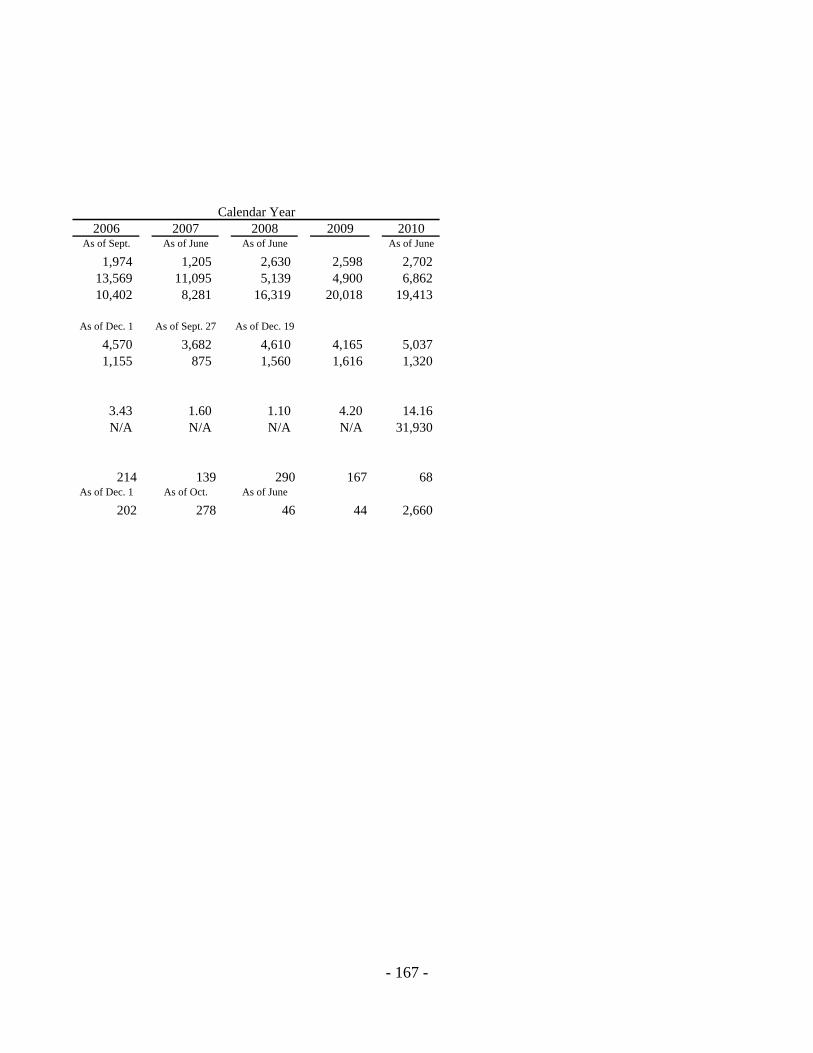
- 167 -
Calendar Year2006 2007 2008 2009 2010
As of Sept. As of June As of June As of June
1,974 1,205 2,630 2,598 2,702 13,569 11,095 5,139 4,900 6,862 10,402 8,281 16,319 20,018 19,413
As of Dec. 1 As of Sept. 27 As of Dec. 19
4,570 3,682 4,610 4,165 5,037 1,155 875 1,560 1,616 1,320
3.43 1.60 1.10 4.20 14.16 N/A N/A N/A N/A 31,930
214 139 290 167 68 As of Dec. 1 As of Oct. As of June
202 278 46 44 2,660
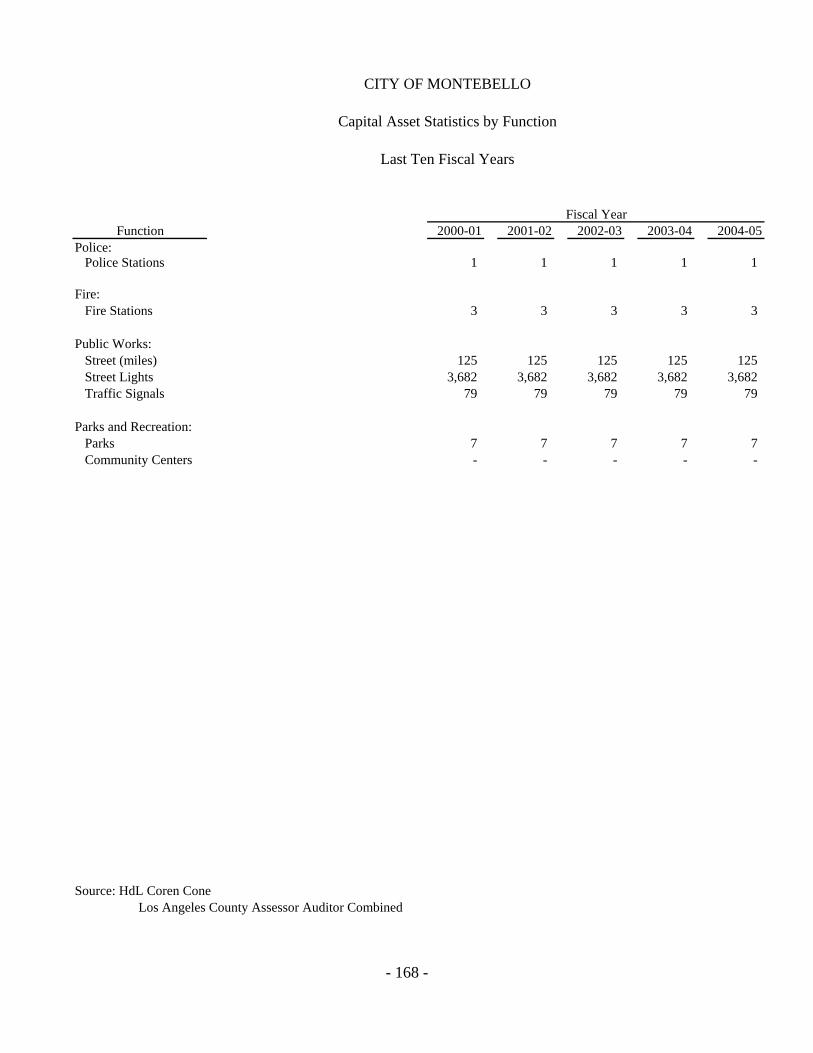
- 168 -
CITY OF MONTEBELLO
Capital Asset Statistics by Function
Last Ten Fiscal Years
Fiscal YearFunction 2000-01 2001-02 2002-03 2003-04 2004-05
Police: Police Stations 1 1 1 1 1
Fire: Fire Stations 3 3 3 3 3
Public Works: Street (miles) 125 125 125 125 125 Street Lights 3,682 3,682 3,682 3,682 3,682 Traffic Signals 79 79 79 79 79
Parks and Recreation: Parks 7 7 7 7 7 Community Centers - - - - -
Source: HdL Coren Cone Los Angeles County Assessor Auditor Combined

- 169 -
Fiscal Year2005-06 2006-07 2007-08 2008-09 2009-10
1 1 1 1 1
3 3 3 3 3
125 125 125 125 125 3,682 3,682 3,682 3,682 3,682
79 80 80 80 81
7 7 7 7 7 - - - - -