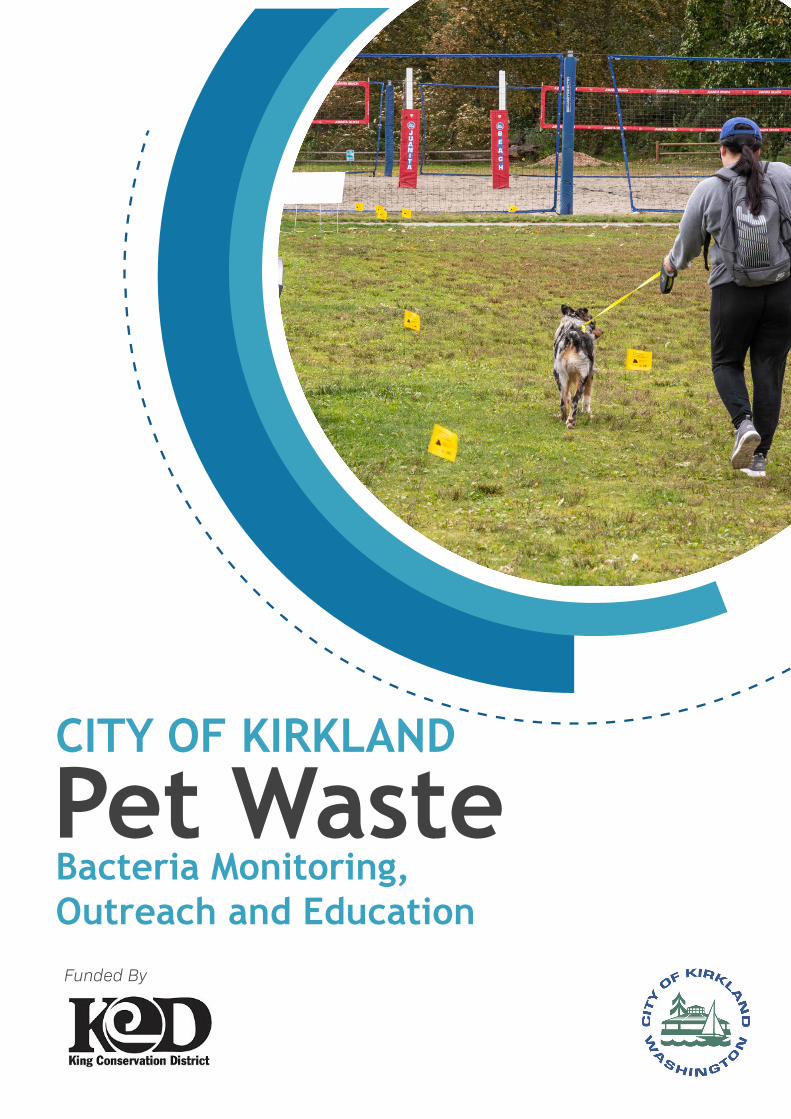
CITY OF KIRKLAND Pet Waste
20
Pet Waste Bacteria Monitoring, Outreach and Education CITY OF KIRKLAND
Transcript of CITY OF KIRKLAND Pet Waste
Funded By
Pet WasteBacteria Monitoring,Outreach and Education
CITY OF KIRKLAND

Acknowledgements
The City of Kirkland Storm & Surface Water Division wishes to thank the King Conservation District, the Kirkland Parks Department, the Kirkland Communications Program team, Kirkland Animal Services, and the King County Environmental Lab for their support of this campaign.
Report Prepared by City of Kirkland Public Works Storm & Surface Water Division February 2020
1
ContentsBackground 03
Methods 05
Results 07
Discussion 12
References 13
Appendices 14

2
ABSTRACTUncollected dog waste on sidewalks, parks, and public places is unsightly, poses a health threat to people, pets, and wildlife, and pollutes local waters. With jurisdictional funding from the King Conservation District, the City of Kirkland ran an 11-week campaign from September through November 2019 to:
• evaluate the impacts of pet waste bacteria on water quality • conduct a targeted education and outreach campaign to change scooping behavior • evaluate whether education and outreach efforts led to measurable changes in bacteria levels in a local creek.
Using brightly colored survey flags and signage, City staff marked all locations of un-scooped dog waste in two City parks over the course of three weeks. This visible display paired with targeted outreach efforts and regional media coverage led to an 80% reduction in un-scooped dog waste lasting at least two months after outreach efforts had ceased. No relationship was found between education and outreach efforts and fecal indicator bacteria collected from stream samples (fecal coliform and E. coli). However, fecal coliform and E. coli results were both strongly associated with measurable precipitation. In addition, detectable quantities of the canine genetic marker were only observed on sample days with measurable precipitation. These results support the notion that rain washes bacteria from dog waste into local waters and helps provide a data-driven basis for lasting and effective changes in scooping behavior.

3
Kirkland’s Juanita Creek watershed drains a 3,623-acre area1 and contains approximately 15,209 households. There are 2,663 licensed dogs within the Juanita Creek watershed, but the actual number of dogs may be closer to 9,300 based on per-household dog ownership estimates2. Research suggests that between 17% and 40% of dog owners do not pick up after their dogs on every walk3,4,5. In the Juanita Creek watershed, this results in an estimated 1,186 to 2,790 pounds of uncollected dog waste daily in the Juanita Creek watershed.
Dog waste contains harmful organisms like E.coli, Giardia, and worms, that can be transmitted to people and pets if not cleaned up6,7. The average dog waste deposit contains 50 million Colony Forming Units (CFUs) of bacteria per gram8 which may survive in dog waste for weeks9.
Dog waste also contains elevated levels of nitrogen and phosphorus10. These nutrients act like fertilizer in our waterways and feed the growth of aquatic plants, including algae. As these plants decay, they use up oxygen in the water that fish and other aquatic life need to survive11.
BackgroundThe Problem with Dog Waste
The CampaignTo address these concerns with un-scooped dog waste, the City of Kirkland applied for and was awarded funding through the King Conservation District Member Jurisdiction Grant program. The focus of this project was to conduct a public outreach campaign paired with an investigation of the impacts of dog waste on water quality.
Two parks in the Juanita Creek watershed were chosen as the primary focus of this campaign: Hazen Hills Park and Juanita Beach Park (north and south of Juanita Drive). Hazen Hills Park experiences heavy use by neighborhood dog owners, and a reach of Juanita Creek bisects the park with unrestricted access to the water by dogs and humans. Juanita Beach Park is one of Kirkland’s most heavily used parks. The park experiences seasonal beach closures due to high bacteria levels and the north side of the park is used frequently as an unofficial off-leash dog area.

Environmental water samples from the section of Juanita Creek that runs through Hazen Hills Park were collected and analyzed for fecal coliform, E. coli, and the EPA canine qPCR genetic markers. Samples were collected pre- and post-outreach to determine whether a mea-surable difference in bacteria levels could be observed as a result of education and outreach efforts. EPA canine qPCR genetic marker samples were analyzed to determine the presence or absence of fecal bacteria from dogs in stream samples.
The frequency of uncollected dog waste was counted and mapped on a weekly basis before, during, and after outreach efforts to determine whether education and outreach efforts led to a reduction in uncollected dog waste.
Improved signage, new pet waste stations, and pet waste bags were installed in the study areas to facilitate proper disposal and removal of dog waste by park visitors.
Pet Waste Removal Infrastructure
A targeted education and outreach campaign was conducted over a three-week period. Outreach efforts included marking all documented un-scooped dog waste occurrences with brightly colored flags and accompanying signage, direct mail newsletters, direct mail postcards, community outreach booths, social media engagement, and press/media engagement.
Education and OutreachObjective 4
4
BackgroundThe goals of the campaign were to evaluate the impacts of pet waste bacteria on water quality, conduct a targeted education and outreach campaign to change scooping behavior, and evaluate whether education and outreach efforts led to measurable changes in bacteria levels in a local creek. Few studies have explored the relationship between education efforts and physical environmental conditions, but there is evidence that educational campaigns can be effective means of reducing bacterial inputs to water sources12.
This project was divided into four objectives:
Bacteria Sampling and Microbial Source Tracing (MST)Objective 1
Objective 2Un-scooped Dog Waste Frequency Monitoring
Objective 3
Campaign Goals

5
MethodsWater samples for fecal coliform and E. coli were
collected in Hazen Hills Park from three locations, three times per
week, for three weeks prior to outreach and three weeks after outreach. Sampling locations included an upstream location where the creek enters the park, a midstream location where another inlet from adjacent roof drains enters the stream, and a downstream location where the stream exits the park. Samples were promptly delivered to and analyzed by AmTest in Kirkland, WA. Water samples for the EPA canine qPCR genetic marker were collected from the downstream location once per week for three weeks prior to outreach and three weeks following outreach. Samples were stored on ice and delivered to the King County Environmental Lab within 24 hours of collection for analysis.
Frequency monitoring of un-scooped dog waste was conducted at each park location once per week, on the first day of each week. Monitoring began five weeks prior to education and outreach, continued through the campaign period, and concluded three weeks after the campaign. Total duration of frequency monitoring was 11 weeks. Frequency monitoring is also planned for one-month, three-month, and six-month follow up periods.
Each park was canvassed using a grid search and each instance of un-scooped dog waste was counted and mapped. Dog waste was not picked up or disposed of in order to avoid influencing bacteria results or scooping behavior (for example, visitors are less likely to litter when less litter is present in an area13).
In Hazen Hills Park, the entire park area was monitored. Due to the large size of Juanita Beach Park, a 0.85-acre area on the north side of the park (Juanita North) and a 1.02-acre area along the waterfront (Juanita South) were selected for monitoring. All other areas of Juanita Beach Park were excluded from monitoring (Appendix A).
Bacteria Sampling and Microbial Source Tracing (MST)
Objective 1
Objective 2 Un-scooped Dog Waste Frequency Monitoring
NE 132ND ST
NE 133RD PL
tability, accompany this product.
Hazen Hills Sampling Locations
Upstream
Midstream
Downstream

6
A total of six new pet waste bag dispensers and ten new signs were installed across the study areas. One station and three signs were installed at Hazen Hills Park, two stations and three signs were installed at Juanita
North, and three stations and four signs were installed in the waterfront portion of Juanita South. A total of 52,000 dog waste bags were ordered to ensure long-term stocking of the stations. Dog bag dispensers were co-located with existing trashcans already in service by the Parks Department to minimize impact on staff resources.
The central component of the education and outreach phase consisted of placing bright yellow survey flags at each mapped location of un-scooped dog waste along with signage in each park explaining the presence of the flags. This method of dog waste flagging has been conducted in many jurisdictions across the country including in Aspen (CO)14, Bellingham
(WA)15, and Springfield (MO)16. The primary purpose of this flagging is to raise awareness about the cumulative impact of un-scooped dog waste. Flags were left in place for three weeks to allow for maximum visibility in the community. Frequency monitoring continued throughout the flagging period and new flags were added when necessary.
Education and OutreachObjective 4
Pet Waste Removal InfrastructureObjective 3
Methods
Flagging
Direct Mail and EmailEducational direct mail postcards were sent to all residents who lived within one-quarter mile of each park. A new dog-focused newsletter titled “The Scoop” was sent to all licensed dog owners in Kirkland in partnership with the City’s Animal Services Program (Appendix B). Information about the campaign was also sent through the City’s weekly email newsletter as well as the Kirkland Conserves monthly email newsletter.
Social Media and PressSocial media posts were published through the City of Kirkland Facebook and Twitter accounts throughout the outreach period. Press releases were sent to regional media outlets detailing the flagging efforts and highlighting proper scooping behavior.
Booth OutreachAn education booth with the “poop toss” bean bag game for youth was conducted at City of Kirkland’s City Hall for All event during the outreach phase.
Super Scooper PledgeResearch shows that those who sign a pledge to perform a specific behavior are more likely to perform that behavior compared to those who do not sign a pledge17. All direct mail, social media, booth outreach, and press releases directed audiences to an online Super Scooper pledge where participants pledged to always pick up after their pets. Those who completed the pledge were mailed a free on-leash dog bag dispenser and roll of refill bags.

E. coli Geometric Mean (CFU/100ml) Hazen Hills Upstream
Pre-Outreach
Post-Outreach
42.3
11.2
33.4
10.4
23.0
17.0
Hazen Hills Midstream Hazen Hills Downstream
7
Results
Fecal coliform Geometric Mean (CFU/100ml) Hazen Hills Upstream
Pre-Outreach
Post-Outreach
68.2
17.1
58.3
14.3
64.9
21.3
Detectable quantities of the EPA canine qPCR marker, Dog-1-Bacteroidales, were reported in one of three pre-outreach samples (200 gene copies per mL of water) and one of three post-outreach samples (18 copies/mL). While copies/mL don’t necessarily equal a colony
forming unit of bacteria, the pre-outreach result of 200 copies/mL was noted as a substantial presence by King County Environmental Lab staff. All other samples were below the minimum detectable level. Notably, the only samples that yielded detectable results were on sample days with measurable precipitation. Samples that were below the minimum detectable level were collected on days with no measurable precipitation.
Bacteria Sampling and Microbial Source Tracing (MST)Objective 1
Microbial Source Tracing
200copies/mL
Pre-Outreach SamplingEPA Canine qPCR Genetic Marker
18copies/mL
Post-Outreach SamplingEPA Canine qPCR Genetic Marker
Geometric means were calculated for pre- and post-outreach fecal coliform and E. coli results at upstream, midstream, and downstream sampling locations. Results are reported below in Colony Forming Units (CFU) per 100mL of water. For reference, King County closes the Juanita Beach swim area when geometric means exceed 200 CFU/100mL. While the geometric mean of CFU/mL did decrease between the pre- and post-outreach conditions, this decrease was not statistically significant* and could be due to decreased precipitation during the post-outreach condition. Overall, no statistically significant differences were observed between sampling location or between the pre- and post-outreach condition on either fecal coliform or E. coli indicators. However, both fecal coliform and E. coli were positively significantly correlated with measured precipitation (p<.01).
Bacteria Monitoring
Hazen Hills Midstream Hazen Hills Downstream
*Statistical significance is the probability that the observed result would have occurred due to sampling error alone. A p-value lower than 0.05 indicates statistical significance.

8
Pre-outreach frequency of uncollected dog waste averaged 18 un-scooped poops (UP) per week across the three study areas. A total of 97 UP were observed at Hazen Hills Park, 107 UP at Juanita North, and 66 UP at Juanita South during the five-week pre-outreach monitoring period (Appendix C). UP declined significantly during the outreach phase (4.1
UP per week) and post-outreach monitoring (3.2 UP per week). All three study areas demonstrated statistically significant (p<0.01) decreases in UP following the three-week outreach period. Overall, average un-scooped poop per week decreased by 80% as a result of education and outreach efforts .
Objective 2Un-scooped Dog Waste Frequency Monitoring
Results
Average un-scooped dog poop decreased by 80% as a result of education and outreach efforts.
0
5
10
15
20
25Pre-Outreach Average
Post-Outreach Average
Juanita SouthJuanita NorthHazen Hills
Average Un-Scooped Poop (UP) Per Week
19.4
3.5
21.4
4.2
13.2
3.2
Aver
age
Un-
Scoo
ped
Poop
(UP)
Per
Wee
k
Park Location
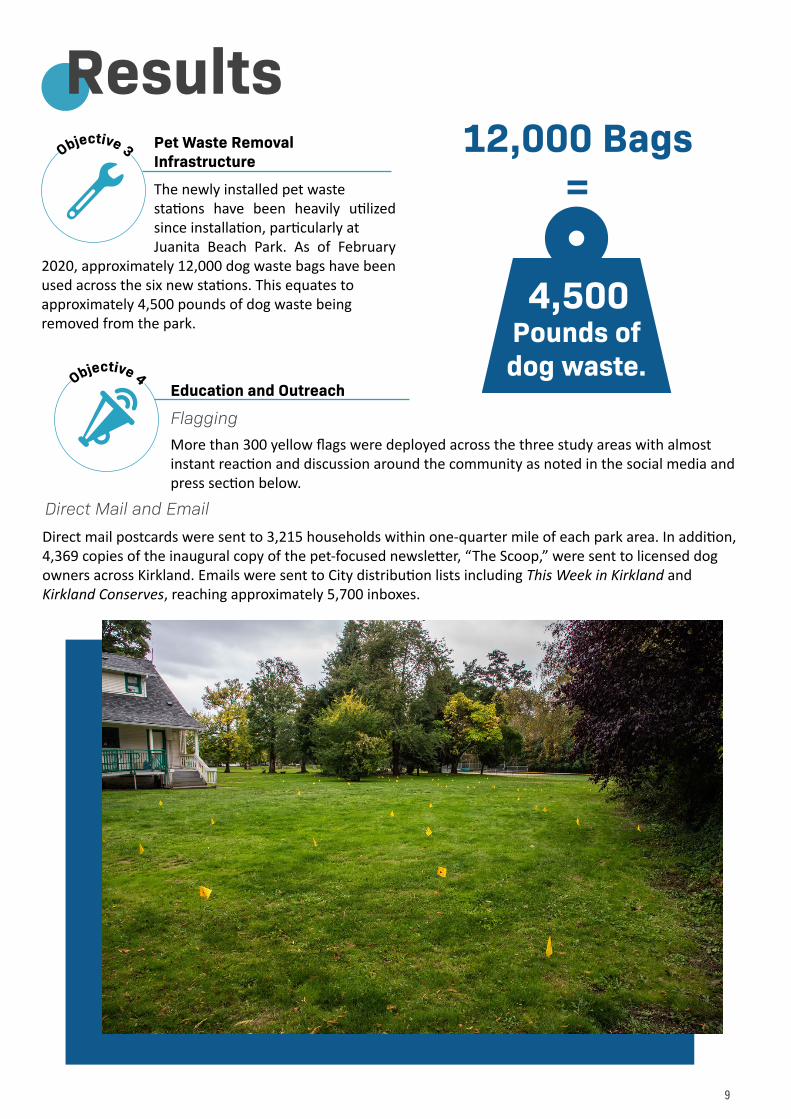
12,000 Bags=
4,500 Pounds of dog waste.
9
Pet Waste Removal InfrastructureObjective 3
ResultsThe newly installed pet waste stations have been heavily utilized since installation, particularly at Juanita Beach Park. As of February
2020, approximately 12,000 dog waste bags have been used across the six new stations. This equates to approximately 4,500 pounds of dog waste being removed from the park.
Education and OutreachObjective 4
More than 300 yellow flags were deployed across the three study areas with almost instant reaction and discussion around the community as noted in the social media and press section below.
Flagging
Direct mail postcards were sent to 3,215 households within one-quarter mile of each park area. In addition, 4,369 copies of the inaugural copy of the pet-focused newsletter, “The Scoop,” were sent to licensed dog owners across Kirkland. Emails were sent to City distribution lists including This Week in Kirkland and Kirkland Conserves, reaching approximately 5,700 inboxes.
Direct Mail and Email

Direct mail pieces and emails delivered.
Circulation reached through news media.
Social media interactions and reach.
13,284 305,000+ 35,000+
10
Social media and press were incredibly effective components of this campaign due to the high visibility of the marking flags. Notably, the outreach efforts were printed on the front page of the Seattle Times, with an estimated circulation of 230,000. In addition, outreach efforts were covered on regional media outlets including King5, KOMO, KIRO, KNKX, New Day Northwest, The Kirkland Reporter , Kirkland Patch, Kirkland Weblog, and High Country News. Social media posts gained significant traction, with City of Kirkland posts reaching more than 22,000 people with 613 likes, 214 comments, 75 shares, and 13,646 video views. In addition, social media posts by news media outlets garnered an additional 664 likes, 488 comments, and 108 shares. Social media may have reached tens of thousands more people through shared posts, but these metrics are not available.
The overall estimated reach between news media and social media outlets for this campaign was more than 340,000 people.
Social Media and Press
Results
Several hundred Kirkland residents attended the annual City Hall for All and Sustainability Fair on October 12, 2019. Approximately 150 people engaged with the dog waste booth and 60 people signed the Super Scooper pledge to receive a free on-leash dog bag dispenser.
Booth Outreach

02 04 06 08 0 100
I don't walk my dog away from home
Always left on the ground
Left on the ground most of the time
Picked up most of the time
Picked up every time 94%
5%
1%
How often do you pick up your dog’s waste while on walks/away from home?
11
ResultsThe online Super Scooper pledge was an overwhelming success due to the widespread reach of social media and news media coverage. 425 people signed the online pledge in a one-month period. A total of 350 on-leash dog bag dispensers and 240 refill rolls were distributed to pledge participants who requested these items. This response used the entirety of the program supplies and resulted in an additional 11,800 dog waste bags being distributed to the Kirkland community. These bags equal an additional 4,425 pounds of dog waste being scooped, bagged, and thrown away.
In a follow up survey with Super Scooper pledge participants, 94% of respondents reported picking up their dog’s waste every time while on walks, and 75% of respondents reported scooping at least a few times per week from dog waste deposited at home or in their yard. In addition, 97% of respondents either somewhat agreed or strongly agreed that bacteria in pet waste can be a health risk and that bacteria in pet waste can pollute our waters.
Super Scooper Pledge
94% of participants pick up their dog’s waste on every walk.

12
DiscussionTargeted education and outreach efforts resulted in an 80% decrease in un-scooped dog waste across three study parks, demonstrating a clear link between campaign efforts and scooping behavior. This substantial reduction in un-scooped dog waste has held constant for at least two months after the conclusion of all outreach efforts.
No statistically significant links between the education and outreach campaign and fecal indicator bacteria were observed during the study period. However, fecal coliform and E. coli were both strongly associated with measurable precipitation. In addition, detectable quantities of the canine genetic marker were only observed on sample days with measurable precipitation. These results support the idea that rain washes bacteria from dog waste into local waters and helps provide a data-driven basis for future education and outreach efforts. More data is be needed to fully explore the relationship between education efforts and fecal indicator bacteria.
Lessons LearnedDue to the overwhelmingly positive response to the online Super Scooper pledge, more resources and staff time were necessary to deliver pledge items than originally anticipated. Original plans called for hand delivering pledge items as pledge responses trickled in online, but this option was not feasible due to the high volume of responses. Instead, pledge items were mailed to participants, resulting in a substantial postage cost.
While the brightly colored flags were highly visible and sparked positive behavior change, not all residents or dog owners were pleased with their presence. Some concerns were raised by residents that dogs and/or small children would hurt themselves on the flags. On two occasions all flags were removed from the park by anonymous residents and had to be replaced by City staff.
A variety of factors make it difficult to make statistically significant links between fecal indicator bacteria and education efforts, including precipitation, upstream events, distance of waste from the water source, etc. Future explorations of this type should include a control location with no education and outreach efforts. In addition, the sampling schedule may benefit from a focus on sampling days with only measurable precipitation, as dry days provide no mechanism for bacteria transport. The managers of future studies may also wish to expand the timescale over which bacteria data is collected. Previous studies that have demonstrated links between fecal indicator bacteria and outreach efforts have relied on data spanning several years rather than several weeks.
These results support the idea that rain washes bacteria from dog waste into local waters.

DiscussionFuture DirectionThe high visibility of the marking flags likely helped dog owners be more attentive to their dog when spending time at the study parks. While positive scooping behavior has held constant for several months, it is reasonable to expect un-scooped dog waste numbers to increase in the spring and summer months. Future iterations of these outreach efforts may solely focus on the monitoring and flagging strategy when new concerns regarding un-scooped waste arise at any of Kirkland’s parks. Monitoring and flagging are a relatively low-effort, low-cost response that delivers a high degree of behavior change. Future plans may also include training volunteers to conduct frequency monitoring and flagging to further reduce City staff time and resources.
References1. City of Kirkland. 2014. Surface Water Master Plan. 2. American Veterinary Medical Association. 2017-18. U.S. Pet Ownership & Demographics Sourcebook. 3. Elway Research. 2019. Stormwater Runoff Awareness, Attitudes & Behavior Survey of Residents. Prepared for the Cities of Bellevue, Bothell, Duvall, Kenmore, Newcastle, & Woodinville. 4. Blenderman, A., Taff, B. D., Schwartz, F., & Lawhon, B. 2018. Dog Guardians’ Perceptions and Behaviors Related to the Disposal of Pet Waste in City of Boulder Open Space and Mountain Parks. Final Report prepared for City of Boulder, Colorado, Open Space and Mountain Parks by Pennsylvania State University and the Leave No Trace Center for Outdoor Ethics. 5. Center for Watershed Protection. Pollution Prevention Fact Sheet: Animal Waste Collection. Accessed February 2020. 6. Cinquepalmi, V., Monno, R., Fumarola, L., Ventrella, G., Calia, C., Greco, M., … Soleo, L. 2012. Environmental Contamination by Dog’s Faeces: A Public Health Problem? International Journal of Environmental Research and Public Health, 10(1), 72–84. doi: 10.3390/ijerph100100727. Centers for Disease Control and Prevention. October 2019. Healthy Pets, Healthy People. 8. Walker, M. & Garfield, L. 2018. Dog Wastes and Water Quality: Evaluating the Connection at Lake Tahoe. Produced for the University of Nevada Cooperative Extension. 9. Anderson, K.L., Whitlock, J.E., & Harwood, V.J. 2005. Persistence and Differential Survival of Fecal Indicator Bacteria in Subtropical Waters and Sediments. Applied and Environmental Microbiology, 71(6), 3041- 3048. doi: 10.1128/AEM.71.6.3041-3048.200510. Hobbie, S. E., Finlay, J. C., Janke, B. D., Nidzgorski, D. A., Millet, D. B., & Baker, L. A. 2017. Contrasting Nitrogen and Phosphorus Budgets in Urban Watersheds and Implications for Managing Urban Water Pollution. Proceedings of the National Academy of SciencWes, 114(16), 4177–4182. doi: 10.1073/pnas.161853611411. Virginia Cooperative Extension. 2009. Control Methods for Aquatic Plants in Ponds and Lakes. Accessed February 2020. 12. Ervin, J. S., Werfhorst, L. C. V. D., Murray, J. L. S., & Holden, P. A. 2014. Microbial Source Tracking in a Coastal California Watershed Reveals Canines as Controllable Sources of Fecal Contamination. Environmental Science & Technology, 48(16), 9043–9052. doi: 10.1021/es502173s13. Reiter, S. M., & Samuel, W. 1980. Littering as a Function of Prior Litter and The Presence or Absence of Prohibitive Signs. Journal of Applied Social Psychology, 10(1), 45–55. doi: 10.1111/j.1559-1816. 1980.tb00692.x14. Washington Post. 2015. Aspen’s Sumggler Mountain is Full of Dog Poop and it Stinks.15. Bellingham Herald. 2019. The Poop Fairies Are Gone - It’s Time to Bring a Bag and Clean Up After Your Own Dog. 16. AP News. 2019. ‘Is This Your Turd?’: Missouri City’s Cleanup Flags Dog Poop. 17. Lokhorst, A. M., Dijk, J. V., Staats, H., Dijk, E. V., & Snoo, G. D. (2009). Using Tailored Information and Public Commitment to Improve the Environmental Quality of Farm Lands: An Example from the Neth erlands. Human Ecology, 38(1), 113–122. doi: 10.1007/s10745-009-9282-x
13

Appendix A - Map of Frequency Monitoring Areas. Yellow areas indicate where monitoring occurred.
Appendices
14

Front
Back
Direct Mail Postcard Sent to Nearby Residents
“The Scoop” Newsletter Sent to Licensed Dog Owners
Signage Installed at Parks
Appendix B - Outreach Materials
Appendices
15

Signage Installed at Parks
Seattle Times Coverage
Appendices
16

AppendicesHazen Hills Un-Scooped Poop
Pre-Outreach
Appendix C - Frequency Monitoring Maps
Hazen Hills Un-Scooped Poop Post-Outreach
17

Juanita North Un-Scooped Poop Post-Outreach
Juanita North Un-Scooped Poop Pre-Outreach
Appendices
18
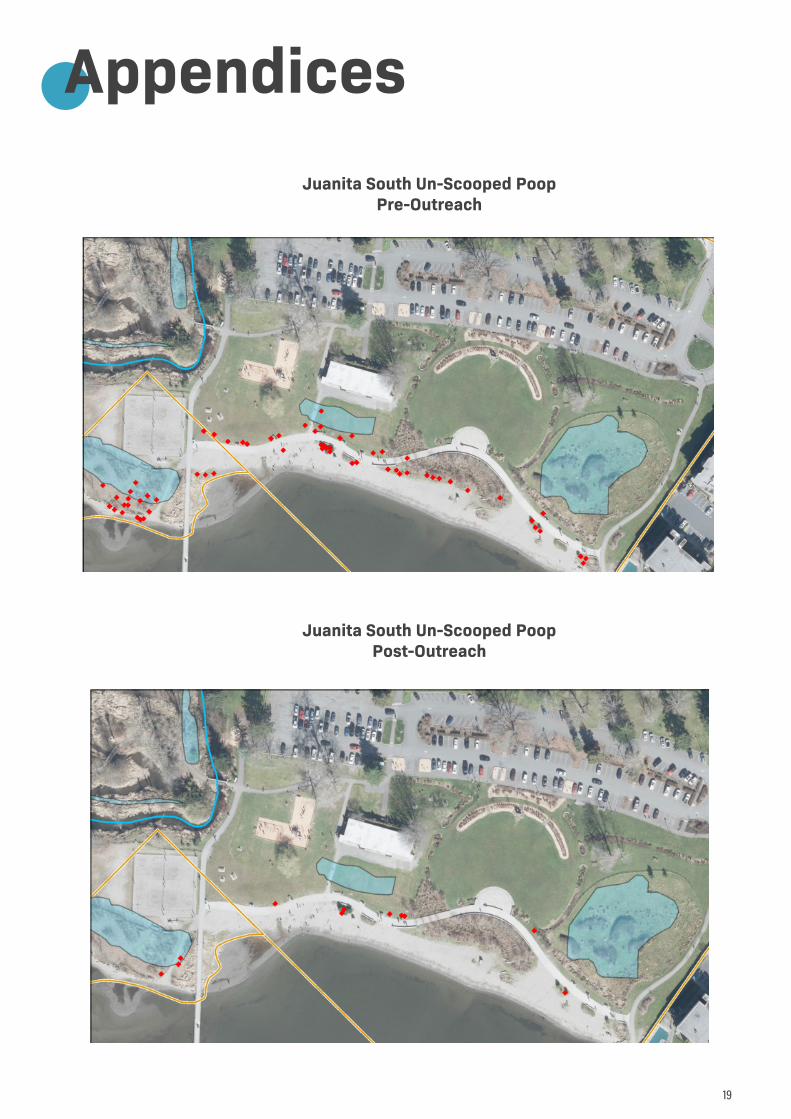
AppendicesJuanita South Un-Scooped Poop
Pre-Outreach
Juanita South Un-Scooped PoopPost-Outreach
19