Intrinsic char reactivity of plastic waste (PET) during...
22
1 Intrinsic char reactivity of plastic waste (PET) during CO 2 gasification M.V. Gil, J. Fermoso, C. Pevida, J.J. Pis, F. Rubiera * Instituto Nacional del Carbón, CSIC, Apartado 73, 33080 Oviedo, Spain Abstract Char reactivity has a strong influence on the gasification process, since char gasification is the slowest step in the process. A sample of waste PET was devolatilised in a vertical quartz reactor and the resulting char was partially gasified under a CO 2 atmosphere at 925 ºC in order to obtain samples with different degrees of conversion. The reactivity of the char in CO 2 was determined by isothermal thermogravimetric analysis at different temperatures in a kinetically controlled regime and its reactive behaviour was evaluated by means of the random pore model (RPM). The texture of the char was characterised by means of N 2 and CO 2 adsorption isotherms. The results did not reveal any variation in char reactivity during conversion, whereas the micropore surface area was affected during the gasification process. It was found that the intrinsic reaction rate of the char can be satisfactorily calculated by normalizing the reaction rate by the narrow micropore surface area calculated from the CO 2 adsorption isotherms. It can be concluded therefore that the surface area available for the gasification process is the area corresponding to the narrow microporosity. Keywords: PET; CO 2 gasification; intrinsic char reactivity; narrow micropores * Corresponding author. Tel.: +34 985 118 975; Fax: +34 985 297 662 E-mail address: [email protected] (F. Rubiera)
Transcript of Intrinsic char reactivity of plastic waste (PET) during...

1
Intrinsic char reactivity of plastic waste (PET) during CO2 gasification
M.V. Gil, J. Fermoso, C. Pevida, J.J. Pis, F. Rubiera*
Instituto Nacional del Carbón, CSIC, Apartado 73, 33080 Oviedo, Spain
Abstract
Char reactivity has a strong influence on the gasification process, since char gasification
is the slowest step in the process. A sample of waste PET was devolatilised in a vertical
quartz reactor and the resulting char was partially gasified under a CO2 atmosphere at
925 ºC in order to obtain samples with different degrees of conversion. The reactivity of
the char in CO2 was determined by isothermal thermogravimetric analysis at different
temperatures in a kinetically controlled regime and its reactive behaviour was evaluated
by means of the random pore model (RPM). The texture of the char was characterised
by means of N2 and CO2 adsorption isotherms. The results did not reveal any variation
in char reactivity during conversion, whereas the micropore surface area was affected
during the gasification process. It was found that the intrinsic reaction rate of the char
can be satisfactorily calculated by normalizing the reaction rate by the narrow
micropore surface area calculated from the CO2 adsorption isotherms. It can be
concluded therefore that the surface area available for the gasification process is the
area corresponding to the narrow microporosity.
Keywords: PET; CO2 gasification; intrinsic char reactivity; narrow micropores
* Corresponding author. Tel.: +34 985 118 975; Fax: +34 985 297 662
E-mail address: [email protected] (F. Rubiera)

2
1. Introduction
The amount of residues generated is projected to grow in the foreseeable future. Some
materials in waste, such as plastics, metals or ceramics, are not biodegradable and their
durability exacerbates the problem of landfill waste sites. It is therefore necessary to
find an alternative means of disposal, such as energy recovery from waste, which is
more environmentally acceptable [1].
The European Union represents 25% of the global plastics production, with
approximately 60 million tonnes per year. Five types of plastic account for around 75%
of all plastics demand in Europe: polyethylene (PE), polypropylene (PP),
polyvinylchloride (PVC), polystyrene (PS) and polyethylene terephthalate (PET). PET
is one of the most frequently used raw materials for the manufacture of soft drink
bottles. European post-sorting PET collection reached 1.26 million tonnes in 2008 [2].
The European Union Directive 2008/98/EC on waste lays down measures to prevent or
reduce the adverse impacts of the generation and management of wastes. It establishes
that by 2015, separate collection shall be set up for plastic and, by 2020, the preparing
for re-use and the recycling of plastic waste shall be increased to a minimum of overall
50 % by weight. The use as a fuel to generate energy is one of the options for waste
recovery if the recovery of energy takes place with a high level of energy efficiency.
Waste accumulation of such bottles in landfills can cause serious ecological problems in
many developed countries [3]. Gasification or pyrolysis provide a means of producing
sustainable energy from the growing amount of plastics in wastes and an alternative
way of getting rid of the plastic wastes at the same time [4]. This would help to solve
the problem of dumping plastic wastes in landfills [5]. Moreover, plastics have a higher
heating value compared to the average heating value of cellulosic material. Plastics have

3
the average LHV of 40 MJ/kg, whereas the LHV for cellulosic wastes such as cardboard
is 16 MJ/kg [4]. The gasification of coal and PET blends in a fluidized bed reactor has
been studied by Pohořelý et al. [6] and a co-gasification study of biomass and plastic
wastes has been carried out by Pinto et al. [7]. Recently, Al-Salem et al. [8] concluded
that thermo-chemical methods (pyrolysis, gasification) and energy recovery (co-
incineration) will soon be developed enough to provide a sustainable solution to the
problem of plastic solid waste disposal in the near future.
Gasification involves combusting a fuel with insufficient oxygen to turn all the energy
contained in the fuel into chemical energy in the gases produced. The process converts
the fuel into a mixture of gases such as carbon monoxide, hydrogen and light
hydrocarbons. The gasification process consists of a devolatilization stage of the fuel,
when volatile matter such as hydrocarbon gases, tars and phenols are evolved, and a
gasification stage of the resultant char, the latter being the controlling stage of the
overall process. In gasification systems, there is usually a recirculation of synthesis gas
that contains significant quantities of carbon monoxide and hydrogen, which will cause
very high temperatures. The volatile matter produced during the devolatilization stage
reacts with the oxidant surrounding atmosphere and the volatiles combustion will be
therefore much more rapid than the heterogeneous char gasification. The slowest
reactions in gasification are these gas-solid reactions with char carbon, such as
Boudouard (C+CO2), water gas (C+H2O) and hydrogenation reactions (C+H2). The
water gas shift reaction (CO+H2O) also can take place and will affect the CO/H2 ratio in
the syngas produced. A good knowledge of char reactivity and its variation during
gasification is essential for designing gasification reactors [9].
4
To this end, thermogravimetric analysis is a useful, simple and fast tool for studying the
thermal behaviour, reactivity and kinetics parameters of carbonaceous materials [9-13].
By means of thermogravimetry, different models can be applied in order to calculate the
parameters of reaction rates. The random pore model (RPM) proposed by Bhatia and
Perlmutter [14] has been widely applied to the experimental data obtained from
gasification of carbonaceous materials [15-18].
What is more, to fully understand the gasification process, it is necessary to study the
pore structure of carbon. Most pore structure models assume that gasification occurs on
the surface of the micropores, which make up most of the surface area of char. In the
absence of diffusional effects, the intrinsic reactivity of chars can be obtained by
dividing the reaction rate by the surface area [19]. However, there is controversy about
which is the most suitable surface area to determine intrinsic reactivity [20].
The methods most frequently used to evaluate char microporosity are based on the
physical adsorption of gases [21], N2 and CO2 being the adsorbates most widely
employed to characterise char texture. N2 adsorption isotherms are usually performed at
-196 ºC and, in these conditions, the results obtained are associated with larger
microporosity [22]. CO2 adsorption is usually conducted at 0 ºC and in these conditions
this adsorbate is able to penetrate the smaller micropores due to its greater diffusivity
compared to N2 [23]. According to Lozano-Castelló et al. [24], CO2 adsorption
isotherms should be used as a complement to N2 adsorption when assessing narrow
microporosity (pore width < 0.7 nm). In contrast, the apparent surface area is usually
determined by applying the Brunauer-Emmett-Teller (BET) method to the N2
adsorption isotherms. However, microporosity can also be analysed from the Dubinin-
Radushkevich (DR) equation and its modifications, such as Dubinin-Asthakov (DA) or

5
Dubinin-Stoeckli (DS) methods, which are based on Dubinin’s theory of the volume
filling of micropores, the density functional theory (DFT) and the Horvath-Kawazoe
method.
The surface area that determines intrinsic reactivity will be the one that produces a
constant reaction rate/surface area ratio with conversion. The assumption of a constant
ratio has been widely employed in modelling works [19].
In the present study, a PET sample was devolatilised in a vertical quartz reactor and the
char obtained was partially CO2-gasified in order to achieve various degrees of
conversion. The reactivity and kinetics of the chars were determined by using a
thermogravimetric analyser. The objective was to study the variation of char reactivity
with conversion and its relation to the properties of the char texture.
2. Material and Methods
2.1. Preparation of char samples
PET from post-consumer soft-drink bottles was cut into small pieces (squares of 1x1 cm
approximately), and batches of this raw material (40 g) were pyrolysed at 725 ºC for 2 h
under a N2 flow rate of 50 Nml min-1 and a heating rate of 15ºC min-1 in a 35 mm
internal diameter vertical quartz reactor, heated by an electric furnace. The final
products included 58% of gaseous compounds (CO, CO2 and hydrocarbons), 20% of
terephthalic acid and 22% of char (denoted as PET0). The CO2 gasification experiments
were carried out at a previously optimised temperature of 925 ºC [25]; previously, PET0
sample was subjected to a treatment at 925 ºC in a nitrogen atmosphere (50 Nml min-1)
for 1 h, giving the initial char sample for CO2 gasification tests, which was denoted as
PC00. Sample PC00 was then partially gasified in the same experimental device under a

6
CO2 flow rate of 10 Nml min-1 at 925 ºC to obtain additional char samples with different
conversion degrees (12, 35, 58 and 76% of burn-off), which were denoted as PC12,
PC35, PC58 and PC76, respectively;. Therefore, the CO2 reactivity tests will be applied
to the PC00, PC12, PC35, PC58 and PC76 samples.
2.2. CO2 reactivity tests
The reactivity tests were conducted in a thermobalance (Setaram TAG24) at
atmospheric pressure. Approximately 5 mg of char sample (0.5-1.0 mm) was placed in a
crucible with a circular base (5 mm diameter and 2 mm height). A thermocouple was
located close to the platinum basket to monitor temperature and to close the oven
control loop. The following experimental procedure was applied to the PC00, PC12,
PC35, PC58 and PC76 samples in the thermobalance. Firstly, the sample was heated up
to 1125 ºC (100 ºC min-1) under N2 flow (50 Nml min-1). Secondly, sample reactivity
was evaluated by means of isothermal thermogravimetric CO2 (50 Nml min-1)
gasification until completion at five temperatures: 925, 975, 1025, 1075 and 1125 ºC.
Then, the char conversion, X, and reaction rate, dX/dt, were calculated.”
The random pore model, RPM, [14] was used in order to evaluate the reactive behaviour
of the chars. The reaction rate, dX/dt, is expressed as:
dX/dt = k (1-X) [1-ψ ln(1-X)]1/2 (1)
where X is the char conversion on a dry ash-free basis, k is the apparent gasification
reaction rate and ψ is a parameter related to the pore structure of the unreacted sample
(X=0). The apparent reaction rate, k, can be expressed using the Arrhenius equation,
which is written as:
k = k0 e-E/RT (2)
7
where k0 and E are the pre-exponential factor and activation energy, respectively. The
parameter ψ can be calculated by the following equation:
ψ = 4π L0(1- ε0)/ S02 (3)
where S0, L0 and ε0 represent the pore surface area, pore length and solid porosity,
respectively. Eq. (1) was linearised in order to calculate the values of k and ψ from the
experimental data obtained in the isothermal thermogravimetric runs, giving:
(2/ψ)[(1-ψ ln(1-X))1/2-1] = kt (4)
The random pore model provides the following conversion-time relationship [26]:
X = 1 – exp[-kt(1 + ktψ/4)] (5)
Equation (5) was used to calculate Xcalc,i introducing the previously estimated k and ψ
values. The X calculation was performed in order to calculate the quality of the fit and
verify the capacity of the kinetic models to describe the char conversion by comparing
the experimental and calculated X values. The deviation (DEV) between the
experimental and calculated curves was calculated using the following expression:
DEV X (%) = 100 [Σi=1,N(Xexp,i - Xcalc,i)2/N]1/2/maxXexp (6)
where Xexp,i and Xcalc,i represent the calculated and experimental data of X, N is the
number of data points, and maxXexp is the highest absolute value of the experimental
curve.
2.3. Textural characterisation
Nitrogen adsorption isotherms at -196 ºC were obtained using a Micromeritics ASAP
2010M instrument, while CO2 adsorption isotherms at 0 ºC were obtained using a
Micromeritics Gemini 2375 device.

8
From the N2 adsorption isotherms, the apparent surface area of the samples was
obtained by using the BET equation [27]. The Dubinin-Asthakov (DA) method [28] was
also applied to both the N2 and CO2 adsorption isotherms in order to obtain the
corresponding micropore volume, which then was used to calculate the micropore
surface area of the chars [25].
3. Results and discussion
The elemental analysis and the surface areas of the char samples are shown in Table 1.
When the BET equation was applied to the N2 adsorption isotherms, an increase in the
apparent surface area (BET surface area) with conversion was found (Table 1).
Furthermore, the physical structure of the solid reactant changed as the reaction
proceeded. This evolution may have affected the kinetics of the reaction by altering the
amount of surface area available for the reaction [29].
In order to follow and analyse the extent of adsorption by the micropores, it is useful to
use CO2 at 0 ºC together with N2 at -196 ºC, since by including the CO2 data it is
possible to extend the range of analysis to the narrow microporosity [30]. The critical
dimensions of both molecules are similar, but the higher temperature of the CO2
experiments avoids the kinetic restrictions that prevent the N2 probe from gaining
access to the narrow micropores. Moreover, because of the much lower relative pressure
range covered by the CO2 adsorption isotherms (up to p/p0 < 0.035), the data correspond
solely to the domain of the narrow microporosity [24].
In this study, the micropore surface area obtained from the CO2 adsorption isotherms
was higher than that obtained from the N2 adsorption data up to 35% of conversion,
whereas it was lower at higher values of conversion (Table 1). This indicates that the
9
porosity present in the initial sample and at a low degree of burn-off (PC00 and PC12)
consisted mostly of narrow micropores. Ballal and Zygourakis [31] stated that the pore
volume obtained from N2 adsorption is lower than that obtained from CO2 adsorption
because most of the smaller pores are not accessible to N2.
Furthermore, the surface area value obtained from the N2 adsorption isotherms, N2
(micro), remarkably increased from 0% to 35% of conversion but remained
approximately constant at conversion values higher than 35%, whereas that obtained
from the CO2 adsorption isotherms reached a maximum at 35% of conversion but
decreased as conversion increased to higher values (Table 1). Therefore, as the degree
of conversion increased (PC35 to PC76), the surface area corresponding to narrow
micropores decreased, whereas that associated with larger micropores did not
appreciably change. When narrow micropores participate in the reaction, they initially
become larger due to the fact that the reaction occurs on the pore surface, and this
results in an increase in the surface area. However, as these pores get even bigger, they
coalesce with neighbouring pores, with the result that the pore surface area decreases
[32]. And at the same time, an increase in the surface area of higher micropore sizes
occurs, leading to an increase in BET surface area (Table 1), again due to pore
coalescence.
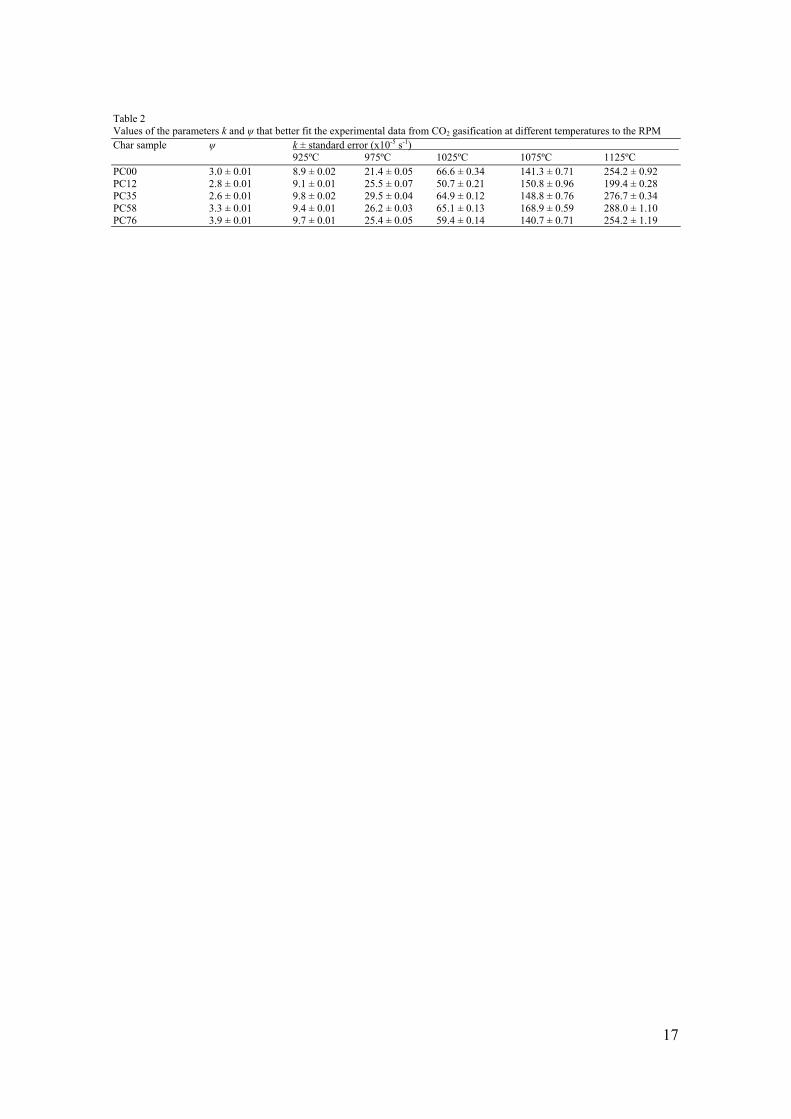
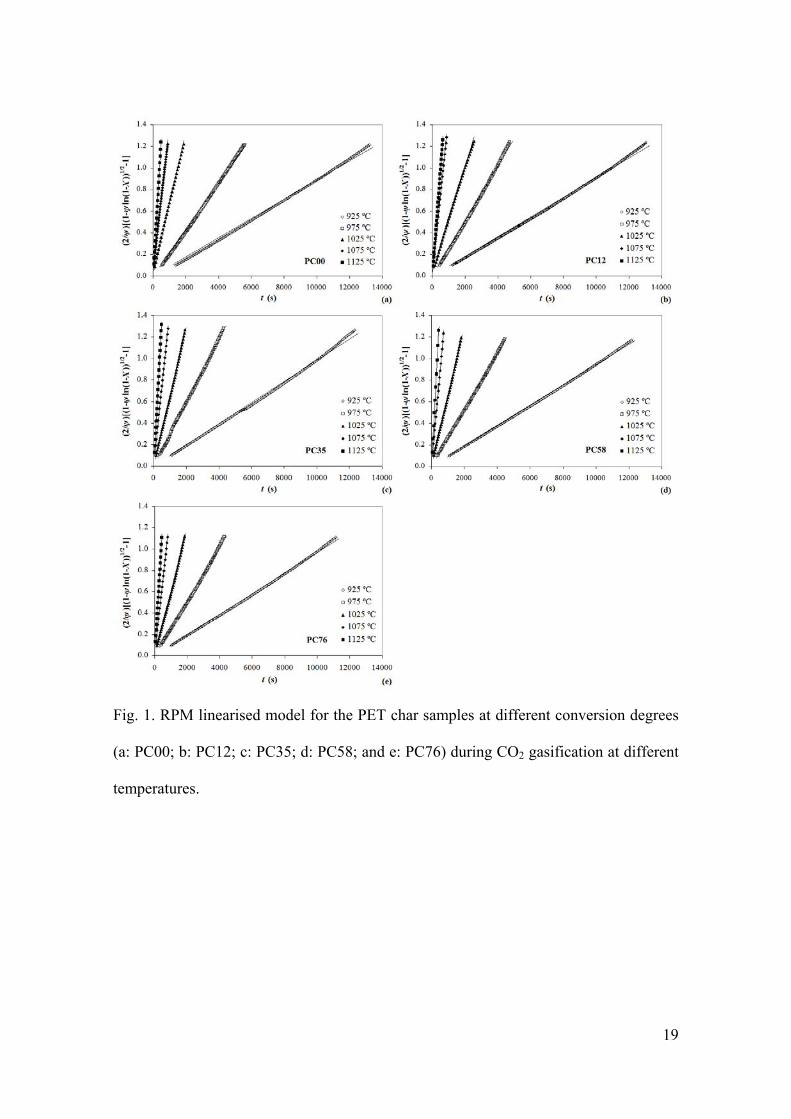
The linearised form of the RPM model, Eq. (4), was used to represent the experimental
data obtained at all the temperatures studied (Fig. 1) in order to find the parameters k
and ψ of best fit. The parameter ψ was calculated assuming that its value is constant for
each char sample at all the temperatures, since it is related to the pore structure. Table 2
shows the values of k and ψ that better fit the experimental data to the Eq. (4). The value
of the ψ parameter obtained for all the char samples hardly changed with the degree of

10
conversion. Although the ψ parameter is related to the textural properties of the solids, a
relationship between the BET surface area (Table 1) and the ψ values cannot be
established. However, the ψ values and the CO2 surface areas (Table 1) seem to present
an inverse linear correlation.
The calculated conversion, Xcalc,i, of the chars during gasification was obtained with Eq.
(5) by using the previously estimated k and ψ values (Table 2). In order to quantify the
errors produced by the kinetic models in predicting the values of conversion, the
experimental and calculated X values were compared by calculating the deviation, DEV
X (%), between the experimental and calculated curves using Eq. (6). Table 3 shows the
results for this deviation for all the char samples and temperatures studied.
The Arrhenius plot (lnk vs. 1/T) was then employed (Fig. 2) to calculate the activation
energy, E, and the pre-exponential factor, k0, for each of the char samples at different
degrees of conversion (Eq. 2). All the regression analysis carried out resulted
statistically significant (confidence interval 95%). The results corresponding to 1125 ºC
are not included in the regression because they were obtained under the diffusion-
controlled regime, as can be observed in the plot. The change from chemical to
diffusion-controlled regime was detected from the change in slope on the Arrhenius
plots.
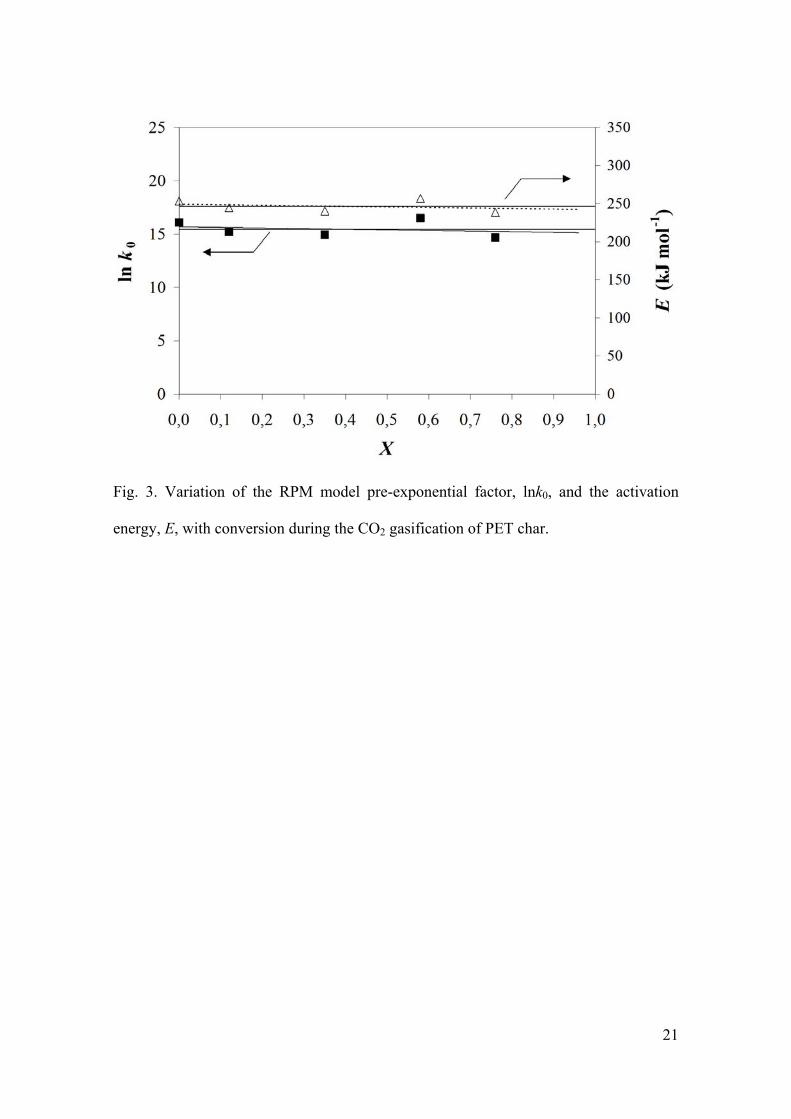
The E and lnk0 values were represented in relation to the conversion degree of each of
the char samples studied (Fig. 3). As can be seen, there is no variation between these
values with burn-off which seems to indicate that the reactivity parameters did not
change with the conversion of the PET char.
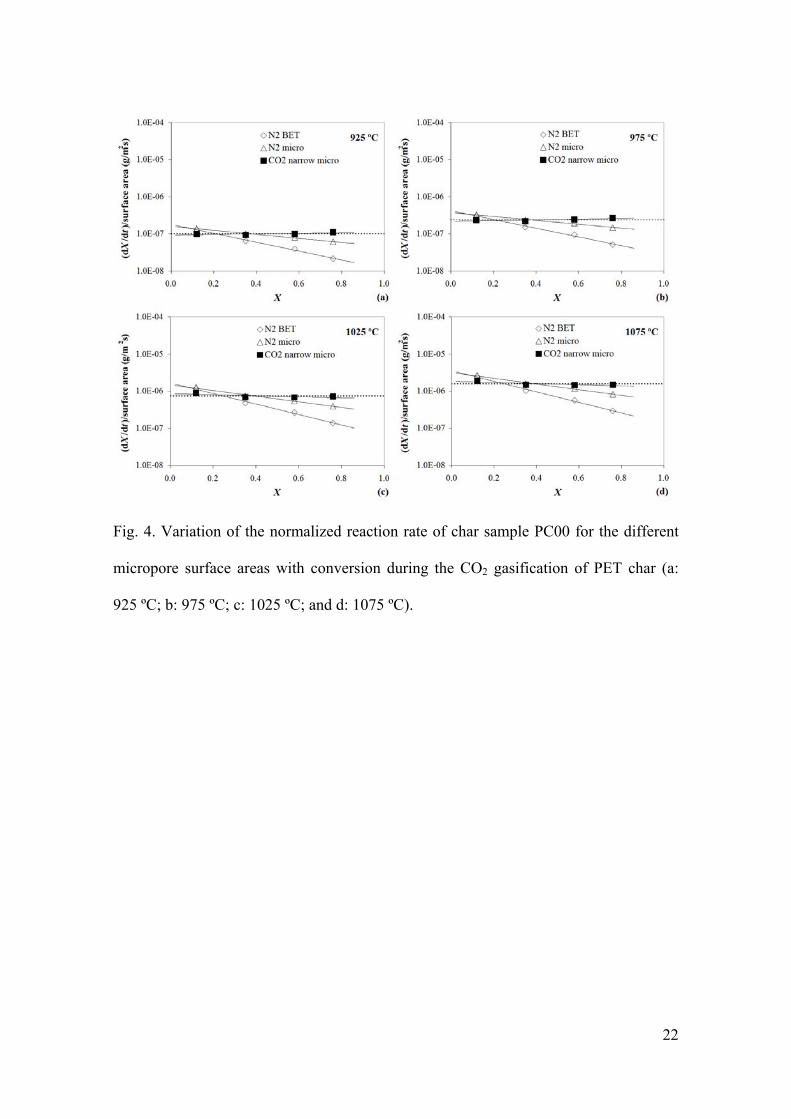
However, the surface areas of the char samples were observed to change with
conversion (Table 1). The reaction rate, dX/dt, of the initial char sample, PC00, was

11
therefore normalized by each of the surface areas in order to be able to calculate the
intrinsic reactivity. Only when the reaction rate was normalized by the narrow
micropore surface areas calculated from the CO2 adsorption isotherms, was its value
constant for all the degrees of conversion (Fig. 4), indicating that the variations in
reaction rate are controlled by the narrow microporosity during the gasification reaction.
Several authors have studied solid gasification kinetics related to development of the
textural characteristics under different conditions. Su and Perlmutter [29] found that the
coal char gasification kinetics is controlled by pore structural changes, although these
authors worked with air instead of CO2. Arias et al. [33] studied the reaction kinetics by
RPM model and found that the available surface area during coal combustion was best
represented by N2 surface area. Salatino et al. [34] compared the gasification of coal by
oxygen and carbon dioxide; they found that the micropores participate to a lesser extent
to carbon gasification by O2 than by CO2. Feng and Bathia [20] found that the coal char
reaction rate normalized by the total surface area for CO2 gasification was constant at
conversions higher than 20%. However, according to some authors, the micropores
have not been completely filled. Hurt et al. [35] studied the gasification of chars from a
sub-bituminous coal and found that the rate of CO2 gasification remained insensitive to
large changes in total surface area during reaction, but these authors attributed this
behaviour to an enhancement of active catalytic sites on the large pore surface areas.
Ballal and Zygourakis [31] studied the evolution of pore surface area during gasification
of coal chars and concluded that a large number of submicropores are probably not
completely filled during the reaction with O2, whereas they are in the case of
gasification with CO2. These authors also pointed out that N2 adsorption properties do
12
not always give a good indication of the amount of microporosity accessible to CO2
gasification.
5. Conclusions
The kinetic parameters that define the reactivity of PET char in CO2 did not change
during conversion, unlike the micropore surface areas. Determination of the intrinsic
reactivity from the narrow micropore surface area gave satisfactory results. Thus,
narrow micropore surface area appears to be a good parameter for describing the
reactivity of PET char, since the ratio between the reaction rate and this type of surface
area remained constant with conversion, indicating that the gasification process was
governed by narrow microporosity.
Acknowledgements
M.V.Gil acknowledges funding from the CSIC JAE Program co-financed by the
European Social Fund. Thanks are due to Dr. J.B. Parra for the samples used in this
work.
References
[1] A.K. Gupta, D.G. Lilley, Energy recovery opportunities from wastes, J. Propul. Power 15 (1999) 175-180.
[2] EuPR. How to increase the mechanical recycling of post-consumer plastics. Strategy paper of the European plastics recyclers association (2010). (http://www.plasticsrecyclers.eu/; last accessed: June 14th 2010).
[3] J.B. Parra, C.O. Ania, A. Arenillas, F. Rubiera, J.M. Palacios, J.J. Pis, Textural development and hydrogen adsorption of carbon materials from PET waste, J. Alloy. Compd. 379 (2004) 280-289.
[4] I.I. Ahmed, A.K. Gupta, Hydrogen production from polystyrene pyrolysis and gasification: Characteristics and kinetics, Int. J. Hydrog. Energy 34 (2009) 6253-6264.

13
[5] A.K. Gupta, D.G. Lilley, Incineration of plastics and other wastes for efficient power generation: a review, 41st Aerospace Sciences Meeting and Exhibit, Reno, Nevada, January 6-9, 2003.
[6] M. Pohořelý, M. Vosecký, P. Hejdová, M. Punčochář, S. Skoblja, M. Staf, J. Vošta, B. Koutský, K. Svoboda, Gasification of coal and PET in fluidized bed reactor, Fuel 85 (2006) 2458-2468.
[7] F. Pinto, C. Franco, R.N. André, M. Miranda, I. Gulyurtlu, I. Cabrita, Co-gasification study of biomass mixed with plastic wastes, Fuel 81 (2002) 291-297.
[8] S.M. Al-Salem, P. Lettieri, J. Baeyens, The valorization of plastic solid waste (PWS) by primary to quaternary routes: From re-use to energy and chemicals, Prog. Energy Combust. Sci. 36 (2010) 103-129.
[9] J. Fermoso, B. Arias, C. Pevida, M.G. Plaza, F. Rubiera, J.J. Pis, Kinetic models comparison for steam gasification of different nature fuel chars, J. Therm. Anal. Calorim. 91 (2008) 779-786.
[10] A. Arenillas, F. Rubiera, J.J. Pis, J.M. Jones, A. Williams, The effect of the textural properties of bituminous coal chars on NO emissions, Fuel 78 (1999) 1779-1785.
[11] A. Arenillas, F. Rubiera, B. Arias, J.J. Pis, J.M. Faúndez, A.L. Gordon, X.A. García, A TG/DTA study on the effect of coal blending on ignition behaviour, J. Therm. Anal. Calorim. 76 (2004) 603-614.
[12] F. Rubiera, A. Arenillas, C. Pevida, R. García, J.J. Pis, K.M. Steel, J.W. Patrick, Coal structure and reactivity changes induced by chemical demineralisation, Fuel Process. Technol. 79 (2002) 273-279.
[13] J.J. Pis, G. de la Puente, E. Fuente, A. Morán, F. Rubiera, A study of the self-heating of fresh and oxidized coals by differential thermal analysis, Thermochim. Acta 279 (1996) 93-101.
[14] S.K. Bhatia, D.D. Perlmutter, A random pore model for fluid-solid reactions: I. Isothermal, kinetic control, AIChE J. 26 (1980) 379-386.
[15] S. Kajitani, S. Hara, H. Matsuda, Gasification rate analysis of coal char with a pressurized drop tube furnace, Fuel 81 (2002) 539-546.
[16] J.H. Zou, Z.J. Zhou, F.C. Wang, W. Zhang, Z.H. Dai, H.F. Liu, Z.H. Yu, Modeling reaction kinetics of petroleum coke gasification with CO2, Chem. Eng. Process. 46 (2007) 630-636.
[17] K. Matsumoto, K. Takeno, T. Ichinose, T. Ogi, M. Nakanishi, Gasification reaction kinetics on biomass char obtained as a by-product of gasification in an entrained-flow gasifier with steam and oxygen at 900-1000 ºC, Fuel 88 (2009) 519-527.
[18] Y. Okumura, T. Hanaoka, K. Sakanishi, Effect of pyrolysis conditions on gasification reactivity of woody biomass-derived char, Proc. Combust. Inst. 32 (2009) 2013-2020.
[19] R. Sahu, Y.A. Levendis, R.C. Flagan, G.R. Gavalas, Physical properties and oxidation rates of chars from three bituminous coals, Fuel 67 (1988) 275-283.
[20] B. Feng, S.K. Bhatia, Variation of the pore structure of coal chars during gasification, Carbon 41 (2003) 507-523.
[21] S.J. Gregg, K.S.W. Sing, Adsorption, surface area and porosity, Academic Press, New York, 1982.
[22] O.P. Mahajan, P.L. Walker Jr., Analytical methods for coal and coal products, Academic Press, New York, 1978.
[23] P.A. Webb, C. Orr, Analytical methods in fine particle technology, Micromeritics Instruments, 1997.

14
[24] D. Lozano-Castelló, D. Cazorla-Amorós, A. Linares-Solano, Usefulness of CO2 adsorption at 273 K for the characterization of porous carbons, Carbon 42 (2004) 1233-1242.
[25] J.B. Parra, C.O. Ania, A. Arenillas, F. Rubiera, J.J. Pis, High value carbon materials from PET recycling, Appl. Surf. Sci. 238 (2004) 304-308.
[26] K.N. Tran, S.K. Bathia, A. Tomsett, Air reactivity of petroleum cokes: role of inaccessible porosity, Ind. Eng. Chem. Res. 46 (2007) 3265-3274.
[27] J.B. Parra, J.C. de Sousa, R.C. Bansal, J.J. Pis, J.A. Pajares, Characterization of activated carbons by BET equation. An alternative approach, Adsorpt. Sci. Technol. 12 (1995) 51-66.
[28] M.M. Dubinin, V.A. Astakhov, Description of adsorption equilibria of vapors on zeolites over wide ranges of temperature and pressure, Advances in Chemistry Series 102 (1971) 69-85.
[29] J.L. Su, D.D. Perlmutter, Effect of pore structure on char oxidation kinetics, AIChE J. 31 (1985) 973-981.
[30] C.O. Ania, J.B. Parra, F. Rubiera, A. Arenillas, J.J. Pis, A comparison of characterization methods based on N2 and CO2 adsorption for the assessment of the pore size distribution of carbons, Studies in Surface Science and Catalysis 160 (2007) 319-326.
[31] G. Ballal, K. Zygourakis, Evolution of pore surface area during noncatalytic gas-solid reactions. 2. Experimental Results and Model Validation, Ind. Eng. Chem. Res. 26 (1987) 1787-1796.
[32] G. Ballal, K. Zygourakis, Evolution of pore surface area during noncatalytic gas-solid reactions. 1. Model Development, Ind. Eng. Chem. Res. 26 (1987) 911-921.
[33] B. Arias, C. Pevida, F. Rubiera, J.J. Pis, Changes in coal char reactivity and texture during combustion in an entrained flow reactor, J. Therm. Anal. Calorim. 90 (2007) 859-863.
[34] P. Salatino, O. Senneca, S. Masi, Gasification of a coal char by oxygen and carbon dioxide, Carbon 36 (1998) 443-452.
[35] R.H. Hurt, A.F. Sarofim, J.P. Longwell, The role of microporous surface area in the gasification of chars from a sub-bituminous coal, Fuel 70 (1991) 1079-1082.
15
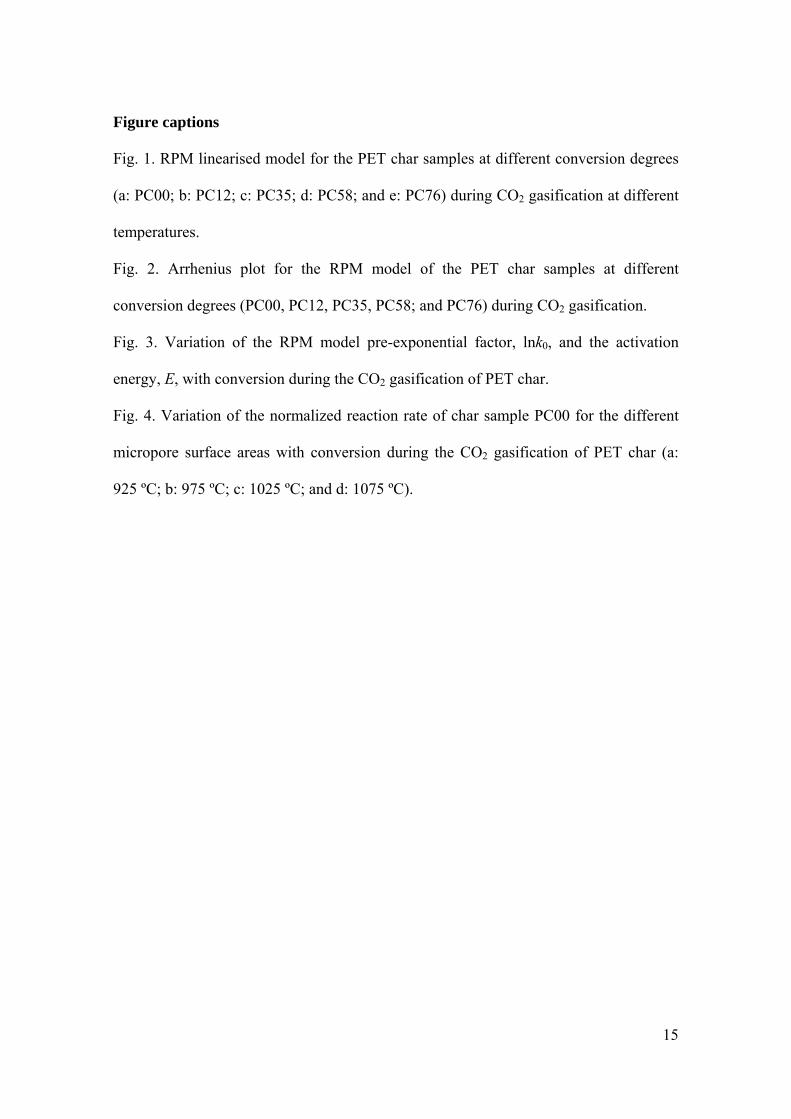
Figure captions
Fig. 1. RPM linearised model for the PET char samples at different conversion degrees
(a: PC00; b: PC12; c: PC35; d: PC58; and e: PC76) during CO2 gasification at different
temperatures.
Fig. 2. Arrhenius plot for the RPM model of the PET char samples at different
conversion degrees (PC00, PC12, PC35, PC58; and PC76) during CO2 gasification.
Fig. 3. Variation of the RPM model pre-exponential factor, lnk0, and the activation
energy, E, with conversion during the CO2 gasification of PET char.
Fig. 4. Variation of the normalized reaction rate of char sample PC00 for the different
micropore surface areas with conversion during the CO2 gasification of PET char (a:
925 ºC; b: 975 ºC; c: 1025 ºC; and d: 1075 ºC).

16
Table 1 Elemental analysis and surface areas of char samples Char sample Elemental analysis (wt%, dry basis) Surface areas (m2/g) C H O BETa N2 (micro)b CO2 (narrow micro)c PC00 98.2 0.5 0.9 340 490 746 PC12 98.8 0.3 0.6 668 629 882 PC35 98.9 0.3 0.6 1405 909 969 PC58 98.7 0.2 0.6 1920 930 748 PC76 99.0 0.2 05 2468 870 480 a Determined by the BET method applied to the N2 adsorption isotherms at -196 ºC. b Determined by the DA method applied to the N2 adsorption isotherms at -196 ºC. c Determined by the DA method applied to the CO2 adsorption isotherms at 0 ºC.
17
Table 2 Values of the parameters k and ψ that better fit the experimental data from CO2 gasification at different temperatures to the RPM Char sample ψ k ± standard error (x10-5 s-1) 925ºC 975ºC 1025ºC 1075ºC 1125ºC PC00 3.0 ± 0.01 8.9 ± 0.02 21.4 ± 0.05 66.6 ± 0.34 141.3 ± 0.71 254.2 ± 0.92 PC12 2.8 ± 0.01 9.1 ± 0.01 25.5 ± 0.07 50.7 ± 0.21 150.8 ± 0.96 199.4 ± 0.28 PC35 2.6 ± 0.01 9.8 ± 0.02 29.5 ± 0.04 64.9 ± 0.12 148.8 ± 0.76 276.7 ± 0.34 PC58 3.3 ± 0.01 9.4 ± 0.01 26.2 ± 0.03 65.1 ± 0.13 168.9 ± 0.59 288.0 ± 1.10 PC76 3.9 ± 0.01 9.7 ± 0.01 25.4 ± 0.05 59.4 ± 0.14 140.7 ± 0.71 254.2 ± 1.19

18
Table 3 Deviation (%) between the experimental and calculated conversion (X) data for RPM during CO2 gasification at different temperatures Char DEV X (%) sample 925ºC 975ºC 1025ºC 1075ºC 1125ºC PC00 1.8 1.4 2.0 2.2 0.7 PC12 1.3 1.3 1.7 2.0 0.4 PC35 1.2 0.7 0.6 1.7 0.4 PC58 0.5 0.6 0.8 1.1 0.6 PC76 0.8 0.8 0.9 1.7 1.5
19
Fig. 1. RPM linearised model for the PET char samples at different conversion degrees
(a: PC00; b: PC12; c: PC35; d: PC58; and e: PC76) during CO2 gasification at different
temperatures.

20
-9,5
-9,0
-8,5
-8,0
-7,5
-7,0
-6,5
-6,0
-5,5
7,0E-04 7,5E-04 8,0E-04 8,5E-04
1/T (K-1)
lnk
(s-1
)PC00PC12PC35PC58PC76
PC58
PC76
PC35
PC12PC00
Fig. 2. Arrhenius plot for the RPM model of the PET char samples at different
conversion degrees (PC00, PC12, PC35, PC58 and PC76) during CO2 gasification.
21
Fig. 3. Variation of the RPM model pre-exponential factor, lnk0, and the activation
energy, E, with conversion during the CO2 gasification of PET char.
22
Fig. 4. Variation of the normalized reaction rate of char sample PC00 for the different
micropore surface areas with conversion during the CO2 gasification of PET char (a:
925 ºC; b: 975 ºC; c: 1025 ºC; and d: 1075 ºC).