City of Cle Elumcityofcleelum.com/wp-content/uploads/2018/06/FinalDraft... · 2018. 6. 6. · OFM...
20
City of Cle Elum Housing Element Updated in 2018 by: Draft MAY 8, 2018
Transcript of City of Cle Elumcityofcleelum.com/wp-content/uploads/2018/06/FinalDraft... · 2018. 6. 6. · OFM...

City of Cle Elum
Housing Element
Updated in 2018 by:
Draft
MAY 8, 2018

Cle Elum Comprehensive Plan Housing Element pg. 2
DRAFT
TABLE OF CONTENTS__________________________ INTRODUCTION ....................................................................................................................................................... 3
GROWTH MANAGEMENT ACT REQUIREMENTS .......................................................................................... 3
CENSUS SUMMARY ................................................................................................................................................. 4
HOUSEHOLDS AND POPULATION TRENDS ..................................................................................................... 8
HOUSING STOCK REQUIREMENTS .................................................................................................................... 9
HOUSING COSTS AND AFFORDABILITY ........................................................................................................ 10
FACTORS IN THE COST AND AFFORDABILITY OF HOUSING ................................................................. 12
HOUSING MAINTENANCE AND PRESERVATION ......................................................................................... 12
RENTAL OPPORTUNITIES ................................................................................................................................... 13
DIRECTION FOR HOUSING POLICIES ............................................................................................................. 14
STRATEGY I – INFILL HOUSING WITHIN RESIDENTIAL AREAS ............................................................ 15
STRATEGY II – MIXED-USE DEVELOPMENT ................................................................................................ 15
STRATEGY III – VARIETY OF HOUSING TYPES ............................ ERROR! BOOKMARK NOT DEFINED.
STRATEGY IV – PRESERVATION OF EXISTING HOUSING ........................................................................ 15
STRATEGY V – ZONING INCENTIVES / REDUCTION OF DEVELOPMENT STANDARDS .................. 15
STRATEGY VI – HOUSING FOR ASSISTED LIVING ...................................................................................... 15
HOUSING ELEMENT GOALS AND POLICIES ................................................................................................. 16
List of Tables______________________________ TABLE 1 AGE OF HOUSING STOCK ................................................................................................................................. 8 TABLE 2 HOUSING STOCK REQUIRED FOR CLE ELUM 2037 POPULATION ALLOCATION ................................................ 9 TABLE 3 HOUSEHOLD INCOME GROUPS ....................................................................................................................... 10 TABLE 4 TOTAL COST-BURDENED HOUSEHOLDS BY INCOME LEVEL, 2010-2014 ........................................................ 11
List of Figures_____________________________ FIGURE 1 TOTAL POPULATION, 2000-2017 .................................................................................................................... 4 FIGURE 2 POPULATION BY AGE RANGE, 2016 ................................................................................................................ 5 FIGURE 3 HOUSEHOLD SIZE BY TENURE, 2016 ............................................................................................................... 6 FIGURE 4 OCCUPIED HOUSING UNITS 2000-2017 ........................................................................................................... 6 FIGURE 5 HOUSING TYPES 2017 ..................................................................................................................................... 7 FIGURE 6 HISTORIC AND PROJECTED POPULATION FOR CITY OF CLE ELUM .................................................................. 9 FIGURE 7 HOUSEHOLD INCOME BY HOUSING TENURE, 2010-2015 .............................................................................. 10 FIGURE 9 COST-BURDENED HOUSEHOLDS BY HOUSING TENURE, 2010-2014.............................................................. 11 FIGURE 9 MEDIAN RENT, 2017 ..................................................................................................................................... 14
Cle Elum Comprehensive Plan Housing Element pg. 3
DRAFT
Introduction Cle Elum’s Housing Element is perhaps the most personal and important component of the Comprehensive Plan; it is concerned with the immediate environment where our residents live and raise their families. For many people their investment in housing represents the largest investment they will ever make. The ability to obtain affordable housing is essential to an engaged, healthy and stable community. Most housing is not constructed by municipalities, but by private sector builders and developers. However, government can negatively or positively impact the supply and affordability of housing. This Element of the Cle Elum Comprehensive Plan focuses on factors that can, and should, be either directly controlled or influenced by local government. To that end this Housing Element of the Comprehensive Plan identifies goals and sets policies that will guide future housing development and meet the present and future needs of the community. The goals and policies are written to maintain the small-town lifestyle, rich history, and integrity of Cle Elum while providing support for the development of housing for all income groups. This Element also seeks to develop policies and strategies that encourage the development of recognizable neighborhoods with supporting amenities such as parks, trail connections, and open space. The guiding intention of this Element, through its housing goals, policies, and strategies, is to offer the existing and future residents of Cle Elum a mix of attractive, safe, and well-maintained neighborhoods which contain a variety of housing options that are available to all without discrimination. Neighborhoods must be appealing, well kept, safe and have convenient access to city services, amenities, schools, jobs, and institutions.
Growth Management Act Requirements In addition to helping to create a thriving community, the Housing Element was developed to reflect real current conditions and in accordance with the Washington State Growth Management Act (GMA), RCW 36.70A.070, WAC 365-195-310 (Housing Element Requirements), Kittitas County Countywide Planning Policies and the other elements of the Cle Elum Comprehensive Plan. To fulfill requirements set forth by the Growth Management Act, the Housing Element contains the following information and analysis:
1. An inventory and analysis of existing and projected housing needs. 2. A statement of the goals, policies, and objectives for the preservation, improvement, and
development of housing. 3. Identification of sufficient land for a variety of housing types. 4. Provision for existing and projected housing needs for all economic segments of the
population.
Cle Elum Comprehensive Plan Housing Element pg. 4
DRAFT
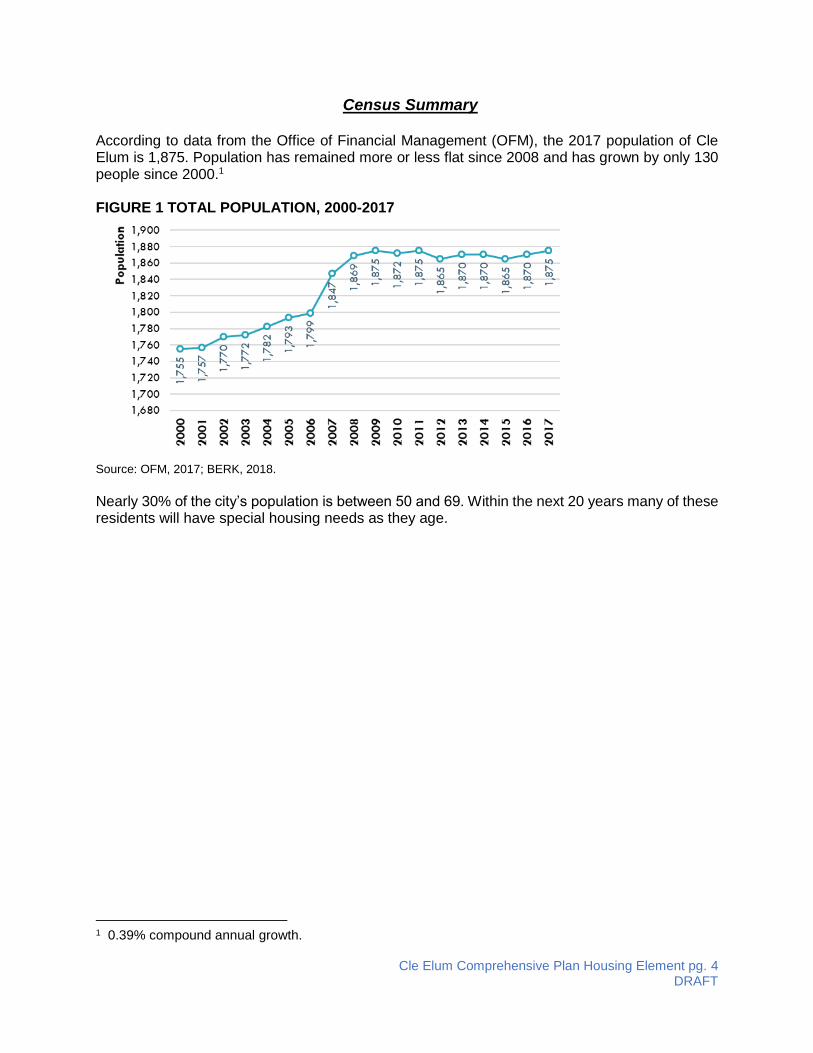
Census Summary According to data from the Office of Financial Management (OFM), the 2017 population of Cle Elum is 1,875. Population has remained more or less flat since 2008 and has grown by only 130 people since 2000.1 FIGURE 1 TOTAL POPULATION, 2000-2017
Source: OFM, 2017; BERK, 2018.
Nearly 30% of the city’s population is between 50 and 69. Within the next 20 years many of these residents will have special housing needs as they age.
1 0.39% compound annual growth.

Cle Elum Comprehensive Plan Housing Element pg. 5
DRAFT
FIGURE 2 POPULATION BY AGE RANGE, 2016
Source: 2012-2016 ACS 5-year Estimates.
In terms of housing tenure, the data show that 59% of households own their homes while 41% are renters. In terms of size, most households have only one or two members though renter households tend to be larger than owner households. The average household size for the city is 2.19.

Cle Elum Comprehensive Plan Housing Element pg. 6
DRAFT
FIGURE 3 HOUSEHOLD SIZE BY TENURE, 2016
Source: 2012-2016 ACS 5-year Estimates.
In 2017, there were 1,104 occupied housing units within City limits, which is a 15% increase from the 956 occupied units documented in 2000. However, the data show that the number of occupied housing units have remained relatively unchanged between 2010 and 2017. This is likely due, in part, to the slow pace of housing production. Data show that only 14 housing units have been permitted between 2010 and 2017.2
FIGURE 4 OCCUPIED HOUSING UNITS 2000-2017
Source: OFM, 2017; BERK 2018.
The majority (73%) of existing housing is in single-family units. This reflects a lack of diversity in the housing options available to local households and a misalignment between the size of housing units and the size of households. While 68% of households have only one or two members, only
2 These permit counts come from OFM. The City has confirmed 10 new permits so far in 2018, with expectations for at least 34 additional permits later in 2018.

Cle Elum Comprehensive Plan Housing Element pg. 7
DRAFT
15% of housing units have one or fewer bedrooms. While only 32% of households have three or more members, 47% of housing units have 3 or more bedrooms.
FIGURE 5 HOUSING TYPES 2017
Source: OFM 2017, BERK 2018.
In terms of housing production, the bulk of the units in the city (~36%) was constructed prior to 1939. Between 2000 and 2009 there were 227 new housing units constructed, which represents the most significant residential construction activity in Cle Elum since the 1980s. The pace of housing production slowed down by 2010, and between 2010 and 2014 only 23 housing units were constructed. Based on this pattern of housing production, close to 46% of the housing stock in the city is more than 60 years old. As the housing stock continues to age, the need will increase for rehabilitation of many structures. Table 1-5 below shows the age of the housing stock in the City of Cle Elum, based on estimates from the Census American Community Survey. 3
3 Note that these estimates are based on survey data from the Census American Community Survey. Therefore, there is a large margin of error and potential for inconsistencies with other data sources such as OFM or City of Cle Elum building permits.

Cle Elum Comprehensive Plan Housing Element pg. 8
DRAFT
TABLE 1 AGE OF HOUSING STOCK
Year Structure Built Number of Units Percent of Housing
Built 2010 or later 23 1.92%
Built 2000 to 2009 227 19.00%
Built 1990 to 1999 72 6.03%
Built 1980 to 1989 78 6.53%
Built 1970 to 1979 107 8.95%
Built 1960 to 1969 83 6.95%
Built 1950 to 1959 53 4.44%
Built 1940 to 1949 123 10.29%
Built 1939 or earlier 429 35.90%
Source: 2012-2016 American Community Survey 5-Year Estimates; BERK 2018.
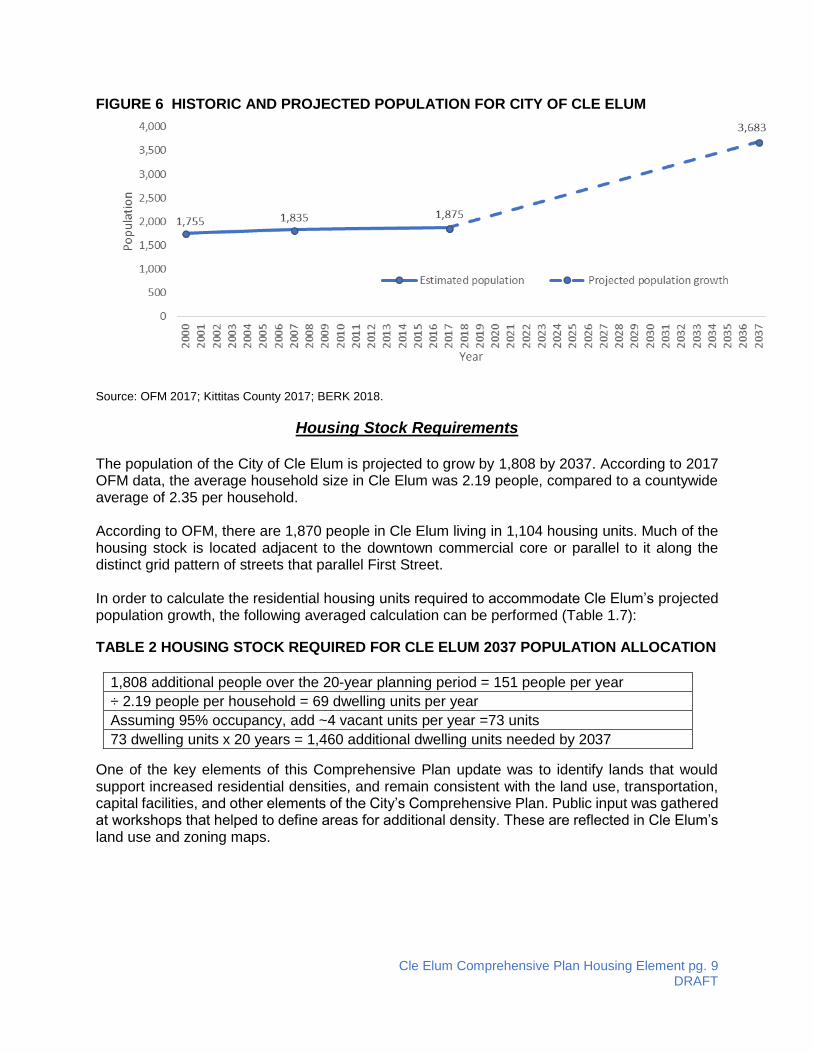
Households and Population Trends Within Cle Elum there are diverse incomes, ages and household types. The amount and type of housing desired by our residents continues to change, reflecting the changing demographic makeup of the City. Cle Elum’s housing stock must accommodate the various types and costs of housing needed by all its community members. The State of Washington Office of Financial Management (OFM) prepares twenty-year growth management planning projections for each county planning under GMA. Total county forecasts must be based upon the most recent projection provided by the OFM when counties and jurisdictions make population projections for planning purposes. The county level forecasts are reviewed and distributed among the jurisdictions in the County through a collaborative process. The Kittitas County Conference of Governments (KCCOG) is the body charged with leading this process, while the final projections are adopted by the Kittitas County Board of County Commissioners (BOCC). The BOCC updated the Kittitas County population allocation based on a projected two percent (2%) overall annual County population growth, which is within the range of the OFM 2012 population forecast. This results in a Kittitas County total population forecast of 65,967 in 2037. The BOCC also adopted a population growth target for the City of Clem Elum of 3,683 in year 2037, as shown in Figure 6. This represents a 3.62% annual rate of growth from the 2017 baseline, somewhat faster than projected for the County as a whole and an increase compared to historic trends.
Cle Elum Comprehensive Plan Housing Element pg. 9
DRAFT
FIGURE 6 HISTORIC AND PROJECTED POPULATION FOR CITY OF CLE ELUM
Source: OFM 2017; Kittitas County 2017; BERK 2018.
Housing Stock Requirements
The population of the City of Cle Elum is projected to grow by 1,808 by 2037. According to 2017 OFM data, the average household size in Cle Elum was 2.19 people, compared to a countywide average of 2.35 per household. According to OFM, there are 1,870 people in Cle Elum living in 1,104 housing units. Much of the housing stock is located adjacent to the downtown commercial core or parallel to it along the distinct grid pattern of streets that parallel First Street. In order to calculate the residential housing units required to accommodate Cle Elum’s projected population growth, the following averaged calculation can be performed (Table 1.7):
TABLE 2 HOUSING STOCK REQUIRED FOR CLE ELUM 2037 POPULATION ALLOCATION
1,808 additional people over the 20-year planning period = 151 people per year
÷ 2.19 people per household = 69 dwelling units per year
Assuming 95% occupancy, add ~4 vacant units per year =73 units
73 dwelling units x 20 years = 1,460 additional dwelling units needed by 2037
One of the key elements of this Comprehensive Plan update was to identify lands that would support increased residential densities, and remain consistent with the land use, transportation, capital facilities, and other elements of the City’s Comprehensive Plan. Public input was gathered at workshops that helped to define areas for additional density. These are reflected in Cle Elum’s land use and zoning maps.
Cle Elum Comprehensive Plan Housing Element pg. 10
DRAFT
Housing Costs and Affordability Understanding the relationship and distribution of household income and housing prices is vital to Cle Elum’s efforts to plan for its housing needs. A household’s income dictates its housing decisions and opportunities. Income groups are typically defined as follows: TABLE 3 HOUSEHOLD INCOME GROUPS
Household Income
Range
Percent of HUD Median Family Income (MFI) for Kittitas County
($68,993 in 2018)
Extremely Low 0 to 30%
Very Low 30 to 50%
Low 50 to 80%
Middle 80 to 120%
Upper 120% and Higher
Source: HUD, 2018. Note, median family income in the City of Cle Elum is about 30% lower than county MFI: $48,798.
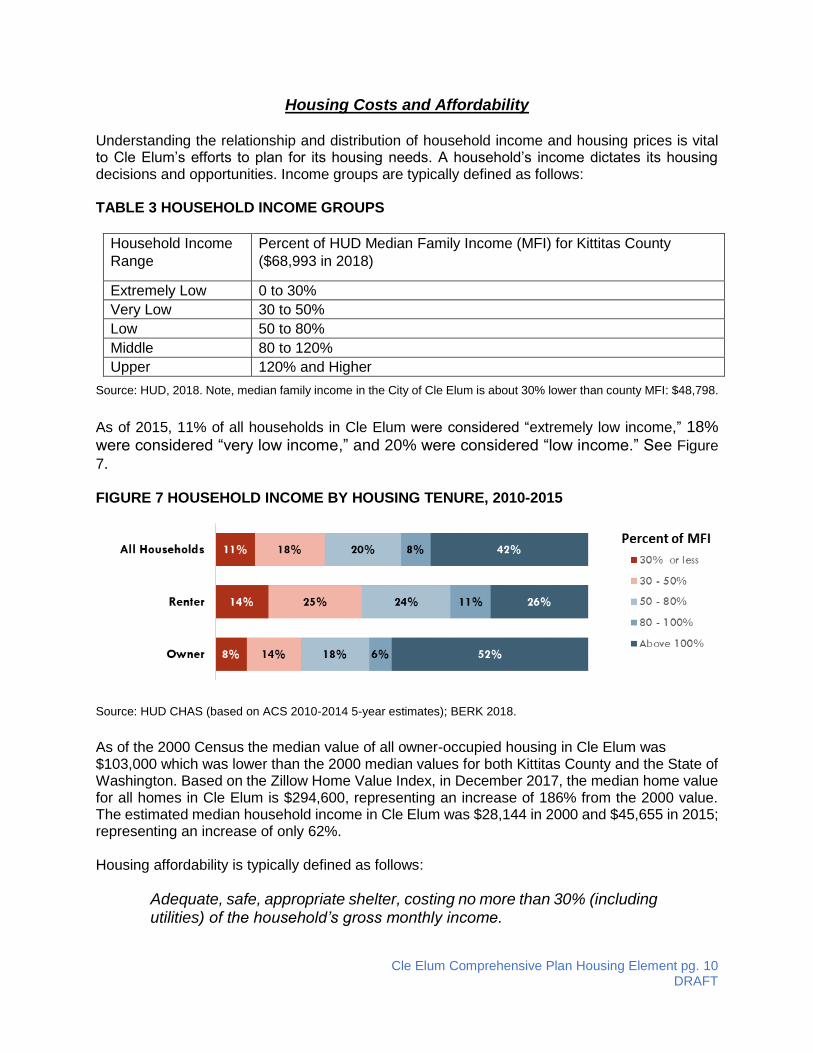
As of 2015, 11% of all households in Cle Elum were considered “extremely low income,” 18% were considered “very low income,” and 20% were considered “low income.” See Figure
7. FIGURE 7 HOUSEHOLD INCOME BY HOUSING TENURE, 2010-2015
Source: HUD CHAS (based on ACS 2010-2014 5-year estimates); BERK 2018.
As of the 2000 Census the median value of all owner-occupied housing in Cle Elum was $103,000 which was lower than the 2000 median values for both Kittitas County and the State of Washington. Based on the Zillow Home Value Index, in December 2017, the median home value for all homes in Cle Elum is $294,600, representing an increase of 186% from the 2000 value. The estimated median household income in Cle Elum was $28,144 in 2000 and $45,655 in 2015; representing an increase of only 62%. Housing affordability is typically defined as follows:
Adequate, safe, appropriate shelter, costing no more than 30% (including utilities) of the household’s gross monthly income.

Cle Elum Comprehensive Plan Housing Element pg. 11
DRAFT
Using this definition, a household is considered housing cost-burdened when 30% or more of its monthly gross income is dedicated to housing. People whose housing costs exceed this threshold of affordability are likely to face difficulty paying for other basic needs, such as food, transportation, clothing, and medical care. The table below shows cost-burdened households in the city by household type. The data show that renters are more likely to be cost-burdened than owners. FIGURE 8 COST-BURDENED HOUSEHOLDS BY HOUSING TENURE, 2010-2014
Source: HUD CHAS (based on ACS 2010-2014 5-year estimates); BERK 2018.
Severe housing cost burdens disproportionately impact poorer households. The data show that the majority of cost-burdened households have relatively lower incomes of 50% of HUD Median Family Income (MFI) or less.
TABLE 4 TOTAL COST-BURDENED HOUSEHOLDS BY INCOME LEVEL, 2010-2014
Source: HUD CHAS (based on ACS 2010-2014 5-year estimates); BERK 2018.
This share of income approach to measuring affordability is not a perfect metric. While it makes the problem of affordability evident, it may inadequately describe the problems that lower income households face. For example, households with higher incomes could pay 30% or more of their income on housing and have enough money left over to avoid difficult budget tradeoffs that a lower income family would encounter. Higher income households, such as with incomes exceeding $200,000 per year, would also be able to afford considerably more and have far more options than households whose incomes are at or below the city median of $45,655 per year; whose affordability index places them with a total monthly housing cost not to exceed $13,696.50
Household Type
Below 30%
MFI
30-50%
MFI
50-80%
MFI
80-100%
MFI
Over 100%
MFI
All Cost Burdened
Households
Elderly Family 0 14 4 0 4 22
Elderly Living Alone 20 38 18 0 0 76
Large Family 20 40 4 0 0 64
Small Family 35 40 39 4 0 118
Other 30 18 0 14 0 62
Total 105 150 65 18 4 342

Cle Elum Comprehensive Plan Housing Element pg. 12
DRAFT
per year ($1,141.30 a month). Another concern is that measuring just the share of income spent on housing does not adequately capture the costs of tradeoffs that are often made to reduce housing costs. Affordability is thus a complex issue, and several factors influence it.
Factors in the Cost and Affordability of Housing
Housing costs are influenced by land costs, construction costs, financing costs, housing demand, regulations, permits, and fees. Many of these factors are beyond the control of the City of Cle Elum. In addition to these factors, the banking industry’s requirement that the land cost shall be only 25 to 30% of the value of the home is significantly impacting the size of homes, and thus the cost of housing. The dramatic rise in land costs in Upper Kittitas County are driving the market toward large, upper-end housing. In order to maintain profitability, developers must pass on the higher costs of these large houses by charging higher prices to buyers. This free market rule applies to all segments of the housing market in all regions of the country. It stands to reason, then, that the City should take an active, engaged and aggressive position in effecting changes and opportunities that affect the cost of housing where it has the ability to do so. This can be accomplished by several strategies that may include: allowing for smaller lots and higher densities so that an acceptable ratio of land to housing value may be accomplished, streamlining development regulations and permit processes, and (where practicable) providing alternatives or reduction in urban infrastructure requirements (such as reducing street widths, consolidating sidewalks, and co-locating storm water facilities).
Housing Maintenance and Preservation Whereas well maintained historic homes and neighborhoods can significantly increase property values, tourism, affordable housing opportunities, and neighborhood cohesiveness, poorly maintained older housing can depreciate property values, become unsightly and in the worst cases, create a hazard to the general health, safety, and welfare of the community. While many older homes in Cle Elum have been well maintained over the years, some have not. One of the most fundamental strategies to increase the supply of affordable housing is to preserve existing stock. Construction of new real estate expands the available building stock and generally induces movement toward newer housing products. Upward movement toward higher valued real estate parallels the downward “filtering” of existing real estate. As most structures age, wear, or become obsolete, they filter down to lower-income occupants.4 The process enables lower income households to move up (equity building), and to occupy units that at one time had been the preserve of middle – or even upper-middle income households. In addition to preservation of affordable housing opportunities, housing maintenance in the form of retrofits can allow residents with special needs to adapt their homes to better accommodate their needs. For example, retrofits can allow elderly residents to modify their housing to accommodate their changing needs and age in place. Retrofits can also increase the energy efficiency and environmental sustainability of homes when features such as high-efficiency toilets and fixtures, low emission paints, and other green products are used.
4 Bear, William C. and Christopher B. Williamson, “The Filtering of Households and Housing Units.” Journal of Planning Literature 3:2 (1998), 127-152.

Cle Elum Comprehensive Plan Housing Element pg. 13
DRAFT
The market force “recycling” or filtering of previously owned housing relies mainly on private maintenance and investment but public programs and incentives can play a supportive role.5 With public and private resolve to maintain homes and neighborhoods, buildings can last hundreds of years.6
The City has been begun to address the maintenance and preservation of its aging housing stock. One potential option to increase preservation is a housing maintenance program. A less resource-intensive role for the city would be to coordinate existing resources available in the community. Several nonprofit organizations and public programs work on maintaining and improving local housing stock. Existing programs include the following:
Habitat for Humanity: The Kittitas County branch of Habitat for Humanity runs a Home Repair and Preservation Program that offers a variety of housing improvement options to homeowners. Families are selected for assistance based on need, ability to pay, and willingness to partner with Habitat. The program works both to increase the life of a house and to increase safety and accessibility for its residents.
USDA loans/grants: Also known as the Section 504 Home Repair program, loans are
given to very-low-income homeowners to repair, improve or modernize their homes or grants to elderly very-low-income homeowners to remove health and safety hazards.
Hopesource Weatherization: HopeSource is a private, non-profit organization that has
provided a wide range of human services in Kittitas County since 1966. Its weatherization program modifies homes to become safer, more energy efficient, and more comfortable. Residents in Kittitas County who meet certain income guideline qualify for the Weatherization program.
Rental Opportunities
Rental housing is attractive to households in all phases of life, because of its greater flexibility and lower upfront financial investments. Rental housing is the primary housing option for people with limited incomes. A diverse range of rental housing options is thus important to meet the needs of Cle Elum’s present and future population. Rental housing can come in a wide variety of configurations. Potential options include apartments, duplexes for families, accessory dwelling units, single room-occupancy, and commercial mixed-use units. Given the employment profile of the community, and the large proportion of workers in seasonal industries such as construction and forestry, longer term rental options would need to be supplemented with shorter term seasonal rentals.
Robust demand for rental units and low vacancy rates have led to rising median rents. The median rent in December 2017, was $1,564, an approximate increase of 20% from November 2010.
6A Guide to Old American Houses, 1700-1900. Henry Lionel Williams, A. S. Barnes & Co., New York. NY, 1962.

Cle Elum Comprehensive Plan Housing Element pg. 14
DRAFT
FIGURE 9 MEDIAN RENT, 2017
Source: Zillow, 2018; BERK, 2018.
Short-term Rentals
In this backdrop of high demand, short-term rentals may play a role. Short term rentals have both benefits and challenges. The availability of short-term units can attract tourists and visitors whose spending can generate economic activity for the city. In addition, the availability of short-term rentals can provide an extra source of income for families who operate these rentals that can alleviate their housing burden. However, the more commercial use of short-term rentals by platforms such as Airbnb or others raises rents for residents by removing potentially affordable rental units from the housing market. In addition, neighborhood livability can be affected when units in predominantly residential areas are converted to short term rentals.
Direction for Housing Policies
This Housing Element of the Comprehensive Plan outlines the City’s direction to three basic objectives;
1. The need to provide adequate capacity for residential growth to meet regional growth targets;
2. The need to encourage the development of a wide variety of housing alternatives to meet the needs of a diverse population; and
3. The need to foster opportunities that provide affordable housing. The City can influence the local housing market through a variety of means:
1. By directing the location and amount of land available for residential development; and 2. By amending its ordinances and codes to affect the size, type, and design of new and
renovated housing; and 3. By building (or providing mechanisms for) quality, common sense amenities that attract
and/or retain quality residential development; and 4. By providing sufficient administrative flexibility to allow the City to permit the quality
development of new, and the preservation of existing, homes and neighborhoods reticent of emerging market conditions and new issues; and
5. By seeking financial resources and partnerships which can help meet the objectives of maintaining the City’s existing housing stock and to provide affordable housing.
Cle Elum Comprehensive Plan Housing Element pg. 15
DRAFT
As previously stated the 2037 Population Allocation forecasts Cle Elum’s population at 3,683 persons, with a potential need of 1,460 housing units. While much of the demand will be met by new housing construction, rehabilitation of older structures and selective infill development within existing residential areas will also help satisfy this future demand. Some of the future demand for housing will be for persons with special needs including those seeking group homes, emergency or transitional housing, senior housing, single room occupancy and assisted living. Cle Elum is committed to working with all appropriate agencies and entities (public and private) to ensure our housing supply meets the needs of a diverse population. The City of Cle Elum is committed to meeting the future demand for housing through the following strategies, goals, and policies:
Strategy I – Infill Housing Within Residential Areas This strategy would encourage additional housing being developed on remaining lots within the City limits and within existing residential areas. This strategy would permit the development of smaller lots that are compatible with existing neighborhood scale and character. The provision for plats of smaller lots located within the existing city limits could be permitted to allow for innovative single-family infill housing such as cottage housing or other alternative types of housing that would be consistent and “blend” with surrounding homes and remain single-family fee simple housing. Additionally, this strategy should redefine accessory dwelling units and duplex housing density to be more compatible with neighborhood character, land use and transportation capacity. Changes to the zoning ordinance to allow for a greater variety and density of infill development should be considered.
Strategy II – Mixed-Use Development
Strategy IV – Preservation of Existing Housing Older homes in existing neighborhoods, accessory units, and manufactured homes currently provide affordable housing opportunities for some residents. Preservation of the existing affordable housing stock is critical to maintaining access to those sources. The City will seek ways of maintaining and increasing the availability of this housing type through Community Development Block Grant funds for repair and maintenance, and through development links with affordable housing providers not currently operating in Cle Elum.
Strategy V – Zoning Incentives / Reduction of Development Standards Zoning incentives are another mechanism to encourage the development of affordable housing through the private market. Incentives can encourage the production of affordable (or more affordable) housing through density bonuses, forgiveness or reduction of impact fees, development fees, or permit costs. Amendments to the zoning ordinance and to Cle Elum’s Development Standards can also facilitate the provision of affordable housing and more sustainable neighborhoods by promoting a greater variety of housing types, providing incentives, or removing barriers in the code that indirectly prevent affordable housing construction.
Strategy VI – Housing for Assisted Living

Cle Elum Comprehensive Plan Housing Element pg. 16
DRAFT
Federal and State law mandate that cities provide the same residential opportunities to individuals of special needs as are available to single family residents. These individuals may be part of group homes for the handicapped or group homes for children, require some assistance in their day-to-day living, such as the physically or mentally disabled, be victims of domestic violence, substance abusers, people living with HIV/AIDS, youth at risk, and seniors. Family living situations, institutional settings, social service programs, and assisted housing, specifically excluding Secure Community Transition Facilities as defined in Washington State law, all serve a portion of those populations with special needs. The Federal Fair Housing Act includes all individuals with special needs and states that no individual shall be denied the opportunity for safe and independent living. In addition, the Washington Housing Policy Act states that a “decent home in a healthy, safe environment for every resident of the State” shall be provided. The Housing Element supports goals and policies that provide equal and fair housing access for all residents of Cle Elum, including special needs residents. In order to provide housing opportunities for residents of special needs, the City shall work with public and private agencies to provide opportunities and services that would not be available otherwise to these residents. In addition, the City shall provide for these populations by continuing to support codes and ordinances which allow for a variety of housing opportunities, as well as encouraging the increase of social support services within the City and surrounding area. Adding flexibility to the City’s land use code to allow group homes and home-based care are also significant opportunities available to the City for meeting the demand for special needs housing.
Housing Element Goals and Policies
Goal H-1: The City of Cle Elum includes a diverse mix of housing types that meets the needs and are affordable to all segments of its population, especially low and moderate-income households. The range of housing types also reflect market conditions, the City’s rural setting, and small-town character.
Policies: H – 1.1 Encourage the development of flexible lot sizes and single-family residential infill that is compatible in existing neighborhoods.
H – 1.2 Promote the creation of housing options that are safe, affordable, and accessible for
older residents.
H – 1.3 Encourage smaller units such as one bedroom-units and studios that can meet the
housing needs of a diversity of ages, household types, and household sizes.
H – 1.4 Encourage housing strategies that allow older residents to remain in the community as
their housing needs evolve.
H – 1.5 Accommodate and encourage, where appropriate, moderate density residential
developments such as townhouses, multifamily complexes, duplexes, and mixed-use residential buildings.
H – 1.6 Promote the production of housing affordable for all incomes, through a mix of housing types, models, and densities throughout the City including: small lot single family detached,

Cle Elum Comprehensive Plan Housing Element pg. 17
DRAFT
zero lot line, attached housing, accessory units, cluster housing, cottages, duplexes, townhouses, and apartments, as well as manufactured housing units, that are compatible with the neighborhoods in which they are located.
H – 1.7 Create attractive incentives for developers to encourage the provision of various types of sustainable and affordable housing. H – 1.8 Consider financial tools such as levies, affordable housing sales tax, multi-family property tax exemption, or other programs that encourage the private sector to build housing that fulfills city goals. H – 1.9 Require new multi-family or mixed-use projects involving 20 dwelling units or more to provide affordable dwelling units as part of the project.
H – 1.10 Encourage public/private partnerships to pursue housing development opportunities within the City that supply more affordable housing while providing a high quality residential living environment.
H - 1.11 Work with Kittitas County to develop more affordable housing opportunities throughout the Upper Kittitas County Region.
H – 1.12 Develop a continuum of strategies to reduce fees and/or development standards (where practicable) to increase affordable housing opportunities. H – 1.13 Provide a sufficient amount of land zoned for current and projected residential needs.
H – 1.14 Encourage a mix of housing types, including affordable housing types, to be dispersed throughout the City, rather than concentrated in a specific area(s).
Goal H-2: A practical palette of options and incentives encourage sustainable and attractive affordable housing in new developments.
Policies: H – 2.1 Promote diversity in style and cost by allowing innovative mixtures of housing types and creative approaches to housing design and development.
H – 2.2 Assist in and promote the development of innovative and affordable housing projects by exploring alternative design, land development, infrastructure, and construction techniques.
H – 2.3 Help create and participate in local and/or regional resource, education, and lobbying regarding housing data, housing programs, design alternatives, and funding sources.
H- 2.4 Provide density bonuses, transfer of development rights, and other incentives for the development of affordable housing.

Cle Elum Comprehensive Plan Housing Element pg. 18
DRAFT
H – 2.5 Review and revise or remove building and development code requirements as needed to remove unnecessary constraints on new construction and/or rehabilitation or existing structures.
H – 2.6 Use zoning and building codes, where practicable, to encourage home ownership opportunities.
H - 2.7 Revise Zoning and Development standards to provide options that increase the supply of affordable home ownership opportunities, such as small lot sizes, zero lot lines, townhouses, condominiums, clustering, manufactured homes, cottages, and attached single family housing.
Goal H-3: Residential neighborhoods contain necessary public amenities and support facilities that contribute to a high quality of life in Cle Elum.
Policies: H – 3.1 Preserve and enhance the integrity and quality of existing residential neighborhoods.
H – 3.2 Support housing with appropriate amenities for individuals, families, and children.
H – 3.3 Require developments to contribute their fair share of on-site and off-site improvements needed as a result of the development.
H – 3.4 Promote functional, well designed and integrated multi-modal transportation facilities to serve neighborhoods.
H – 3.5 Develop neighborhood amenities such as parks, trails, connections and open space that encourage and foster community and promote recognition of the historic sense of place which is Cle Elum.
H – 3.6 Establish designated residential “neighborhoods” or “neighborhood subareas” in the Comprehensive Plan. H – 3.7 Balance the economic benefits created by short-term rentals with the need for a supply of long-term rental housing stock by regulating short-term rentals. H – 3.8 Limit new short-term rental units to primary residences and a maximum of one additional dwelling unit. H – 3.9 Require a Short-term Rental Operator license or similar regulatory license to operate short-term rentals. H – 3.10 Require Short-term Rental Operators in residential zones to establish quiet hours, notify neighbors, limit signage, and meet parking requirements. H – 3.11 Restrict the duration of stay at RV parks to prevent the establishment of permanent housing in areas without neighborhood amenities or appropriate infrastructure.
Cle Elum Comprehensive Plan Housing Element pg. 19
DRAFT
Goal H-4: The City of Cle Elum has adequate land capacity for forecasted population and residential growth targets at urban densities in its City limits and UGA in order to promote stable housing prices, foster affordability and broaden housing choices.
Policies: H – 4.1 Ensure ongoing review and coordination between Cle Elum and Kittitas County on population and residential growth targets to ensure that Cle Elum’s incorporated limits and UGA provide adequate developable land to accommodate those targets.
H- 4.2 Allow density bonuses in residential districts when affordable housing is provided.
H – 4.3 Work with Kittitas County to ensure appropriate density and amenity for residential developments in the City’s Urban Growth Area.
H – 4.4 Promote infill development at a scale and intensity that enhances/preserves existing neighborhoods while creating new housing choices.
H – 4.5 Continue to support mixed use development and housing in the City’s Downtown Core.
Goal H-5: The City’s existing housing stock is preserved and rehabilitated as a means of increasing the supply of affordable housing, given that existing housing is typically more affordable than new construction.
Policies: H – 5.1 Consistently enforce building maintenance, health and safety codes for the City’s housing stock.
H – 5.2 Encourage the preservation and enhancement of older housing stock through education and Community Development Block Grant funding opportunities. H – 5.2 Encourage programs that offer assistance with renovations, home improvements and maintenance efforts, so that residents can continue to stay in their homes even when their housing needs change.
H – 5.3 Work with homeowners and the applicable providers of resources, such as Hope Source and community civic organizations, such as local churches, to provide rehabilitation funds, technical assistance, or services for the City’s existing housing stock.
Goal H-6: Housing is available for residents of Cle Elum with special housing needs, with the exception of Secure Community Transition Facilities as defined in Washington State Law.
Policies: H – 6.1 Support the preservation and development of special needs housing in Cle Elum.

Cle Elum Comprehensive Plan Housing Element pg. 20
DRAFT
H – 6.2 Work in partnership with employers, for-profit, and not-for profit developers to encourage the provision of seasonal housing for local workers.
H – 6.3 Evaluate and remove regulatory barriers, redundancies and inconsistencies to ensure that codes and ordinances are compliant with The Federal Fair Housing Act (Chapter 151B) which includes protections for all individuals with special needs and states that “no individual shall be denied the opportunity for safe and independent living”, and the Washington Housing Policy Act which states that “a decent home in a healthy, safe environment for every resident of the State shall be provided” (RCW 43.185B.009). H – 6.4 Work in partnership with HopeSource, Housing Authority, Kittitas County, or others to facilitate the provision of housing for homeless residents and residents with special needs. H – 6.5 Ensure fair and equal access to housing in Cle Elum for all persons by encouraging the development of housing for all segments of the community in the City’s zoning and development regulations and by coordinating with public and private partners for special needs housing.
Goal H-7: Actively participate in regional responses to affordable housing development needs and issues.
Policies: H – 7.1 Participate in and promote the development of countywide resources and programs to promote a diversity of housing types. H – 7.2 Improve coordination among the county, other jurisdictions, housing providers, builders, developers, and the financial community to identify, promote, and implement local and regional strategies to increase housing opportunities.