City of Bellingham · City of Bellingham 2006 ANNUAL CONCURRENCY REPORT Prepared for: City of...
22
City of Bellingham 2006 ANNUAL CONCURRENCY REPORT Prepared for: City of Bellingham April 2006 Prepared by: The Transpo Group, Inc. 11730 118 th Avenue NE, Suite 600 Kirkland, WA 98034-7120 Phone: 425.821.3665 Fax: 425.825.8434 www.thetranspogroup.com © 2006 The Transpo Group
-
Upload
hoangtuong -
Category
Documents
-
view
218 -
download
0
Transcript of City of Bellingham · City of Bellingham 2006 ANNUAL CONCURRENCY REPORT Prepared for: City of...

City of Bellingham
2006 ANNUAL CONCURRENCY REPORT
Prepared for:
City of Bellingham
April 2006
Prepared by: The Transpo Group, Inc.
11730 118th Avenue NE, Suite 600 Kirkland, WA 98034-7120
Phone: 425.821.3665 Fax: 425.825.8434
www.thetranspogroup.com
© 2006 The Transpo Group

Table of Contents TRANSPORTATION INFORMATION SOURCES ............................................ 2
INTRODUCTION ...................................................................................... 3
PURPOSE ................................................................................................. 5
FINDINGS ................................................................................................ 5 Existing 2006 LOS ...........................................................................................................................5 Forecasted 2012 LOS.......................................................................................................................6 Transportation Concurrency Mitigation Options........................................................................6
ADOPTED LOS STANDARDS ..................................................................... 7 City Arterials......................................................................................................................................7 Alternative Peak Hour LOS F ........................................................................................................8 Highways of Statewide Significance (HSS) .................................................................................11 Highways of Regional Significance (non-HSS) ..........................................................................11
LOS EVALUATION .................................................................................. 13 Concurrency Evaluation Tracking Tool (CETT) – 2006 LOS................................................13 Travel Demand Forecasting Model – 2012 LOS.......................................................................16
TRANSPORTATION CONCURRENCY MANAGEMENT PROGRAM PROPOSED ENHANCEMENTS ................................................................................... 20
Figures
Figure 1. Development Transportation Review/Mitigation Programs..................................4 Figure 2. Average Weekday Traffic Volumes ............................................................................7 Figure 3. Arterial Street Roadway Functional Classification .................................................12 Figure 4. 2006 Traffic Volume Data By Intersection Approach ..........................................15 Figure 5. 2012 Travel Model Analysis By Link........................................................................19
Tables Table 1. 2006 Concurrency Evaluation Results .....................................................................14 Table 2. 2012 Concurrency Evaluation Results .....................................................................17

Annual Concurrency Report April 2006
The Transpo Group | FINAL.Annual.Concurrency.Report.4.27.2006.doc 2
Transportation Information Sources City of Bellingham Public Works Department www.cob.org/pw 210 Lottie Street (City Hall) Bellingham, WA 98225 (360) 676-6961 telephone (360) 676-6894 fax For questions regarding Transportation Concurrency requirements, contact: Chris Comeau, AICP, Transportation Planner [email protected] For questions regarding other Public Works development requirements, contact: Dick McKinley, Public Works Director [email protected] Rory Routhe, P.E., Assistant Director/City Engineer [email protected] Brent Baldwin, AICP, Development Review Manager [email protected]
Bellingham Transportation Planning Documents City of Bellingham 1995 Comprehensive Plan, Transportation Element City of Bellingham 2005 Draft Comprehensive Plan, Transportation Element 2006-2011 Transportation Improvement Program BMC 11.63.110 E. Arterial Street System for Bellingham BMC 13.70.000 Transportation Concurrency Management Ordinance
World Wide Web Sites for Bellingham/Whatcom Transportation Information Bellingham Public Works Department ................................................................www.cob.org/pw Bellingham Planning Department .......................................................................www.cob.org/pcd Whatcom Transportation Authority ................................................................... www.ridewta.com Whatcom County .........................................................................................www.co.whatcom.wa.us Port of Bellingham................................................................................www.portofbellingham.com Whatcom Council of Governments..........................................................................www.wcog.org Washington State Department of Transportation ..........................................www.wsdot.wa.gov U.S. Federal Highway Administration ...............................................................www.fhwa.dot.gov U.S. Department of Transportation............................................................................ www.dot.gov

Annual Concurrency Report April 2006
The Transpo Group | FINAL.Annual.Concurrency.Report.4.27.2006.doc 3
Introduction The Washington State Growth Management Act (GMA) of 1990 (RCW 36.70A.70) requires that infrastructure improvements or strategies to accommodate development be available when the impacts of development occur. Concurrency is defined in the GMA and Washington Administrative Code (WAC) to mean that any needed transportation improvements or programs be in place at the time of development or that a financial commitment exists to complete the improvements or strategies within six years.
The City of Bellingham’s 1995 Comprehensive Plan identifies level of service (LOS) standards for arterial streets. These LOS standards are intended to provide measurable criteria to assess the adequacy of the transportation system capacity. To date, these standards have be been implemented through the City’s development review process at an individual project level during the State Environmental Policy Act (SEPA) review process, project development requirements (frontage improvements), and assessment of Traffic Impact Fees (TIFs).
In February 2006, the City Council voted 7-0 to adopt a Transportation Concurrency Management Ordinance, which specifically establishes a program to monitor and maintain arterial street capacity in support of the City’s land use strategy. Development projects will continue to be subject to SEPA review, development requirements and street frontage improvements, and traffic impact fees. Figure 1 illustrates the how the four different development transportation review “tools” fit together to provide a comprehensive transportation review and mitigation program. Note that arterial capacity must be available for concurrency approval.
The Annual Concurrency Report is intended to provide a status of existing and future transportation concurrency conditions. The report is organized into the following sections:
• Purpose • Findings • Adopted LOS Standards • LOS Evaluation • Transportation Concurrency Management Program Proposed Enhancements

Annual Concurrency Report April 2006
The Transpo Group | FINAL.Annual.Concurrency.Report.4.27.2006.doc 4
Figure 1. Development Transportation Review/Mitigation Programs

Annual Concurrency Report April 2006
The Transpo Group | FINAL.Annual.Concurrency.Report.4.27.2006.doc 5
Purpose This report is the City’s first annual assessment of transportation concurrency status on the arterial street network. The primary objective of this first annual transportation concurrency report is to establish baseline LOS and transportation concurrency conditions through the year 2005. The annual report also identifies transportation concurrency problems, issues, and circumstances throughout the City so that transportation funding and mitigation strategies may be explored to effectively accommodate changing conditions and circumstances. Ultimately, the goal of the annual transportation concurrency report is to provide an assessment of the existing and future six-year multi-modal transportation system to help inform the City Council in making funding decisions for the City’s annual 6-Year Transportation Improvement Program (TIP).
This first annual report uses the most current transportation information available from a variety of sources, including: the City 2006-2012 Transportation Improvement Program; City, County, and WSDOT traffic counts; traffic studies required for development proposals; the Bellingham Travel Demand Forecast Model; and the 2005 Draft Bellingham Comprehensive Plan.
Findings An overview of the 2006 and 2012 LOS analyses indicates the following:
Existing 2006 LOS • Importantly, volume-to-capacity (v/c) ratios reported in Table 1 are calculated based on
actual traffic counts on Bellingham arterial streets. Table 1 summarizes the LOS results.
• 11 locations are estimated to approach the LOS standard and 7 locations are currently estimated to exceed the LOS standard.
• 2 of the 11 arterial segments estimated to approach the City’s LOS standard are local arterials for which LOS E has been adopted; Ellis Street and Holly Street.
• One of the 11 arterial segments estimated to approach the City’s LOS standard is Northwest Avenue between Elm and Interstate 5. This arterial segment was 1 of the 11 segments identified in the 1995 Comprehensive Plan as an arterial allowed to function at Alternative Peak Hour LOS F. The 2005 Draft Bellingham Comprehensive Plan, Transportation Element proposes a maximum threshold of 125% of capacity for this and the other 10 segments allowed to function at Peak Hour LOS F in the 1995 Plan.
• Most of the locations estimated to approach and exceed the LOS standard are on access routes to/from Interstate 5. Interstate 5 is classified as a Highway of Statewide Significance (HSS) which is not subject to local concurrency standards.
• One of the current limitations is the use of planning level capacities for the arterials. City staff are evaluating the capacities to be used in the concurrency program.

Annual Concurrency Report April 2006
The Transpo Group | FINAL.Annual.Concurrency.Report.4.27.2006.doc 6
Forecasted 2012 LOS • Importantly, volume-to-capacity (v/c) ratios reported in Table 2 are forecasted based
on land use and employment assumptions and associated trip generation projections built into the Travel Demand Forecast Model, which is a planning tool. These projections will change with each annual concurrency report as traffic counts and land uses change. Table 2 summarizes the projected LOS results.
• 12 locations are forecast to exceed the standard by 2012 and 13 locations are forecast to approach the LOS standard. Table 2 summarizes the LOS results.
• 2 of the 13 arterial segments forecast to approach the City’s standard are Meridian Street between Broadway and East Maplewood & Northwest Avenue, Elm Street to I-5. These arterials segments are 2 of the 11 segments identified in the 1995 Comprehensive Plan as arterials allowed to function at Alternative Peak Hour LOS F. The 2005 Comprehensive Plan update proposes a maximum threshold of 125% of capacity for these and the other 9 segments identified in the 1995 Plan.
• Most of the approaching and exceeding the LOS standard locations are on arterials serving as major access routes to and from the City. This is due, in part, to the continued residential growth outside the City limits and the daily commuting trips into the City that result.
• The model tool has limitations since traffic counts are not available to refine the calibration and therefore the forecasts can vary somewhat from actual conditions. Furthermore, the model uses planning level capacities for the arterials. City staff is evaluating the capacities to be used in the concurrency program.
• This evaluation assumes unit growth between 2002 and 2012 based on the 2022 land use forecasts. Therefore, the results only provide a broad indication of where concurrency issues may develop over the next few years.
Transportation Concurrency Mitigation Options For the location that are approaching or exceeding the LOS standards, the City can consider the following options:
• Deny developments that impact segments at or above the standard by 10 or more PM peak hour trips.
• Require development to phase the impacts or mitigate concurrency through transportation demand management or funding/constructing capacity improvements.
• Program City improvements to increase roadway capacity.
• Change the LOS standard (i.e. Alternative LOS F and a maximum percent of capacity threshold).

Annual Concurrency Report April 2006
The Transpo Group | FINAL.Annual.Concurrency.Report.4.27.2006.doc 7
0
10
20
30
40
50
60
70
80
90
100
110
120
130
140
00 A
M
46 A
M
45 A
M
0 A
M
46 A
M
35 P
M
1 P
M
44 P
M
40 P
M
36 P
M
44 P
M
LOS A
LOS E (Adopted Standard for Arterials)
LOS DLOS CLOS B
LOS F (Adopted Standard for SELECT Arterials)
L.O.S. Measured Here
Used Arterial Capacity
AvailableUnused Arterial Capacity
AvailableUnused Arterial Capacity
P.M
. Pea
k H
our (
The
Loca
l Eve
ning
Rus
h H
our)
Time
Traf
fic V
olum
e M
easu
red
Aga
inst
Arte
rial D
esig
n C
apac
ity
12:0
0 AM
11:1
5 PM
12:0
0 PM
6:00
AM
6:00
PM
5:00
PM
Adopted LOS Standards GMA requires counties and local municipalities planning under the Act to establish level of service standards for all locally owned arterials (RCW 36.70A.070(6)(a)(iii)(B)). These standards should be regionally coordinated. In Whatcom County, the Whatcom Council of Governments (WCOG) serves as the Metropolitan Planning Organization (MPO) and Regional Transportation Planning Organization (RTPO). In addition, GMA requires the inclusion of state highways of regional significance (non-HSS) in local concurrency plans.
The City’s adopted arterial LOS standard uses a PM peak hour percent of capacity. Directional PM peak hour arterial roadway volumes are divided by the directional arterial roadway capacity to calculate the v/c ratio. The capacity values are based on the roadway capacity values assigned in the City’s travel demand forecasting model. The capacities in the model are planning level capacities and typically underestimate actual roadway capacities.
Figure 2 illustrates traffic volumes on a typical urban arterial during various time periods of an average weekday. Note the PM peak time period occurs for a short duration, however, traffic volumes are two to three times as heavy as compared to the off peak time periods. Figure 2. Average Weekday Traffic Volumes
City Arterials The 1995 Bellingham Comprehensive Plan established Peak Hour LOS E or better (less than or equal to 100% of capacity) for arterial streets throughout the City (Page tr.10, Transportation Element, 1995 Bellingham Comprehensive Plan and pages T-32 through T-34, 2005 Draft Bellingham Comprehensive Plan).Figure 3 illustrates the City’s adopted arterial functional classification. In addition, an Alternative Peak Hour LOS F (greater than 100% of capacity) was established for 11 specific arterial sections that are anticipated to fall below LOS E, but where no feasible mitigating measures are available (Pages tr.26 through tr.28, Transportation Element, 1995

Annual Concurrency Report April 2006
The Transpo Group | FINAL.Annual.Concurrency.Report.4.27.2006.doc 8
Bellingham Comprehensive Plan and pages T-69 through T-74, 2005 Draft Bellingham Comprehensive Plan).
Alternative Peak Hour LOS F Specific Arterials Allowed to function at greater than 100% of capacity due to difficulties with potential mitigation measures. (Pages tr.26 through tr.28, Transportation Element, 1995 Bellingham Comprehensive Plan and pages T-69 through T-74, 2005 Draft Bellingham Comprehensive Plan). In 1995, it was determined that identified mitigation measures to maintain Peak Hour LOS E during the p.m. peak hour for the transportation arterial streets listed below were not feasible due to physical space constraints, proximity to other transportation facilities, negative economic impacts, or other extenuating circumstances. The difficult mitigation for these arterials has not changed in 2005 and therefore it is recommended that these transportation facilities continue to be allowed to function at the Alternative Peak Hour LOS F during the p.m. peak hour (aka, the local evening rush hour).
The 2005 Draft Bellingham Comprehensive Plan proposes a maximum concurrency threshold of 125% of capacity for arterial street sections adopted for the Alternative Peak Hour LOS F (Page T-34, 2005 Draft Bellingham Comprehensive Plan). If the City Council adopts this new standard, these 11 arterial sections will be allowed to function up to 125% of capacity during the PM peak hour.
• Meridian Street between Broadway and East Maplewood. This arterial section of Meridian Street is expected to have traffic volumes that exceed the physical capacity of the road at Peak Hour LOS E. Mitigation to improve Peak Hour LOS would require the removal of all on-street parking and the physical widening of the intersections at Broadway/Meridian and Illinois/Meridian. The removal of on-street parking between Broadway and Illinois would have a negative impact on businesses in the area. North of Illinois, the removal of on-street parking would, to a lesser degree, negatively affect residential on-street parking. The widening of intersections at Broadway/Meridian and Illinois/Meridian to maintain Peak Hour LOS E would require the displacement of businesses.
Status: In 1995, the City Council determined that removal of on-street parking and physical reconstruction of intersections was not a desirable form of mitigation for the community. Therefore, Alternative Peak Hour LOS F was adopted for this arterial. A maximum concurrency threshold of (1.25) has been proposed for this arterial in the 2005 Draft Bellingham Comprehensive Plan.
• King Street between Ohio and Iowa. This one-block link experiences lower levels of service primarily because of intersection problems at King and Ohio. Located in conjunction with the interstate southbound off-ramp, signalization of this intersection presents negative effects in the form of freeway backups due to the length of the ramp and sight distance concerns due to the ramp curvature. Southbound traffic on King experiences excessive delays because of the existing geometry. Mitigation of this deficiency is complex and will require major interchange restructuring.
Status: In 1995, the City Council determined that physical reconstruction of intersections was not a feasible or desirable form of mitigation for the community.

Annual Concurrency Report April 2006
The Transpo Group | FINAL.Annual.Concurrency.Report.4.27.2006.doc 9
Therefore, Alternative Peak Hour LOS F was adopted for this arterial. A maximum concurrency threshold of (1.25) has been proposed for this arterial in the 2005 Draft Bellingham Comprehensive Plan.
• Boulevard Street between State and Finnegan. Although operating below Peak Hour LOS E during the p.m. peak hour, this link presents no significant capacity concerns due to the limited number of intersections along the route. There are topographic constraints to widening this arterial, but the deficiency may be partially overcome with the installation of curb, gutter, sidewalks, improved street lighting, and bicycle lanes. Bicycle lanes have been created on part of this route and a flashing pedestrian crossing device has been installed at the Boulevard/Adams intersection. In addition, a shared off-street bicycle and pedestrian pathway exists below the bluff that includes bridges, safe railroad crossings, and two boardwalks connect this portion of downtown to Fairhaven. WTA high-frequency public transit between downtown Bellingham and Fairhaven will begin in 2006 and potential future mitigation could include street trolleys.
Status: In 1995, the City Council determined that widening this arterial was not feasible or a desirable form of mitigation for the community. Therefore, Alternative Peak Hour LOS F was adopted for this arterial. A maximum concurrency threshold of (1.25) has been proposed for this arterial in the 2005 Draft Bellingham Comprehensive Plan.
• 12th Street between Old Fairhaven Parkway and Hawthorn. This link is constricted in width due to the 2-lane configuration of the State highway bridge over Padden Creek. Additional complexity results from the convergence of Cowgill, Hawthorn, Park Ridge, 12th Street, and Chuckanut Drive (SR 11) at the signalized intersection south of the State highway bridge. Potential mitigation includes improvement of signal timing, a new arterial connecting Chuckanut Drive (SR 11) to Old Fairhaven Parkway through Area 4 of the South Neighborhood, and reconstruction and widening of the Padden Creek Bridge.
Status: In 1995, the City Council determined that reconstruction and widening of the State highway bridge was not a financially feasible form of mitigation for the community. Therefore, Alternative Peak Hour LOS F was adopted for this arterial. A maximum concurrency threshold of (1.25) has been proposed for this arterial in the 2005 Draft Bellingham Comprehensive Plan.
• Orleans Street between Sunset and Alabama. Traffic volume is expected to exceed the physical capacity of the road during the p.m. peak hour and operation will fall below Peak Hour LOS E. The width of the street cannot support additional travel lanes without widening. If the road were to be widened, parking would be displaced and, in many instances, the road would be placed close to existing homes.
Status: In 1995, the City Council determined that removing on-street parking and widening this arterial was not a feasible or a desirable form of mitigation for the community. Therefore, Alternative Peak Hour LOS F was adopted for this arterial. A maximum concurrency threshold of (1.25) has been proposed for this arterial in the 2005 Draft Bellingham Comprehensive Plan.
Annual Concurrency Report April 2006
The Transpo Group | FINAL.Annual.Concurrency.Report.4.27.2006.doc 10
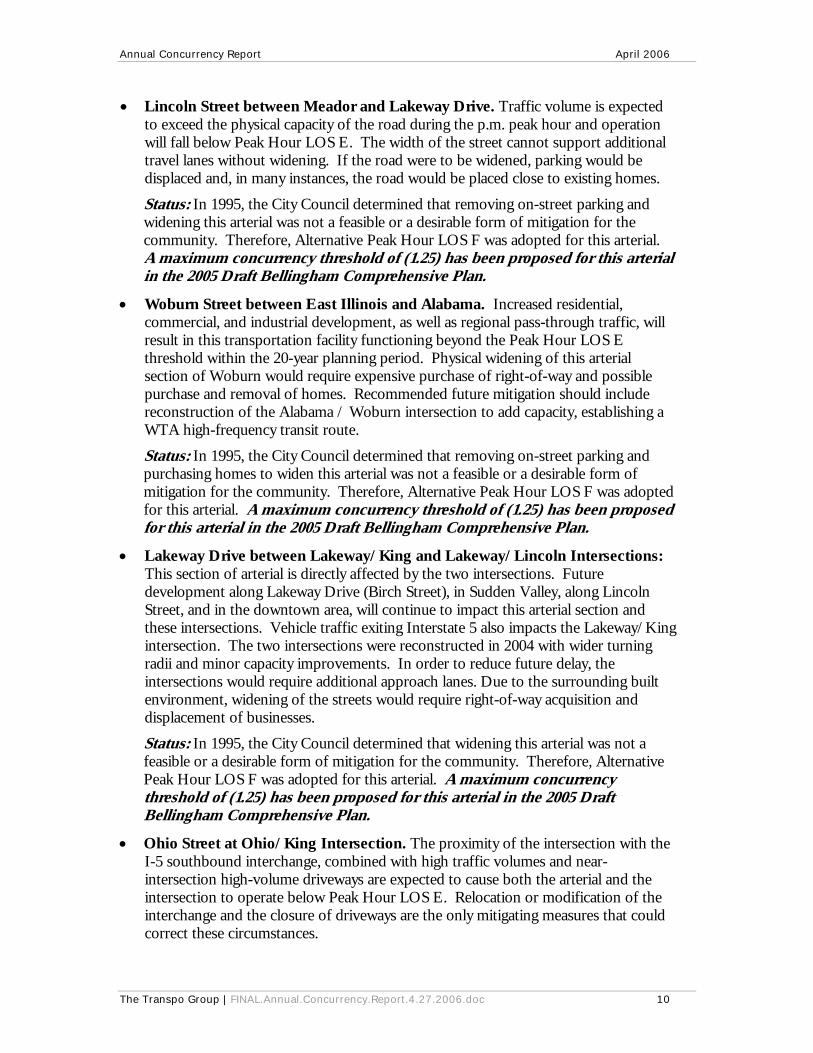
• Lincoln Street between Meador and Lakeway Drive. Traffic volume is expected to exceed the physical capacity of the road during the p.m. peak hour and operation will fall below Peak Hour LOS E. The width of the street cannot support additional travel lanes without widening. If the road were to be widened, parking would be displaced and, in many instances, the road would be placed close to existing homes.
Status: In 1995, the City Council determined that removing on-street parking and widening this arterial was not a feasible or a desirable form of mitigation for the community. Therefore, Alternative Peak Hour LOS F was adopted for this arterial. A maximum concurrency threshold of (1.25) has been proposed for this arterial in the 2005 Draft Bellingham Comprehensive Plan.
• Woburn Street between East Illinois and Alabama. Increased residential, commercial, and industrial development, as well as regional pass-through traffic, will result in this transportation facility functioning beyond the Peak Hour LOS E threshold within the 20-year planning period. Physical widening of this arterial section of Woburn would require expensive purchase of right-of-way and possible purchase and removal of homes. Recommended future mitigation should include reconstruction of the Alabama / Woburn intersection to add capacity, establishing a WTA high-frequency transit route.
Status: In 1995, the City Council determined that removing on-street parking and purchasing homes to widen this arterial was not a feasible or a desirable form of mitigation for the community. Therefore, Alternative Peak Hour LOS F was adopted for this arterial. A maximum concurrency threshold of (1.25) has been proposed for this arterial in the 2005 Draft Bellingham Comprehensive Plan.
• Lakeway Drive between Lakeway/King and Lakeway/Lincoln Intersections: This section of arterial is directly affected by the two intersections. Future development along Lakeway Drive (Birch Street), in Sudden Valley, along Lincoln Street, and in the downtown area, will continue to impact this arterial section and these intersections. Vehicle traffic exiting Interstate 5 also impacts the Lakeway/King intersection. The two intersections were reconstructed in 2004 with wider turning radii and minor capacity improvements. In order to reduce future delay, the intersections would require additional approach lanes. Due to the surrounding built environment, widening of the streets would require right-of-way acquisition and displacement of businesses.
Status: In 1995, the City Council determined that widening this arterial was not a feasible or a desirable form of mitigation for the community. Therefore, Alternative Peak Hour LOS F was adopted for this arterial. A maximum concurrency threshold of (1.25) has been proposed for this arterial in the 2005 Draft Bellingham Comprehensive Plan.
• Ohio Street at Ohio/King Intersection. The proximity of the intersection with the I-5 southbound interchange, combined with high traffic volumes and near-intersection high-volume driveways are expected to cause both the arterial and the intersection to operate below Peak Hour LOS E. Relocation or modification of the interchange and the closure of driveways are the only mitigating measures that could correct these circumstances.

Annual Concurrency Report April 2006
The Transpo Group | FINAL.Annual.Concurrency.Report.4.27.2006.doc 11
Status: In 1995, the City Council determined that relocation or modification of the interchange and the closure of driveways were not a feasible or a desirable form of mitigation for the community. Therefore, Alternative Peak Hour LOS F was adopted for this arterial. A maximum concurrency threshold of (1.25) has been proposed for this arterial in the 2005 Draft Bellingham Comprehensive Plan.
• Ohio Street at Ohio/James Intersection. The location of the intersection combined with high and unregulated traffic volumes from the southbound I-5 interchange and adjacent streets create delay at the intersection which will cause the arterial to operate below Peak Hour LOS E. Signalization of the intersection would create severe congestion on Ohio Street and exacerbate the operation of the King/Ohio intersection.
Status: In 1995, the City Council determined that signalization of the intersection was not a feasible or a desirable form of mitigation for the community. Therefore, Alternative Peak Hour LOS F was adopted for this arterial. A maximum concurrency threshold of (1.25) has been proposed for this arterial in the 2005 Draft Bellingham Comprehensive Plan.
• Northwest Avenue, Elm Street to Interstate-5: Northwest Avenue, like many other arterials streets, has on-street parking. Removal of on-street parking would allow conversion of the street to four travel lanes, much like what was done on Alabama Street. The displacement of the parking would have a negative effect, not only to residents, but to the businesses in the vicinity of Lynn Street. This is another arterial street where Peak Hour LOS E cannot be maintained when considering other non-transportation factors. Northwest Avenue serves as a major entry/exit point to Bellingham and the City cannot control the number of vehicles traveling on this arterial.
Status: In 1995, the City Council determined that removal of on-street parking was not a feasible or a desirable form of mitigation for the community. Therefore, Alternative Peak Hour LOS F was adopted for this arterial. A maximum concurrency threshold of (1.25) has been proposed for this arterial in the 2005 Draft Bellingham Comprehensive Plan.
Highways of Statewide Significance (HSS) The Washington State Department of Transportation (WSDOT) is responsible for setting LOS standards for Highways of Statewide Significance (HSS) and has established LOS D in urban growth areas. However, HSS facilities are exempt from concurrency by state law. HSS facilities within the City are Interstate 5 and SR-539 Guide-Meridian north of Interstate 5.
Highways of Regional Significance (non-HSS) LOS standards for state highways of regional significance (non-HSS highways), are based on the standards adopted by the Regional Transportation Planning Organization (RTPO) in conjunction with WSDOT. WSDOT and Whatcom Council of Governments (WCOG) have established a LOS D standard for state highways of regional significance (non-HSS) in urban growth areas of Whatcom County and LOS C for rural areas of the County.

Annual Concurrency Report April 2006
The Transpo Group | FINAL.Annual.Concurrency.Report.4.27.2006.doc 12
Figure 3. Arterial Street Roadway Functional Classification

Annual Concurrency Report April 2006
The Transpo Group | FINAL.Annual.Concurrency.Report.4.27.2006.doc 13
LOS Evaluation The goal of the LOS evaluation has two primary objectives. One objective is to identify the existing (2006) arterial street corridor LOS deficiencies. The second is to identify arterial street corridors likely to be a problem within the next six years (2006-2012), since GMA defines concurrency based on a maximum of six years. The existing and six-year level of service for City arterials were evaluated using two methods; the Concurrency Evaluation Tracking Tool (CETT) and the Travel Demand Forecast Model (TDFM).
Concurrency Evaluation Tracking Tool (CETT) – 2006 LOS The Concurrency Evaluation Tracking Tool (CETT) is a spreadsheet-based tool which will be used to compare short range traffic volume forecasts with the estimated capacity of the City’s arterial roadways to evaluate transportation concurrency for proposed developments. The CETT provides a calculated LOS for each arterial street segment subject to a transportation concurrency evaluation. This provides a LOS snapshot in time of the City’s arterial street network.
Methods and Limitations The CETT relies on the following input variables to develop short range traffic forecasts:
• Traffic Counts – The CETT uses the most current traffic count data available at the time of this report. The traffic counts available for this effort were limited in location. Approximately 140 count locations (comprising over 430 directional PM peak hour traffic counts) are currently logged into CETT. The age of the traffic count data ranges from to 2004 to the present.
• Roadway Capacities – Roadway capacities are based on the capacities in the City’s travel demand forecasting model, which were developed for long-range planning evaluations, not concurrency approval or denial. City staff are evaluating capacities to be used in the concurrency program.
• Pipeline development traffic estimates – Development project trips will be logged, tracked, and added to the traffic counts on the respective links.
This is the first application of the CETT tool and it is limited to the traffic counts available at the time of this report. Additional traffic count locations, as well as updated traffic counts along heavy use transportation corridors, will be added as part of future efforts to implement the transportation concurrency program.

Annual Concurrency Report April 2006
The Transpo Group | FINAL.Annual.Concurrency.Report.4.27.2006.doc 14
Table 1 summarizes the 2006 existing LOS analysis, based on arterial traffic counts.
Table 1. 2006 Concurrency Evaluation Results Map ID1 Roadway X/O2 Roadway/Jct.
Travel Dir. v/c3
Max v/c Std 4
Meets Std?
1 Bakerview Road (HSS)6 W/O I-5 NB off-ramp WB 1.30 1.00 No 2 Ellis Street N/O Sunset Drive SB 0.92 1.00 Yes 3 Holly Street SE/O Broadway Street NWB 0.91 1.00 Yes 4 I-5 mainline (HSS)6 - between SR 542 & SR 539 NB 0.92 1.00 Yes 5 I-5 NB on-ramp (HSS)6 N/O Sunset Drive NB 0.91 1.00 Yes 6 I-5 SB on-ramp (HSS)6 N/O Sunset Drive NB 0.98 1.00 Yes 7 Lincoln Street (HSS)6 S/O I-5 NB on-ramp NB 1.57 1.00 No 8 Northwest Avenue (HSS)6 S/O I-5 SB off-ramp SB 1.21 1.255 Yes 9 Northwest Avenue (HSS)6 S/O I-5 NB off-ramp SB 1.02 1.00 No 10 Northwest Avenue (HSS)6 S/O I-5 NB off-ramp NB 0.91 1.00 Yes 11 Northwest Avenue (HSS)6 N/O I-5 SB off-ramp NB 0.92 1.00 Yes 12 Northwest Avenue (HSS)6 N/O I-5 SB off-ramp SB 1.00 1.00 Yes 13 Northwest Avenue (HSS)6 N/O I-5 NB off-ramp NB 1.01 1.00 No 14 Old Fairhaven Parkway/SR 118 W/O 32nd Street EB 1.01 1.00 No 15 Old Fairhaven Parkway/SR 118 W/O 32nd Street WB 1.11 1.00 No 16 Old Fairhaven Parkway/SR 11
(HSS)6 W/O I-5 SB on-ramp EB 0.96 1.00 Yes
17 Old Fairhaven Parkway/SR 11 (HSS)6
W/O I-5 SB off-ramp WB 1.09 1.00 No
18 Guide-Meridian/SR 539 (HSS)6 S/O Kelly Road NB 0.98 1.00 Yes 1. Map identification for Figure 4 2. Proximity to adjacent street (i.e. north of = N/O) 3. Volume to Capacity ratio = percent of capacity 4. City’s maximum Volume to Capacity ratio standard. 5. The 2005 Draft Comprehensive Plan proposed maximum concurrency threshold for arterial street section for the
Alternative Peak Hour LOS F. 6. Highways of Statewide Significance (HSS) are by State law exempt from concurrency. 7. Gray shading highlights arterial segments that do not meet adopted LOS standards. 8. City and WSDOT will close 32nd and reconstruct the Interstate 5 southbound off-ramp to add capacity in 2006.
Results 11 locations are estimated to approach the LOS standard and 7 locations are currently estimated to exceed the standard. Most of the locations estimated to approach and exceed the LOS standard are on access routes to/from Interstate 5. There are four main interchange locations along Interstate 5 where these locations occur. Interstate 5 and it’s access ramps are classified as a Highway of Statewide Significance (HSS) for which concurrency cannot be applied. The City will continue to work with State to identify improvements at these locations; however they can not be included in the City’s Transportation Concurrency Management Program. WSDOT will be improving the Interstate the southbound ramps5 at Old Fairhaven Parkway (locations 14-17). The project includes adding turn lanes and signalization. This project is will add capacity and improve the flow of traffic at this location. Construction is anticipated to begin in May 2006.

Annual Concurrency Report April 2006
The Transpo Group | FINAL.Annual.Concurrency.Report.4.27.2006.doc 15
Figure 4. 2006 Traffic Volume Data by Intersection Approach
Annual Concurrency Report April 2006
The Transpo Group | FINAL.Annual.Concurrency.Report.4.27.2006.doc 16
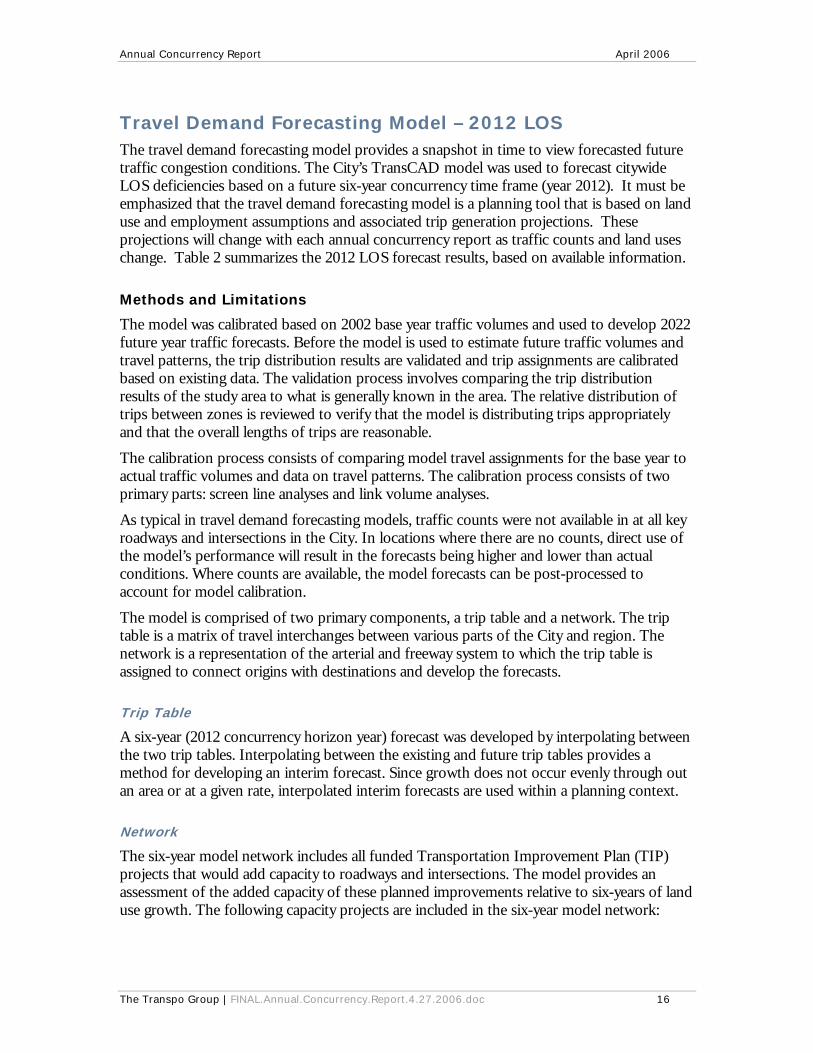
Travel Demand Forecasting Model – 2012 LOS The travel demand forecasting model provides a snapshot in time to view forecasted future traffic congestion conditions. The City’s TransCAD model was used to forecast citywide LOS deficiencies based on a future six-year concurrency time frame (year 2012). It must be emphasized that the travel demand forecasting model is a planning tool that is based on land use and employment assumptions and associated trip generation projections. These projections will change with each annual concurrency report as traffic counts and land uses change. Table 2 summarizes the 2012 LOS forecast results, based on available information.
Methods and Limitations The model was calibrated based on 2002 base year traffic volumes and used to develop 2022 future year traffic forecasts. Before the model is used to estimate future traffic volumes and travel patterns, the trip distribution results are validated and trip assignments are calibrated based on existing data. The validation process involves comparing the trip distribution results of the study area to what is generally known in the area. The relative distribution of trips between zones is reviewed to verify that the model is distributing trips appropriately and that the overall lengths of trips are reasonable.
The calibration process consists of comparing model travel assignments for the base year to actual traffic volumes and data on travel patterns. The calibration process consists of two primary parts: screen line analyses and link volume analyses.
As typical in travel demand forecasting models, traffic counts were not available in at all key roadways and intersections in the City. In locations where there are no counts, direct use of the model’s performance will result in the forecasts being higher and lower than actual conditions. Where counts are available, the model forecasts can be post-processed to account for model calibration.
The model is comprised of two primary components, a trip table and a network. The trip table is a matrix of travel interchanges between various parts of the City and region. The network is a representation of the arterial and freeway system to which the trip table is assigned to connect origins with destinations and develop the forecasts.
Trip Table A six-year (2012 concurrency horizon year) forecast was developed by interpolating between the two trip tables. Interpolating between the existing and future trip tables provides a method for developing an interim forecast. Since growth does not occur evenly through out an area or at a given rate, interpolated interim forecasts are used within a planning context.
Network The six-year model network includes all funded Transportation Improvement Plan (TIP) projects that would add capacity to roadways and intersections. The model provides an assessment of the added capacity of these planned improvements relative to six-years of land use growth. The following capacity projects are included in the six-year model network:

Annual Concurrency Report April 2006
The Transpo Group | FINAL.Annual.Concurrency.Report.4.27.2006.doc 17
• Sunset Drive, Woburn to City Limits • San Juan Boulevard Phase I (Min. standard arterial connection within 6-years. Full
arterial standard with bike lane, street trees, setback sidewalks by 2022.) • West Illinois Street Extension • Bakerview/Irongate Traffic Signal
Table 2 summarizes the 2012 Forecast LOS results.
Table 2. 2012 Concurrency Forecast Results Map ID1 Roadway X/O2 Roadway/Jct.
Travel Dir. v/c3
Max v/c Std 4
Meets Std?
1 Meridian Street S/O Maplewood Avenue SB 1.23 1.255 Yes 2 Northwest Avenue N/O Birchwood Avenue NB 1.17 1.255 Yes
3 Roeder Avenue NW/O F Street SEB 0.91 1.00 Yes
4 Holly Street NW/O Champion Street NWB 0.93 1.00 Yes
5 Dupont Street SE/O Broadway Street NWB 0.94 1.00 Yes
6 Girard Street SE/O Broadway Street NWB/SEB 0.95/0.97 1.00 Yes
7 Ellis Street S/O Squilicum Parkway SB 0.97 1.00 Yes
8 Northwest Avenue N/O I-5 NWB 1.24 1.00 No
9 Sunset Drive E/O Ellis Street EB 0.95 1.00 Yes
10 Orleans Street S/O Barkley Boulevard SB 0.92 1.00 Yes
11 Barkley Boulevard E/O Orleans Street EB 1.24 1.00 No
12 Old Fairhaven Parkway/SR 11 W/O 32nd Street EB/WB 1.00/1.12 1.00 No
13 Yew Street S/O Lakeway Drive SB 0.91 1.00 Yes
14 Lakeway Drive E/O Birch Street EB 1.18 1.00 No 15 Northwest Avenue N/O Bakerview Street NWB 1.06 1.00 No 16 West Bakerview Street W/O I-5 SWB 1.05 1.00 No 17 James Street N/O Woodstock Way SB 0.91 1.00 Yes 18 Hannegan Road N/O Bakerview Street NB/SB 1.16/0.99 1.00 No
19 Mount Baker Highway/SR 542 N/O McLeod NEB 0.98 1.00 Yes 20 Meridian Street N/O Maplewood Avenue NB/SB 1.09/1.04 1.00 No 21 Guide-Meridian/SR 539 (HSS)6 N/O Horton Street NB/SB 1.35/0.98 1.00 No 22 Sunset Drive/SR 542 E/O Orleans Street NEB/SWB 1.14/1.10 1.00 No 23 Sunset Drive/SR 542 W/O McLeod NEB/SWB 1.10/1.00 1.00 No 24 Hannegan Road N/O Sunset Drive/SR 542 NB/SB 1.09/1.18 1.00 No
25 Alabama Street W/O Pacific Street EB 0.94 1.00 Yes
1. Map identification for Figure 5. 2. Proximity to adjacent street (i.e. north of = N/O). 3. Volume to Capacity ratio = percent of capacity (maximum observed forecast on the arterial segment). 4. City’s maximum Volume to Capacity ratio standard. 5. The 2005 Draft Comprehensive Plan proposed maximum concurrency threshold for arterial street section for the
Alternative Peak Hour LOS F. 6. Highways of Statewide Significance (HSS) are by State law exempt from concurrency. 7. Gray shading highlights arterial segments that do not meet adopted LOS standards.
Annual Concurrency Report April 2006
The Transpo Group | FINAL.Annual.Concurrency.Report.4.27.2006.doc 18
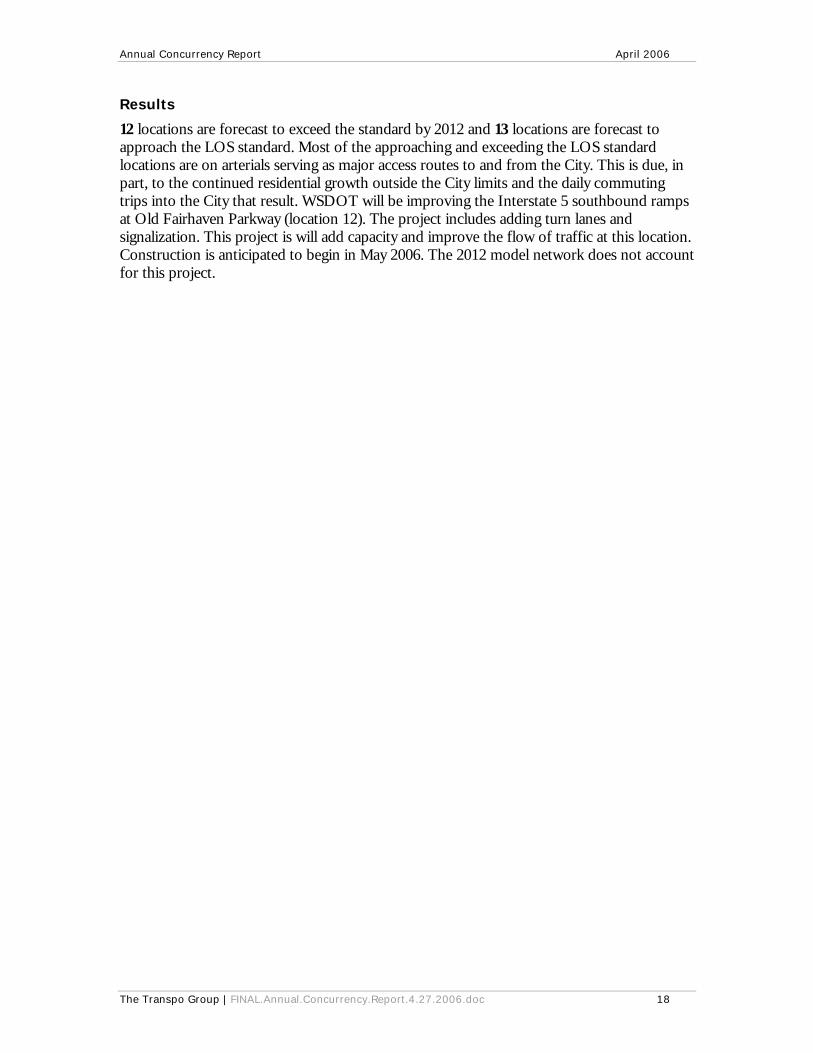
Results 12 locations are forecast to exceed the standard by 2012 and 13 locations are forecast to approach the LOS standard. Most of the approaching and exceeding the LOS standard locations are on arterials serving as major access routes to and from the City. This is due, in part, to the continued residential growth outside the City limits and the daily commuting trips into the City that result. WSDOT will be improving the Interstate 5 southbound ramps at Old Fairhaven Parkway (location 12). The project includes adding turn lanes and signalization. This project is will add capacity and improve the flow of traffic at this location. Construction is anticipated to begin in May 2006. The 2012 model network does not account for this project.

Annual Concurrency Report April 2006
The Transpo Group | FINAL.Annual.Concurrency.Report.4.27.2006.doc 19
Figure 5. 2012 Travel Model Analysis By Link

Annual Concurrency Report April 2006
The Transpo Group | FINAL.Annual.Concurrency.Report.4.27.2006.doc 20
Transportation Concurrency Management Program Proposed Enhancements
Future efforts to update the Annual Concurrency Report will require the following:
• Conducting annual traffic counts on high volume transportation corridors of those approaching or exceeding LOS thresholds
Focusing traffic counts on the City arterial corridors with the highest volume-to-capacity ratios (LOS E – F) will allow City staff to closely monitor remaining arterial capacity available for development proposals. As arterial capacity is diminished, this will become increasingly critical information for development permit application acceptance or denial.
• Tracking annual land use development permit activity through out the City and the forecast impacts on the City’s transportation system
The Concurrency Evaluation Tracking Tool (CETT) will keep track of Temporary Concurrency Certificates issued for land use development that generates 10 or more p.m. peak hour vehicle trips, which is critical for determining how much available capacity remains on arterials. In addition, tracking and reporting preliminary development proposals will provide “pipeline” data for future upgrades to the travel demand forecast model.
• Continued concurrency model development and refinement to include transit, bicycle, and pedestrian transportation modes
Currently, the travel demand forecast model is limited to calculating arterial volume-to-capacity ratios only for vehicle traffic. Staff proposes to create a truly multi-modal travel demand forecast model to account for arterials that have high-frequency transit, sidewalks, and bicycle lanes. This would help to support the infill land use strategy by allowing staff to credit proposals for development along arterials that have the full range of multi-modal transportation facilities in place.
Public Works staff also hopes to develop and provide the following in future reports:
• Transportation corridor “profiles” (for heavy use corridors)
Developing 24-hour “profiles” for heavy use transportation arterial corridors (LOS E and LOS F) will help transportation planning staff and City Council to better understand the range of circumstances, issues, and problems affecting these arterial corridors. A greater understanding of the situation for each corridor will help transportation planning staff and City Council to develop a range of potential mitigation alternatives.

Annual Concurrency Report April 2006
The Transpo Group | FINAL.Annual.Concurrency.Report.4.27.2006.doc 21
• Reporting Whatcom Transportation Authority (WTA) transit efficiency and ridership numbers and issues
The City has gone to great lengths to develop land use and transportation policies that support public transportation bus service in the 2005 Draft Bellingham Comprehensive Plan. The City has also committed to support public transit by proposing the adoption of a Transit LOS standard to protect the average speed on City arterials consistent with the 2004 WTA Strategic Plan. Reporting the successes and challenges experienced by WTA will allow the need for service adjustments and/or City mitigation to be recognized and attended to.
• Transportation network connectivity opportunities and issues for all transportation modes, including vehicle, bicycle, and pedestrian
Future refinement and enhancement of the travel demand forecast model may allow it to be used directly or indirectly for “connectivity analysis” to explore the potential cost/benefit of connecting existing dead-end streets. As infill development continues to occur, it will become increasingly difficult, disruptive, and expensive to add capacity to arterials through physical widening or the addition of turn lanes. Connecting currently un-connected streets could result in better traffic circulation and relief of regional traffic congestion. Analyzing and modeling the costs and benefits of connecting streets may create lower cost mitigation alternatives to relieve traffic congestion.
• Traffic Calming and Neighborhood Traffic Safety Program Measures
It is anticipated that as traffic volume and congestion increases on some arterial streets, there will be a need to address associated transportation impacts on some local residential streets. Future annual reports may be able to profile problems identified and successful traffic calming measures taken through the Neighborhood Traffic Safety Program, as well as emerging traffic calming issues and opportunities.
• Updated “Individualized Marketing” data documenting the travel behavior of Bellingham transportation network users
In 2004, the City of Bellingham was selected as one of four cities in the U.S. for a Federal Transit Authority (FTA) pilot study of travel behavior. A patented technique called “Individualized Marketing” was used by Social Data USA to gather data and work to successfully affect travel choices. The data provided by this study established baseline travel behavior conditions, which has helped City, WTA, and WCOG staff gain a better understanding of the current travel behavior of Bellingham residents and transportation network users. The City of Bellingham, Whatcom County, and WTA are now helping to fund a WCOG program called “Whatcom Smart Trips” to continue the “Individualized Marketing” approach. This data will help the City, WTA, and WCOG to better understand the users of the City and regional transportation network.
• Report on City Commute Trip Reduction (CTR) Efforts
Future annual reports may be able to provide a profile of measures taken through the City of Bellingham’s Commute Trip Reduction (CTR) program. Successful efforts as well as unrealized opportunities for further reduction of trips between work and home could help to monitor and track the City’s progress.