
City of Austin Flood Early Warning System (FEWS) Susan ...c.ymcdn.com/sites/ · PDF fileCity...
62
City of Austin City of Austin Flood Early Warning Flood Early Warning System (FEWS) System (FEWS) Susan Janek, P.E. Susan Janek, P.E. April 2009 April 2009
Transcript of City of Austin Flood Early Warning System (FEWS) Susan ...c.ymcdn.com/sites/ · PDF fileCity...

City of Austin City of Austin Flood Early Warning Flood Early Warning
System (FEWS) System (FEWS) Susan Janek, P.E.Susan Janek, P.E.
April 2009 April 2009
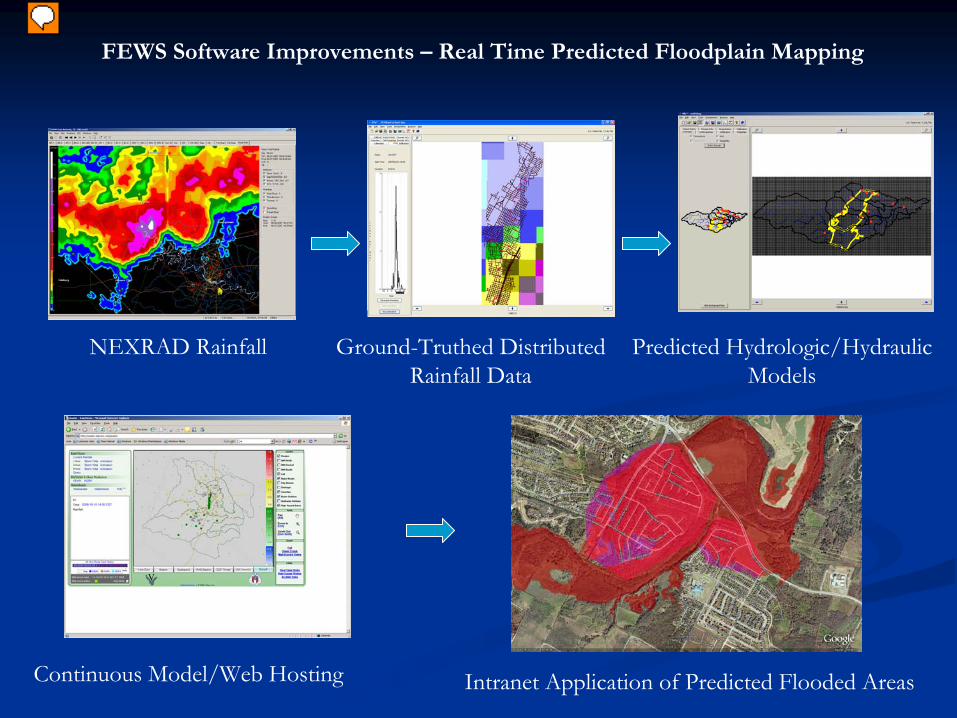
FEWS Software Improvements –
Real Time Predicted Floodplain Mapping
NEXRAD Rainfall Ground-Truthed
Distributed Rainfall Data
Predicted Hydrologic/Hydraulic Models
Continuous Model/Web Hosting Intranet Application of Predicted Flooded Areas
Presenter
Presentation Notes
Today I wanted to talk with you a little bit about the City’s Flood Warning Program, how we got started, who we are, and how we interact with first responders during flood emergencies or severe storm events. Because I want to talk about the importance of our relationship with emergency management officials, I think that it is important to talk about how we think that we can best communicate with them through maps and instructions. So as you can see on this slide above I want to practically get across today is how we take rainfall, and convert it into a predictive and meaningful map to give to first responders.

Presenter
Presentation Notes
First we need to talk about why the Flood Warning Program exists in Austin. To quote Mr. Raymond Slade in his paper, “The meteorological characteristics of Central Texas, along with an orographic influence caused by the Balcones Escarpment, produce conditions that cause large rainstorms in the area. Many of the highest rainfall intensities occurred in Central Texas, a 1921 storm in Thrall, Texas, for example, produced 32 inches of rain in 12 hours, and a 1935 storm near D'Hanis, Texas, produced 22 inches of rain in 2 hours 45 minutes.”

Large Rainstorms along the Balcones Escarpment in Central Texas p.15-19 by Raymond Slade
Presenter
Presentation Notes
Here is a picture of large rainstorms that have occurred along the Balcones Escarpment, and there are better equipped folks here than I are to talk about the why’s of very intense rainfall in thte Austin area. But I like to point out the hyetograph lines in the Austin area.

Presenter
Presentation Notes
I hope to not see a storm of 19 inches in a day in Austin, Texas while I work for the City, but --

Presenter
Presentation Notes
But if you look at this storm total precipitation map produced from GR Level3 of the Burnet County storm that occurred in 2007, it doesn’t seem too far out of the ordinary that this storm could be sitting right on top of the central small urban areas of Austin. Later, I will talk more about how we modeled this storm over several of our watersheds and what the results were.

Major Austin Major Austin FloodsFloods
20012001
WQ monitoringWQ monitoringMid 1970Mid 1970’’ss
Watershed Protection HistoryWatershed Protection History
Drainage FeeDrainage Fee
CWOCWO
Utility establishedUtility established
ECMECM
SOSSOS
UWOUWO
Unified DepartmentUnified Department
183218331836184318521869187019001913191519211932193519361938
1961 1975 1991 1960 1974 1981 1998
1915 - Sabine Street near Waller Creek
DCMDCM
Presenter
Presentation Notes
To tell you just a little bit about ourselves in terms of a department, it was within the mid 1970’s that the City began the drainage criteria manual. It wasn’t until after the devestating Memorial Day Storm in 1981 where 13 people died (some in their homes) that the Flood Warning System really got started. In addition, much more stringent regulations with respect to design standards and detention requirements for increases in flowrates due to development were developed after this storm. Following more stringent regulations on water quantity began the programs of water quality – bringing about the Comprehensive Watershed Ordinance and the SOS. Austin regulates its drainage structure as a utility. The Drainage Utility Fund receives 89% of its $15.3 million approved revenue from Drainage Fees; 7% from Development and other fees; and 4% from Interest Income. Requirements: The City’s Flood Warning System is paid from from this fund. In 2001, the Watershed Protection and Development Review Department was formed. It has consolidated all activities associated with storm drainage. The Flood Warning System resides in the Watershed Protection and Development Review Department.

Creek Flooding Poses a Recurring Risk Creek Flooding Poses a Recurring Risk to Public Safety and Propertyto Public Safety and Property
Williamson Creek
• 7000-8000 homes and businesses are in the 100-year floodplain
• Road crossings are a danger to motorists
Harris Branch
Presenter
Presentation Notes
Within Austin and even with the new flood insurance rate maps, adopted late last year, there are over 700 structures within the 100 year floodplain. We have approximately 200 roadways that close in a 5 year storm or greater, and several hundred more roadways that will flood in a 100 year storm.

Creek Flooding Poses a Recurring Risk Creek Flooding Poses a Recurring Risk to Public Safety and Propertyto Public Safety and Property
A 2-year storm creates structure flooding in 14 of the 17 Phase I watersheds
OnionCreek
19981997
Slaughter Creek
Walnut Creek
Presenter
Presentation Notes
A 2 year storm also creates some structural flooding in some of our watersheds. As a result of this, the City has aggressively worked with state and federal agencies to secure funding for buyouts of many of these properties. Although we still have many properties that are considered to be repetitive loss properties.

In the mid 1980s, the Flood Early In the mid 1980s, the Flood Early Warning System (or FEWS) was Warning System (or FEWS) was
established. established.
Presenter
Presentation Notes
So in the mid-1980s the Flood Early Warning System (or FEWS) was established. You may hear me say the word “FEWS” several times today, because that is a pretty easy acronym to remember.

FEWS System ComponentsFEWS System Components
90 rain gauges (0.04 inch tipping buckets)90 rain gauges (0.04 inch tipping buckets)
45 stream level sensors (45 stream level sensors (PTsPTs
and ultraand ultra--sonic sonic
gauges) gauges)
Float switches at low water crossingsFloat switches at low water crossings
BarricadesBarricades
High Hazard Dam Monitoring (PLC Controllers High Hazard Dam Monitoring (PLC Controllers on MODBUS)on MODBUS)
FEWS SYSTEM UTILIZES BOTH ALERT FEWS SYSTEM UTILIZES BOTH ALERT AND MODBUS PROTOCOLS AND MODBUS PROTOCOLS
Presenter
Presentation Notes
Our City of Austin field components consist of 90 rain gauges (0.04 tipping buckets) – we are considered with larger quantities of rainfall -- however, there are other areas within the City that also utilize rainfall measurements. These include the wastewater inflow and infiltration program located in Austin Water Utility and the Environmental Resource Management Division located within WPDRD – these folks measure water quality parameters. We also have 45 stream level sensors – primarily pressure transducers, but we do have some ultra-sonic gauges. We have float switches at some of our low water crossings, and we also have some barricades (similar to railroad crossings). We also measure several of the High Hazard Dams – particularly those that have a less than a 25 year storm hydraulic capacity. Our system operates using solar power on an FCC low frequency radio channel.

VHF
ALER
T Pr
otoc
ol 3
00 b
aud
VHF
ALERT Protocol 300 baud
VHF
ALER
T Pr
otoc
ol 30
0 ba
ud
Presenter
Presentation Notes
This is what our older RF system looks like. We are in the process of transitioning between ALERT (automated local evaluation in real-time) to MODBUS due to the fact that in some equipment we like to have more secure communication and in some instances we need to be sure that we can transmit as well as receive data. At this time, all of our ALERT rain and stream level data is transferred via SHEFA format to the National Weather Service for their use. In fact, our FCC licenses are underwritten by the NWS. Our gauge components transmit on one frequency to a single repeater which then transmits on a second frequency to our base stations. One of the challenges we are faced with in Austin is how to best grow our gauge network and maintain good communications. We will probably look a multiple repeaters or a “nodal system” approach in the future.
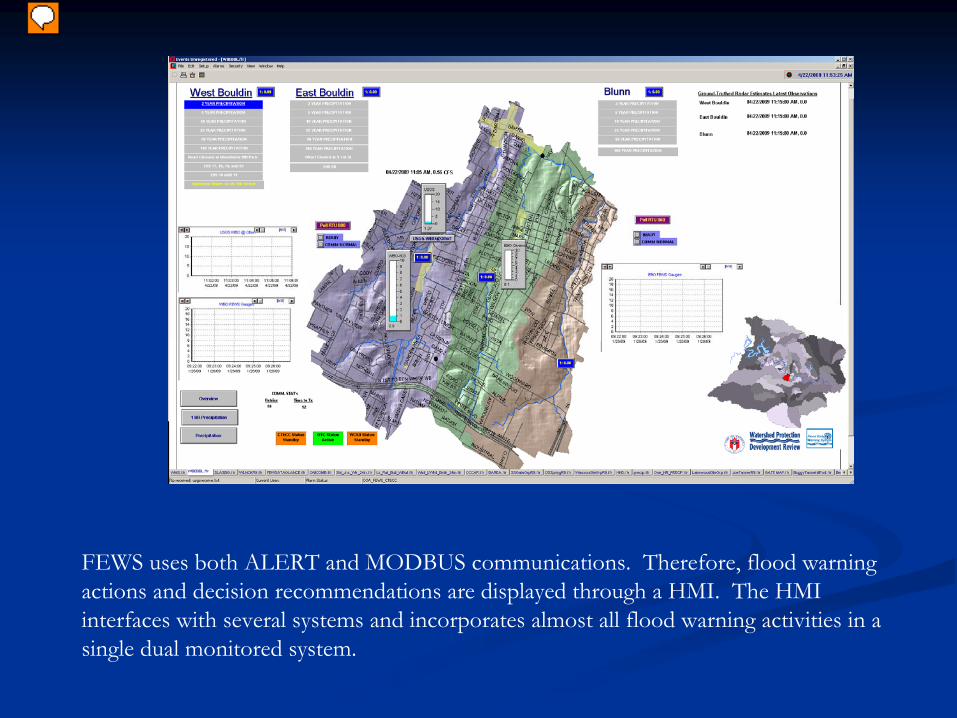
FEWS uses both ALERT and MODBUS communications. Therefore, flood warning actions and decision recommendations are displayed through a HMI. The HMI interfaces with several systems and incorporates almost all flood warning activities in a single dual monitored system.
Presenter
Presentation Notes
Our data comes in and is displayed on a SCADA HMI that was designed to interface both with ALERT data as well as MODBUS data. One very nice feature of this particular HMI is that it was configured by the FEWS personnel and not by an outside vendor. The goal of this system is to consolidate as many flood warning related activities as possible. This includes items such as road closures, links to other internet sites, virtual alarms, and system alarms.

RT
RT USGS Real-TimeData
MySQLDatabase
Proposed FEWS Architecture
Radio Decoder/Controller
EVENTS
Gauge Network
National WeatherService
Hydstra Database
RainVieux (Password protected
internet site)
Vieux Associates, Inc.
KISTERSDatabase
WISKI
RT
RT
RT
RT
HIST
HIST
RT
HIST
RT
RT
RT
RT
RT
USERS
USERS
USERS
HIST
Time-series hydrologic data will be transferred to KISTERS.
System data (gate arms, batteries, etc) will continue to be
stored in MySQL (See Attachment A & B)
COA Website contains real-time data from the FTP site and
aggregated rainfall and stage data from KISTERS
COA “get & push” script pulls USGS data to put on the FTP site and the
FEWS Website.
VAI uses rainfall data from the FTP site to ground-truth radar data for their RainVieux
website, which is used by FEWS. Real-time RainVieux data is pulled from the FTP site into EVENTS for immediate use. Archived rainfall
data from RainVieux is then imported to KISTERS once a month.
FEWS staff uses EVENTS to view real-time rainfall and stage data and to remotely operate
FEWS infrastructure.
FEWS staff will utilize WISKI to interface with the KISTERS database. WISKI applications will allow staff to
analyze and manipulate data.
RT
City of Austin FTP Site
Vflo ouput will be used to create near real-time inundation maps
IT ALL STARTS WITH RAIN!
Data:• rainfall• stage• gate arm operations• sensor data• system activity• defined sensors
Data:• rainfall• stage• USGS• archived rainfall data from COA gauges, Vieux, and USGS (Hydrstra)
Data:• RT USGS• Rain.txt• VFlo.txt• SHEF.A
FEWS Staff
USERS
FEWS Staff
General Public
Data:• RT rainfall• RT stage• RT USGS
RT
Gate Arms
Alert and ModbusTelemetry Network
USGS Real-TimeData
Rain.txt15 min
Basin Avg’dRainfall
USGS Real-TimeData
VFlo.txt
Rainfall & Stage DataSHEF.A
SHEF.A
SHEF.A
VFlo.txt
VFlo.txt
Rain.txt15 min
Basin Avg’dRainfall
MySQL DB File
FEWS Website
RT
delivered monthly
by mail
VFlo Predictive Model
DopplerRadar
RT
15 min
FEWS Staff
RT15 min
VAI operates both VFlo and RainVieux
15 min
15 m
in1 m
in
1 min
5 min
5 min
5 min
15 min
15 min
5 min
5 min
5 m
in
upon
eve
nt
COA Intranet
FEWS Staff
USERS
upon event
upon even
t
LEGEND
RT
HIST
XX min
(Near) Real Time Data TransmissionHistorical Data Transmission
Frequency of Data Transmission
Presenter
Presentation Notes
This is a description of our flood warning system. Admittedly it is a little busy, but what I wanted to tell you is that the flood warning system consists of reading and analyzing information was several different sources. It is also obligated to inform outside sources (outside of the City of Austin).
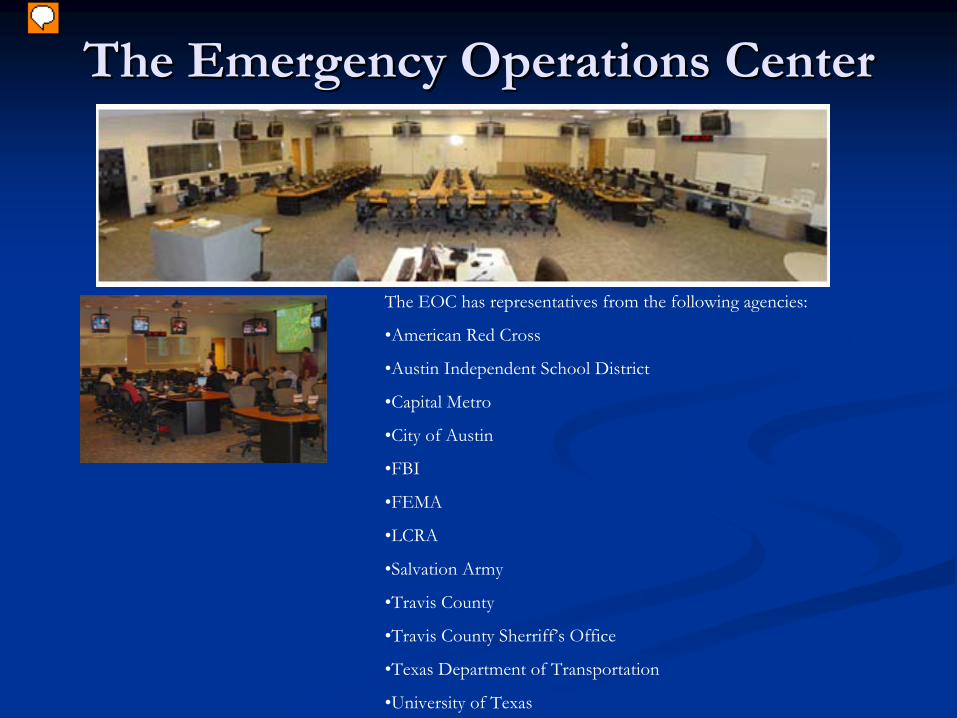
The Emergency Operations Center The Emergency Operations Center
The EOC has representatives from the following agencies:
•American Red Cross
•Austin Independent School District
•Capital Metro
•City of Austin
•FBI
•FEMA
•LCRA
•Salvation Army
•Travis County
•Travis County Sherriff’s Office
•Texas Department of Transportation
•University of Texas
Presenter
Presentation Notes
I wanted to talk some about the EOC. The EOC in Austin is combined with Travis County and it maintains space in it for the agencies listed above. It is located in a secure environment, and I am told that it can withstand an F1 tormado.

City of Austin Representatives City of Austin Representatives include: include:
Austin EnergyAustin Energy
Austin Fire DepartmentAustin Fire Department
Austin Police DepartmentAustin Police Department
AustinAustin--Travis County Emergency Medical ServicesTravis County Emergency Medical Services
Austin/Travis County Health and Human ServicesAustin/Travis County Health and Human Services
Austin Water UtilityAustin Water Utility
Office of Emergency ManagementOffice of Emergency Management
Parks and Recreation DepartmentParks and Recreation Department
Public Information OfficePublic Information Office
Solid Waste ServicesSolid Waste Services
Street and Bridge DivisionStreet and Bridge Division
Watershed Protection and Development Review Watershed Protection and Development Review
Presenter
Presentation Notes
City of Austin representatives are listed above. As you can see, all first responders are included as well as representatives from all of the departments. At the very bottom, you will see the report of the WPDRD,

Watershed Protection and Watershed Protection and Development Review Development Review ––
FEWS FEWS
FEWS has staff located both in WPDRD FEWS has staff located both in WPDRD ––
Watershed Watershed Engineering Division and CTMEngineering Division and CTM--
Wireless Services Division (5.5 Wireless Services Division (5.5
FTEs are dedicated to the program) FTEs are dedicated to the program)
For smaller storms (less than a 2 year event), roads will close For smaller storms (less than a 2 year event), roads will close in in Austin. FEWS personnel also have direct communication with Austin. FEWS personnel also have direct communication with WPDRD Field Operations crews for barricade placement and WPDRD Field Operations crews for barricade placement and for remote monitoring if necessary. for remote monitoring if necessary.
FEWS personnel consist of civil engineers, radioFEWS personnel consist of civil engineers, radio--electronic electronic technicians, and a computer network administrator. technicians, and a computer network administrator.
FEWS operates in conjunction with the Public Safety and FEWS operates in conjunction with the Public Safety and Department of Homeland Security Office and is a member of Department of Homeland Security Office and is a member of the Plans Group. the Plans Group.
FEWS has permanent system components and desk location FEWS has permanent system components and desk location within the EOC.within the EOC.
Presenter
Presentation Notes
The FEWS staff is located both within WPDRD and within the Radio Shop. The program has 5.5 FTEs dedicated to it. Because in smaller storms we find that we have to close roads and low water crossings, we also work directly with representatives from Field Operations. They are the barricade crews. We consist of civil engineers, radio-electronic technicians and a computer network administator. We operate in conjunction with OEM and we have permanent system components and a desk location within the EOC.

NovaStar
4XWeb/RadarEVENTS Dual
Monitor/WebTraffic
Cameras
3 New Workstations
CTECC EOC Improvements
Presenter
Presentation Notes
We are the only organization – outside of the HAM Radio operators who have a dedicated space and workstations at the EOC. This represents one of our base stations, and because the EOC has a building wide UPS, this serves as our primary location for operations. ‘ However, with more recent improvements, we are now able to utilize our office location for setup as a mirrored location – allowing a savings to the EOC so that it is not activated unless for major events.
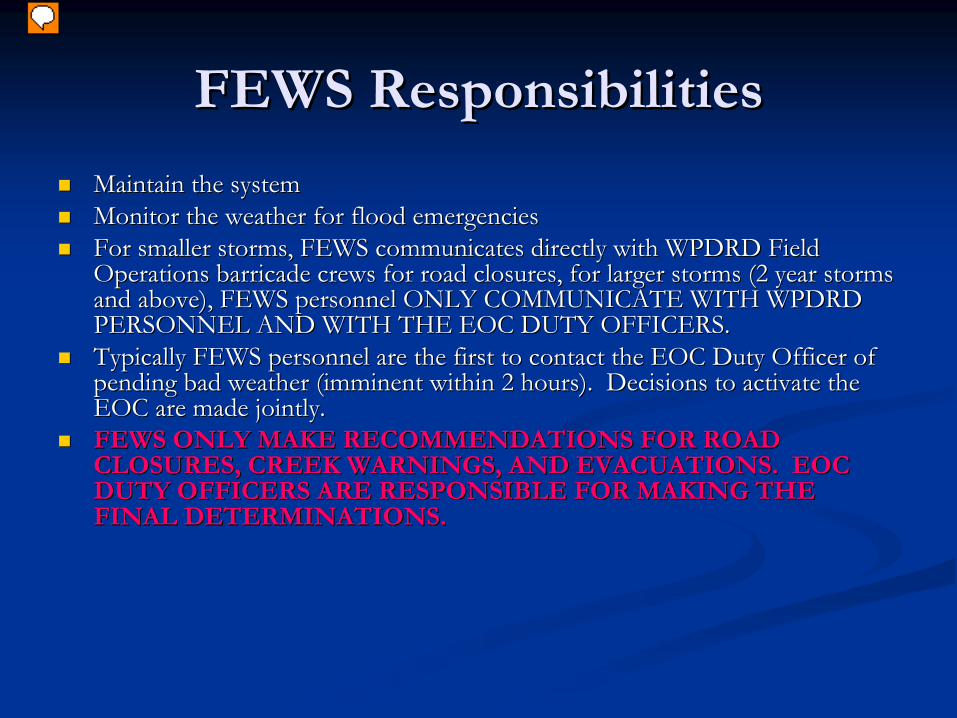
FEWS ResponsibilitiesFEWS Responsibilities
Maintain the systemMaintain the system
Monitor the weather for flood emergenciesMonitor the weather for flood emergencies
For smaller storms, FEWS communicates directly with WPDRD Field For smaller storms, FEWS communicates directly with WPDRD Field Operations barricade crews for road closures, for larger storms Operations barricade crews for road closures, for larger storms (2 year storms (2 year storms and above), FEWS personnel ONLY COMMUNICATE WITH WPDRD and above), FEWS personnel ONLY COMMUNICATE WITH WPDRD PERSONNEL AND WITH THE EOC DUTY OFFICERS. PERSONNEL AND WITH THE EOC DUTY OFFICERS.
Typically FEWS personnel are the first to contact the EOC Duty OTypically FEWS personnel are the first to contact the EOC Duty Officer of fficer of pending bad weather (imminent within 2 hours). Decisions to actpending bad weather (imminent within 2 hours). Decisions to activate the ivate the EOC are made jointly. EOC are made jointly.
FEWS ONLY MAKE RECOMMENDATIONS FOR ROAD FEWS ONLY MAKE RECOMMENDATIONS FOR ROAD CLOSURES, CREEK WARNINGS, AND EVACUATIONS. EOC CLOSURES, CREEK WARNINGS, AND EVACUATIONS. EOC DUTY OFFICERS ARE RESPONSIBLE FOR MAKING THE DUTY OFFICERS ARE RESPONSIBLE FOR MAKING THE FINAL DETERMINATIONS. FINAL DETERMINATIONS.
Presenter
Presentation Notes
Our responsibilities are to maintain the system, monitor the weather for flood emergencies, work with field operations for closure during smaller storms and communicate with the EOC representative known as the Duty Office. It is very important to note that outside of the Watershed barricade group within Field Operations, FEWS can only inform the Duty Officer or road closings OR make recommendations for closure. Because we have such good forecasting information provided to us by the National Weather Service and others, we will be able to carefully watch the weather for storms. Typically, for flood related emergencies, the FEWS is the first to contact the Duty Officer – and discussions start on an informal level. However, outside of gauge known road closures, FEWS will only make recommendations to the EOC Duty Officer for action. There is no communication with first responders.

FEWS Communications FEWS Communications
Because FEWS personnel communicate with the Because FEWS personnel communicate with the Duty Officer who must then communicate with Duty Officer who must then communicate with first responders (Police, Fire, EMS, etc.), it is first responders (Police, Fire, EMS, etc.), it is important that FEWS uses the best information important that FEWS uses the best information available. available.
Have to know Have to know extent of floodingextent of flooding, , time of time of floodingflooding,,
and potential impactsand potential impacts
(street closures, (street closures,
homes inundated, school routes closed, etc.) homes inundated, school routes closed, etc.)
Presenter
Presentation Notes
Because FEWS personnel only communication with the Duty Officer – who must then communicate with the first responders – it is imperative that we use the best information available. It is important for us to know the estimated extent of flooding, the time the flooding is likely to occur as well as the potential impacts. Will creeks be out of banks, will schools have access, will there be homes flooded. Also, it is equally important to have a reasonably clear idea as to when the floods will recede from property – when roads can be opened, etc.

Emergency Notification System Emergency Notification System
CAPCOG ENS Maps CAPCOG ENS Maps ----
automated phone system automated phone system that provides emergency messages to areas identified that provides emergency messages to areas identified in an identified polygon. in an identified polygon.
Presenter
Presentation Notes
So because of this reason, we find it extremely benificial to have maps. We have many maps within our program. This is one example of that. For instance, we have an Emergency Notification System. This system is a reverse call-out system located at the 911 call center. Depending on the scenario, this system can be automatically activated based on the number of the polygon. These maps exist in many different formats – including by paper if there is need to work within that environment.

Gauge Height Maps Gauge Height Maps
FEWS keeps gauge height maps that are tied to USGS gauges and to FEWS gauges. THIS CAN TELL US WHAT THE FLOODPLAIN IS AT THE PRESENT. In the case of AHPS, the maps can be identified with the NOAA GCRFC provides a forecast.
Presenter
Presentation Notes
Other maps available include gauge height maps. Should a prediction be made on an important forecast point – for this instance – the USGS gage that is located at Onion Creek at US Highway 183. Because this information goes out on NOAA All Hazards – it is important to have this information available to give to first responders so that they have an understanding of what that physically means on the ground. All of these maps are integrated within the FEWS HMI. As these readings or forecasts are made, then this information becomes active within the HMI.
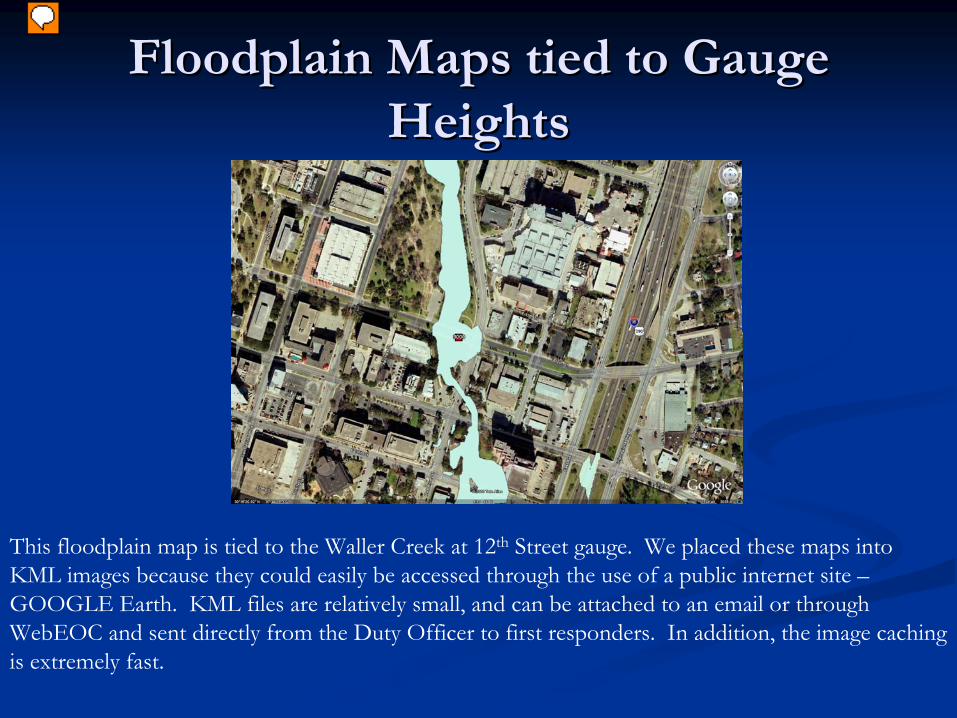
Floodplain Maps tied to Gauge Floodplain Maps tied to Gauge Heights Heights
This floodplain map is tied to the Waller Creek at 12th
Street gauge. We placed these maps into KML images because they could easily be accessed through the use
of a public internet site –
GOOGLE Earth. KML files are relatively small, and can be attached to an email or through WebEOC
and sent directly from the Duty Officer to first responders. In addition, the image caching is extremely fast.
Presenter
Presentation Notes
Other available maps are tied to gauge heights. Should a height on a gauge be reached – or forecasted, these maps are available to help demonstrate the extent and impact of flooding. In the case above, we also showed you a Google Earth image. One reason for this is to discuss the fact that we work in the WebEOC environment – which allows for the electronic transfer of files. The KML image file allows us to transfer map images to the Duty Officer so that they can easily and quickly be evaluated by first responders. There is a library of these files electronically available as well as paper maps.

FEWS Software Improvements –
Real Time Predicted Floodplain Mapping
NEXRAD Rainfall Ground-Truthed
Distributed Rainfall Data
Predicted Hydrologic/Hydraulic Models
Continuous Model/Web Hosting Intranet Application of Predicted Flooded Areas
Presenter
Presentation Notes
Today I wanted to talk with you a little bit about the City’s Flood Warning Program, how we got started, who we are, and how we interact with first responders during flood emergencies or severe storm events. Because I want to talk about the importance of our relationship with emergency management officials, I think that it is important to talk about how we think that we can best communicate with them through maps and instructions. So as you can see on this slide above I want to practically get across today is how we take rainfall, and convert it into a predictive and meaningful map to give to first responders.

RT
RT USGS Real-TimeData
MySQLDatabase
Proposed FEWS Architecture
Radio Decoder/Controller
EVENTS
Gauge Network
National WeatherService
Hydstra Database
RainVieux (Password protected
internet site)
Vieux Associates, Inc.
KISTERSDatabase
WISKI
RT
RT
RT
RT
HIST
HIST
RT
HIST
RT
RT
RT
RT
RT
USERS
USERS
USERS
HIST
Time-series hydrologic data will be transferred to KISTERS.
System data (gate arms, batteries, etc) will continue to be
stored in MySQL (See Attachment A & B)
COA Website contains real-time data from the FTP site and
aggregated rainfall and stage data from KISTERS
COA “get & push” script pulls USGS data to put on the FTP site and the
FEWS Website.
VAI uses rainfall data from the FTP site to ground-truth radar data for their RainVieux
website, which is used by FEWS. Real-time RainVieux data is pulled from the FTP site into EVENTS for immediate use. Archived rainfall
data from RainVieux is then imported to KISTERS once a month.
FEWS staff uses EVENTS to view real-time rainfall and stage data and to remotely operate
FEWS infrastructure.
FEWS staff will utilize WISKI to interface with the KISTERS database. WISKI applications will allow staff to
analyze and manipulate data.
RT
City of Austin FTP Site
Vflo ouput will be used to create near real-time inundation maps
IT ALL STARTS WITH RAIN!
Data:• rainfall• stage• gate arm operations• sensor data• system activity• defined sensors
Data:• rainfall• stage• USGS• archived rainfall data from COA gauges, Vieux, and USGS (Hydrstra)
Data:• RT USGS• Rain.txt• VFlo.txt• SHEF.A
FEWS Staff
USERS
FEWS Staff
General Public
Data:• RT rainfall• RT stage• RT USGS
RT
Gate Arms
Alert and ModbusTelemetry Network
USGS Real-TimeData
Rain.txt15 min
Basin Avg’dRainfall
USGS Real-TimeData
VFlo.txt
Rainfall & Stage DataSHEF.A
SHEF.A
SHEF.A
VFlo.txt
VFlo.txt
Rain.txt15 min
Basin Avg’dRainfall
MySQL DB File
FEWS Website
RT
delivered monthly
by mail
VFlo Predictive Model
DopplerRadar
RT
15 min
FEWS Staff
RT15 min
VAI operates both VFlo and RainVieux
15 min
15 m
in1 m
in
1 min
5 min
5 min
5 min
15 min
15 min
5 min
5 min
5 m
in
upon
eve
nt
COA Intranet
FEWS Staff
USERS
upon event
upon even
t
LEGEND
RT
HIST
XX min
(Near) Real Time Data TransmissionHistorical Data Transmission
Frequency of Data Transmission
Presenter
Presentation Notes
This next portion of this presentation is discuss what we use to take us from rainfall to predictions to informational maps in real-time. We found that it wasn’t enough to just have a good idea of what the particular design storm impacts would be on a watershed – because we know that rainfall doesn’t happen in a Type III SCS 24 hour distribution uniformly over a watershed. So I wanted to focus on two aspects of communication within this diagram. The one of the right is obtaining the distributed ground-truthed radar rainfall, and the one on the left is taking this information and turning into informational maps every time new rainfall data is made available.

Predicted Mapping Predicted Mapping
Uses several toolsUses several tools
RainvieuxRainvieux
and VFLOand VFLO
FEMA Regulatory RAS ModelsFEMA Regulatory RAS Models
City of Austin Terrain Data SetsCity of Austin Terrain Data Sets
ESRI ESRI ArcServerArcServer
Presenter
Presentation Notes
So to perform predictive mapping, we use the tools listed above– Rainvieux and VFLO – these are specific tools provided by Vieux and Associates. Our FEMA Regulatory Models – because Austin had geo-spatial models built, we utilized that characteristic to build the predicted water surface elevations The City of Austin Terrain data sets – the City has excellent topographic information available – ESRI ArcServer applications – this is a power web interface that the City owns a license for so that we can continually display maps.

RainvieuxRainvieux
and VFLO and VFLO
FEWS uses FEWS uses RainvieuxRainvieux
for groundfor ground--truthedtruthed
radar. radar.
Radar is adjusted using ground gauge Radar is adjusted using ground gauge information and is then information and is then ““rere--aggregatedaggregated””
into into
square kilometer square kilometer ““virtualvirtual””
rain gauges. This rain gauges. This information is updated every 15 minutes. information is updated every 15 minutes.
Presenter
Presentation Notes
Rainvieux takes the gage data from the FEWS gauges and other sources.

City of Austin City of Austin RainvieuxRainvieux
•Password protected internet site –
hosted in Norman, Oklahoma.
•This screen shot shows a storm total amount of precipitation received from a recent rainfall.
•Each square kilometer pixel has a 15 minute hyetograph associated with it.
Presenter
Presentation Notes
We utilize a password protected internet site. This is a sample of a storm total amount from a recent storm event. Each square kilometer pixel has a 15 minute hyetograph that is associated with it. So for each watershed, broken down into square kilometers, there is a distributed rainfall hyetograph available.

Other Features of Other Features of RainvieuxRainvieux
Basin averaged rainfall information over timeBasin averaged rainfall information over time
Threat of flooding based on depth Threat of flooding based on depth ––duration duration analysis for each watershedanalysis for each watershed
Street map availableStreet map available
HistorianHistorian
AnimatorAnimator
Model link Model link
Presenter
Presentation Notes
Other features include

Rainvieux
provides a historical tool that can indicate basin averaged rainfall over a watershed.
Using the time of concentration for the watershed and Depth-
Duration_Frequency
curves, a “threat”
for the watershed can be determined.
This information is utilized within the FEWS HMI alongside ground-gauge information. This helps makes the determination between 15 minute scans on the threat of the storm.

Green triangles represent rain gauges. This program utilizes COA FEWS, LCRA, USGS information, and Brushy Creek WCID gauge information.

Feature tab for Rainvieux
–
Note the “Runoff”
Tab

The Runoff Tab runs a model (developed by Vieux and Associates, Inc) called “VFLO”. These models, developed by FEWS for FEWS utilize the distributed rainfall as inputs to create the predicted hydrograph at each of
the watchpoints
named above. Please note that this list includes information for Onion, Shoal, Walnut, and Waller.

Gauge ID (note USGS ID)
Predicted At
Preset Heights Indicates if threshold is met

By clicking onto each line within the table, stage and flow hydrographs are displayed. The blue line represents the current time, the black line is the simulation, and the red line represents the observed value.
Observed values generally come from USGS gauges.


Taking VFLO Model Results and Taking VFLO Model Results and Creating the Floodplain Maps Creating the Floodplain Maps
Each VFLO output file indicates the date and Each VFLO output file indicates the date and time of MAXIMUM stage and flow. time of MAXIMUM stage and flow.

RAS Models RAS Models
The City of Austin recently adopted the new The City of Austin recently adopted the new FEMA maps. Many of these were geoFEMA maps. Many of these were geo--spatially spatially referenced. referenced.

RAS Model RAS Model
The geoThe geo--spatial RAS models contain an attribute table for the spatial RAS models contain an attribute table for the crosscross--sections and a Profile Summary Table.sections and a Profile Summary Table.
Note the minimum channel elevation.
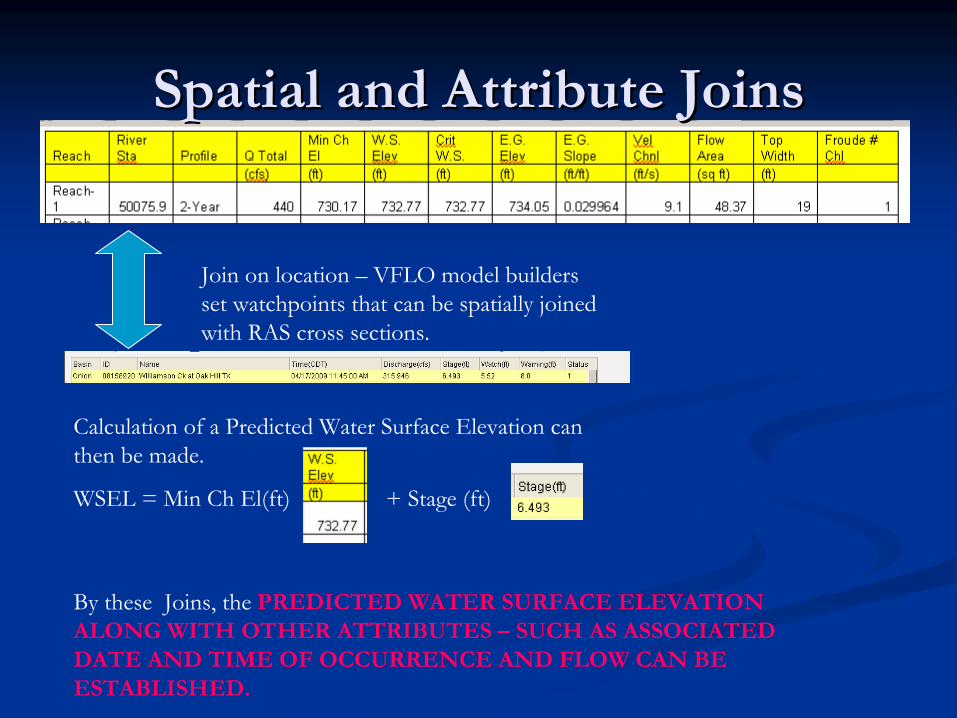
Spatial and Attribute Joins Spatial and Attribute Joins
Join on location –
VFLO model builders set watchpoints
that can be spatially joined with RAS cross sections.
Calculation of a Predicted Water Surface Elevation can then be made.
WSEL = Min Ch El(ft) + Stage (ft)
By these Joins, the PREDICTED WATER SURFACE ELEVATION ALONG WITH OTHER ATTRIBUTES –
SUCH AS ASSOCIATED DATE AND TIME OF OCCURRENCE AND FLOW CAN BE ESTABLISHED.
800 1000 1200 1400 1600 1800702
704
706
708
710
712
714
716
Shoal Creek Plan: FIS Cross Section
Station (ft)
Elev
atio
n (ft
)Legend
Ground
Ineff
Bank Sta
.08 .04 .05 .08
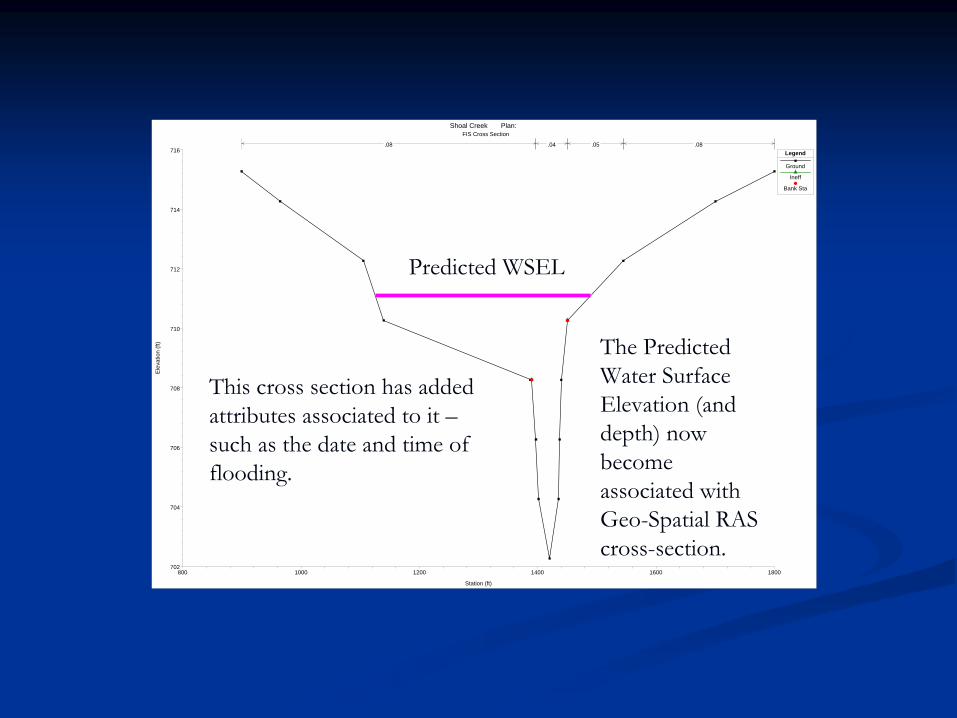
The Predicted Water Surface Elevation (and depth) now become associated with Geo-Spatial RAS cross-section.
Predicted WSEL
This cross section has added attributes associated to it –
such as the date and time of flooding.

39905.6139880.03
39837.22
39820.57
39746.89
39681.3739639.37
39570.49
39285.56
39251.83
39211.8339088.51
38986.0338879.0138767.98
38719.738685.56
38586.60
38502.2638294.67
38018.3137935.19
37780.60
37685.0237591.89
37490.30
37406.11
37360.00
37265.1137149.23
37003.2136903.36
36761.96
RIVER
-1
Some schematic data outside default extents (see View/Set Schematic Plot Extents...)
VFLO Locations “Joined”
to RAS Cross Sections
WSELs
for the other cross sections are determined through Linear Interpolation.

387638502.2638018.3137490.3037265.1136903.36
36409.0236190.6235888.0735502.1535078.04
34776.0234545.30
33911.7033513.5633226.96
32734.5632116.06 31639.81
30845.05
29944.54
29560.06 29208.3328970.30
28381.6527682.63
27264.0427069.2426561.1026284.9025981.12
123.28
15
Skewed 3D RAS Plot
If the WSELs
are known, then a map can be drawn.

With the Cross Sections with the WSELs
established --
A TIN of the water surface can be created.
Also, each water surface elevation can be compared against the areas of concern within the watershed –
Bridge locations, areas of structural flooding, etc.

RAS Mapping RAS Mapping
Creates a TIN of the WSELCreates a TIN of the WSEL
Converts it to a RASTER Converts it to a RASTER
Subtracts the RASTER of the WSEL from the Subtracts the RASTER of the WSEL from the RASTER DEM (DEM of the watershed)RASTER DEM (DEM of the watershed)
Removes the 0Removes the 0’’ss
Converts the RASTER to a PolygonConverts the RASTER to a Polygon

TIN of the Predicted Water Surface Elevation TIN coverted
to RASTER using cell size equal to the best available DEM
(FEWS creates DEM of watershed from Terrain Data Sets now available)
Evaluates the Predicted WSEL against the DEM of the watershed.
Removes the 0’s
Converts the RASTER to a FEATURE.
RAS Mapping in Arc Model

800 1000 1200 1400 1600 1800 2000 2200712
714
716
718
720
722
724
726
728
730
732
Shoal Creek Plan: Existing Conditions Analysis 8/17/2006 Cross Creek Drive
Station (ft)
Ele
vatio
n (ft
)
Legend
EG 500-Year
WS 500-Year
EG 100-Year
EG 50-Year
WS 100-Year
EG 25-Year
WS 50-Year
WS 25-Year
EG 10-Year
WS 10-Year
Crit 500-Year
EG 5-Year
WS 5-Year
Crit 100-Year
Crit 50-Year
EG 2-Year
Crit 25-Year
WS 2-Year
Crit 10-Year
Crit 5-Year
Crit 2-Year
Ground
Ineff
Bank Sta
.08 .04 .05
Low Chord (watch level)
High Chord (warning level)
By knowing the water surface elevations at all of the cross sections, an ACTION CODE can be established that indicates whether the water surface
elevation is dangerous or not.

WES
T AV
E
NUEC
ES S
T
W 6TH ST
W 5TH ST
W 12TH ST
W 9TH ST
RIO
GRAN
DE S
T
W 10TH STW 11TH ST
W 4TH ST
W 8TH ST
GUA
DALU
PE S
T
W 3RD ST
BLAN
CO S
T
SAN
ANTO
NIO
ST
W 16TH ST
W 17TH ST
LAVA
CA S
T
LORR
AIN
ST ENFIELD RD
PARKWAY
BAYL
OR S
T
W 15TH STW 13TH ST
WIN
DSOR
RD
W 14TH ST
BOW
IE S
T
N LA
MAR
BLV
D
W 7TH ST
SHEL
LEY
AVE
HEND
ERSO
N ST
SHOAL CREEK BLVD
WOO
D ST
KINGSBURY ST
PEAR
L ST
CAST
LE H
ILL
ST
ROSE ST
SAYERS ST
W 13TH ST
W 3RD ST
SHEL
LEY
AVE
W 9TH ST
SAN
ANTO
NIO
ST
W 11TH ST
W 13TH ST
BAYL
OR
ST
BAYL
OR S
T
W 10TH ST
W 11TH ST
W 7TH ST
LegendSDE.PNT_ADDRESS selection
SDE.STR_ADDRESS
SDE.build_p
SDE.build_p selection
Bridge_Geo_XSAction_Code
1
2
3
Predicted Floodplain
ENS Areas
The ACTION CODES –
shown on the left indicate if the bridges will be overtopped or not.

23
66
WES
T AV
E
NUEC
ES S
T
W 6TH ST
W 5TH ST
W 12TH ST
W 9TH ST
RIO
GRAN
DE S
T
W 10TH STW 11TH ST
W 4TH ST
W 8TH STG
UADA
LUPE
ST
W 3RD ST
BLAN
CO S
T
SAN
ANTO
NIO
ST
W 16TH ST
W 17TH ST
LAVA
CA S
T
LORR
AIN
ST ENFIELD RD
PARKWAY
BAYL
OR S
T
W 15TH STW 13TH ST
WIN
DSOR
RD
W 14TH STBO
WIE
ST
N LA
MAR
BLV
D
W 7TH ST
SHEL
LEY
AVE
HEND
ERSO
N ST
SHOAL CREEK BLVD
WOO
D ST
KINGSBURY ST
PEAR
L ST
CAST
LE H
ILL
ST
ROSE ST
SAYERS ST
W 13TH ST
W 3RD ST
SHEL
LEY
AVE
W 9TH ST
SAN
ANTO
NIO
ST
W 11TH ST
W 13TH ST
BAYL
OR
ST
BAYL
OR S
T
W 10TH ST
W 11TH ST
W 7TH ST
LegendSDE.PNT_ADDRESS selection
SDE.STR_ADDRESS
SDE.build_p
SDE.build_p selection
Bridge_Geo_XSAction_Code
1
2
3
Predicted Floodplain
ENS Areas
Using ArcGIS, other layers can be added –
buildings (including FFEs), ENS areas, buildings of concern (schools, hospitals, nursing homes, high rises with sub-
parking, etc.)

23
66
WES
T AV
E
W 9TH ST
NUEC
ES S
T
N LA
MAR
BLV
D
W 10TH ST
RIO
GRA
NDE
ST
W 11TH ST
W 12TH ST
W 8TH ST
W 17TH ST
W 16TH ST
SAN
ANTO
NIO
ST
PARKWAY
BAYL
OR
ST
W 15TH ST
WIN
DSO
R R
D
W 14TH ST
W 13TH ST
KINGSBURY ST
W 6TH ST
HEND
ERSO
N ST
PEAR
L ST
SHOAL CREEK BLVD
GUAD
ALUP
E ST
W 18TH ST
WOO
D ST
W 7TH ST
CAST
LE H
ILL
ST
ENFIELD RD
W 13TH HALF ST
CAST
LE C
T
W 13TH ST
BAYL
OR S
T
W 11TH ST
SH
OA
L CR
EEK
BLVD
Predicted at 06/27/07 at 00:00Flowrate is 19,000 cfsStage Height is 18 feet.
Time of Last Rainfall Value Received 06/27/07 at 23:15
The VFLO Model also has the attribute of date and time of prediction. This is added as a label in GIS.
Therefore, there is knowledge of extent of flooding as well as time of flooding.

Once created in ArcGIS, conversion to mapping images –
such as Google Earth can be made. This places this information in a public environment for ease of transfer to the Duty Officer to provide to first responders.

Because there are multiple models running on ArcServer, this allows for channel flooding evaluations across portions of the City, and not just one watershed.

Smaller watersheds vs. Larger Smaller watersheds vs. Larger watershedswatersheds
The City has models currently running in realThe City has models currently running in real--time for time for smaller watersheds (smaller watersheds (ttcc
< < 3 hours) and much larger 3 hours) and much larger watersheds watersheds
Calibration is easier for urban watersheds regardless of Calibration is easier for urban watersheds regardless of sizesize
Difficulty in calibration of watersheds with Difficulty in calibration of watersheds with KarstKarst featuresfeatures
More detailed initial DEM creates better calibrated More detailed initial DEM creates better calibrated modelsmodels
All models calibrate better for larger storms than for All models calibrate better for larger storms than for smaller stormssmaller storms

Presenter
Presentation Notes
But if you look at this storm total precipitation map produced from GR Level3 of the Burnet County storm that occurred in 2007, it doesn’t seem too far out of the ordinary that this storm could be sitting right on top of the central small urban areas of Austin.

Burnet County Storm (aka Rain Bomb) Hyetograph
• LCRA gauge data from the storm dated June 27, 2007
•Hyetograph was uniformly distributed over the entire Shoal Creek watershed (no distributed rainfall data was utilized)
•VFLO model was used to evaluate gauge readings and approximate shape files (and flood depths) had this rainfall fell within the Shoal Creek watershed.
•VFLO model has been calibrated to storm events, and has run continuously and compared against the USGS observations (USGS Gauge located at 12th at Shoal Creek)

Downtown Shoal Creek
•Floodplain does extend beyond the ENS area
•Depth of flooding is up to 9 feet in some areas.
•All creek cross streets south of 15th Street are under water
•Flooding occurs over 6 hours in downtown Austin
•Velocities can be as high as 13fps
•This model does not assume any debris (all crossings remain clear)

Predicted Models cannot foresee debris buildup or localized flooding.

With the use of predicted models, it is hoped that earlier warnings can be provided to those areas that are likely to be flooded.