Citation Analysis in Research Evaluation (Published by Springer, July 2005) Henk F. Moed CWTS,...
70
Citation Analysis in Research Evaluation (Published by Springer, July 2005) Henk F. Moed CWTS, Leiden University
-
Upload
ginger-king -
Category
Documents
-
view
215 -
download
1
Transcript of Citation Analysis in Research Evaluation (Published by Springer, July 2005) Henk F. Moed CWTS,...

Citation Analysis in Research Evaluation
(Published by Springer, July 2005)
Henk F. Moed
CWTS, Leiden University

2
Contents
• Introduction: Potentialities of bibliometrics
• Adequacy of WoS coverage per main discipline
• Effects of the use of bibliometric indicators upon publication and citation practices
• Citation analysis and peer review

3
Book is written for a broad audience
1. Scientists and scholars subjected to citation analysis
2. Research policy makers and managers
3. Members of peer review committees and other evaluators
4. Practitioners and students in science studies, library & information science

4
Book Structure
Part No Part Title
Executive Summary (7 pp)
Part 1 General Introduction and Main Conclusions (60 pp)
Part 2 Empirical and Theoretical Chapters (250 pp)

5
Part No Part Title
2.1 Assessing basic science research departments and scientific journals
2.2 The ISI Citation Indexes
2.3 Assessing social sciences and humanities
2.4 Accuracy aspects
2.5 Theoretical aspects
2.6 Citation analysis and peer review
2.7 Macro studies
2.8 New developments

6
Main objective
• A firm political or societal basis for ‘basic’ science can be maintained only by further developing a system of internal quality control and performance enhancement
• This book aims at showing that citation analysis is a useful tool in such a system

7
General approach: uses and limits
• The book shows that the application of citation analysis in research evaluation has reached a high level of sophistication
• It discusses numerous issues raised by scientists, journal editors and policy makers
• It shows how such issues can in principle be accounted for or solved technically

8
The use of citation analysis in research evaluation is more appropriate the more it is:
• Formal
• Open
• Scholarly founded
• Supplemented with expert knowledge
• Carried out in a clear policy context with clear objectives
• Stimulating users to explicitly state basic notions of scholarly quality
• Enlightening rather than formulaic

Macro Trends in the Global Science System

10
Fractional counting scheme for a paper with 4 addresses
Addresses Country Frac-tion
Univ Granada, Dept A. Spain 1/4
Univ Granada, Dept B. Spain 1/4
Univ Leiden, Dept C. Netherlands 1/4
Kathol Univ Leuven, Dept D. Belgium 1/4
Spain: 0.5; Netherlands: 0.25; Belgium: 0.25

11
Normalised citation impact
The average citation rate of a unit’s papers
÷World citation average in the subfields in
which the unit is active
( >1.0 : above world average)

12
0
5
10
15
20
25
30
35
40
YEAR
% P
AP
ER
S (
FR
AC
TIO
NA
L) US
CN
JP
UK
DE
FR
CA
IT
ES
IN
% US papers declined

13
0
1
2
3
4
5
6
7
8
9
10
80 81 82 83 84 85 86 87 88 89 90 91 92 93 94 95 96 97 98 99 00 01 02 03 04 05 06
YEAR
% P
AP
ER
S (
FR
AC
TIO
NA
L)
US
CN
JP
UK
DE
FR
CA
IT
ES
IN
China No. 2 in 2006
JP, UK, DE, FR, CA decline
Spain increases

14
Convergent trend in citation impact because of globalisation
0.0
0.2
0.4
0.6
0.8
1.0
1.2
1.4
1.6
1.8
80-82
81-83
82-84
83-85
84-86
85-87
86-88
87-89
88-90
89-91
90-92
91-93
92-94
93-95
94-96
95-97
96-98
97-99
98-00
99-01
00-02
01-03
02-03
03-05
04-06
Publication and Citation Years
No
rma
lis
ed
Cit
ati
on
Im
pa
ct
US
UK
CA
DE
FR
IT
ES
JP
CN
INImpact Spain >1.0 in 2004/6

15
Conclusion
• Assessment of a country’s performance should be carried out from a comparative, global perspective

Bibliometric Rankings of World Universities
Available at: www.cwts.nl/hm
Henk F. MoedCWTS, Leiden University
The Netherlands
CWTS Graduate Course 2006

17
Research universities
• Conduct research at a certain scale
This study:
• Universities with > 5,000 published articles during 1977-2004 (> 625 per year)
• With more than about 600 active researchers

18
Distribution of universities among regions
0.0
0.5
1.0
1.5
2.0
2.5
0 1,000 2,000 3,000 4,000 5,000 6,000 7,000 8,000
ARTICLES / YEAR
NO
RM
AL
ISE
D C
ITA
TIO
N IM
PA
CT
USA
EUROPE
OTHER=> 9,600
Universities with > 5,000 papers during 1997-2004 (n=386)

19
Distribution of universities among regions
0.0
0.5
1.0
1.5
2.0
2.5
0 1,000 2,000 3,000 4,000 5,000 6,000 7,000 8,000
ARTICLES / YEAR
NO
RM
AL
ISE
D C
ITA
TIO
N IM
PA
CT
USAEUROPEOTHERNL
=> 9,600
Universities with > 5,000 papers during 1997-2004 (n=386)

20
16 broad disciplines
(A&H) Arts & Humanities GEO Geosciences
APC Appl Phys & Chem MATH Mathematics
BIOL-A&P
Biol Sci ~ Anim & Plants
MOLB Mol Biol & Biochem
BIOL-HU
Biol Sci ~ Humans (MULTI) Multi-disciplinary
CHEM Chemistry PHYS Physics & Astron
CLM Clinical Medicine PSY Psychol & Psychiat
ECON Economics & Business (SOC) Social Sci
ENG Engineering SOC-MED Social Sci ~ Medicine

21
General European Univ
TOP 25%BOTTOM 25%
TOP 25%
BOTTOM 25%
Impact
Publications
(A&H)
APC
BIOL-AP
BIOL-HU
CHEM
CLM ECON
ENG
GEO
MATH
MOLB
(MULTI)
PHYS
PSY
SOC-MED
(SOC)
0
25
50
75
100
0255075100PUBLICATION RANK PTCL
CIT
AT
ION
I P
AC
T R
AN
K P
CT
LAmong top 25 % in publication output and citation impact

22
‘Top’ US/UK research university
(SOC)
SOC-MEDPSY
PHYS (MULTI) MOLB
MATH
GEO
ENG ECON
CLM
CHEM
BIOL-HUBIOL-AP
APC
(A&H)
0
25
50
75
100
0255075100PUBLICATION RANK PTCL
CIT
AT
ION
I P
AC
T R
AN
K P
CT
L
University has a top position
in each discipline

23
Conclusion
• The best European universities are among the top 25% in the world
• But their top is less broad than that of the best US research universities
• In European national academic systems top research is more evenly distributed among universities

24
Policy issue
• Concentration model (US, UK) versus distributed model
• Is a concentration model a proper policy incentive in the European Research Area?

25
BIGGEST 100 WORLD UNIVERSITIES (Calero et al., 2006)
USA
Europe
Japan
Univ Harvard
Univ TokyoUniv Tokyo
Univ Toronto
Univ Melbourne
Univ Sydney
Univ Queensland
26
BIGGEST 100 EUROPEAN UNIVERSITIES (Calero et al, 2006)
The Netherlands
Germany
United Kingdom
Scandinavia
Italy
Switzerland
France
Spain
BelgiumOxford
Univ Munich Katholieke Univ Leuven
Karolinska Inst.ETH Zurich
Univ Milano
Univ Antwerpen

27
Bottom-up Approach: 159 NL Academic Chemistry Groups
0.0
0.5
1.0
1.5
2.0
2.5
3.0
3.5
4.0
4.5
0 200 400 600 800
Total Publications
Nor
mal
ised
Cita
tion
Impa
ct
Did global scientific publication productivity increase during the
1980s and 1990s?
A Meta Analysis of the ISI Database

29
Research questions
• Did authors publish in recent years more papers than they did in the past?
• How did scholarly collaboration develop?
• Are there traces of “publication pressures” in the ISI database?
30
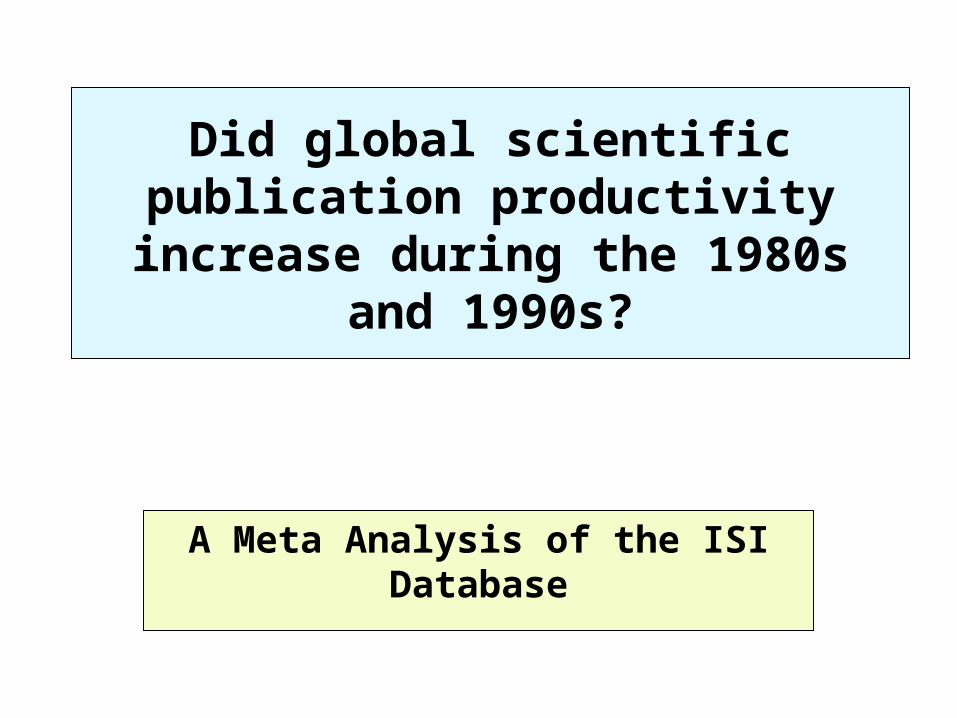
Absolute numbers
1980 2002 Growth rate
Papers 478,000 814,000 + 70 %
Unique publishing authors
545,000 1,095,000 + 101 %
Authorships 1,187,000 3,081,000 + 160 %

31
Three indicators
Indicator Interpretation
Authorships per paper (Formal) scientific collaboration
Authorships per publishing author
Average number of papers in an author’s publication list
Papers per unique publishing author
‘Overall’ author publication productivity

32
Patterns in total ISI database
0.0
0.5
1.0
1.5
2.0
2.5
3.0
3.5
4.0
80 81 82 83 84 85 86 87 88 89 90 91 92 93 94 95 96 97 98 99 00 01 02
Years
Rat
io
Authorships/Publ
Authorships/Publ Author
Publ / PublAuthor
Authorships/Paper (+52%)
Authorships/Author (+29%)
Papers/Unique Publishing Author (-15%)
Author Produc-
tivity
Collabo-ration
PapersPublished by Average
Author
33
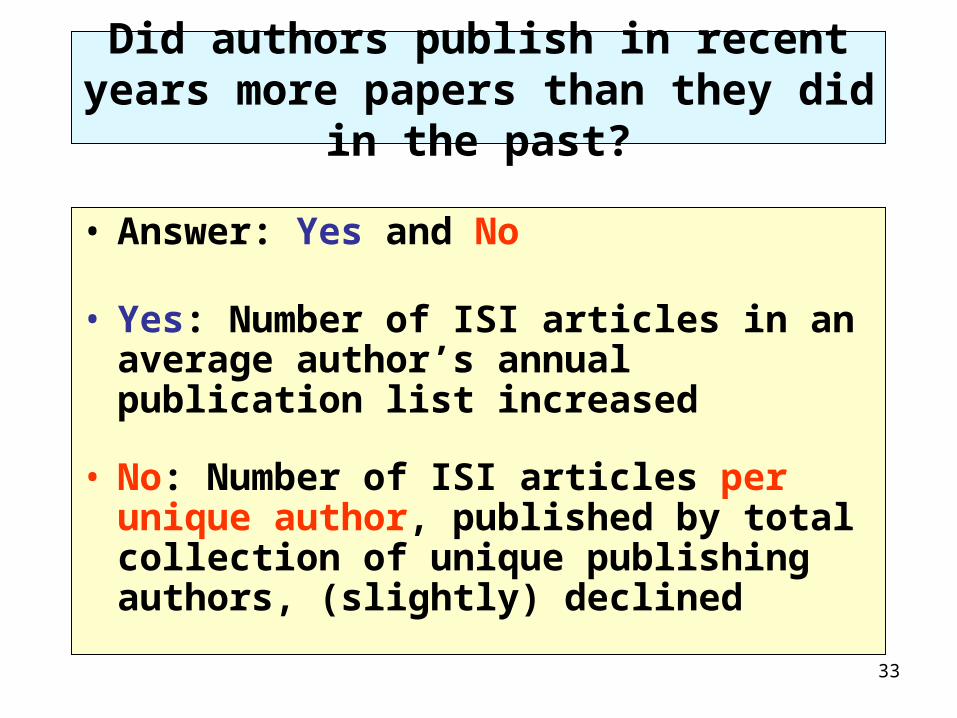
Did authors publish in recent years more papers than they did in the past?
• Answer: Yes and No
• Yes: Number of ISI articles in an average author’s annual publication list increased
• No: Number of ISI articles per unique author, published by total collection of unique publishing authors, (slightly) declined

34
Conjecture – 1
If publication pressure is the dominant factor:
• Scholars increased their publication counts by collaborating more intensively – or through authorship inflation - , rather than by collectively publishing more papers

Adequacy of ISI/WoS coverage

36
All literature
‘Important’ literature
WoS
WoS Coverage (%) = ?

37
Selection of WoS source journals
The real problem is to “make the coverage as complete as possible by expanding it beyond the core of journals whose importance to a given field is obvious” (Garfield 1979)

38
How is the core expanded?
• Garfield’s criterion: The frequency at which journals are cited in the source journals that are already included in the index
• Assumption: The number of times a journal’s items are cited is an expression of its utility as communication medium

39
Adequacy of ISI coverage: Two approaches
External Compare ISI database with other databases (e.g., CAS, PUBMED, or scholars’ publication lists, annual reports)
Internal Examine the extent to which the documents cited in ISI source articles are themselves published in ISI source journals

40
WoSNon-WoS
Non-WoS WoS
Citing/Source
Cited/Target
?%?%
Measurement of internal WoS Coverage
Non-Wos Journals
Books
Conference proceedings
Reports
Etc.

41
AU Moed, HF; Garfield, E. in WO
S
TI In basic science the percentage of 'authoritative' references decreases as bibliographies become shorter
SO SCIENTOMETRICS 60 (3): 295-303, 2004 Y
RF ABT HA, J AM SOC INF SCI T, v 53, p 1106, 2004 Y
GARFIELD, E. CITATION INDEXING, 1979 (BOOK!) N
GARFIELD E, ESSAYS INFORMATION S, v 8, p 403, 1985 N
GILBERT GN, SOC STUDIES SCI, v 7, p 113, 1977 Y
MERTON RK, ISIS, v 79, p 606, 1988 Y
ROUSSEAU R, SCIENTOMETRICS, v 43, p 63, 1998 Y
ZUCKERMAN H, SCIENTOMETRICS, v 12, p 329, 1987 Y
WoS Coverage = 5/7 = 71%
Not in WoS

42
WoSNon-WoS
Non-WoS WoS
Citing/Source
Cited/Target
75%25%
Total ISI/WoS Database

43
WoSNon-WoS
Non-WoS WoS
Citing/Source
Cited/Target
92%8%
Molecular Biol & Biochem

44
WoSNon-WoS
Non-WoS WoS
Citing/Source
Cited/Target
29%71%
Social Sciences

45
Overall ISI coverage by main field
EXCELLENT (> 80%) VERY GOOD (60-80%) GOOD(40-60%)
Biochem & Mol Biol Appl Phys & Chem Mathematics
Biol Sci – Humans Biol Sci – Anim & Plants
Economics
Chemistry Psychol & Psychiat Engineering
Clin Medicine Geosciences MODERATE (<40 %)
Phys & Astron Soc Sci ~ Medicine Other Soc Sci
Humanities & Arts

46
Sub-disciplines (non-exhaustive list)
Social sciences related to medicine and health
Other social sciences
Humanities
Public environm & occupat health
Nursing
Sport sciences
Substance abuse
Sociology
Anthropology
Educational sciences
Political science
Law
Literature
Linguistics
Historical sc
Philosophy

47
Important factors
Mathematics CompuMath included as from 1993 only
Preprints
Engineering & Applied sciences
Conference proceedings
Reference works
Other Social Sciences Books
Language barriers
Humanities and Arts Books
Language barriers
References to study object included

48
WoSNon-WoS
Non-WoS WoS
Citing/Source
Cited/Target
Three types of studies
2. Target Expanded
3. Source Expanded
1. Pure WoS

49
4 Types of bibliometric studies
Cited/Target Citing/Source ISI coverage Field/Study
1 ISI ISI Excellent – Very Good
Astronomy
2 ISI+non ISI ISI Very Good – Good
Mathematics
3 ISI+non ISI ISI+non ISI Good – Moderate
Computer Science
4 No citation analysis at all Moderate NL Law

50
Social Sciences and Humanities
• It cannot be taken for granted that the ISI Citation Indexes provide such indicators in all subfields of these domains of scholarship
• A challenge would be to systematically explore alternative data sources and methodologies

Effects of the use of bibliometric indicators upon publication and
citation practices
52
Effects of editorial self-citations upon journal impact factors
[Reedijk & Moed, J Doc, to be publ, 2007]
• Focus on ‘consequences’ rather than ‘motives’
• Case studies
• Overall pattern

53
Editorial self-citations
• A journal editor cites in his editorials papers published in his own journal
• Or he cites papers in other journals published by the same publisher
54
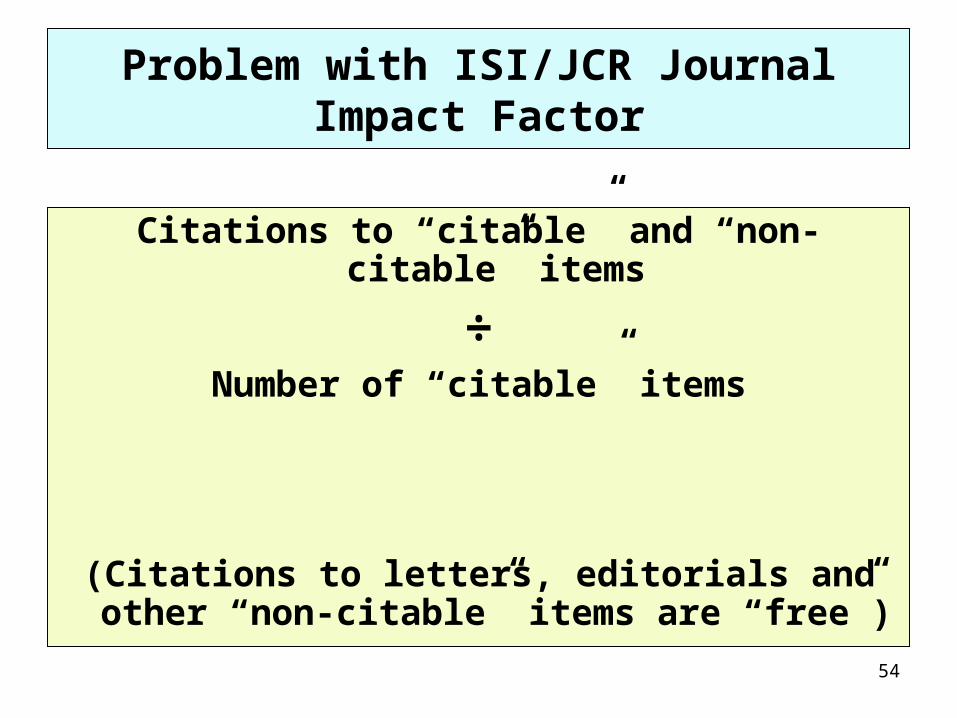
Problem with ISI/JCR Journal Impact Factor
Citations to “citable” and “non-citable” items
÷Number of “citable” items
(Citations to letters, editorials and other “non-citable” items are “free”)

55
Case: ISI/JCR Impact Factor of a Gerontology Journal (published in the journal itself)
0.0
0.5
1.0
1.5
2.0
2.5
3.0
3.5
4.0
4.5
5.0
2000 2001 2002 2003 2004
IMPACT FACTOR YEAR
CIT
ES
PE
R 'C
ITA
BL
E' D
OC

56
Decomposition of the IF of a Gerontology journal
0.0
0.5
1.0
1.5
2.0
2.5
3.0
3.5
4.0
4.5
5.0
2000 2001 2002 2003 2004
IMPACT FACTOR YEAR
CIT
ES
PE
R 'C
ITA
BL
E' D
OC
Cites from journal's own editorials
Cites to 'non-citable' docs
Base score

UK Research Assessment Exercises:
Informed judgments on research
quality or quantity?
Henk F. Moed
Centre for Science and Technology Studies (CWTS)
Leiden University, the Netherlands

58
Key policy issues
• Are research policies aimed to enhance scientific excellence effective?
• Are evaluation processes aimed to identify scientific excellence successful?

59
Effects of evaluation processes upon scientists’ “practices”
• Intended: Scientists perform better
• Unintended: Scientists seek to artificially increase their ‘ratings’
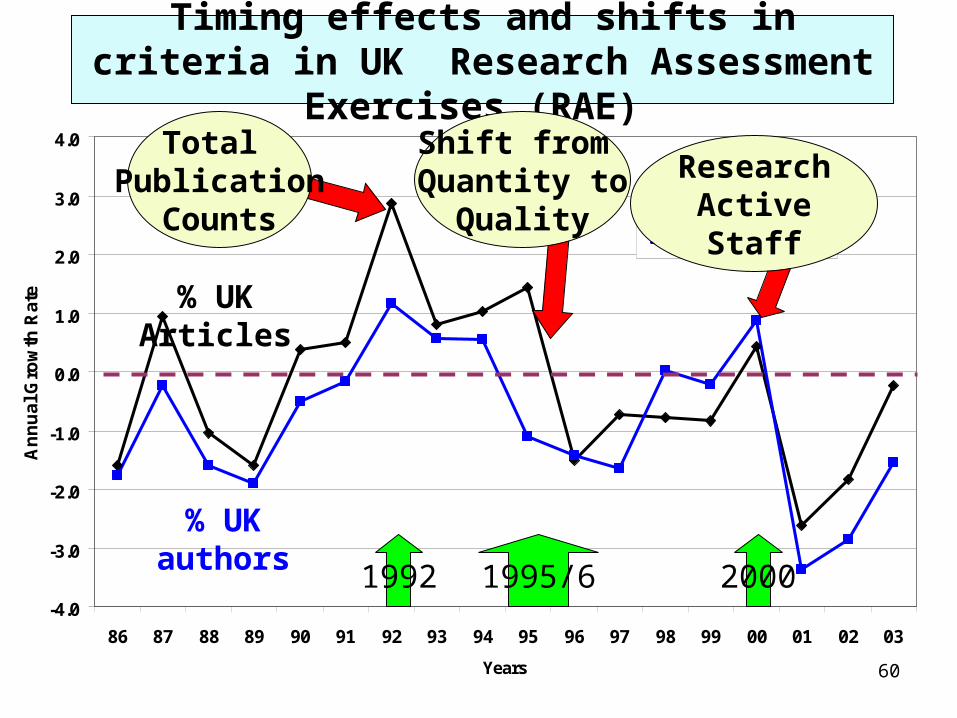
60
Timing effects and shifts in criteria in UK Research Assessment Exercises (RAE)
-4.0
-3.0
-2.0
-1.0
0.0
1.0
2.0
3.0
4.0
86 87 88 89 90 91 92 93 94 95 96 97 98 99 00 01 02 03
Years
An
nu
al G
row
th R
ate
% UK Articles% UK Authors
1995/61992 2000
Total Publication
Counts
Shift from Quantity to
Quality
ResearchActiveStaff
% UK authors
% UK Articles

61
At the level of research groups, actual citation impact and journal prestige tend to show only weak correlations
[Set of 2,150 UK authors with > 10 articles per year]
Indicator Explained variance in actual citation impact
No published articles 0 %
Average journal impact factor
11 %
Normalised journal impact / prestige
23 %

62
Why use sophisticated citation analysis
in RAE 2008?
• Shift in focus from quantity to quality
• Reduction unintended effects of using less sophisticated indicators
• Use of absolute rather than relative standards
• Formal rather than informal use (transparency)
Citation Analysis and Peer Review
Henk F. Moed
Citation Analysis in Research Evaluation
Springer, 2005
64
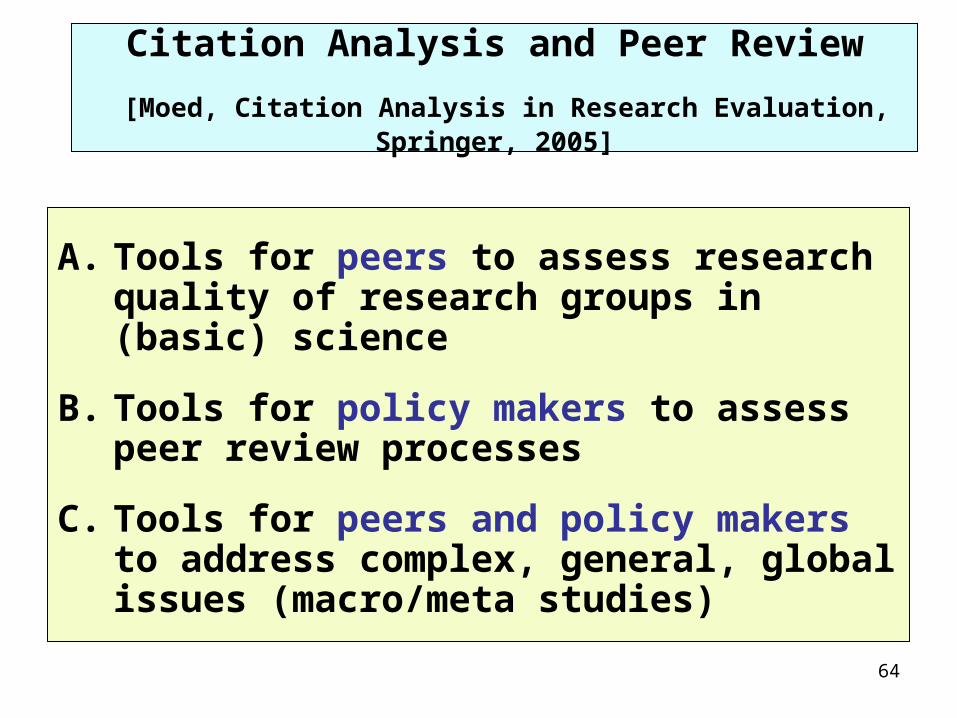
Citation Analysis and Peer Review
[Moed, Citation Analysis in Research Evaluation, Springer, 2005]
A. Tools for peers to assess research quality of research groups in (basic) science
B. Tools for policy makers to assess peer review processes
C. Tools for peers and policy makers to address complex, general, global issues (macro/meta studies)

65
Affinity applicants – Committee
0 Applicants are/were not member of any Committee
1 Co-applicant is/was member of a Committee, but not of the one evaluating
2 First applicant is/was member of a Committee, but not of the one evaluating
3 Co-applicant is member of the Committee(s) evaluating the proposal
4 First applicant is member of the Committee(s) evaluating the proposal

66
For 15 % of applications an applicant is a member of the evaluating Committee (Affinity=3, 4)
0
10
20
30
40
50
60
70
% A
PP
LIC
AT
ION
S
AFFINITY APPLICANTS-COMMITTEE
Projects 63.2 10.2 11.5 5.9 9.1
0 1 2 3 4

67
Probability to be granted increases with increasing affinity applicants-Committee
30
40
50
60
70
80
% G
RA
NT
ED
AP
PL
ICA
TO
NS
AFFINITY APPLICANTS-COMMITTEE
Projects 37.0 46.9 60.1 62.6 74.0
0 1 2 3 4

68
Logistic regression analysis: Affinity Applicant-Committee has a significant
effect upon the probability to be granted
MAXIMUM-LIKELIHOOD ANALYSIS-OF-VARIANCE TABLE (N=2,499) Source DF Chi-Square Prob ------------------------------------------------------------- INTERCEPT 1 18.47 0.0000 Publ Impact applicant 3 26.97 0.0000 ** Rel transdisc impact applicant 1 0.29 0.5926 Affinity applicant-Committee 2 112.50 0.0000 ** Sum requested 1 45.47 0.0000 ** Institution applicant 4 25.94 0.0000 ** LIKELIHOOD RATIO 199 230.23 0.0638

69
Conclusion
• The future of research assessment exercises lies in the intelligent combination of metrics and peer review

70
END