CIH, CSP UW [email protected] VPP Conference May 22, 2013,...
132
Rick Gleason, CIH, CSP UW [email protected] VPP Conference May 22, 2013, Spokane, WA. Improving Occupational Safety and Health: Lessons from 100 years of Workers Compensation in WA. OR. And MT (1911-2011)
Transcript of CIH, CSP UW [email protected] VPP Conference May 22, 2013,...
Rick Gleason, CIH, CSP UW [email protected] VPP Conference May 22, 2013, Spokane, WA. Improving Occupational Safety and Health: Lessons from 100 years of Workers Compensation in WA. OR. And MT (1911-2011)

Even though we are looking back 100years, we also need to look forward 100 years: Teach your kids and grandkids about safety


Would You get Workers Compensation even if it could be proven that the accident was your fault?
Yes. You just have to give up the right to sue your employer or co workers if the accident was their fault. How long has the State of Washington had a No fault Workers Compensation Law?
In the 1900's many states began the process of developing workers compensation laws. Maryland (1902), Massachusetts (1908), Montana (1909) and New York (1910) each introduced workers compensation statutes. All four laws were struck down under constitutional challenge as violating "due process.“
Around 1910-13 Many States developed workers compensation laws that were declared constitutional including WI, WA, NY, MA, NH, KS, IL, CA, NY, OR, MD
Oregon’s Employer Liability Law (ELL), sometimes called the Employer Liability Act (ELA) was adopted by initiative in 1910. Labor had proposed the bill to the legislature, but the proposal did not pass. On Nov. 8, 1910 Labor put the same bill on the ballot as an initiative, which passed. The rationale for the bill was that safeguards for workers should be as much a part of the cost of doing business as those protecting equipment.

The bill required protection for workers engaged in hazardous employment and imposed a higher standard of care upon employers who engage in work involving risk or danger. Oregon’s original Workers’ Comp law was passed in 1913.
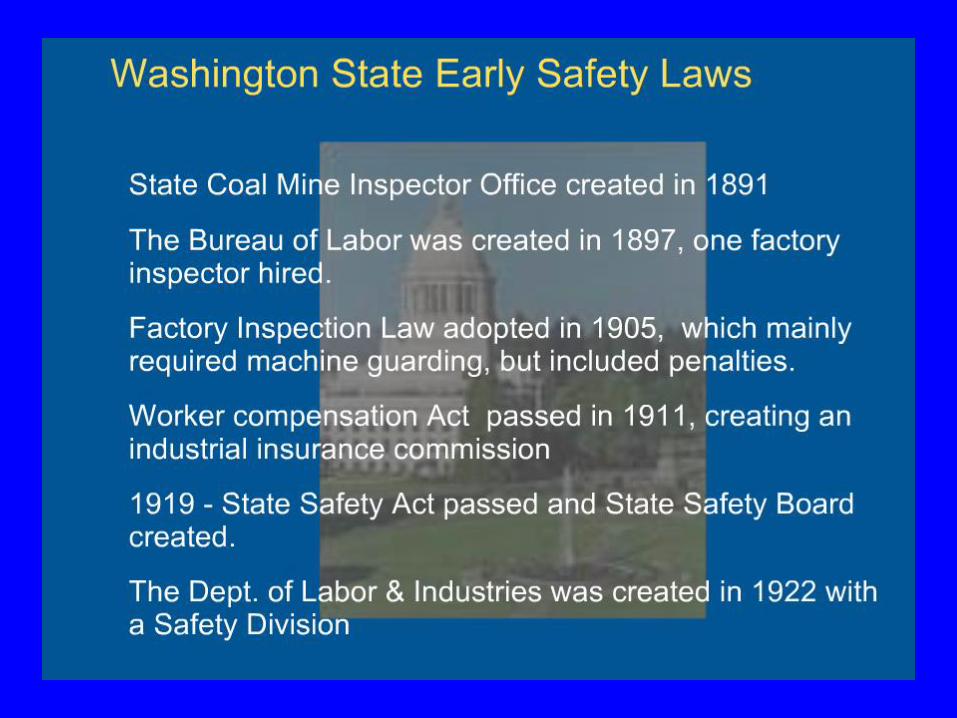
1911 was the Workmen’s Compensation Act, State of Washington We have had workers comp for exactly 100 years. The law took effect October 1, 1911. (Originally only the most hazardous industries were covered.) Triangle Shirtwaist Fire was March 25, 2011 -- 146 deaths

Facts from 1911 in the USA: The Five leading causes of death were: 1. Pneumonia and influenza 2. Tuberculosis 3. Diarrhea 4. Heart disease 5. Stroke The American flag had 45 stars.
Facts from 1911 in the USA: The average life expectancy for men was 47 years. There were only 8,000 cars and only 144 miles of paved roads. The maximum speed limit in most cities was 10 mph. The average US wage in 1910 was 22 cents per hour. The average US worker made between $200 and $400 per year.
Each State regulates their own workers compensation program. There is only one State that does not require employers to have workers comp?
Texas does not require employers to have workers comp.

What were the most unsafe jobs in 1911?

Logging, Fishing and Mining


The original act only covered “Extra Hazardous Works”: Factories, mills and workshops where machinery is used ;
printing, electrotyping, photo-engraving ; foundries, blast
furnaces, mines, gas works, waterworks, breweries, elevators,
wharves, docks, dredges, smelters, powder works ; laundries
operated by power ; quarries ; engineering works; logging, ship
building ; railroads; buildings being constructed, repaired,
moved or demolished; telegraph, telephone, electric light or
power plants , steam heating , steamboats, tugs, ferries and
railroads. Risk classes were set up for each type of work and charges as a % of payroll were established.
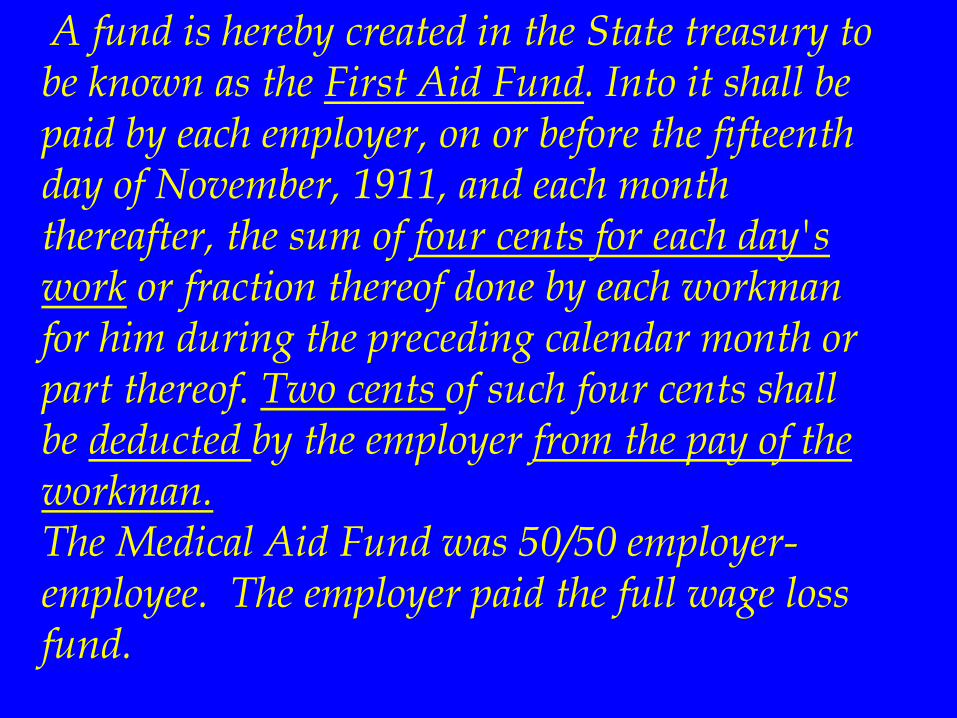
A fund is hereby created in the State treasury to be known as the First Aid Fund. Into it shall be paid by each employer, on or before the fifteenth day of November, 1911, and each month thereafter, the sum of four cents for each day's work or fraction thereof done by each workman for him during the preceding calendar month or part thereof. Two cents of such four cents shall be deducted by the employer from the pay of the workman. The Medical Aid Fund was 50/50 employer-employee. The employer paid the full wage loss fund.
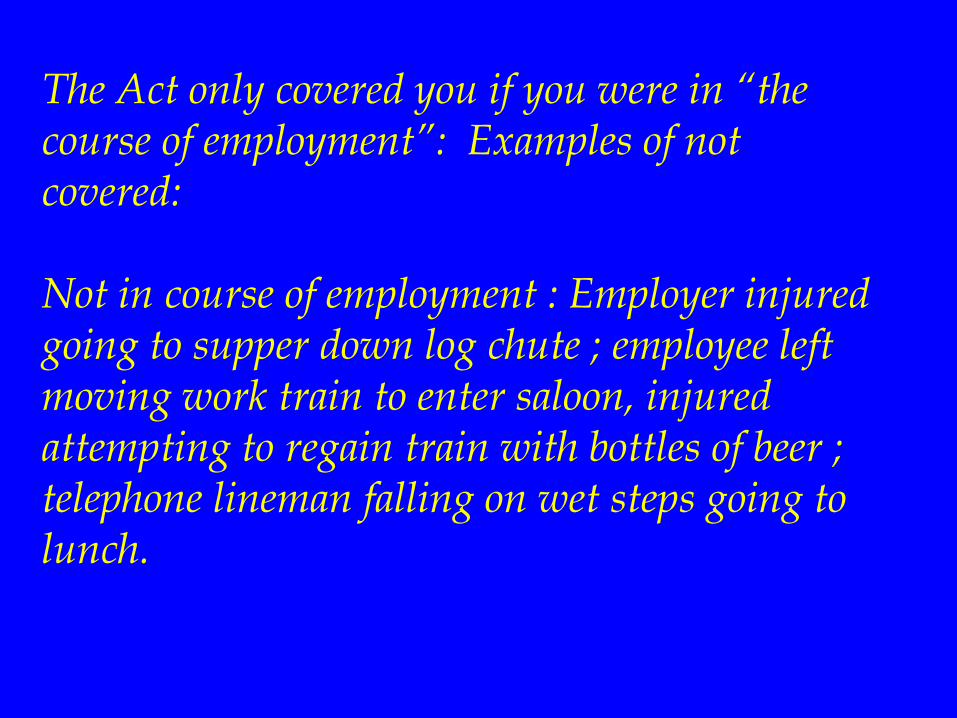
The Act only covered you if you were in “the course of employment”: Examples of not covered: Not in course of employment : Employer injured going to supper down log chute ; employee left moving work train to enter saloon, injured attempting to regain train with bottles of beer ; telephone lineman falling on wet steps going to lunch.
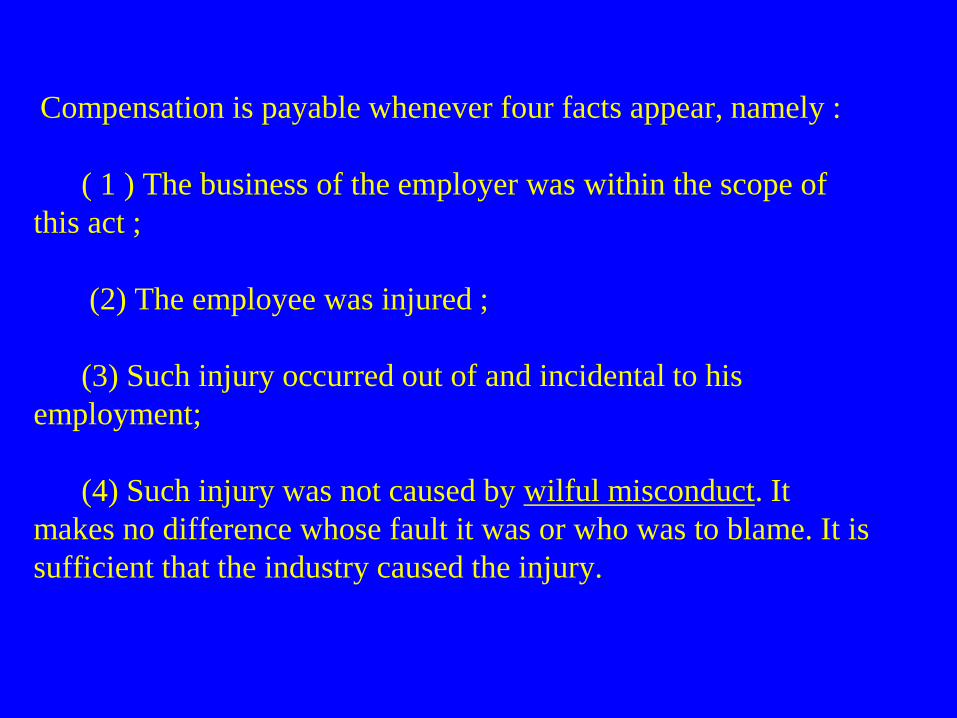
Compensation is payable whenever four facts appear, namely :
( 1 ) The business of the employer was within the scope of
this act ;
(2) The employee was injured ;
(3) Such injury occurred out of and incidental to his
employment;
(4) Such injury was not caused by wilful misconduct. It
makes no difference whose fault it was or who was to blame. It is
sufficient that the industry caused the injury.

Death Benefits: (a) Where death results from the injury the expenses of burial shall be paid in all cases, not to exceed $76.00 in any case, and, (1) If the workman leaves a widow or invalid widower, a monthly payment of $20.00 shall be made throughout life of the surviving spouse, to cease at the end of the month in which remarriage shall occur ; and the surviving spouse shall also receive $5.00 per month for each child of the deceased under the age of sixteen years at time of the occurrence of the injury
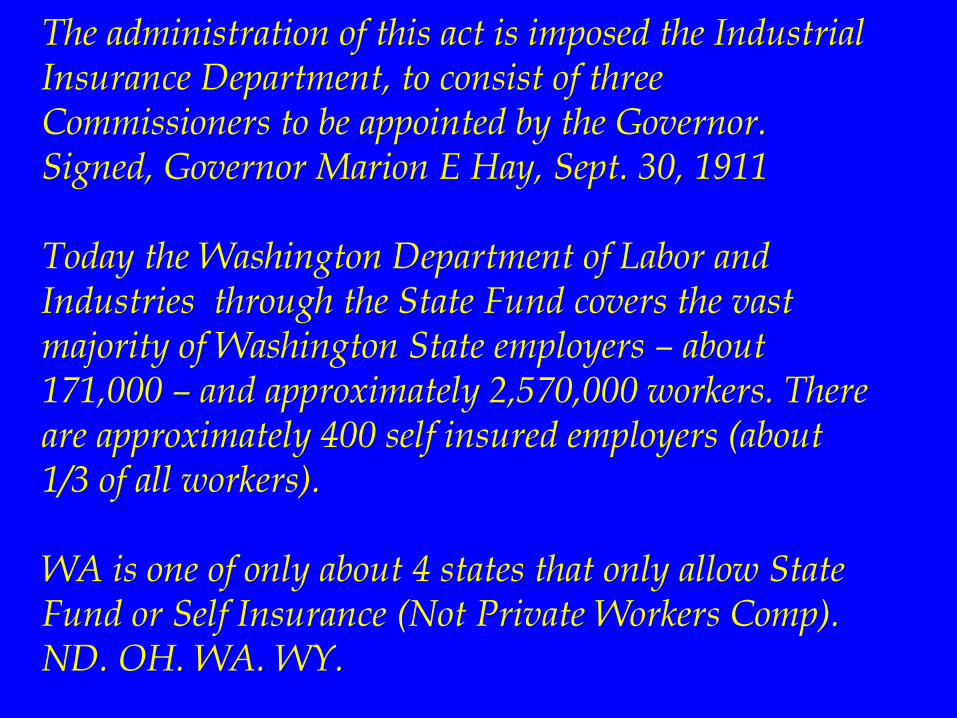
The administration of this act is imposed the Industrial Insurance Department, to consist of three Commissioners to be appointed by the Governor. Signed, Governor Marion E Hay, Sept. 30, 1911 Today the Washington Department of Labor and Industries through the State Fund covers the vast majority of Washington State employers – about 171,000 – and approximately 2,570,000 workers. There are approximately 400 self insured employers (about 1/3 of all workers). WA is one of only about 4 states that only allow State Fund or Self Insurance (Not Private Workers Comp). ND. OH. WA. WY.
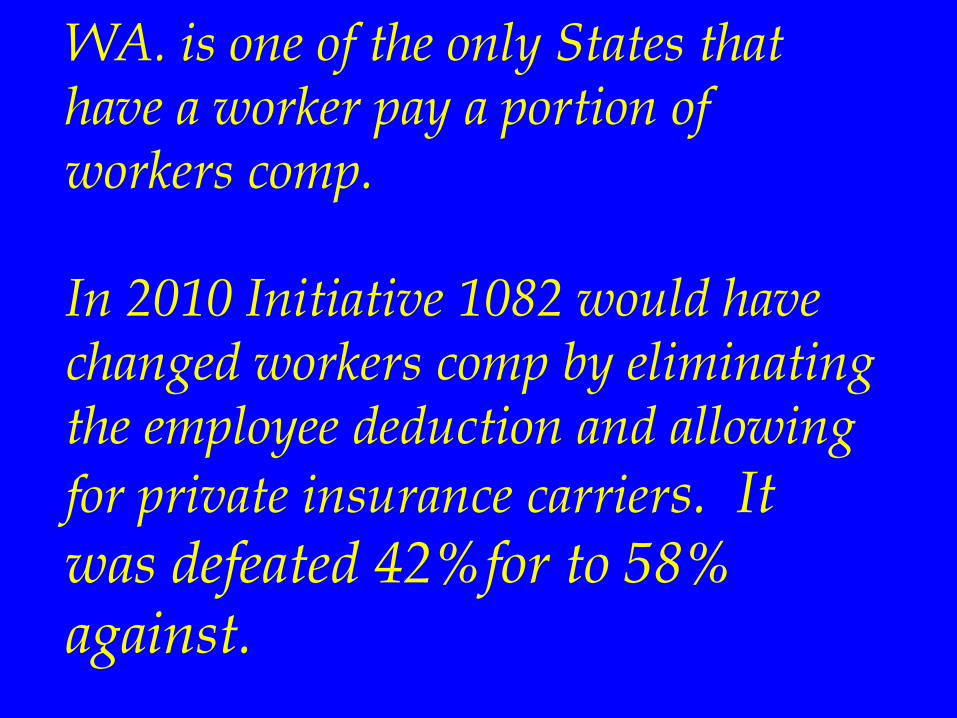
WA. is one of the only States that have a worker pay a portion of workers comp. In 2010 Initiative 1082 would have changed workers comp by eliminating the employee deduction and allowing
for private insurance carriers. It was defeated 42%for to 58% against.


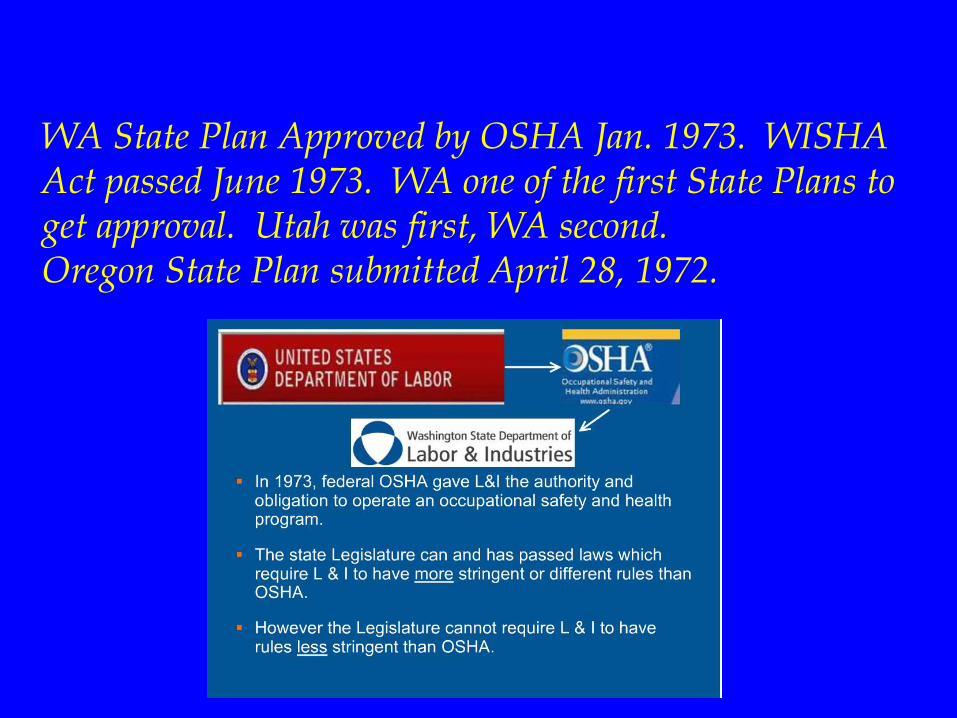
WA State Plan Approved by OSHA Jan. 1973. WISHA Act passed June 1973. WA one of the first State Plans to get approval. Utah was first, WA second. Oregon State Plan submitted April 28, 1972.


What jobs have the highest fatal accident rate today??

Overall Rate 5 per 100,000 per year

Fatality Rate by Size of Employer

2004 Fatal Accident Rate, USA Hispanic workers died at a rate 11 percent higher than 2004. Older worker deaths were up 10 percent. Construction workers were up 9% from 2003. Nearly half of all fatal work injuries occurred among workers who drive or move material around for a living. Truck drivers, forklift operators, trash collectors, and cabbies are all
part of this group. Approximately 5,700 Fatalities.
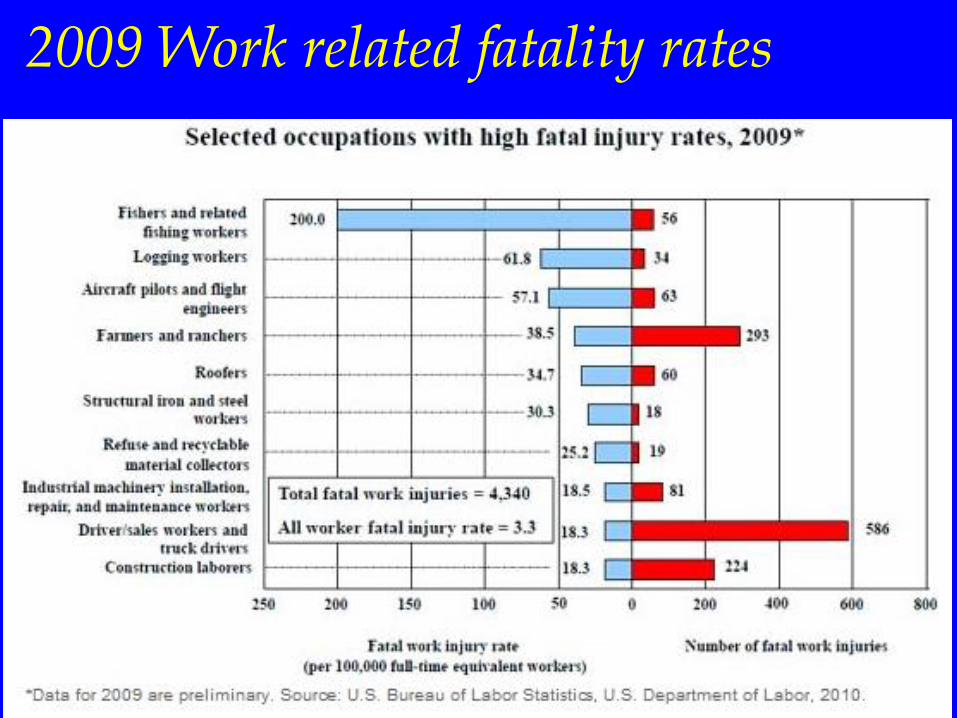
2009 Work related fatality rates

Has the fatality rate in American gone up, down or stayed the same in the last 30 years?
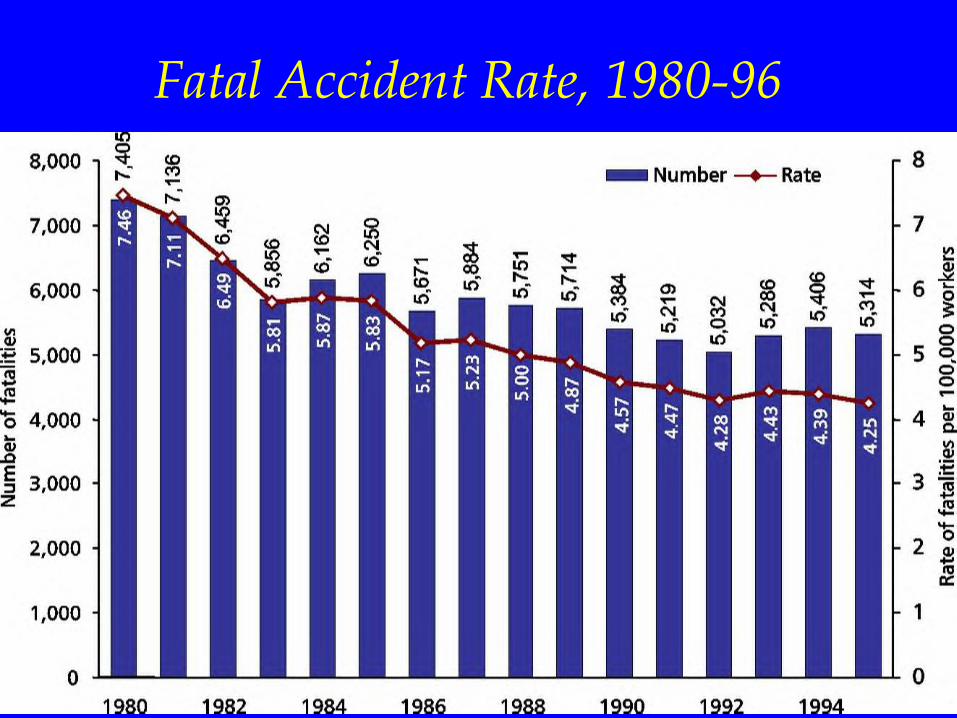
Fatal Accident Rate, 1980-96

What are the four leading causes of death on the job?

Motor Vehicles, Falls, Murder and Struck By 2000


Statistics for the State of Washington, Department of Labor and Industries (L & I) Division of Occupational Safety and Health (DOSH), operating under the Washington Industrial Safety and Health Act of 1973 (WISHA)

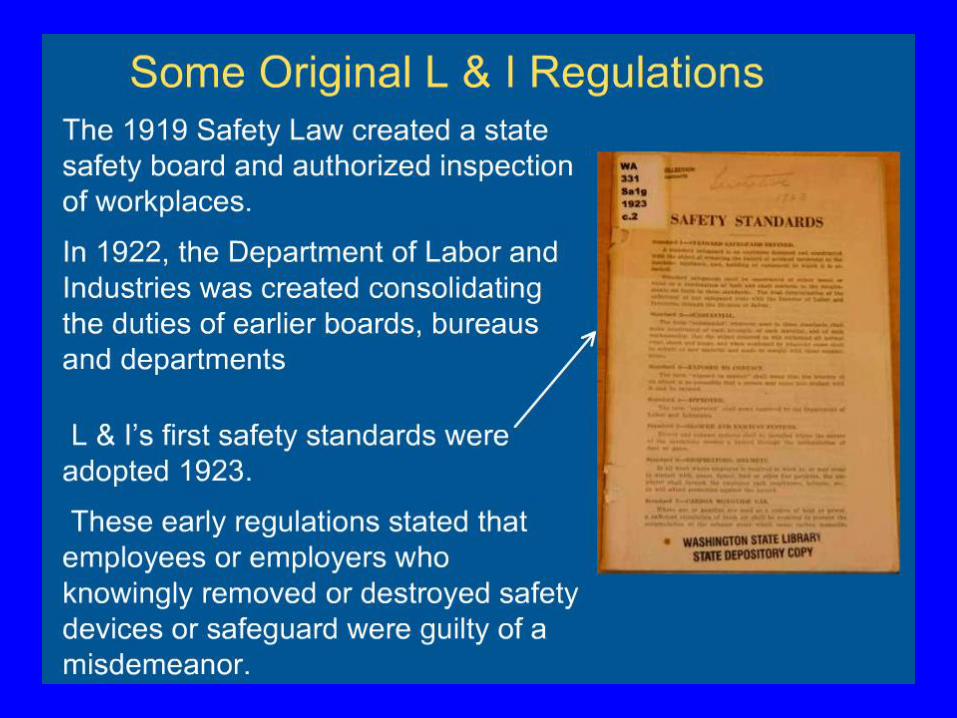
Labor and Industries was set up as the agency to administer the workers compensation in Washington. They developed codes to prevent accidents and illnesses,
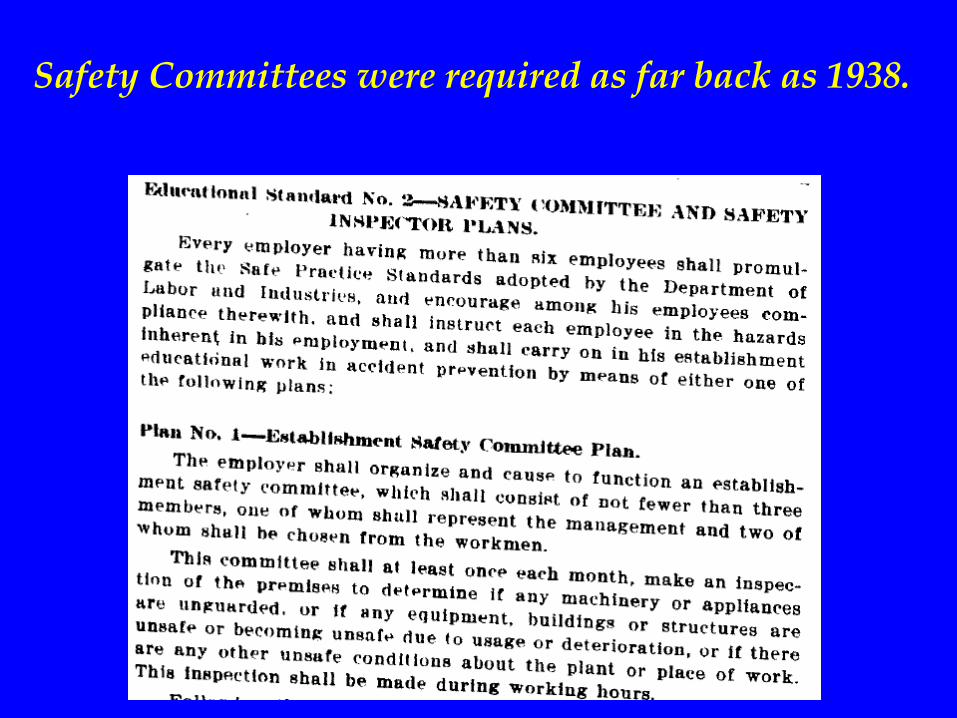
Safety Committees were required as far back as 1938.
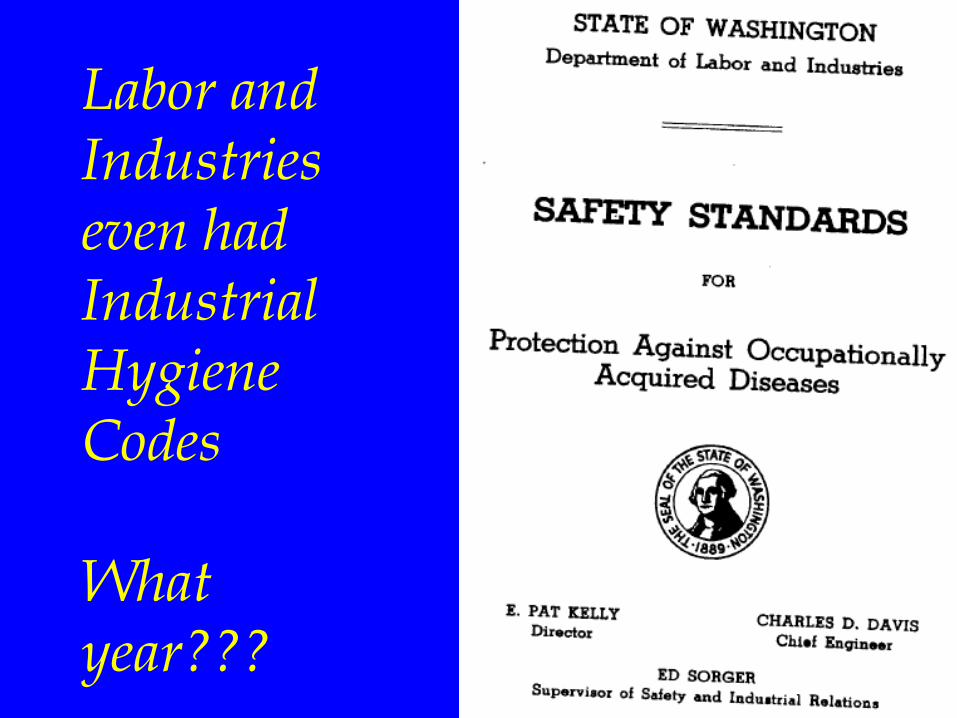
Labor and Industries even had Industrial Hygiene Codes What year???
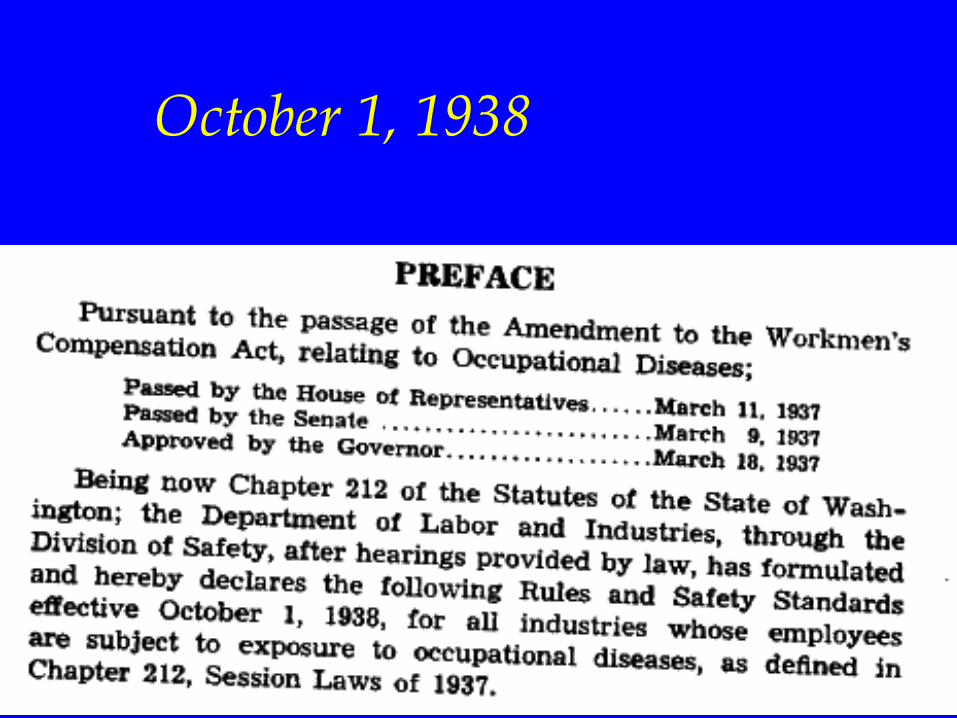
October 1, 1938
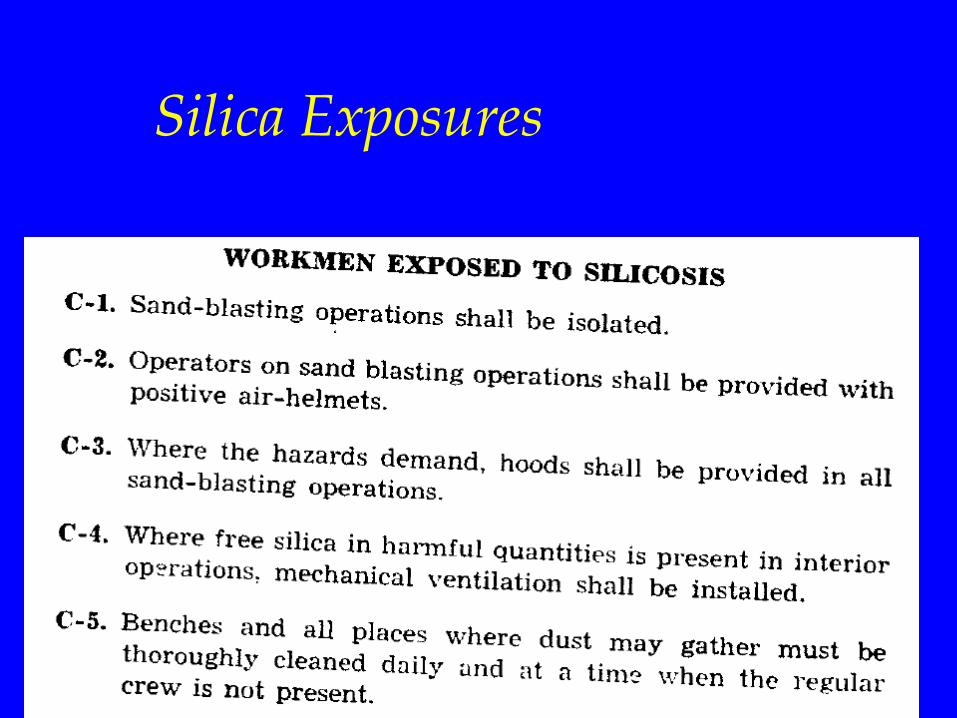
Silica Exposures
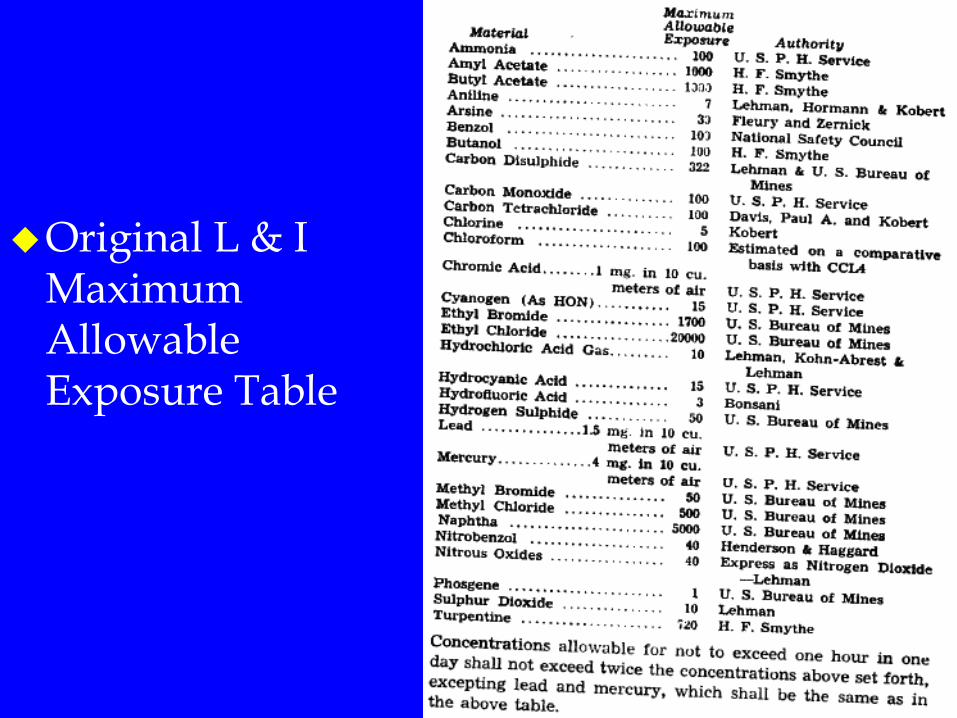
Original L & I Maximum Allowable Exposure Table
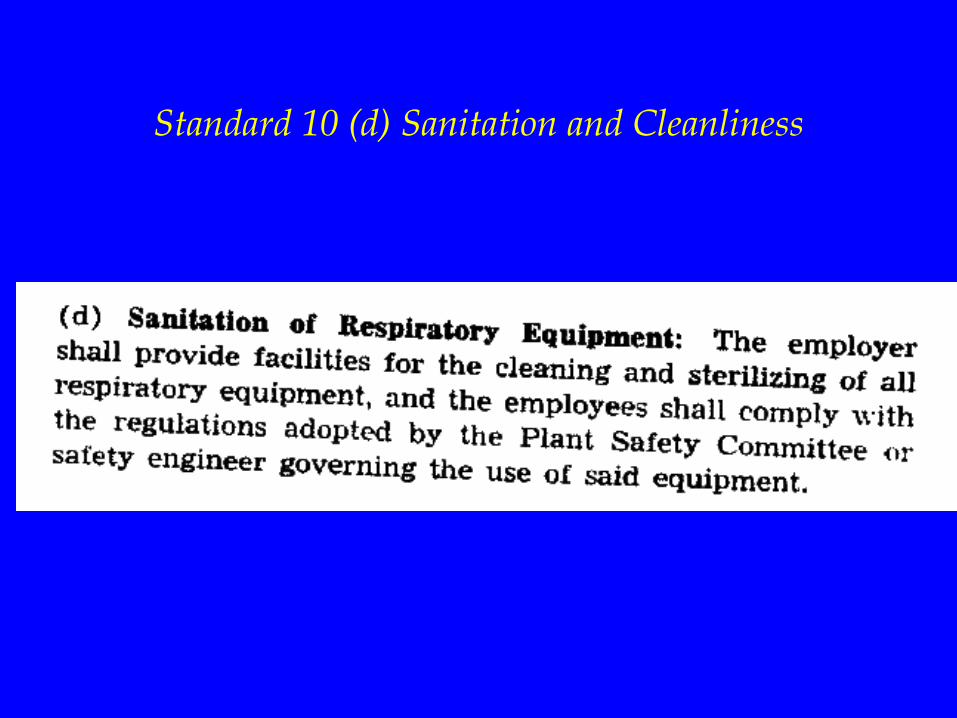
Standard 10 (d) Sanitation and Cleanliness
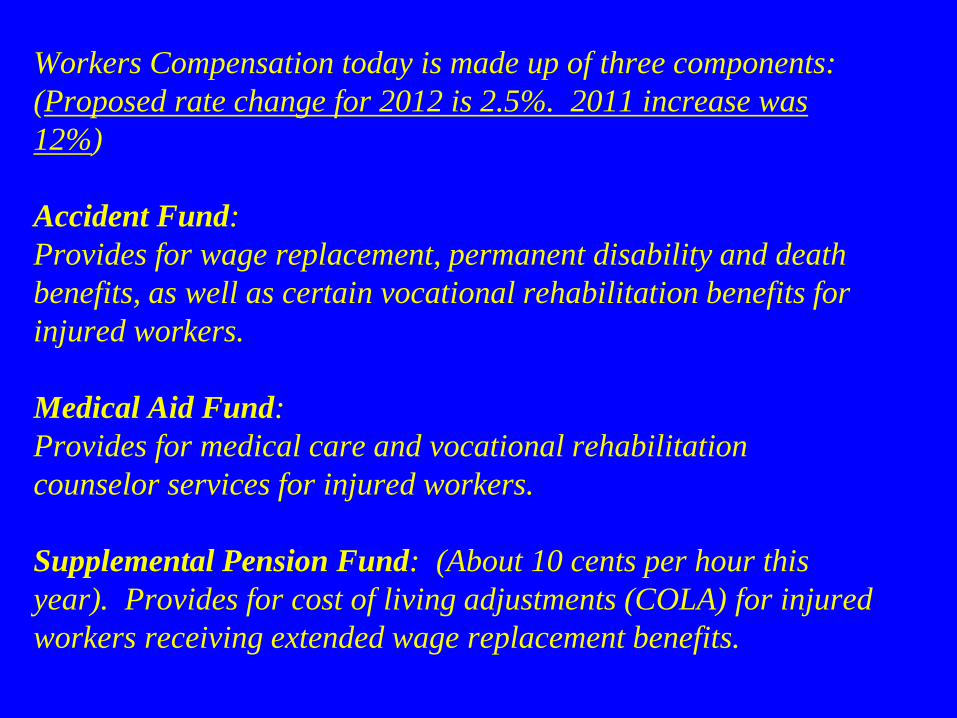
Workers Compensation today is made up of three components:
(Proposed rate change for 2012 is 2.5%. 2011 increase was
12%)
Accident Fund:
Provides for wage replacement, permanent disability and death
benefits, as well as certain vocational rehabilitation benefits for
injured workers.
Medical Aid Fund:
Provides for medical care and vocational rehabilitation
counselor services for injured workers.
Supplemental Pension Fund: (About 10 cents per hour this
year). Provides for cost of living adjustments (COLA) for injured
workers receiving extended wage replacement benefits.
You can get information on every company in Washington at Labor and Industries Website regarding contractor licensing, verification that a company is up to date in their workers compensation premiums and their experience modification rate.

www.lni.wa.gov click on Trades and Licensing click on Hiring a Contractor click on: Verify that your contractor is up to date on workers' compensation premiums

https://fortress.wa.gov/lni/crpsi/

The UW Account is current. They have voluntarily reported and paid their premiums.
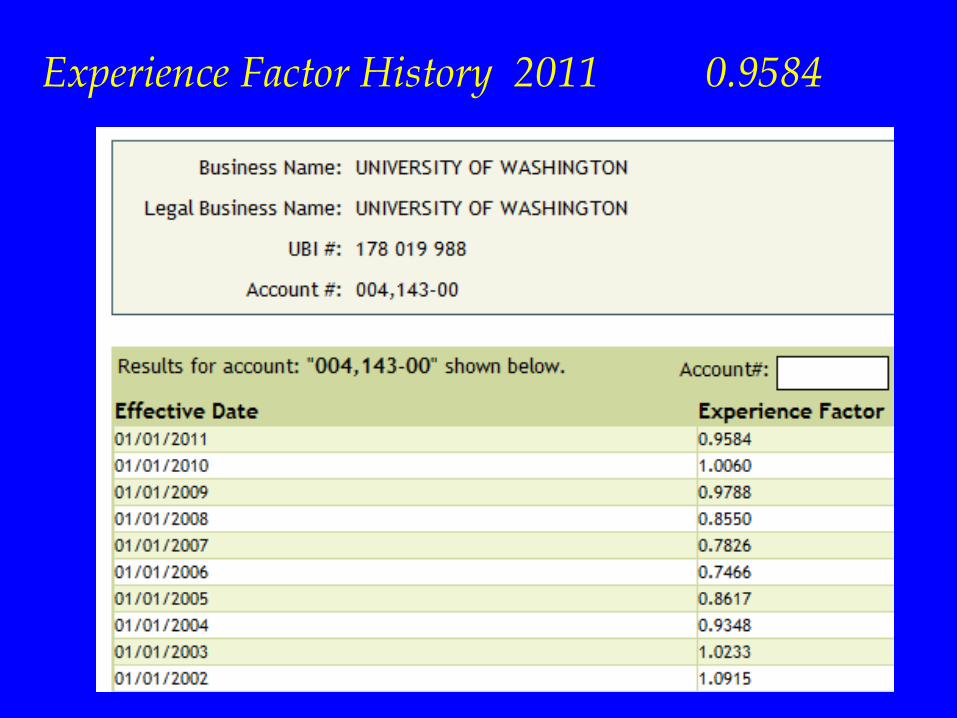
Experience Factor History 2011 0.9584
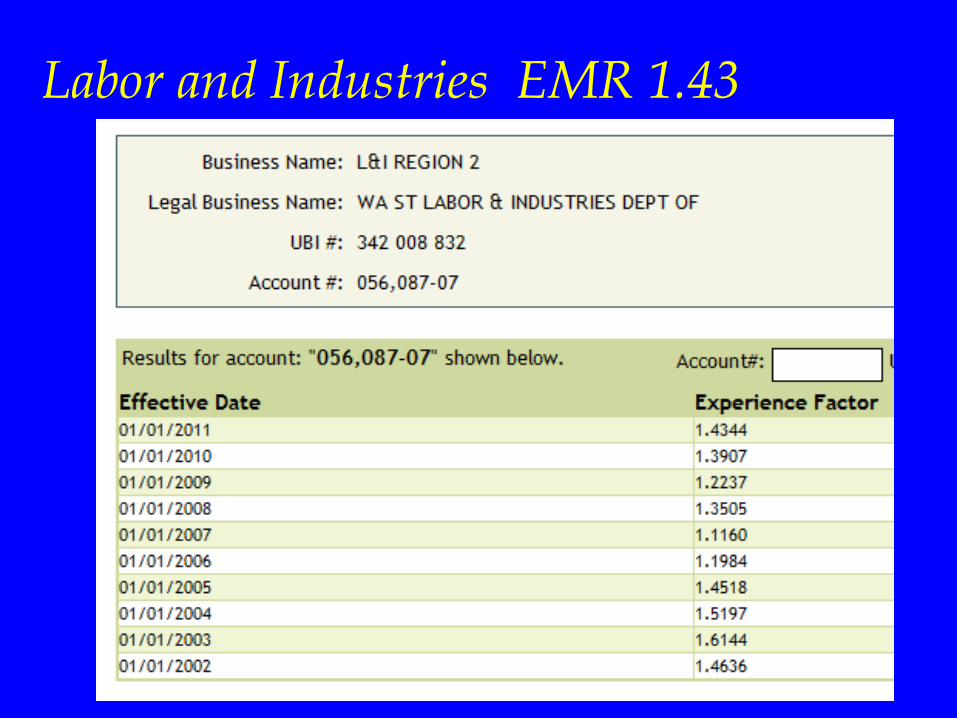
Labor and Industries EMR 1.43

L & I Field Staff 48 cents per hour. Workers pay
about 12 cents of the 48 cents - or about 25%.
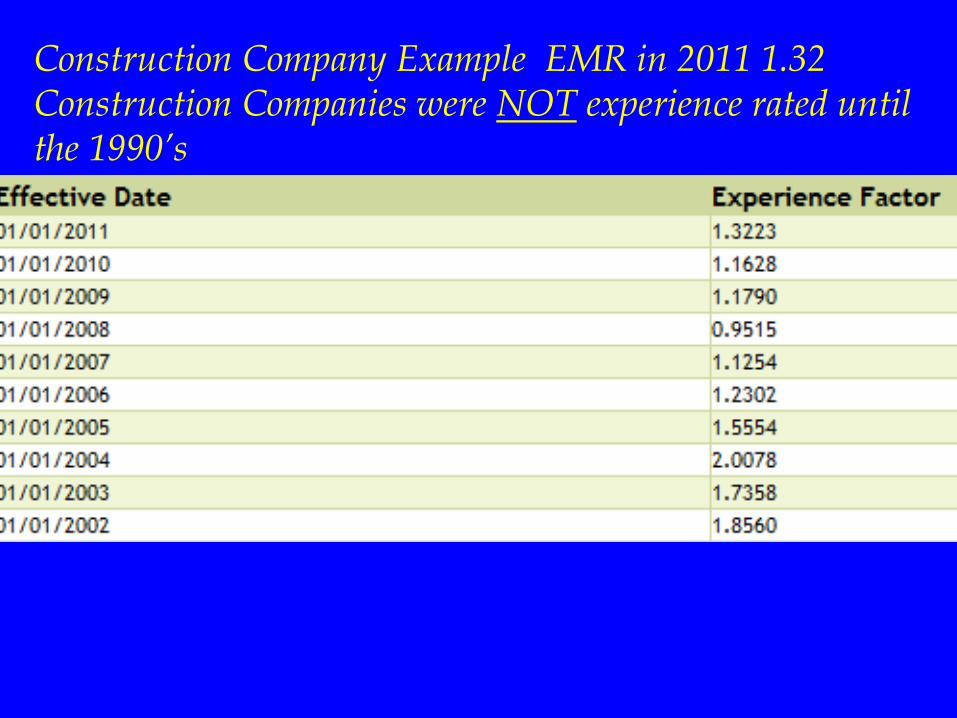
Construction Company Example EMR in 2011 1.32 Construction Companies were NOT experience rated until the 1990’s

Interior Finish Carpentry $2.19 hour (about 30% above the regular rate). Workers pay 35 cents per hour or about 16%
In 1990 a Washington State Supreme Court Case established the non-delegable duties of a General Contractor in Stute v PBMC. A GC could be sued for injuries to a subcontractor worker that was injured. If the worker recovered damages L & I would have to be paid back for any cost of the workers compensation claim. The L & I Third Party Subrogation Section routinely collects millions every year back for the State from GC’s, owners in control, product manufacturers etc.—Anyone that caused the injury other than the employer or co-workers.

Top 10 Reasons you Can Tell Your WISHA (DOSH) Inspection is Going Badly

1. L & I DOSH WISHA sets up
Temporary Housing in your Parking Lot

2. The Compliance Officer mutters,
“This is unbelievable” each time they
enter a new area.
3. L & I DOSH WISHA calls in a
professional film crew to document
conditions. The crew is from “60
Minutes”

4. The Compliance Officer insists on
wearing Level A in your chemical area,
while your employees are in jeans and
T-Shirts.
5. The Congressman you call for help
will not return your call, but he does
return you campaign contributions.
6. The Compliance Officer begins the
opening conference with the following,
“You have the right to remain silent….”
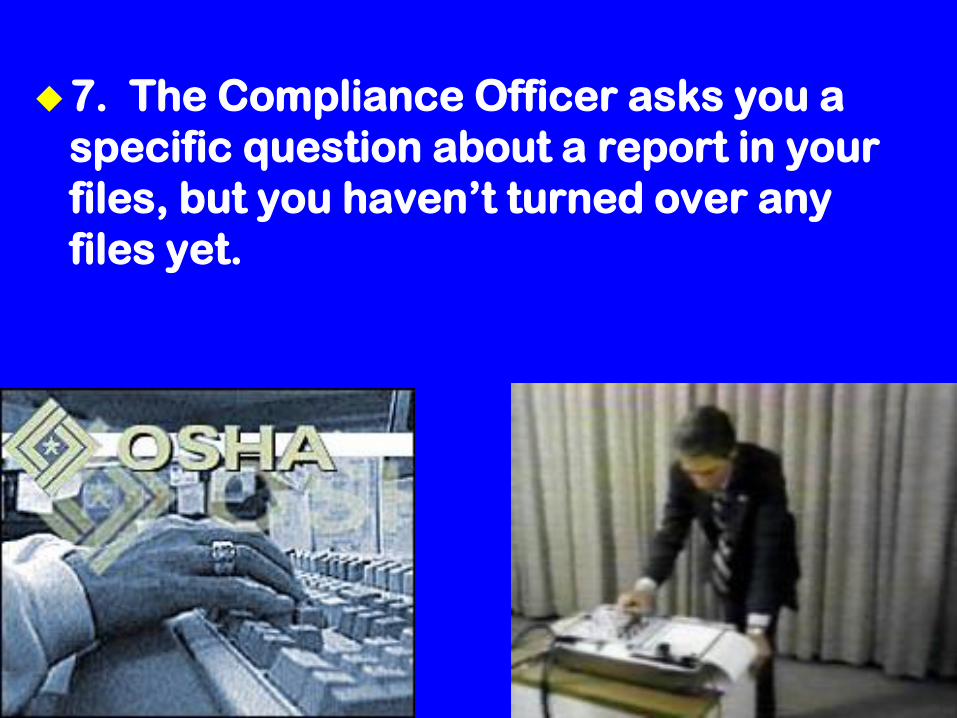
7. The Compliance Officer asks you a
specific question about a report in your
files, but you haven’t turned over any
files yet.
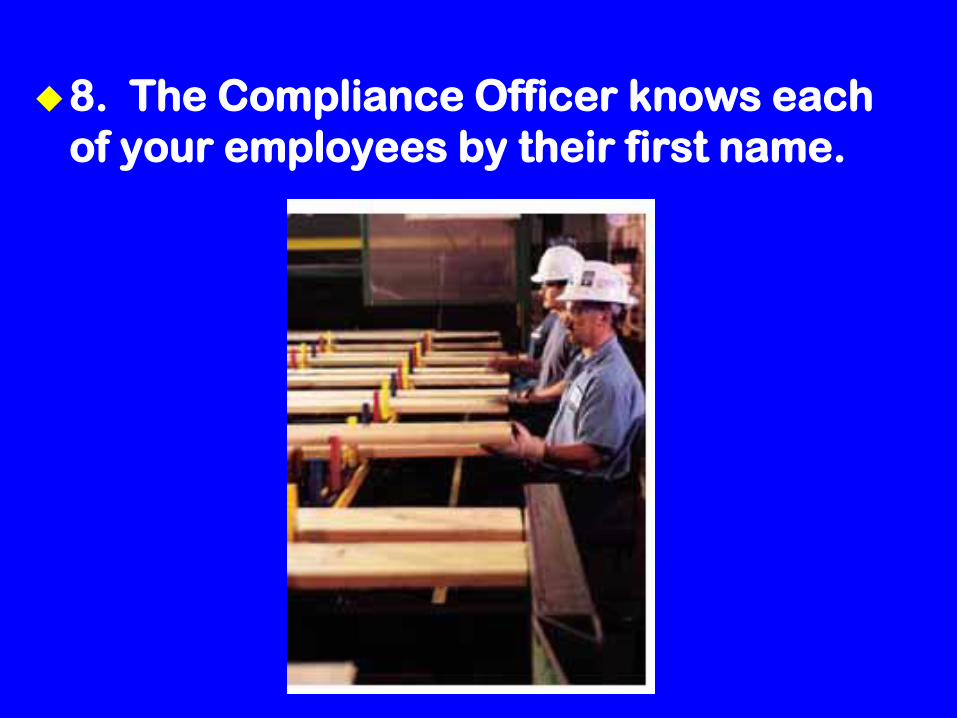
8. The Compliance Officer knows each
of your employees by their first name.
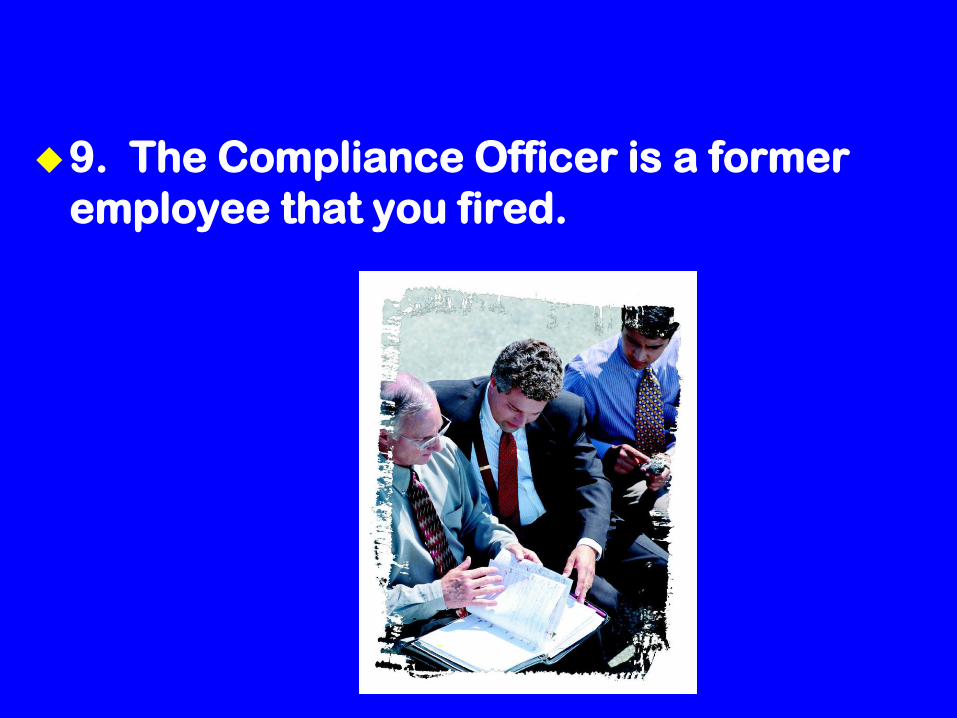
9. The Compliance Officer is a former
employee that you fired.

10.The L & I DISH WISHA Director
Conducts the Opening Conference
along with the Governor for the State of
Washington.

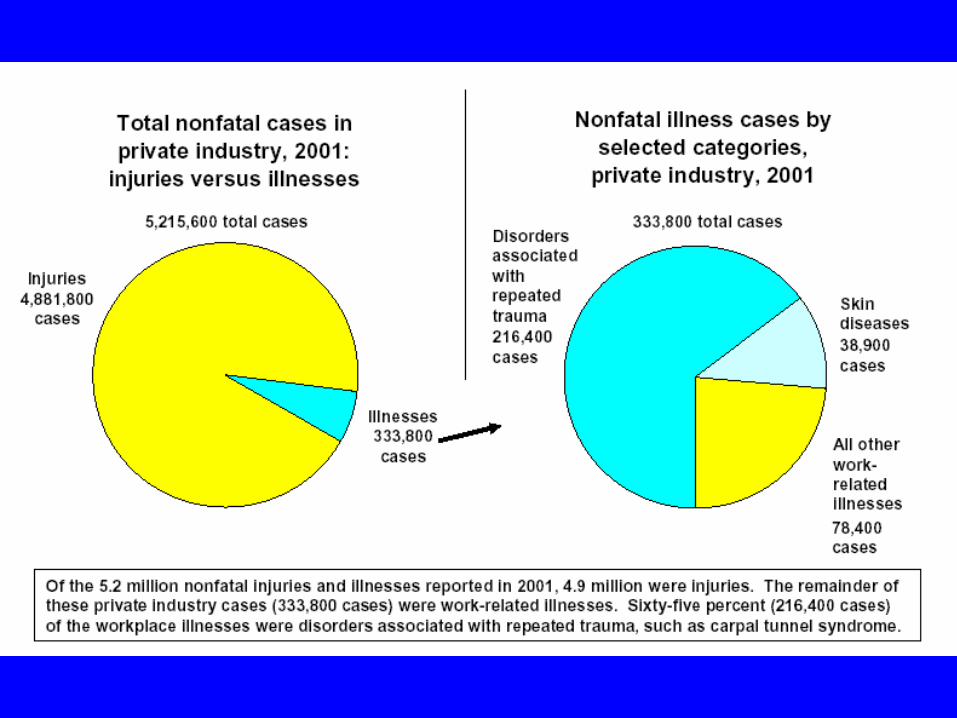
What percent of the work related recordables are injuries and what % are illnesses?

Has the Occupational Illness rate gone up, down or stayed the same in the last 25 years?

Occupational Illnesses, 1972-2001
Are there still cases of Occupational Disease in the USA?

Deaths from Diseases of the Lung, 1968-1997
Have total OSHA Recordable cases gone up, down or stayed the same over the last 30 years?
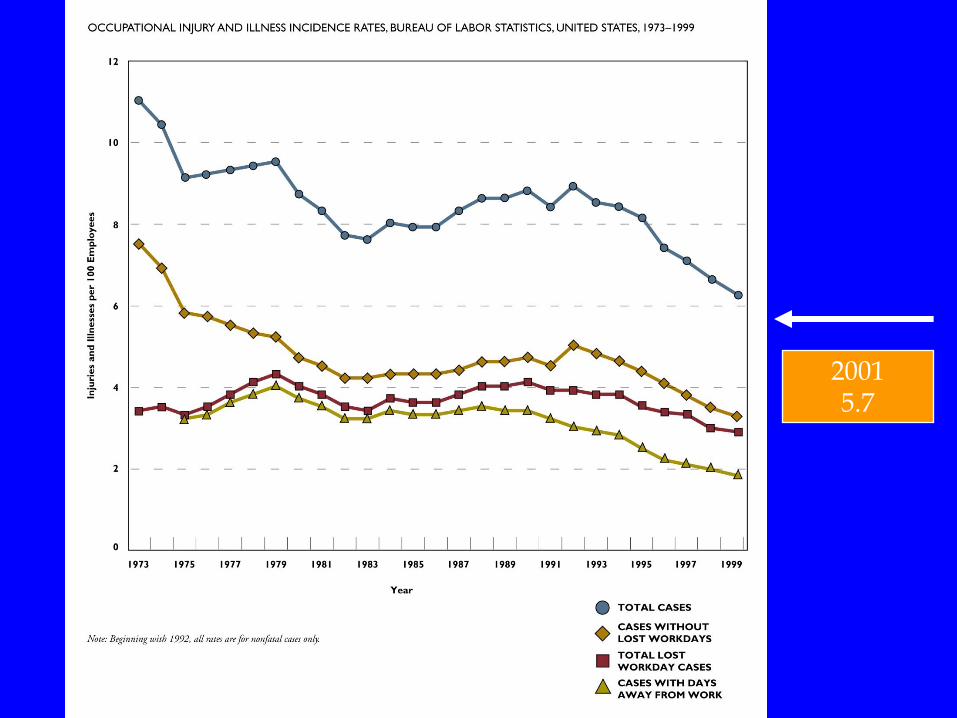
2001 5.7
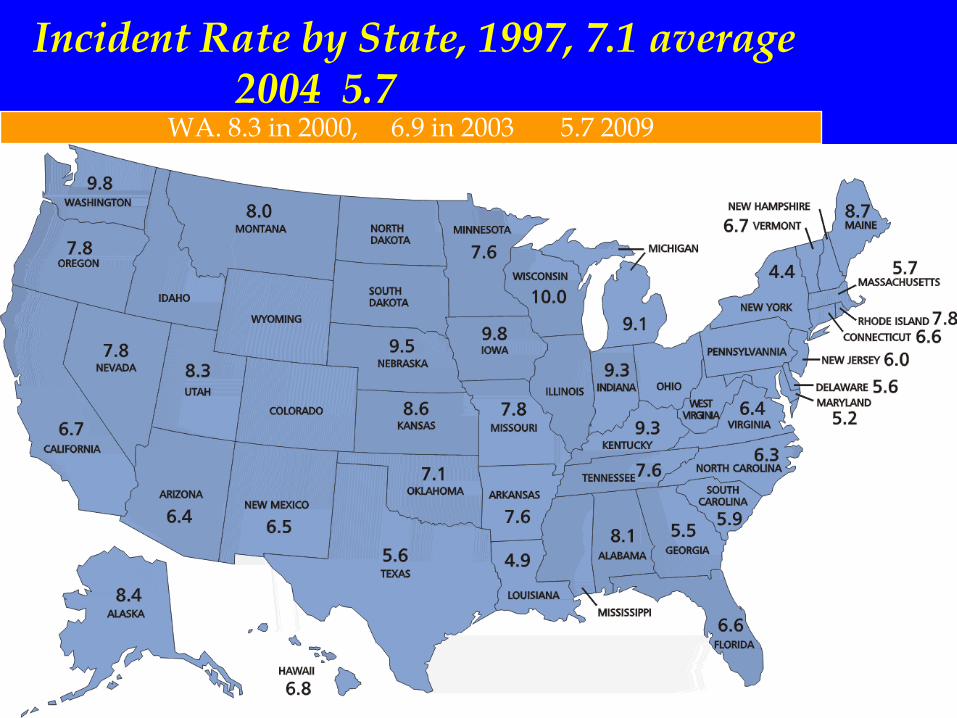
Incident Rate by State, 1997, 7.1 average 2004 5.7
WA. 8.3 in 2000, 6.9 in 2003 5.7 2009
How many worker compensation claims were there 25 years ago and how much did worker compensation cost in Washington in 1986? Let’s take Roofers as a example???
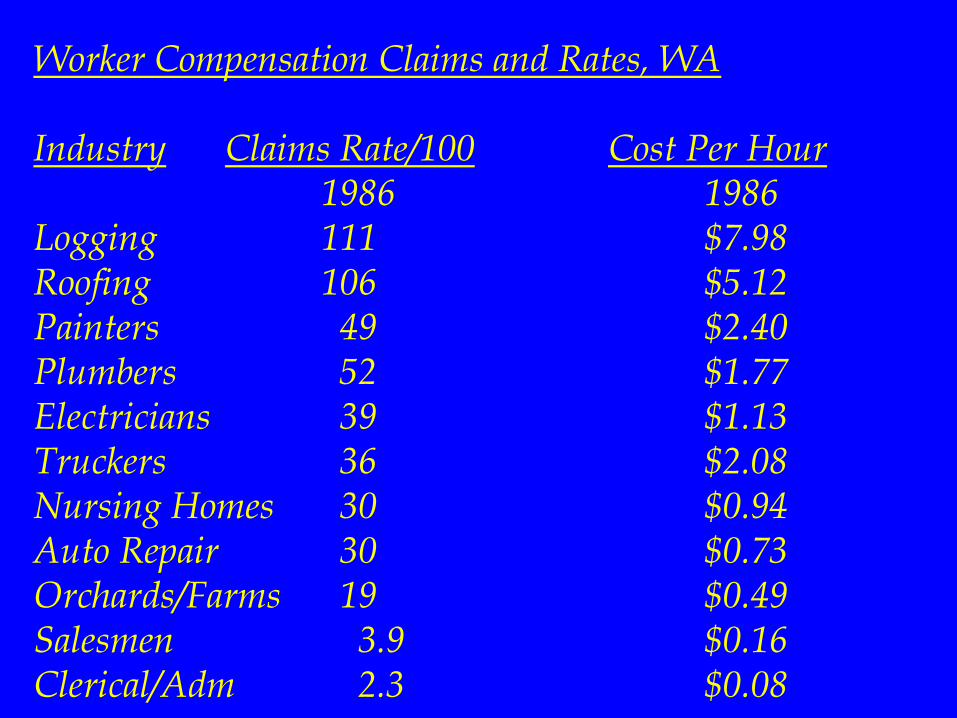
Worker Compensation Claims and Rates, WA Industry Claims Rate/100 Cost Per Hour 1986 1986 Logging 111 $7.98 Roofing 106 $5.12 Painters 49 $2.40 Plumbers 52 $1.77 Electricians 39 $1.13 Truckers 36 $2.08 Nursing Homes 30 $0.94 Auto Repair 30 $0.73 Orchards/Farms 19 $0.49 Salesmen 3.9 $0.16 Clerical/Adm 2.3 $0.08
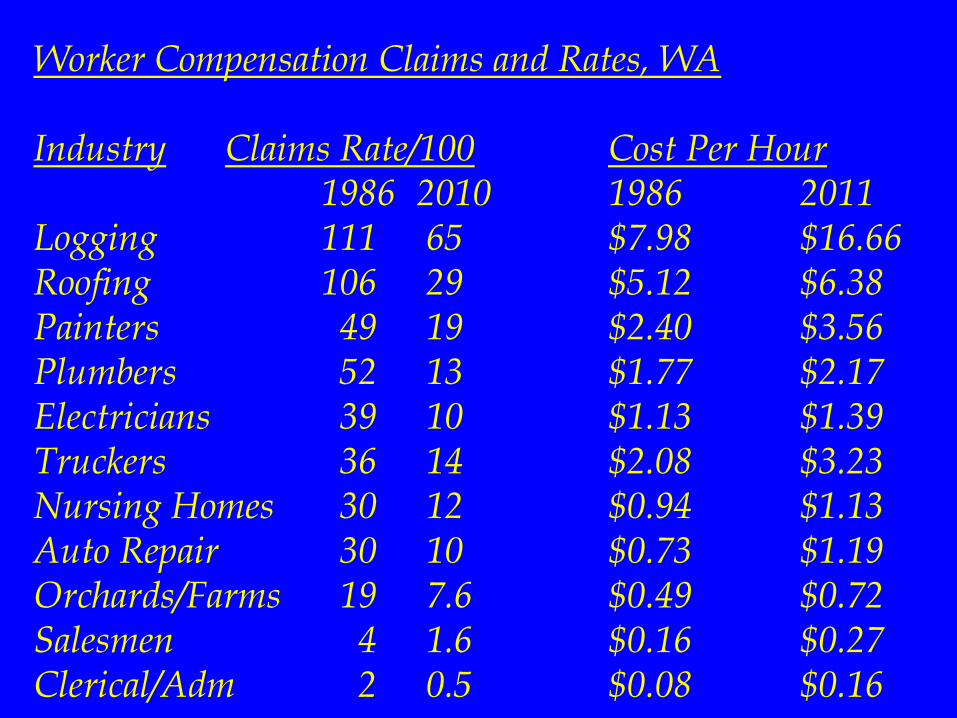
Worker Compensation Claims and Rates, WA Industry Claims Rate/100 Cost Per Hour 1986 2010 1986 2011 Logging 111 65 $7.98 $16.66 Roofing 106 29 $5.12 $6.38 Painters 49 19 $2.40 $3.56 Plumbers 52 13 $1.77 $2.17 Electricians 39 10 $1.13 $1.39 Truckers 36 14 $2.08 $3.23 Nursing Homes 30 12 $0.94 $1.13 Auto Repair 30 10 $0.73 $1.19 Orchards/Farms 19 7.6 $0.49 $0.72 Salesmen 4 1.6 $0.16 $0.27 Clerical/Adm 2 0.5 $0.08 $0.16
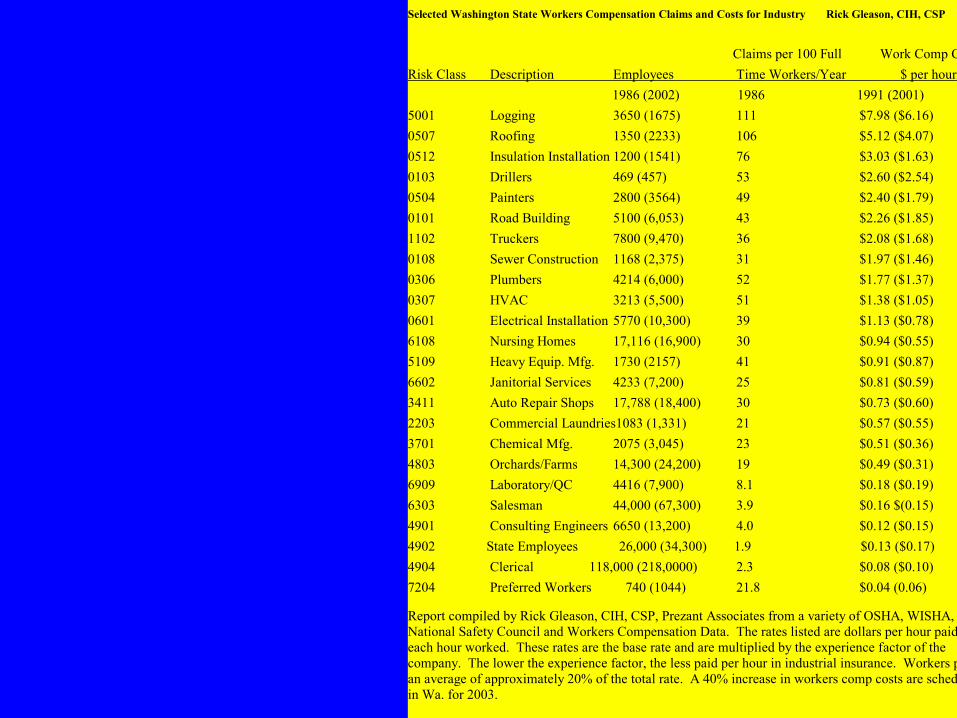
Selected Washington State Workers Compensation Claims and Costs for Industry Rick Gleason, CIH, CSP
Claims per 100 Full Work Comp Cost
Risk Class Description Employees Time Workers/Year $ per hour
1986 (2002) 1986 1991 (2001)
5001 Logging 3650 (1675) 111 $7.98 ($6.16)
0507 Roofing 1350 (2233) 106 $5.12 ($4.07)
0512 Insulation Installation 1200 (1541) 76 $3.03 ($1.63)
0103 Drillers 469 (457) 53 $2.60 ($2.54)
0504 Painters 2800 (3564) 49 $2.40 ($1.79)
0101 Road Building 5100 (6,053) 43 $2.26 ($1.85)
1102 Truckers 7800 (9,470) 36 $2.08 ($1.68)
0108 Sewer Construction 1168 (2,375) 31 $1.97 ($1.46)
0306 Plumbers 4214 (6,000) 52 $1.77 ($1.37)
0307 HVAC 3213 (5,500) 51 $1.38 ($1.05)
0601 Electrical Installation 5770 (10,300) 39 $1.13 ($0.78)
6108 Nursing Homes 17,116 (16,900) 30 $0.94 ($0.55)
5109 Heavy Equip. Mfg. 1730 (2157) 41 $0.91 ($0.87)
6602 Janitorial Services 4233 (7,200) 25 $0.81 ($0.59)
3411 Auto Repair Shops 17,788 (18,400) 30 $0.73 ($0.60)
2203 Commercial Laundries1083 (1,331) 21 $0.57 ($0.55)
3701 Chemical Mfg. 2075 (3,045) 23 $0.51 ($0.36)
4803 Orchards/Farms 14,300 (24,200) 19 $0.49 ($0.31)
6909 Laboratory/QC 4416 (7,900) 8.1 $0.18 ($0.19)
6303 Salesman 44,000 (67,300) 3.9 $0.16 $(0.15)
4901 Consulting Engineers 6650 (13,200) 4.0 $0.12 ($0.15)
4902 State Employees 26,000 (34,300) 1.9 $0.13 ($0.17)
4904 Clerical 118,000 (218,0000) 2.3 $0.08 ($0.10)
7204 Preferred Workers 740 (1044) 21.8 $0.04 (0.06)
Report compiled by Rick Gleason, CIH, CSP, Prezant Associates from a variety of OSHA, WISHA,
National Safety Council and Workers Compensation Data. The rates listed are dollars per hour paid for
each hour worked. These rates are the base rate and are multiplied by the experience factor of the
company. The lower the experience factor, the less paid per hour in industrial insurance. Workers pay
an average of approximately 20% of the total rate. A 40% increase in workers comp costs are scheduled
in Wa. for 2003.

2011 WA State Legislature modified workers compensation to allow for voluntary lump sum settlements in certain cases.
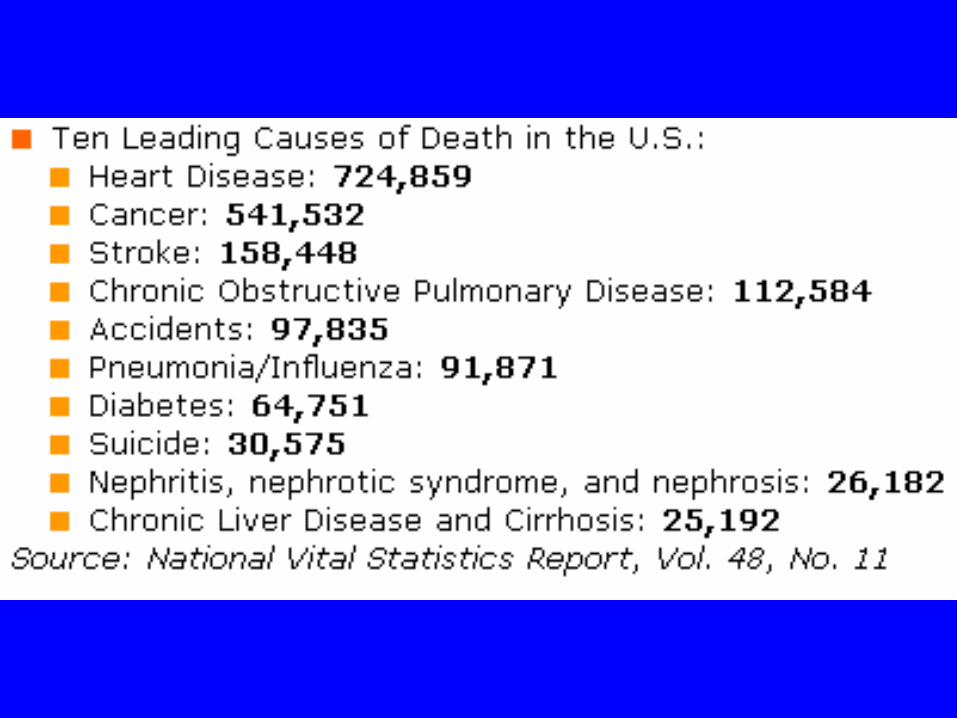
What are the 10 Leading causes of Death in the USA (1998) Not on the job—Total Deaths

How did Washington rank for Fatalities from 1980-1995? What State has the highest fatal accident rate at work?
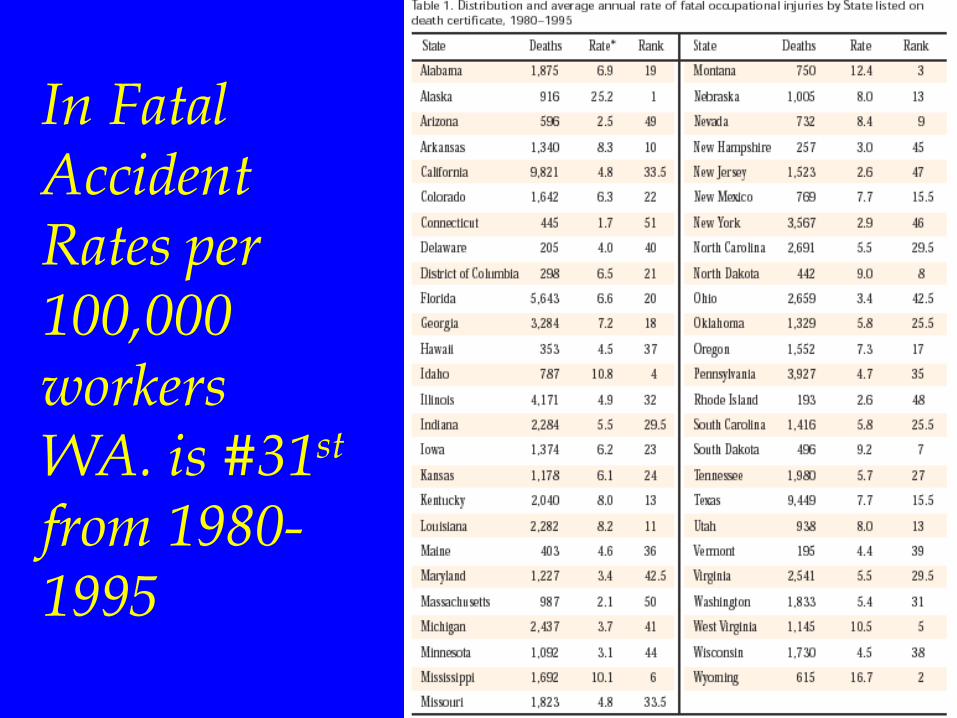
In Fatal Accident Rates per 100,000 workers WA. is #31st from 1980-1995
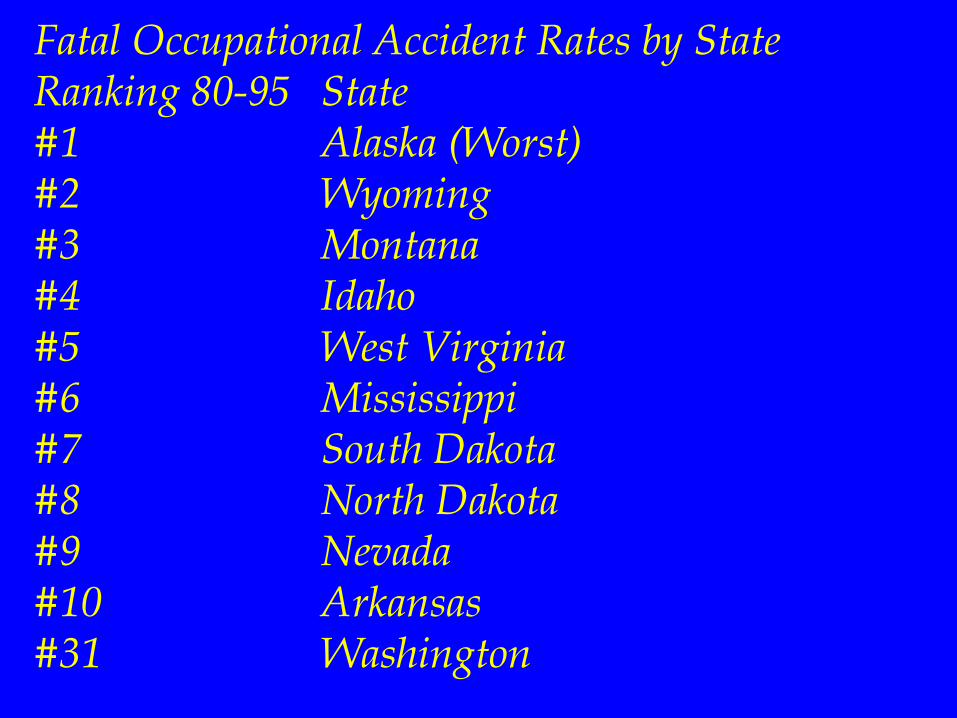
Fatal Occupational Accident Rates by State Ranking 80-95 State #1 Alaska (Worst) #2 Wyoming #3 Montana #4 Idaho #5 West Virginia #6 Mississippi #7 South Dakota #8 North Dakota #9 Nevada #10 Arkansas #31 Washington
How does Washington rank for fatal accident rate recently, from 2000-2002?
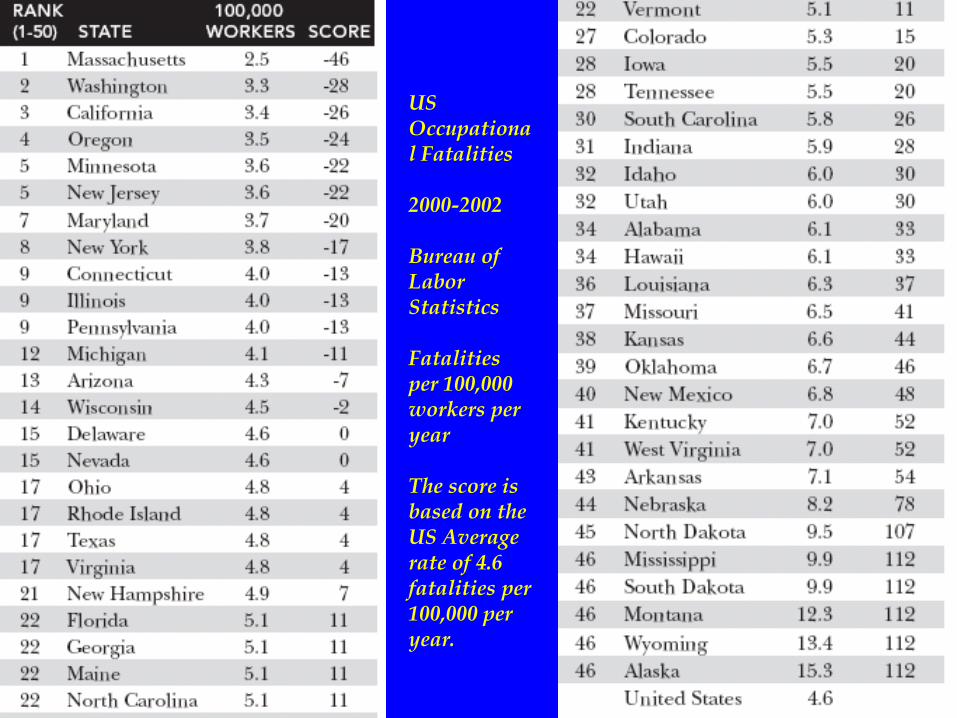
US Occupational Fatalities 2000-2002 Bureau of Labor Statistics Fatalities per 100,000 workers per year The score is based on the US Average rate of 4.6 fatalities per 100,000 per year.
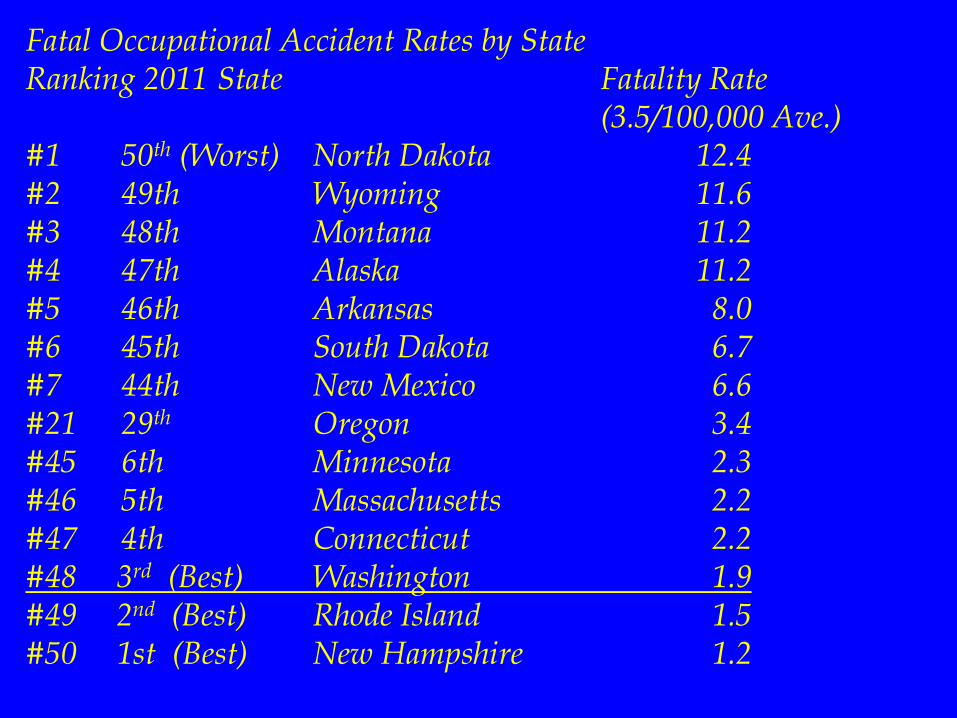
Fatal Occupational Accident Rates by State Ranking 2011 State Fatality Rate (3.5/100,000 Ave.) #1 50th (Worst) North Dakota 12.4 #2 49th Wyoming 11.6 #3 48th Montana 11.2 #4 47th Alaska 11.2 #5 46th Arkansas 8.0 #6 45th South Dakota 6.7 #7 44th New Mexico 6.6 #21 29th Oregon 3.4 #45 6th Minnesota 2.3 #46 5th Massachusetts 2.2 #47 4th Connecticut 2.2 #48 3rd (Best) Washington 1.9 #49 2nd (Best) Rhode Island 1.5 #50 1st (Best) New Hampshire 1.2

OR. And WA. have the most inspectors per capita
Three times more American’s die in car wrecks each year than have perished in ALL the plane crashes in history.

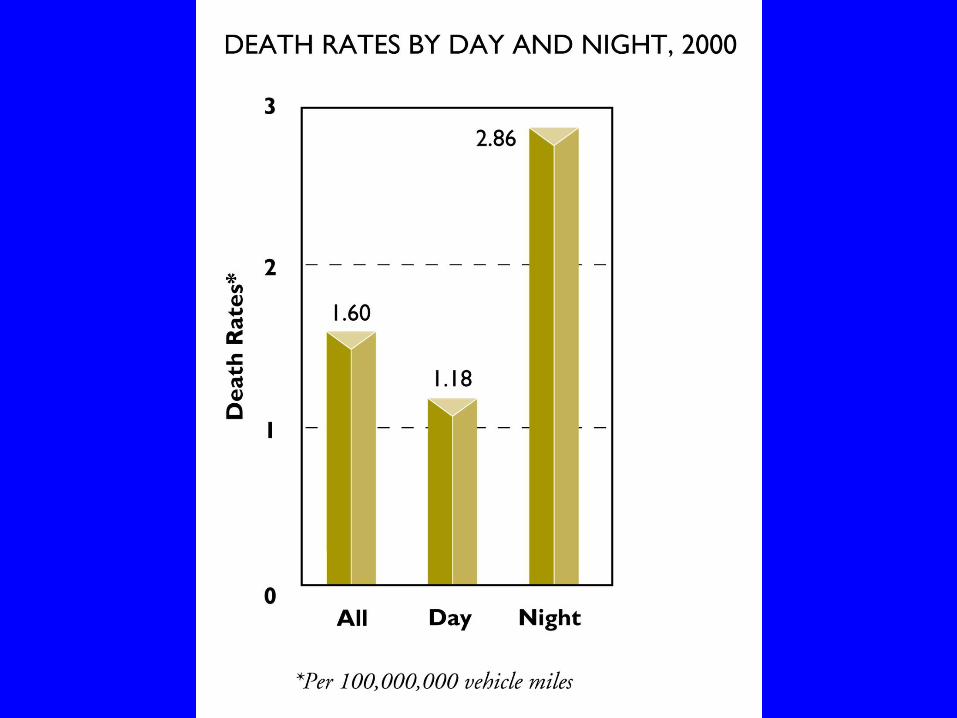
Is there more motor vehicle accidents per mile during the day or night?

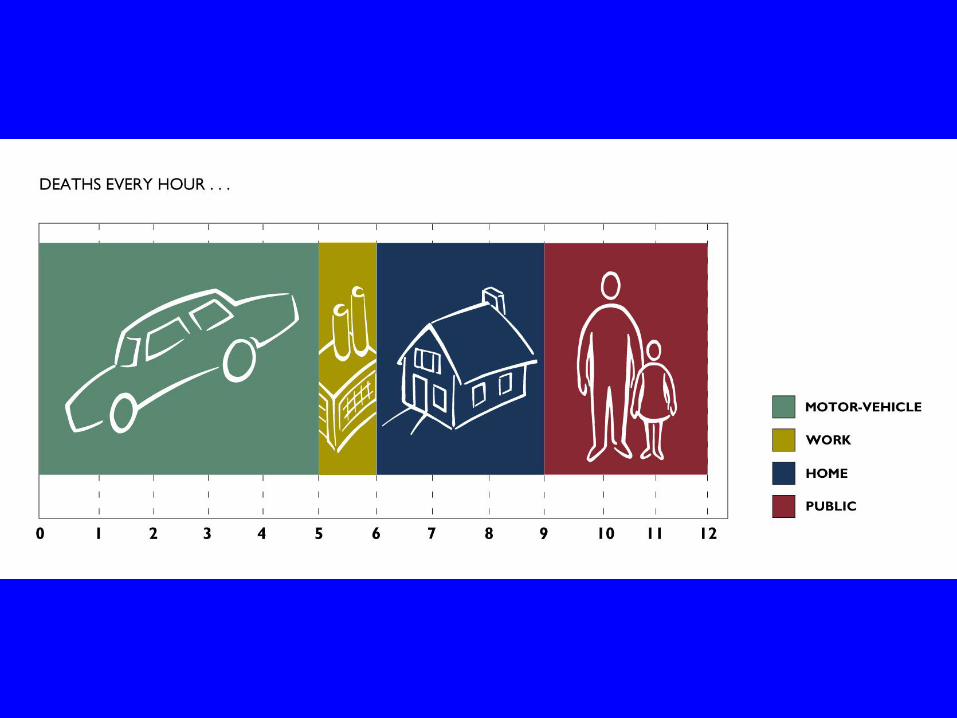
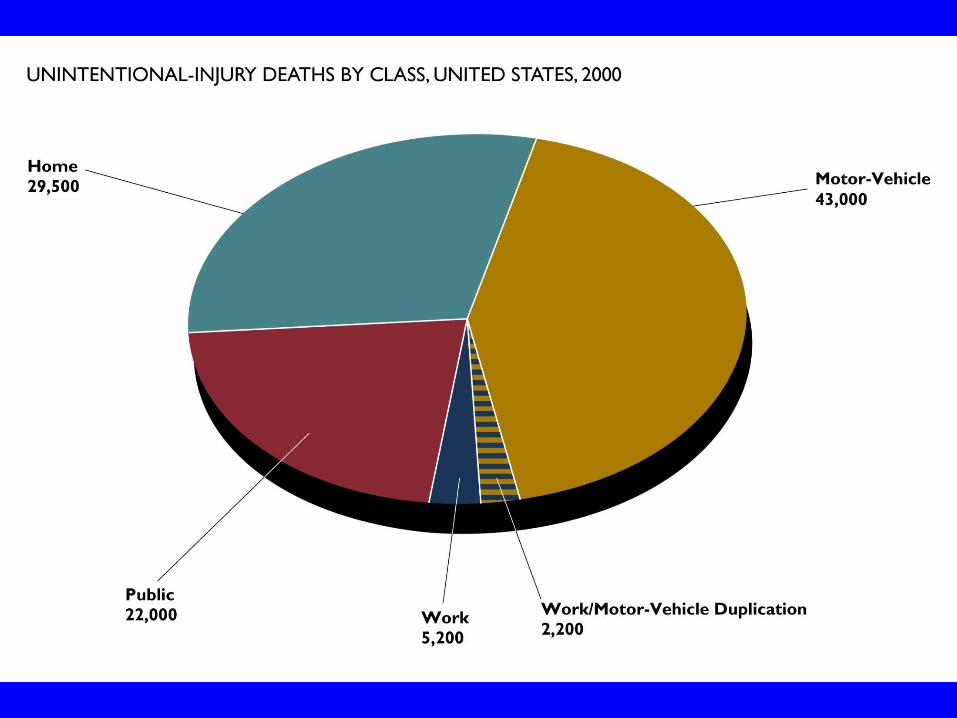
What accounts for more deaths each hour in America Car Work Home public
Elements of an Effective Safety and Health Program Continuing
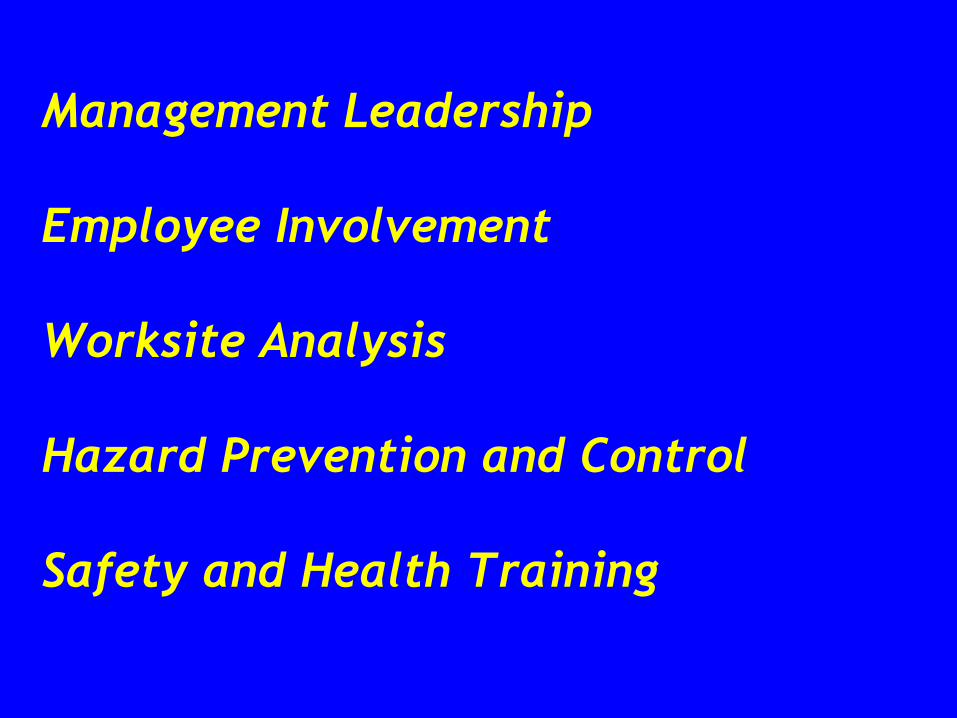
Management Leadership
Employee Involvement
Worksite Analysis
Hazard Prevention and Control
Safety and Health Training


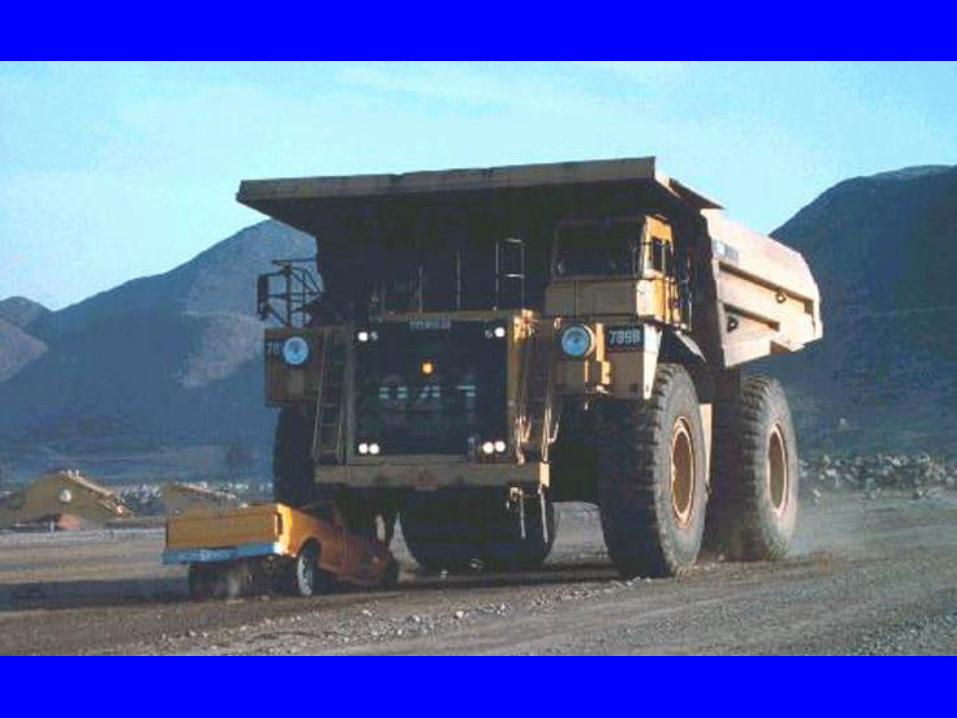
Plan Ahead!
Drive Defensively. Give the right of way to the other driver, especially if their rig is bigger than yours.


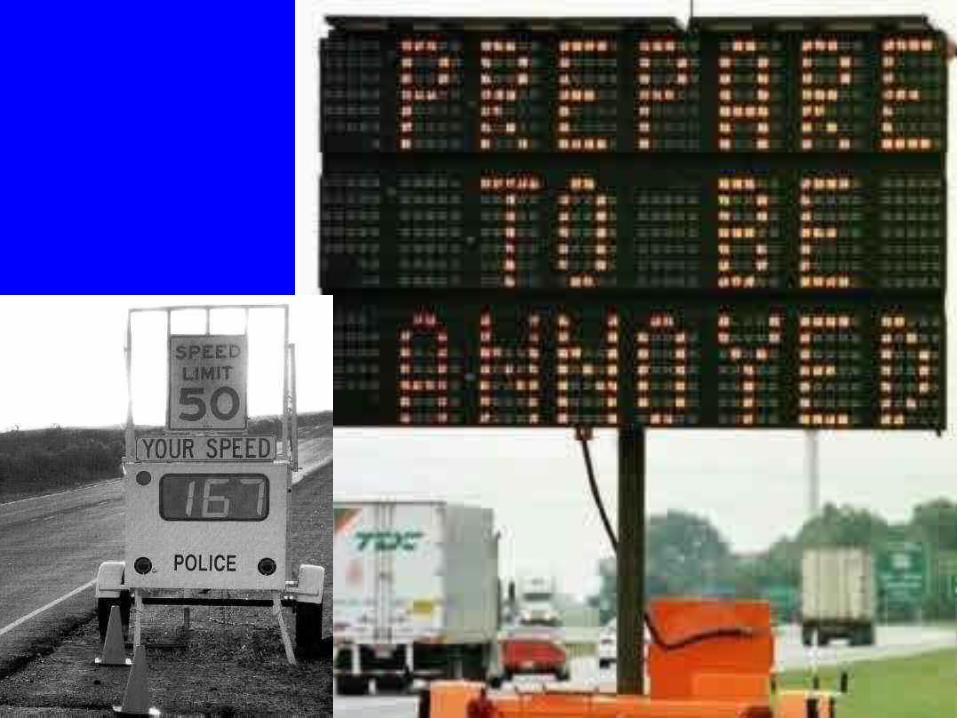
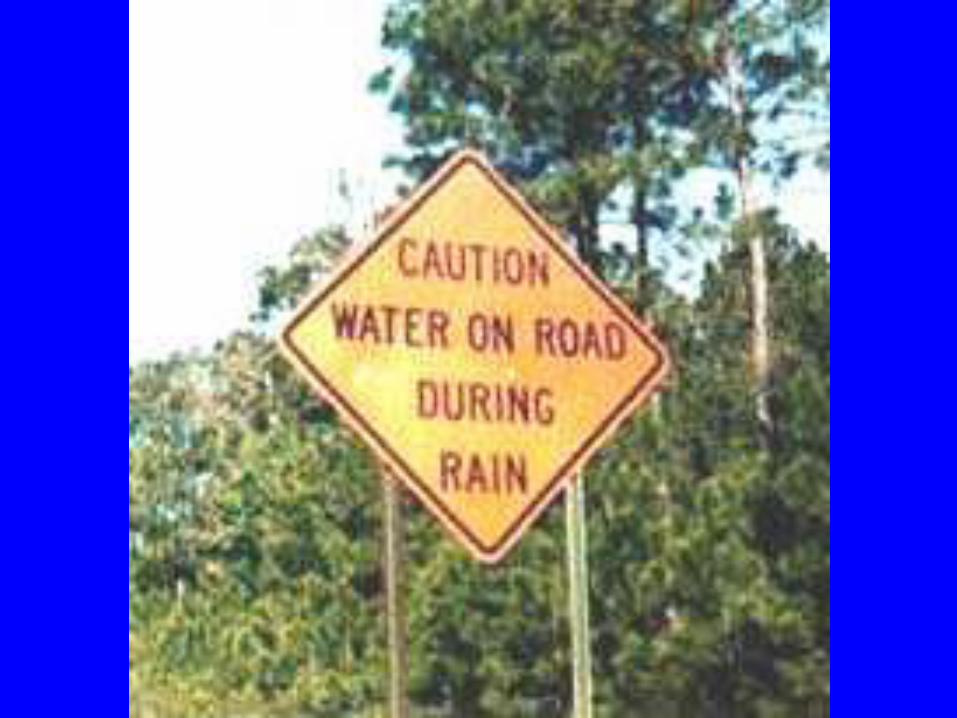
Read all signs and warnings


Watch out for other drivers on the road

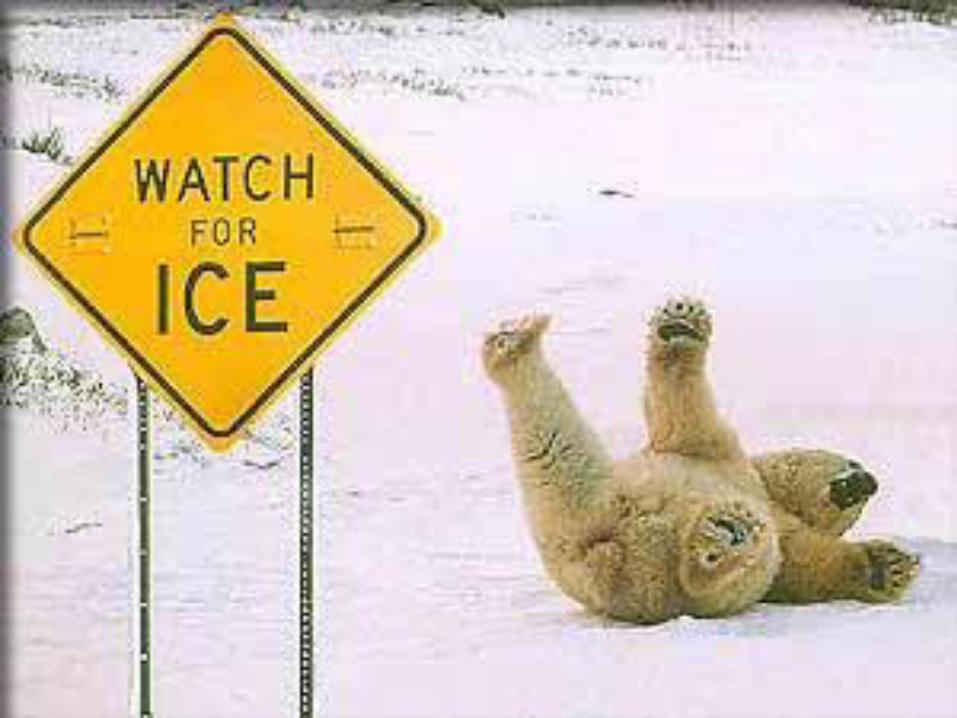
Watch for ice on the road, slippery conditions

As you drive home today follow the signs and rules of the road. A U of W research study proved the following:
Who is Most Responsible for Your Health and Safety? 1. OSHA / OR-OSHA / DOSH
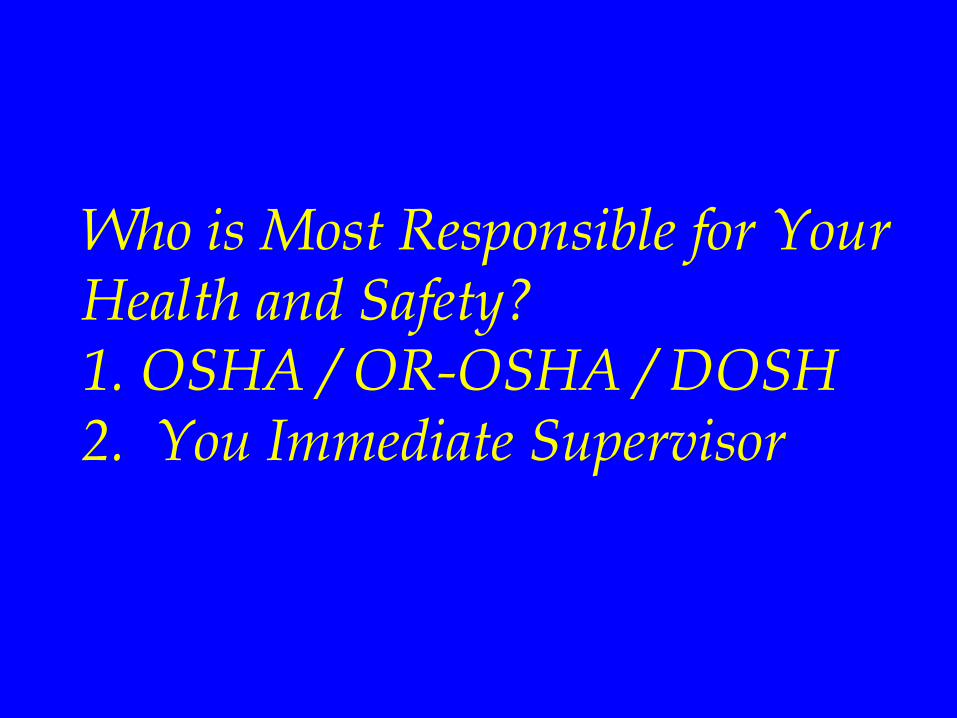
Who is Most Responsible for Your Health and Safety? 1. OSHA / OR-OSHA / DOSH 2. You Immediate Supervisor

Who is Most Responsible for Your Health and Safety? 1. OSHA / OR-OSHA / DOSH 2. You Immediate Supervisor 3. Your Safety and Health Mgr.
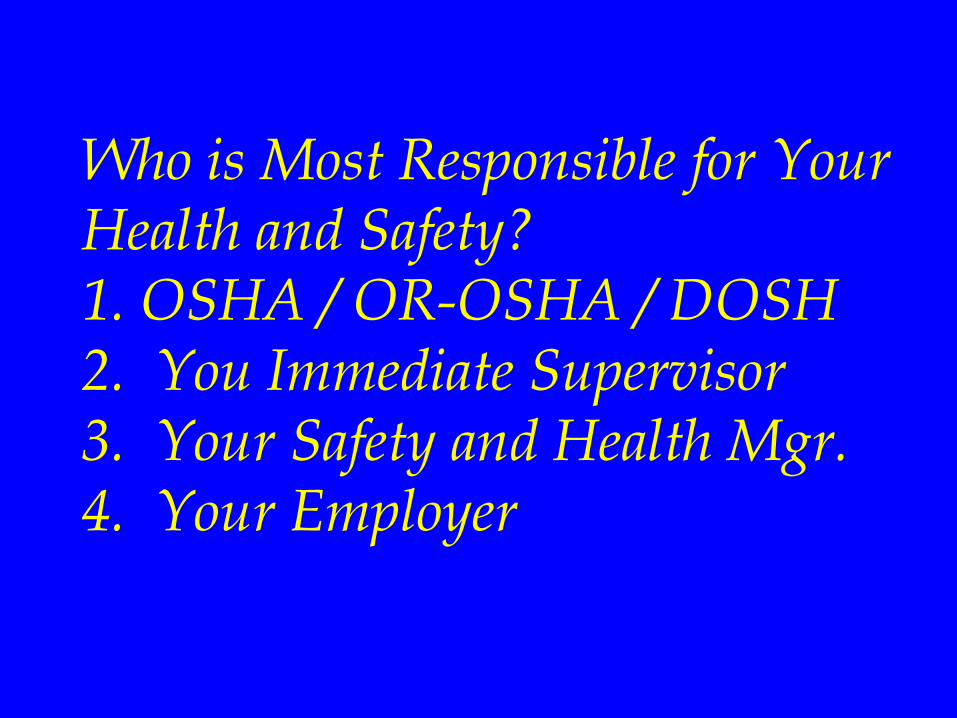
Who is Most Responsible for Your Health and Safety? 1. OSHA / OR-OSHA / DOSH 2. You Immediate Supervisor 3. Your Safety and Health Mgr. 4. Your Employer
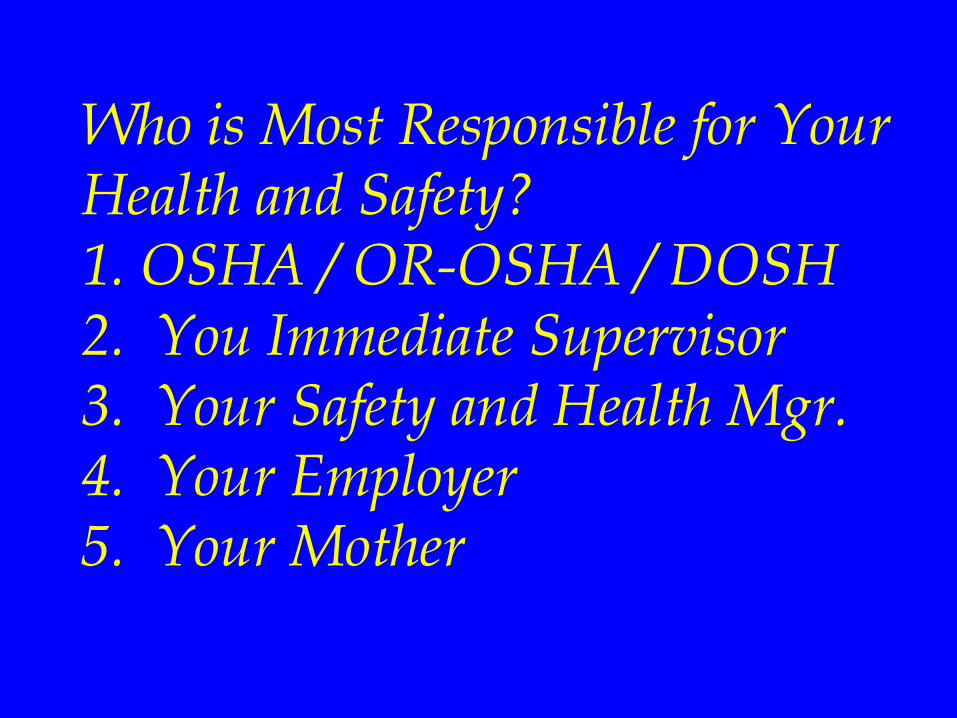
Who is Most Responsible for Your Health and Safety? 1. OSHA / OR-OSHA / DOSH 2. You Immediate Supervisor 3. Your Safety and Health Mgr. 4. Your Employer 5. Your Mother
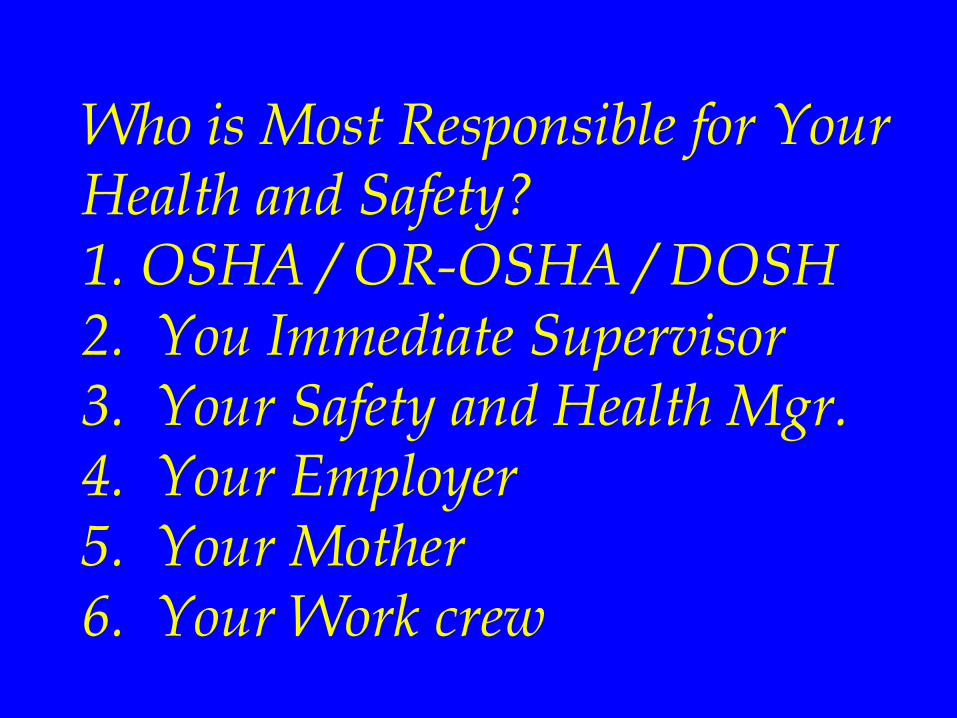
Who is Most Responsible for Your Health and Safety? 1. OSHA / OR-OSHA / DOSH 2. You Immediate Supervisor 3. Your Safety and Health Mgr. 4. Your Employer 5. Your Mother 6. Your Work crew
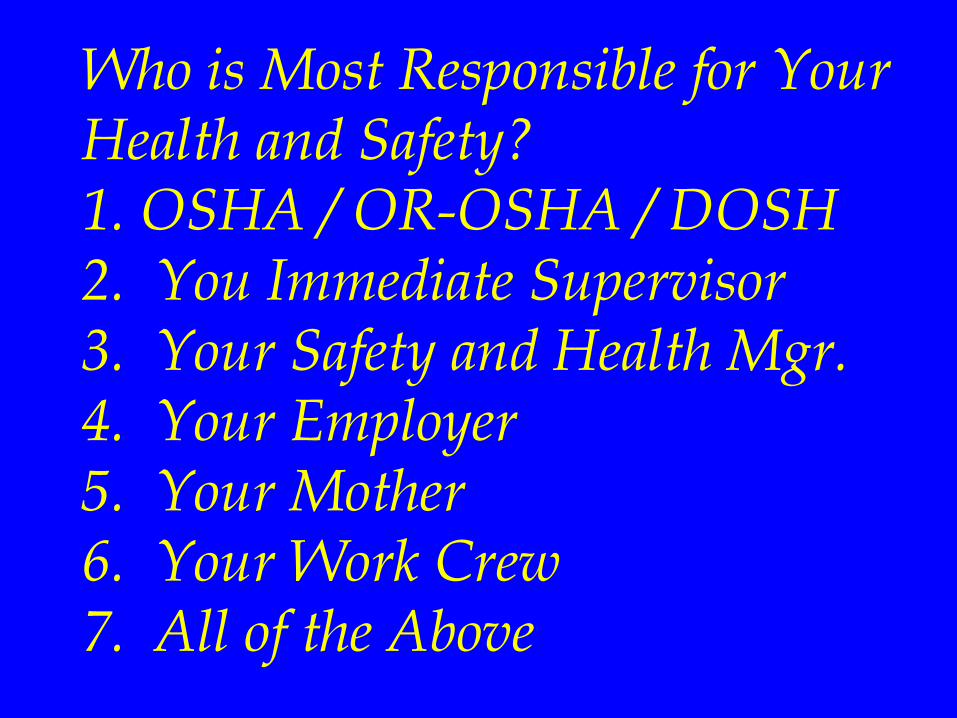
Who is Most Responsible for Your Health and Safety? 1. OSHA / OR-OSHA / DOSH 2. You Immediate Supervisor 3. Your Safety and Health Mgr. 4. Your Employer 5. Your Mother 6. Your Work Crew 7. All of the Above

Who is Most Responsible for Your Health and Safety? 1. OSHA / OR-OSHA / DOSH 2. You Immediate Supervisor 3. Your Safety and Health Mgr. 4. Your Employer 5. Your Mother 6. Your Work Crew 7. All of the above 8. Yourself
The Person Most Responsible for Your Health and Safety (Hint: Look in the Mirror)