CHROMOSOME SEGREGATION IN
29
CHROMOSOME SEGREGATION IN RHODOCOCCUS ERYTHROPOLIS PR4 DIVYA SINGHI DEPARTMENT OF BIOCHEMICAL ENGINEERING AND BIOTECHNOLOGY INDIAN INSTITUTE OF TECHNOLOGY DELHI MARCH 2020
Transcript of CHROMOSOME SEGREGATION IN

CHROMOSOME SEGREGATION IN
RHODOCOCCUS ERYTHROPOLIS PR4
DIVYA SINGHI
DEPARTMENT OF BIOCHEMICAL ENGINEERING AND
BIOTECHNOLOGY
INDIAN INSTITUTE OF TECHNOLOGY DELHI
MARCH 2020

©Indian Institute of Technology Delhi (IITD), New Delhi, 2020

CHROMOSOME SEGREGATION IN
RHODOCOCCUS ERYTHROPOLIS PR4
by
DIVYA SINGHI
DEPARTMENT OF BIOCHEMICAL ENGINEERING AND
BIOTECHNOLOGY
Submitted
In fulfillment of the requirement of the degree of Doctor of Philosophy
to the
Indian Institute of Technology Delhi
March 2020

i
CERTIFICATE
This is to certify that the thesis entitled “Chromosome segregation in Rhodococcus
erythropolis PR4” being submitted by Ms. Divya Singhi to the Indian Institute of Technology
delhi, for the award of degree of Doctor of Philosophy, is a record bonafide research work
carried out by her under my supervision and guidance in conformity with the rules and
regulations of Indian Institute of Technology Delhi.
The results presented in this thesis have not been submitted in part or full to any other University
or Institute for the award of any other degree or diploma.
Date Dr. Preeti Srivastava
Associate Professor
Department of Biochemical
Engineering and Biotechnology
Indian Institute of Technology Delhi
New Delhi-110016

ii
ACKNOWLEDGEMENTS
Pursuing PhD is a long journey with various ups that accelerate it and numerous downs which
tries to stop it. It is a dream which becomes reality not only through lots of hard work,
determination, dedication and patience but also with the support of many people. I was and I am
still very fortunate in meeting such people who helped, encouraged, inspired and supported me
in achieving my goals. I know this acknowledgement would never be sufficient to appreciate the
gratefulness of many who had faith in me throughout this roller coaster ride. But still I take this
opportunity to convey my deepest gratitude towards them.
The first person whom I would like to acknowledge is my supervisor Prof. Preeti Srivastava for
her invaluable contributions throughout my stay in IITD. Without her constant support and
motivation this journey would have never been accomplished. The enthusiasm and dedication
she has for science and research is extremely motivating. Her guidance, suggestions, ideas and
timely discussions has helped me in improving my work. I thank her for inspiring me to do good
research.
Further, I would like to express my sincere gratitude to my research committee members; Prof.
Saroj Mishra, Prof. Ritu Kulshreshtha and Prof. Ashok Patel for putting efforts in evaluating my
work from time to time. I thank them all for their valuable suggestions and appreciation which
motivated me to work even harder.
I would also like to acknowledge and convey my sincere thanks to Prof. Shilpi Sharma for
supporting me since beginning and providing her valuable time and suggestions for qPCR
analysis. I would like to extend my thanks to the Head of the Department and all the other
faculty members of DBEB and Kusuma School of Biological Sciences for imparting knowledge
through classroom programs which helped me to excel in my course work and comprehensive
exams. I would also like to thank all the members of the non-teaching staff of DBEB for all
their support and help.
I feel really happy to thank all the people with whom I shared the most memorable and
wonderful time of my life, the members of my lab, RNA-I people. Firstly I would like to thank

iii
my seniors Dr. Pooja Singh, Dr. Anees and Ankur Kumar for their guidance, help and support
during my initial days in the lab. Special credits to Dr. Pooja Singh; I had learnt several things
from her. Not only for this lab but also in my life the name “Pooja” holds a very precious and
respectable place, proved by the presence of Dr. Pooja Murarka. I can’t even imagine my
journey in this lab without her. She has been one of the most supportive, helpful, and caring
person I could ever talk about. Our relation is way beyond professionalism; she has supported
and been with me in the most difficult situations. The warmth she has provided me could only
be explained when I say she is my family in Delhi.
I would like to extend my thanks to Jananee for being an excellent labmate. She has been a great
support throughout and is a friend forever. Special thanks to Rohit, who is not just my friend
but actually more like a brother. All the members of RNA-I lab holds a special place in my heart
for this unforgetful experience at IITD. I acknowledge the help and thank Arif, Kavita, Sonal,
Tanaya, Mansi, Deeksha, Krishna Priya and Priyanka for their support in the lab. Also would
like to extend my thanks to Aditi and Aparna for the lively environment in the lab.
I would like to thank all the MTP and BTP students of the lab escpecially Aayushi Jain, Gaurav
and Sagar. I had a great start with these three fellows. Aamir, Prashanth, Siddhant Ayan,
Dwaraka, Gunjan, Aniruddh, Bintu, Jayaram and Ayushi Agrawal, all of them really made this
journey memorable. I would also like to thank Roshinee, Prince, Piyush, Rakesh and Komal for
maintaining a friendly environment in the lab. I always shared a special bond with the SURA
students, whether it’s with Aashima or Gunjan, Mira or Vageesh, Ayushi or Sonakshi or with my
Gwalior buddy Saksham. I really had joyful time and have wonderful memories with all of them.
Special thanks to Mr. Avneesh (Amit bhaiya), for maintaining clean lab and managing the
process of our bills payment.
I would also like to thank Mr. Udit Mangal and Mr. Subhash Tripathi from ThermoFisher
Scientific, for helping me to carry out Flow cytometry analysis and Mr. Lalit and Mr. Vibhuti
from Nikon for providing me support and assistance regarding microscope whenever needed.
Earnest thanks to all those whose names are missing but they are not forgotten. I acknowledge

iv
the infrastructural support from IIT Delhi and I am thankful to DST and CSIR for financial
support in the form of research scholarship.
It is impossible for me to thank enough one extremely celebrated person in my life, my best
friend Mr. Abhijeet Thakur. I can never acknowledge him for the strength he has given me by
always being there in need. His enormous faith and confidence in me even when I was losing
hope, made me what I am today. I admire the way he stood beside me dedicated and firm like a
mountain. He is truly a blessing in disguise. My heartiest gratitude to him for the way he is and
best wishes for his thesis.
Finally, I extend my heartfelt regards to the most wonderful and supportive family. I honestly
feel blessed to be a part of it. Taiji, Tauji, Mummy, Papa, Deepti, Jiju and Bhaiyu, they all are
the strongest pillars of my life. It is their prayers and wishes which have helped me come so far
in my journey. Apart from expressing my deepest thanks to them I even feel sorry for being not
there at times when they needed me. I am extremely thankful to Deepti and Bhaiyu, who took
most of the family responsibilities upon themselves so that I could just focus on my studies and
work. One person who is with God now must be the happiest amongst us all on successful
completion of my PhD thesis, Daddy (badepapa) it is all due to his blessings and faith in me. As
a child I can never thank my parents for all their efforts and sacrifices, so I don’t even want to
try it but just want to say that mummy papa you both are my lifeline and I dedicate this thesis to
you.
Last but not the least; I thank God, the Almighty for everything. Without his blessings and
grace, this journey would not have been possible.
Divya Singhi

v
ABSTRACT
A bacterial cell cycle consists of various essential processes which run simultaneously in a
coupled and coordinated manner. Broadly, these processes include DNA replication, segregation
and division to form daughter cells with equal genetic material. Many studies have been
conducted on various aspects of these processes in bacteria. Amongst Actinomycetes,
chromosome organization and segregation studies have been limited to Streptomyces coelicolor,
Corynebacterium glutamicum and Mycobacterium spp. There are differences with respect to
chromosome number, organization, replication and segregation pattern in them. To enhance the
repertoire and to study the diverse pattern, another member Rhodococcus erythropolis PR4, a
non-pathogenic bacterium containing 6.5 Mbp completely sequenced circular genome, was used
in the study. The present study aimed at understanding the cell cycle and associated processes
such as chromosome replication, organization and segregation in R. erythropolis PR4 along with
the role of partitioning and cytoskeletal proteins. The study was conducted using P1 GFP-
ParB/parS system as the localizing tool. With the localization studies of small plasmid replicons,
it was shown that different plasmids have different spatial position inside the cell. The
subcellular localization of replisome revealed that the cocci shaped cells of the bacterium are
non-replicating. The origin of replication was identified, and the DNA content in the cell under
different growth conditions was determined. The number of origins increased in rich medium,
suggesting overlapping replication cycle in this bacterium. Subcellular localization of origin
region displayed polar positioning in minimal and rich medium. The terminus that is the last
region to be replicated and segregated was found to be localized at the cell center in large cells.
The middle markers corresponding to 1.5 Mb and 4.7 Mb loci did not overlap, suggesting
discontinuity in the segregation of the two arms of the chromosome. Chromosome segregation

vi
was not affected by inhibiting cell division but deletion of parA or parB affected chromosome
segregation. The study suggests that R. erythropolis is different from other members of
Actinobacteria; it is monoploid and has a unique chromosome segregation pattern. Transposon
mutagenesis performed helped in identification of some of the important genes which might play
key role in maintenance of the cell morphology. Till date, there are no such reports on
chromosome organization, replication and segregation in R. erythropolis PR4. This study
emphasizes on the fundamental and extremely significant aspects essential for understanding this
bacterium. The study will be useful not only in designing better therapeutics in future for
pathogenic strains but also for studying the genome maintenance in strains used for
bioremediation.

vii
एक क क क ए एक और
र क र पर, इ क क क क क क
क ए ए ए क , और र इ क
प पर कई कए ए ए इ क , और
क र , क र र क और क र
ए प प क र , , क और क
क क और प क कर क ए, एक र क क
ए र प प र ४, एक र-र क , ६.५ ए प प र र प रप
, क प क क क और
क , और र क क ए र प प र ४
और इ क क क क कर पकर क प प १ ए प -
प र / प रऐ क प करक क क क
कर क , क क क क क र -
क क क प- कर प क क
क र क क क ए र- क क क प क प क ई , और क

viii
क क क ए ए र क ई इ क क
र प कर क ए, प क ई क प-
कर और क क र
और , क क क क क क प
१.५ ए और ४.७ ए क क क क र क र प प ,
क क क क क क र ककर
, क प रऐ प र क क कर
प क र. ए र प ए र क ;
इ और इ एक क प मयटाजनसिि
क क प क प कर क क क
क र र प क क क, र. इ र प प र ४
, क और पर ऐ क ई रप इ क क
ए क और प प पर र क
र क प क ए र क इ र कर प क
र ए क ए प कए प र र क कर क ए
प
ix
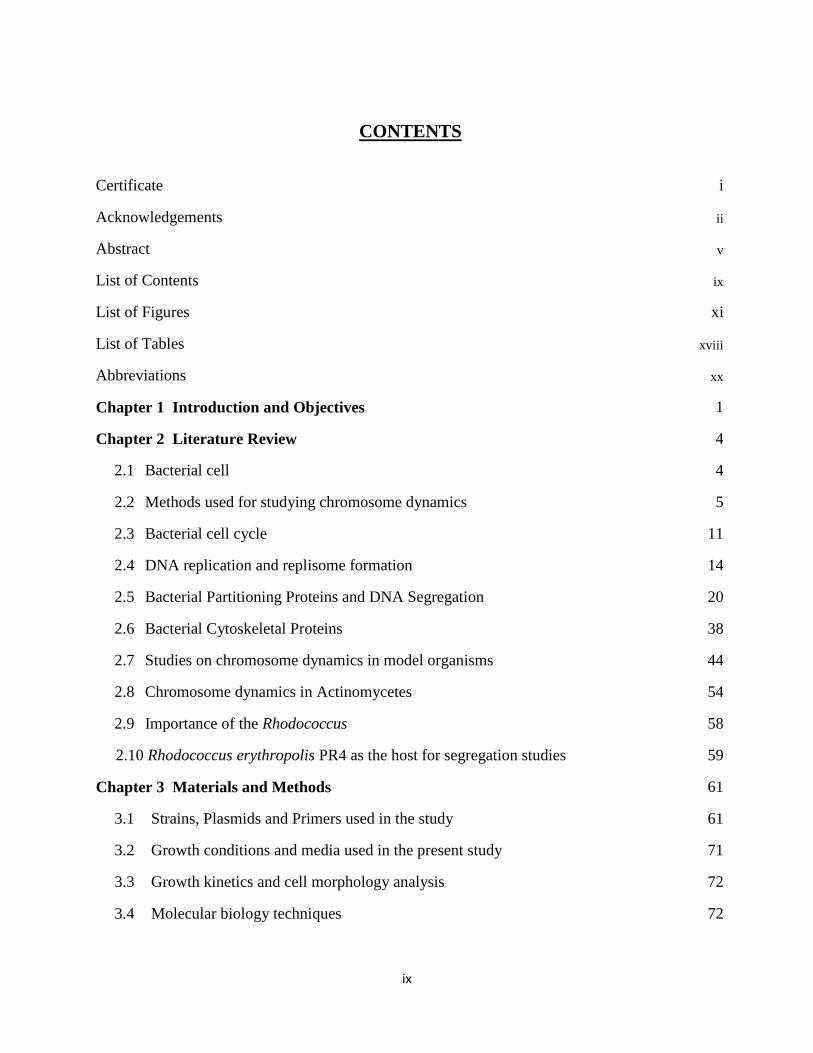
CONTENTS
Certificate i
Acknowledgements ii
Abstract v
List of Contents ix
List of Figures xi
List of Tables xviii
Abbreviations xx
Chapter 1 Introduction and Objectives 1
Chapter 2 Literature Review 4
2.1 Bacterial cell 4
2.2 Methods used for studying chromosome dynamics 5
2.3 Bacterial cell cycle 11
2.4 DNA replication and replisome formation 14
2.5 Bacterial Partitioning Proteins and DNA Segregation 20
2.6 Bacterial Cytoskeletal Proteins 38
2.7 Studies on chromosome dynamics in model organisms 44
2.8 Chromosome dynamics in Actinomycetes 54
2.9 Importance of the Rhodococcus 58
2.10 Rhodococcus erythropolis PR4 as the host for segregation studies 59
Chapter 3 Materials and Methods 61
3.1 Strains, Plasmids and Primers used in the study 61
3.2 Growth conditions and media used in the present study 71
3.3 Growth kinetics and cell morphology analysis 72
3.4 Molecular biology techniques 72
x
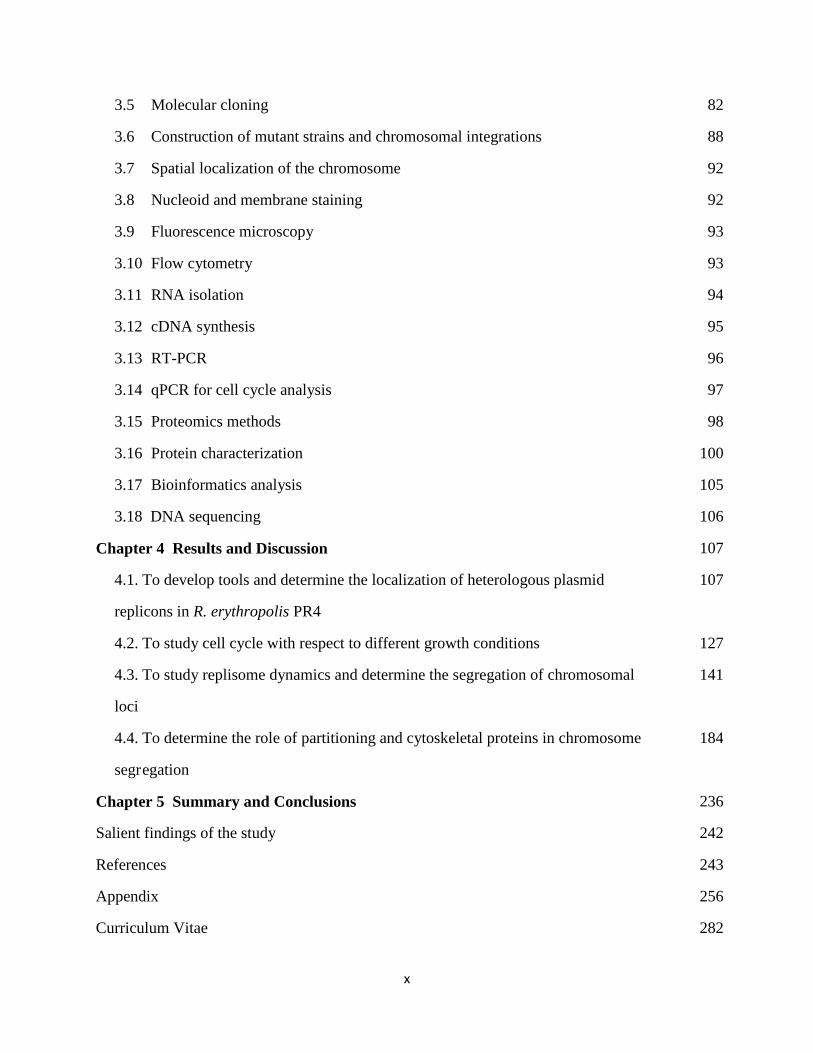
3.5 Molecular cloning 82
3.6 Construction of mutant strains and chromosomal integrations 88
3.7 Spatial localization of the chromosome 92
3.8 Nucleoid and membrane staining 92
3.9 Fluorescence microscopy 93
3.10 Flow cytometry 93
3.11 RNA isolation 94
3.12 cDNA synthesis 95
3.13 RT-PCR 96
3.14 qPCR for cell cycle analysis 97
3.15 Proteomics methods 98
3.16 Protein characterization 100
3.17 Bioinformatics analysis 105
3.18 DNA sequencing 106
Chapter 4 Results and Discussion 107
4.1. To develop tools and determine the localization of heterologous plasmid 107
replicons in R. erythropolis PR4
4.2. To study cell cycle with respect to different growth conditions 127
4.3. To study replisome dynamics and determine the segregation of chromosomal 141
loci
4.4. To determine the role of partitioning and cytoskeletal proteins in chromosome 184
segr egation
Chapter 5 Summary and Conclusions 236
Salient findings of the study 242
References 243
Appendix 256
Curriculum Vitae 282

xi
LIST OF FIGURES
Figure No. Title Page No.
2.1 Techniques commonly used for studying dynamics of bacterial
chromosome
7
2.2 High resolution techniques commonly used for inferring chromatin
organization 10
2.3 Bacterial cell cycle showing the B, C and D periods 11
2.4 Bacterial slow and fast cell growth 13
2.5
Replisome structure and proteins shown in two model
microorganisms 16
2.6 Models describing the positioning of bacterial replisome 18
2.7 Schematic diagram depicting partitioning of high copy and low copy
plasmids 21
2.8 Genetic organization of the extensively studied plasmid segregation
systems 24
2.9 Schematic diagram showing different models of plasmid segregation 28
2.10 Model of bacterial chromosome segregation 29
2.11 Schematic representation of extrusion–capture model 32
2.12 Schematic representation of E. coli macrodomains structures 33
2.13 Model showing pulling mechanism mediated chromosome
segregation in V. cholerae 34
2.14 Model showing chromosome segregation in slow and fast-growing E.
coli cells 45
2.15 Model showing chromosome segregation in C. crescentus 46
2.16 Chromosome segregation and localization of terminus in V. cholerae 48
2.17 Model showing chromosome segregation in B. subtilis 49
xii
2.18 Model showing chromosome segregation in A. tumefaciens 52
2.19 Model showing chromosome segregation in C. glutamicum 54
2.20 Model showing chromosome segregation in M. smegmatis 56
2.21 Illustrative figures showing connection between segregation, hyphae
extension and Z-ring formation in S. coelicolor 57
2.22 Flow chart depicting various applications of the genus Rhodococcus 59
4.1 Schematic diagram and 1% agarose gels showing cloning of
chloramphenicol resistance gene in plasmid pEPRI 109
4.2 Schematic diagram and 1% agarose gels showing cloning of P1
parSkan in plasmid pRSG43 for the localization of pRC4 replicon 111
4.3 Schematic diagram and 1% agarose gels showing cloning of P1
parB-gfp cassette in pDS1 plasmid for the visualization of pRC4
replicon
113
4.4 Fluorescence microscopy images showing spatial localization of
plasmid with pRC4 replicon 113
4.5 Graphs depicting subcellular distribution of plasmid pDS3 in R.
erythropolis PR4 114
4.6 Fluorescence microscopy images of the control strain expressing
ParB-GFP without parS integration 115
4.7 Fluorescence microscopy images showing spatial localization of
plasmid with pRC4 replicon in cocci cells 115
4.8 Fluorescence microscopy images showing plasmid pDS3 localization
with respect to nucleoid 116
4.9 Fluorescence microscopy images showing plasmid pDS3 in cells
treated with different concentrations of cephalexin 117
4.10 Schematic diagram and 1% agarose gels showing cloning of P1
parSkan cassette in pDS1 plasmid for the localization of pCG1
replicon
119
4.11 Schematic diagram and 1% agarose gels showing cloning of P1
parB-gfp in pRSG43 plasmid for the localization of pCG1 replicon 120

xiii
4.12 Fluorescence microscopy image and graph showing spatial
localization of plasmid pDS1 containing pCG1 replicon in
R.erythropolis PR4
121
4.13 Graphs showing stability and compatibility of plasmid pDS2 and
pDS3 individually in R. erythropolis PR4
122
4.14 Graphs showing stability of plasmid pDS2 (pCG1 replicon) and
pDS3 (pRC4 replicon) together in R. erythropolis PR4
123
4.15 A 1% agarose gel showing structural stability of the isolated plasmid
pDS2 and pDS3
124
4.16 Segregation model of plasmid pDS3 with respect to cell cycle along
with representative fluorescence images
126
4.17 Graph showing growth kinetics of R. erythropolis PR4 in Minimal
M9 medium, LB medium and BHI medium
128
4.18 Plot showing identification of R. erythropolis PR4 origin and
terminus through AT and GC disparity curves
130
4.19 Schematic diagram and 1% agarose gels showing cloning of putative
oriC of R. erythropolis PR4 in plasmid pDS132
132
4.20 Graph showing transformation efficiency of the origin containing
plasmid (pDS6) compared with the plasmids pRSG43 and pEPR1
133
4.21 Graph representing oriC: terC ratio with respect to different growth
media obtained through quantitative PCR.
134
4.22 Graph representing the number of oriC per cell with respect to
different growth media obtained through quantitative PCR.
135
4.23 Schematic representation of overlapping replication cell cycle in R.
erythropolis PR4
137
4.24 Graph and microscopy image showing optimization of concentration
of antibiotics cephalexin and rifampicin for flow cytometry
138
4.25 Flow cytometry data representing genome equivalents observed in
different growth media by replication run-off method
139

xiv
4.26 Schematic diagram and 1% agarose gels showing cloning of dnaA-gfp
in pRSG43 plasmid for the localization of replication initiation protein
in R. erythropolis PR4
143
4.27 Schematic diagram and 1% agarose gels showing cloning of dnaB-gfp
in pRSG43 plasmid for the localization of helicase protein in R.
erythropolis PR4
145
4.28 Schematic diagram and 1% agarose gels showing cloning of dnaN-gfp
in pRSG43 plasmid for the localization of β-sliding clamp protein in
R.erythropolis PR4
147
4.29 Graphs showing functional complementation analysis of replisome-
GFP fusions
149
4.30 Fluorescence microscopy images and graphs showing localization of
DnaA-GFP in rod shaped cells of R.erythropolis PR4
150
4.31 Fluorescence microscopy images and graphs showing localization of
DnaB-GFP in cocci and rod shaped cells
152
4.32 Fluorescence microscopy images and graphs showing localization of
DnaN-GFP in rod shaped cells of R.erythropolis PR4
153
4.33 Schematic diagram representing the model of replisome localization
with respect to cell cycle
154
4.34 Schematic representation of the putative models for plasmid
replication and segregation in R. erythropolis PR4
155
4.35 Schematic diagram and 1% agarose gels showing cloning of origin
proximal region and parSkan cassette
158
4.36 Strategy diagram and 1% agarose gels showing confirmation of
chromosomal parSkan integration in R.erythropolis PR4
159
4.37 Fluorescence microscopy image and graphs showing localization of
origin proximal region in minimal medium.by P1 GFP-ParB/parS
system
160
4.38 Fluorescence microscopy image and graphs showing localization of
origin proximal region in LB medium.by P1 GFP-ParB/parS system
162
4.39 Fluorescence microscopy image and graphs showing localization of
origin proximal region in BHI medium.by P1 GFP-ParB/parS system
163

xv
4.40 Schematic diagram and 1% agarose gels showing cloning of parB-cfp
in pRSG43 plasmid for the localization of origin proximal region in
R.erythropolis PR4
166
4.41 Fluorescence microscopy image showing localization of origin
proximal region in LB medium using parB-cfp
167
4.42 Schematic diagram and 1% agarose gels showing cloning of terminus
proximal region and parSkan cassette
168
4.43 Strategy diagram and 1% agarose gels showing confirmation of
chromosomal parSkan integration in R.erythropolis PR4 for
localization of terminus proximal region
169
4.44 Fluorescence microscopy image and graphs showing localization of
terminus proximal region in LB medium.by P1 GFP-ParB/parS system
170
4.45 Microscopy images showing membrane staining performed with
FM4-64 to determine the localization of division septa vis-à-
vis the terminal proximal region
171
4.46 Flow cytometry of R. erythropolis cells at stationary phase showing
monoploidy
172
4.47 Schematic diagram and 1% agarose gels showing cloning of 1.5 Mb
region and parSkan cassette
175
4.48 Strategy diagram and 1% agarose gels showing confirmation of
chromosomal parSkan integration in R.erythropolis PR4 for
localization of 1.5 Mb region
176
4.49 Fluorescence microscopy image and graphs showing localization of
1.5 Mb region in LB medium.by P1 GFP-ParB/parS system
177
4.50 Schematic diagram and 1% agarose gels showing cloning of 4.7 Mb
region and parSkan cassette
178
4.51 Strategy diagram and 1% agarose gels showing confirmation of
chromosomal parSkan integration in R.erythropolis PR4 for
localization of 4.7 Mb region
179
4.52 Fluorescence microscopy image and graphs showing localization of
4.7 Mb region in LB medium.by P1 GFP-ParB/parS system
180
xvi
4.53 Histograms depicting the percentage distribution of cell length
observed for the terminal proximal, 1.5 Mb and 4.7 Mb region cells
with one and two fluorescence foci
181
4.54 Pictorial representation of discontinuity in segregation of two selected
chromosomal loci in R. erythropolis PR4
182
4.55 Representative snapshot images showing segregation of origin
proximal, terminus proximal, 1.5 and 4.7 Mb regions
183
4.56 Multiple sequence alignment of ParB protein in different members of
Actinobacteria family
185
4.57 Multiple sequence alignment of ParA protein in different members of
Actinobacteria family
187
4.58 Schematic diagram showing the strategy used for disruption of the
genes encoding for ParA and ParB partitioning proteins
188
4.59 Schematic diagrams and 1% agarose gels showing screening of
∆parA::kan mutants
189
4.60 Schematic diagrams and 1% agarose gels showing screening of
∆parB::kan mutants
190
4.61 Microscopy images showing cell length variation in deletion mutants
of partitioning proteins as compared with wild type cells
191
4.62 Histogram representing the cell length distribution of the wild type and
mutant cells
191
4.63 Graphs showing comparative analysis of wild type R. erythropolis
PR4, ∆ parA and ∆ parB strains of R. erythropolis PR4
192
4.64 Microscopy images showing difference in the cell length of wild type
and deletion mutants even in the absence of selection pressure
193
4.65 Schematic diagram and 1% agarose gels showing cloning of
tertracycline resistance gene in the plasmid pRFG1064 disrupting the
kanamycin gene
195
4.66 A 1% agarose gel electrophoresis showing colony PCR for screening
of the tetracycline disrupted parA and parB positive mutants
196

xvii
4.67 Fluorescence microscopy images showing cell length irregularities and
segregation defects in the tetracycline deletion mutants of partitioning
proteins
197
4.68 Fluorescence microscopy image showing segregation and intracellular
localization of origin proximal region and nucleoid in parA and parB
deletion mutants
198
4.69 Fluorescence microscopy image R. erythropolis PR4 cells treated with
cephalexin showing no affect on chromosome segregation by
inhibiting cell division
199
4.70 A 1.2% agarose gels showing the isolated RNAs from wild type cells
and the deletion mutants of R. erythropolis PR4.
200
4.71 Graphs showing changes observed in the transcript level of deletion
mutants
201
4.72 Strategy diagram and 1% agarose gels showing cloning of parB gene
under the control of Ptrc promoter in the shuttle vector pRSG43
203
4.73 A 12% SDS polyacrylamide gel showing overexpression of ParB
protein under the control of Ptrc promoter
204
4.74 A 1% agarose gel electrophoresis showing colony PCR for screening
of the double mutants of parA and parB in the same cell.
205
4.75 Fluorescence microscopy images showing cell length irregularities and
segregation defects in the ∆parA:: tet and ∆parB::kan double deletion
mutants
206
4.76 Logo of identified parS site and genome map of R. erythropolis PR4
demonstrating the positions of chromosomal loci along with their
coordinates used in the present study
208
4.77 Strategy diagram and 1% agarose gels showing cloning of parA
amplified from R.erythropolis PR4 in pET29a vector under T7
promoter
211
4.78 A 12% SDS polyacrylamide gel showing overexpression of ParA
protein in different expression strains and confirmation through
MALDI-ToF/MS analysis
212

xviii
4.79 Strategy diagram and 1% agarose gels showing cloning of parB
amplified from R.erythropolis PR4 in pET29a vector under T7
promoter
214
4.80 A 12% SDS polyacrylamide gel showing overexpression of ParB
protein in different expression strains
215
4.81 A 12% SDS polyacrylamide gel showing ParB protein purification
through Ni-NTA affinity chromatography and confirmation through
MALDI-ToF/MS analysis
216
4.82 A 12% SDS polyacrylamide gel showing glutaraldehyde crosslinking
of the purified ParB protein along with 6% native gel showing dimer
form of the protein
216
4.83 A 6% TBE native gels showing EMSA with purified ParB protein and
Cy5 labeled DNA containing parS site
219
4.84 Microscopy images of R. erythropolis PR4 showing morphological
variations in different growth phases of the cell cycle with respect to
different growth media
221
4.85 Schematic representation of the procedure used for creating EZ::TN
Transposome-mediated mutant library
222
4.86 Microscopy images showing the most prominent morphology
variations observed by transposon mutagenesis in R. erythropolis PR4
223
4.87 Graph showing a comparative analysis of the average cell length of the
50 shortlisted transposon mutants with respect to wild type cells
224
4.88 A 1% agarose gels showing the screening of transposon mutants 225
4.89 Microscopy image showing the morphology defect of mutant 1.15
along with the schematic of identified gene disrupted through
transposon insertion
227
4.90 Multiple sequence alignment of the two ParA proteins of
R.erythropolis PR4
227
4.91 Microscopy image showing the morphology defect of mutant 2.27
along with the schematic of identified gene disrupted through
transposon insertion
229

xix
4.92 Microscopy image showing the morphology defect of mutant 3.49
along with the schematic of identified gene disrupted through
transposon insertion
231
4.93 Microscopy image showing the morphology defect of mutant 1.11
along with the schematic of identified gene disrupted through
transposon insertion
232
4.94 Microscopy image showing the morphology defect of mutant 2.99
along with the schematic of identified gene disrupted through
transposon insertion
233
4.95 Microscopy image showing the morphology defect of mutant 3.171
along with the schematic of identified gene disrupted through
transposon insertion
234
4.96 Microscopy image showing the morphology defect of mutant 2.5 along
with the schematic of identified gene disrupted through transposon
insertion
235

xviii
LIST OF TABLES
Table No Title Page No.
2.1 Cell cycle analysis for different model organisms 14
2.2 List of replication and fluorescent proteins fusion used for localization
studies 18
2.3 List of partitioning systems present in various plasmids 25
2.4 List of partitioning proteins in different bacterial strains and their sizes 37
2.5 List of the major bacterial cytoskeletal proteins and their functions 43
3.1 List of bacterial strains used in the study 61
3.2 List of plasmids used in the study 63
3.3 List of primers used in the study 67
3.4 Composition of reaction mixture for PCR with Taq and Phusion DNA
polymerase 79
3.5 Standard Reaction conditions for PCR 79
3.6 Composition of the reaction mixture for cDNA synthesis 95
3.7 Reaction mixture composition for RT-PCR 96
3.8 Reaction conditions for RT-PCR 97
3.9 Composition of 12% separating and 5% stacking gel 99
3.10 Composition of reaction mixture for EMSA with ParB family protein and
TerR family protein 104
3.11 Composition of reaction mixture for EMSA with purified ParB protein and
Cy5 labeled TB5 105
4.1 Doubling time and specific growth rate of R.erythropolis PR4 in different
media 129

xix
4.2 C period of R. erythropolis PR4 in different growth media 134
4.3 D period of R. erythropolis PR4 in different media 136
4.4 Cell cycle parameters calculated for R.erythropolis PR4 in different media 137
4.5 List of replication proteins selected in the present study 141
4.6 List of different cell morphologies observed in the shortlisted mutants 225
xx
ABBREVIATIONS & SYMBOLS
α Alpha
aa Amino acids
AmpR
Ampicillin resistance
APS Ammonium per sulphate
AT Adenine-thymine
ATP Adenosine tri-phosphate
β Beta
BCD B, C and D period
BHI Brain heart infusion
BLAST Basic local alignment search tool
bp Base pair
BSA Bovine serum albumin
cDNA Complimentary DNA
Ceph Cephalexin
CFP Cyan fluorescent protein
CFU Colony forming unit
ChIA-PET Chromatin interaction analysis with paired-end tag
sequencing
ChIP Chromatin immunoprecipitation
3C Chromosome conformation capture
4C Chromosome conformation capture-on-chip
5C Chromosome conformation capture carbon copy

xxi
CmR
Chloramphenicol resistance
DAPI 4′,6-diamidino-2-phenylindole
∆ Delta/deletion
DEPC Diethyl pyrocarbonate
DMSO Dimethyl sulfoxide
DNA Deoxyribo nucleic acid
dNTP Deoxyribose nucleotide triphosphate
dsz Desulfurization
DTT Dithiothreitol
EB Elution buffer
EDTA Ethylenediaminetetraacetic acid
EMSA Electrophoretic mobility shift assay
EtBr Ethidium bromide
Fig Figure
FM4-64 N-(3-Triethylammoniumpropyl)-4-(6-(4-(Diethylamino)
Phenyl) Hexatrienyl) Pyridinium Dibromide)
FROS Fluorescence repressor operator system
FRT FLP recombinase target
GC Guanine-cytosine
GFP Green fluorescent protein
gm Gram
HCl Hydrochloric acid
HEPES 4-(2-hydroxyethyl)-1-piperazineethanesulfonic acid

xxii
h Hour
::
IFA
Insertion
Immunoflurescence assay
IPTG Isopropyl-β-D-1-thiogalactopyranoside
KanR
Kanamycin resistance
kb Kilobase
kDa Kilodalton
kV Kilovolt
λ Lambda
lacZ β-galactosidase
LA Luria agar
LB Luria broth
M Molar
MALDI Matrix assisted laser desorption ionization
µF Microfarad
µg Microgram
µl Microlitre
ml Millilitre
mM Milimolar
MM Minimal medium
min Minute
MW Molecular weight
ng Nanogram

xxiii
NCBI National Center for Biotechnology Information
NGS Next-generation sequencing
Ni-NTA Nickel-nitrilotriacetic acid
nm Nanometer
Ω Ohm
OD Optical density
oriC Origin (chromosomal)
PAGE Polyacrylamide gel electrophoresis
Par Partitioning
PBSE Phosphate buffer saline-EDTA
PCR Polymerase chain reaction
pmol Picomol
PMSF Phenylmethane sulfonyl fluoride
qPCR Quantitative PCR
RFP Red fluorescent protein
Rif Rifampicin
RNA Ribonucleic acid
RNase Ribonuclease
rpm Revolution per minute
RT Room temperature
RT-PCR Real-time PCR
SDS Sodium dodecyl sulphate
sec Second
xxiv
seq Sequestration
StrepR
Streptomycin resistance
τ Tau
TAE Tris-glacial acetic acid-EDTA
TBE Tris-borate-EDTA
TE Tris-EDTA
TEMED N,N,N',N'-tetramethylethane-1,2-diamine
terC Terminus (chromosomal)
TetR
Tetracycline resistance
Tris Tris (hydroxymethyl) amino methane
ts Temperature sensitive
UV Ultraviolet
V Volts
YFP Yellow fluorescent protein
H2O Water