Chromatographic studies of aggregation of human …...3 (44) Chromatographic studies of aggregation...
44
UPTEC X 07 028 ISSN 1401-2138 APR 2007 BJÖRN GARPEFJORD Chromatographic studies of aggregation of human plasma IgG and characterization of aggregates Master’s degree project
Transcript of Chromatographic studies of aggregation of human …...3 (44) Chromatographic studies of aggregation...

UPTEC X 07 028 ISSN 1401-2138 APR 2007
BJÖRN GARPEFJORD
Chromatographic studies of aggregation of human plasma IgG and characterization of aggregates
Master’s degree project

Molecular Biotechnology Programme Uppsala University School of Engineering
UPTEC X 07 028 Date of issue 2007-04 Author
Björn Garpefjord Title (English)
Chromatographic studies of aggregation of human plasma IgG and characterization of aggregates
Title (Swedish) Abstract
Protein aggregation is of great interest when developing therapeutical proteins mainly because of its ability to induce an unwanted strong immune response. The aggregation process of human plasma immunoglobulin G was studied using size-exclusion chromatography (SEC), self-interaction chromatography (SIC) and chemical cross-linking. An increase of weak interactions between the IgG molecules was observed at neutral or slightly alkaline pH. Both SIC and SEC indicated conformational transitions of IgG below pH 4.0 resulting in stable polymeric forms of IgG upon incubation. Cross-linked aggregates were purified and further characterized by various analytical techniques.
Keywords Aggregation, immunoglobulin G, high performance liquid chromatography (HPLC), size-exclusion chromatography (SEC), self-interaction chromatography (SIC), cross-linking, characterization
Supervisors Sergei Kuprin, Ph.D.
Analytical Sciences, Biovitrum AB, Stockholm Scientific reviewer
Prof. Karin Caldwell Dept. of Surface Biotechnology, Uppsala University
Project name
Sponsors
Language English
Security
ISSN 1401-2138 Classification
Supplementary bibliographical information Pages 44
Biology Education Centre Biomedical Center Husargatan 3 Uppsala Box 592 S-75124 Uppsala Tel +46 (0)18 4710000 Fax +46 (0)18 555217

3 (44)
Chromatographic studies of aggregation of human plasma IgG and characterization of aggregates
Björn Garpefjord
Populärvetenskaplig sammanfattning
Det finns idag ett antal proteiner som framställs för att användas som läkemedel. Bland dessa tillhör rekombinanta antikroppar de som anses mest lovande och intressanta för den biofarmaceutiska industrin. Vid tillverkningen av dessa proteinläkemedel är det väldigt viktigt att se till säkerheten för patienterna. Bland annat så kan en hög halt av bildade proteinkomplex, så kallade aggregat, leda till ett oönskat starkt immunsvar hos patienten vilket kan bli ödesdigert.
Detta examensarbete syftar till att studera aggregeringsprocessen hos antikroppar av typen immunoglobulin G (IgG) som renats fram ur humant blodplasma. Size-exclusion chromatography (SEC) användes för att studera bildandet av aggregat i en lösning av IgG. Därutöver studerades svaga interaktioner mellan IgG-molekyler med hjälp av self-interaction chromatography (SIC). Kovalenta tvärbindningar inducerades mellan molekylerna för att stabilisera de svaga interaktionerna.
Resultaten visar att svaga interaktioner mellan IgG-molekyler ökar då proteinlösningens pH ökas till neutralt eller svagt basiskt. Dessa interaktioner var dock för svaga för att bilda stabila aggregat. Det visade sig också att proteinernas konformation förändras då pH sänks under pH 4.0. Denna konformationsförändring visade sig leda till ökad aggregering och bildande av stabila aggregat då proteinlösningen inkuberades under en tid. Olika analytiska tekniker användes även till att undersöka stabila komplex av antikroppar.
Examensarbete 20 p i Molekylär bioteknikprogrammet
Uppsala universitet, April 2007

4 (44)
TABLE OF CONTENTS
1 INTRODUCTION .......................................................................................................6 1.1 Background and aim .................................................................................................6
1.2 Human immunoglobulin G .......................................................................................6 1.2.1 Antibody instability ............................................................................................7
1.3 Protein aggregation...................................................................................................7 1.3.1 Physical aggregation .........................................................................................8 1.3.2 Chemical aggregation........................................................................................8 1.3.3 Factors influencing protein aggregation ...........................................................9
2 OBJECTIVES..............................................................................................................9
3 MATERIALS AND METHODS..............................................................................10 3.1 Human IgG Octagam..............................................................................................10
3.2 Determination of protein concentration..................................................................10
3.3 Size-exclusion high performance liquid chromatography (SE-HPLC) analysis ....10 3.3.1 Optimization of parameters for SE-HPLC analysis of IgG Octagam..............10 3.3.2 Calibration of the columns with standard proteins..........................................11 3.3.3 Instrumentation ................................................................................................12 3.3.4 SE-HPLC with LS and RI detection .................................................................12
3.4 Self-interaction chromatography ............................................................................12 3.4.1 Preparation of IgG Octagam for immobilization to column matrix ................12 3.4.2 Immobilization of IgG Octagam on column matrix .........................................12 3.4.3 Preparation of control column.........................................................................13 3.4.4 Self-interaction high performance liquid chromatography analysis ...............13
3.5 Chemical cross-linking of IgG Octagam ................................................................13 3.5.1 Cross-linking of IgG Octagam using Glutaraldehyde .....................................13 3.5.2 Cross-linking of IgG Octagam using Disuccinimidyl tartrate .........................14
3.6 SE-HPLC analysis of cross-linked aggregates .......................................................14
3.7 SDS-PAGE analysis of cross-linked aggregates ....................................................14
3.8 Reversed-phase high performance liquid chromatography ....................................14
3.9 Dynamic light scattering.........................................................................................15
3.10 Other laboratory equipment ....................................................................................15
3.11 Signal manipulation ................................................................................................16

5 (44)
4 RESULTS...................................................................................................................17 4.1 Size-exclusion high performance liquid chromatography of IgG Octagam...........17
4.1.1 Optimization of SE-HPLC................................................................................17 4.1.1.1 Column selection ...................................................................................17 4.1.1.2 Ionic strength in running buffer .............................................................20 4.1.1.3 Standard conditions for SE-HPLC analysis of human IgG Octagam ....22
4.1.2 Protein self-interactions dependent on pH and salt concentration..................22 4.1.2.1 pH in running buffer of SE-HPLC.........................................................22 4.1.2.2 Sample pre-incubation at low pH ..........................................................23
4.2 Self-interaction chromatography of IgG Octagam .................................................25
4.3 Chemical cross-linking of IgG Octagam ................................................................29 4.3.1 Cross-linking of IgG Octagam using Glutaraldehyde .....................................29
4.3.1.1 Optimization of GA cross-linking reaction ...........................................29 4.3.2 Cross-linking of IgG Octagam using disuccinimidyl tartrate (DST) ...............32
4.3.2.1 Optimization of cross-linking reaction ..................................................32 4.3.2.2 Preparation of soluble associates cross-linked by DST .........................33
4.4 SDS-PAGE characterization of cross-linked IgG aggregates ................................35
4.5 RP-HPLC characterization of cross-linked IgG aggregates ...................................36
4.6 DLS analysis of cross-linked IgG aggregates.........................................................38
5 DISCUSSION.............................................................................................................39
6 CONCLUSION ..........................................................................................................41
7 ACKNOWLEDGEMENTS ......................................................................................41
8 REFERENCES ..........................................................................................................42

6 (44)
1 INTRODUCTION
1.1 Background and aim A great number of proteins are today used as pharmaceuticals and recombinant antibodies are of special interest for the biopharmaceutical industry. High requirements on safety, purity and stability of the therapeutical proteins are requested from health authorities. Protein aggregates are of special concern because of their tendency to induce an unwanted strong response from the human immune system upon administration (Rosenberg, 2006). Therefore, it is of great interest to eliminate aggregated proteins from the final drug product and in each step of manufacturing.
There are a number of analytical techniques available for monitoring protein aggregation and characterize protein aggregates. For example analytical ultracentrifugation, size-exclusion chromatography, light scattering and different spectroscopic techniques are used for this purpose (Wang, 2005).
One of the most widely used techniques to study protein aggregation and self-association in the biopharmaceutical industry is gel-filtration or size-exclusion chromatography (SEC) combined with UV detection. However, this technique has its limitations when it comes to detecting small amounts of aggregates and insoluble aggregate species. In order to enhance the ability to detect minute amounts of aggregates in a protein solution light scattering has been employed as a common detection method. Static light scattering (SLS) is used on-line whereas dynamic light scattering (DLS) is mostly used in batch mode (Ahrer et al., 2003).
Since protein aggregation occurs in almost every step of the manufacturing process (Cromwell et al., 2006) it is important to have a good knowledge of the protein stability and the aggregation propensities of the proteins of interest. SEC analysis is routinely included in the analysis of a new protein drug in order to quantify formed aggregates. In this project polymerization of polyclonal immunoglobulin G derived from human plasma was studied using SE-HPLC at different conditions. However, SEC analysis can only detect stable protein complexes and is therefore not adequately useful for studying the weaker intermolecular interactions that may lead to formation of aggregates. To stabilize such weak interactions the interacting protein molecules are cross-linked using different chemical reagents.
Weak protein-protein interactions were also studied using self-interaction chromatography (SIC) (Patro and Przybycien, 1996). In SIC the protein of interest is immobilized as a ligand to a column matrix before the same protein is applied onto the column in the mobile phase and isocratically eluted. The retention volume will then reflect the relative protein-protein interactions under the solution conditions determined by the running buffer. In this work the self-interactions of human IgG Octagam is investigated using SIC at different ionic strengths in running buffers at different pH.
1.2 Human immunoglobulin G Immunoglobulin G (IgG) is the most abundant of the five classes of immunoglobulins present in the human body and is mostly present as monomers. IgG consists of two identical heavy chains

7 (44)
(50 kDa) and two identical light chains (25 kDa). These four polypeptide chains are covalently linked together by disulfide bonds to a Y-shaped antibody with a total molecular weight of approximately 150 kDa. The IgGs are divided into four isotypes, IgG1-IgG4, based on their different heavy chains (Goldsby et al., 2002) and all are present in the human blood plasma which might complicate the interpretation of analysis data (Ahrer et al., 2006).
The first approximately 110 amino acids of the four chains forms the antigen-binding (Fab) regions and the remaining amino acid sequence forms the Fc regions for recognition and binding of effectors (Wang et al., 2007). Each of these fragments consists of four individual globular domains and the individual denaturation of these domains makes the unfolding of an IgG molecule a very complex procedure (Welfle et al. 1999).
Besides the covalent disulfide bonds linking the four polypeptides into a complete antibody, also proper glycosylation and non-covalent interactions have been shown to be crucial for proper function and maintained structure (Wright and Morrison, 1997; Wang et al., 2007).
1.2.1 Antibody instability Antibodies are generally considered to be more stable than other proteins. However, antibodies may also go through physical or chemical degradation. Such instabilities may be observed in all different states of storage, such as liquid, frozen or lyophilized states. When it comes to physical instability, denaturation of antibodies may occur under many different conditions such as temperature change, acidic conditions and salt induced stress (Wang et al., 2007).
Aggregation is a more common sign of physical instability of antibodies. This has long been considered a big challenge when developing formulations of antibodies at high concentrations (Wang et al., 2007). When it comes to IgG, it has been reported that the propensity to aggregate is highest for the isotype IgG3 compared to the other isotypes present in human plasma (Remmele et al., 2006).
Calorimetric studies have shown that the Fab fragment of IgG is sensitive to heat treatment, whereas the Fc fragment is most sensitive to acidic environments (Vermeer and Norde, 2000). It is stated that the thermodynamic stability for human IgG molecules is highest between pH5.5 and 6.5 (Ahrer et al., 2006).
1.3 Protein aggregation Protein aggregation is one of the most common types of protein instability and may occur in all phases of protein drug development. Therefore, it is of great importance to study protein aggregation and improve the knowledge about aggregation and its causes throughout the biopharmaceutical process (Wang, 2005). The presence of any type of aggregates in protein therapeutics is undesirable as the aggregates may lead to an immunogenic reaction when administered with the therapeutic protein (Cromwell et al., 2006). It has been shown that a higher degree of multimerization and formation of larger aggregates increases the immune responses compared to lower molecular weight species (Rosenberg, 2006).
Aggregation of protein molecules does not necessarily include changes in the primary structure of the proteins; a protein may aggregate simply due to protein-protein interactions and physical
8 (44)
associations. There can also be a more chemical aggregation where the structure of the protein is affected and new covalent bonds are formed in the protein molecule. Such bonds may directly cross-link proteins to aggregates or more indirectly alter the properties of the protein so that it is more prone to aggregate. These physical or chemical aggregation mechanisms may lead to formation of both soluble and insoluble aggregates (Wang, 2005).
1.3.1 Physical aggregation Reversible physical association of proteins may occur because of weak interactions between protein molecules. The reversibility is an indication of equilibrium between the native protein monomer and different higher order forms, which may shift due to changes in solution conditions (Cromwell et al., 2006). Generally, this equilibrium is dependent on the stage of the aggregation process, whereas the initial formation of soluble aggregates may be reversible but the following formation of insoluble aggregates is irreversible. Physical aggregation has been believed to occur as a result of strong but non-specific protein interactions. However, recent studies suggest that aggregation may occur due to specific interactions of certain conformations of protein intermediates (Wang, 2005).
The aggregation of protein molecules can also be a consequence of the association of unfolded states of proteins. Even though the intermediate states in the protein folding-unfolding process usually are poorly populated, these intermediates are generally considered as precursors in protein aggregation (Wang, 2005). Their high diffusion rate compared to the folded molecules is believed to be important for the aggregation of these intermediates, easily generated under thermal treatment.
Computer simulations has shown that the initiation of a protein aggregation process is considered thermodynamically unfavorable and rate limiting. However, after the first higher energetic barrier is passed the further aggregation is thermodynamically favored (Patro and Przybycien, 1994). This is explained by that the attraction between hydrophobic patches minimizes the interactions between the protein and its solvent and therefore the aggregation is favored.
1.3.2 Chemical aggregation A number of chemical reactions can either directly form cross-links between interacting protein molecules or change the aggregation behavior of a protein more indirectly, e.g. by changing the hydrophobicity of the protein. Some reactions require local molecular flexibility suggesting that aggregation is more frequent in denatured molecules compared to native species. Therefore, native protein conformation should be preserved in order to inhibit aggregation (Wang, 2005). The most common route for chemically induced protein aggregation is probably formation of covalent disulfide bonds. Free cysteine residues can easily be oxidized to form disulfide bonds, which may result in protein aggregation. There are also numerous examples of other covalent linkages or bonds that may be responsible for the formation of protein aggregates (Wang, 2005).

9 (44)
1.3.3 Factors influencing protein aggregation A number of factors, both structural and environmental, may influence the propensity of a protein to form aggregates. It is generally assumed that the aggregation behavior of a protein is determined by its primary structure and that the more hydrophobic a protein is, the more likely it is to form aggregates (Fink, 1998; Calamai et al., 2003; Wang, 2005). Also secondary structure of a protein may play a role in controlling aggregation as well as stability and toxicity (Wang, 2005).
Among the many different external factors a protein may be exposed to during manufacturing, purification and storage, temperature is probably the most critical to protein stability. It is known that proteins unfold above certain temperatures and that this unfolding process often is followed by aggregation due to exposure of hydrophobic residues within the protein. Another environmental factor that is very important in protein aggregation is the pH of the protein solution. The altered type and distribution of charges is the most common cause of aggregation related to pH of the solution (Wang, 2005).
2 OBJECTIVES The objectives of this thesis are to study the self-interaction and aggregation of human plasma IgG. The limitations of the most common analytical technique for studying protein aggregation in the biopharmaceutical industry, i.e. size-exclusion chromatography, are here investigated. The use of self-interaction chromatography and chemical crosslinking for studying protein interactions is also investigated. Furthermore, obtained aggregates are characterized using a number of analytical techniques.

10 (44)
3 MATERIALS AND METHODS
3.1 Human IgG Octagam A stock solution of 50 mg/ml human intravenous immunoglobulin G (IgG) Octagam stabilized by 100 mg/ml of maltose was obtained from Octapharma (Stockholm, Sweden). The solution was filtered through a 0.2 μm sterile filter, dispensed into 2 ml vials and kept before use in a refrigerator at + 5 °C.
3.2 Determination of protein concentration The protein concentration was determined by UV-absorption at 280 nm using an extinction coefficient of 1.4 cm2/mg.
3.3 Size-exclusion high performance liquid chromatography (SE-HPLC) analysis
3.3.1 Optimization of parameters for SE-HPLC analysis of IgG Octagam Five different size-exclusion chromatography (SEC) columns were tested and evaluated for high performance liquid chromatography (HPLC) analysis using a number of different running buffers with different ionic strengths and pH. The columns tested were Zorbax GF-250, 9.4 x 250 mm (Agilent), TSKgel G2000SW, 7.5 x 300 mm (TosoH Biosep.), TSKgel G3000SW, 7.5 x 600 mm (TosoH Biosep.), TSKgel G3000SWXL, 7.5 x 300 mm (TosoH Biosep.) and Superdex 200 HR 10/30, 10 x 300 mm (GE Healthcare). The column properties are summarized in Table 1.
Table 1 Summary of properties of analytical size-exclusion columns
Column Matrix
Particle size
(µm)
Pore size
(Å)
Separation range
(kDa)
Zorbax GF250 Silica 4 150 4-400
TSKgel G2000SW Silica 10 125 5-100
TSKgel G3000SW Silica 10 250 2-500
TSKgel G3000SWXL Silica 5 250 1-500
Superdex 200 HR 10/30 Dextran 13 - 10-600
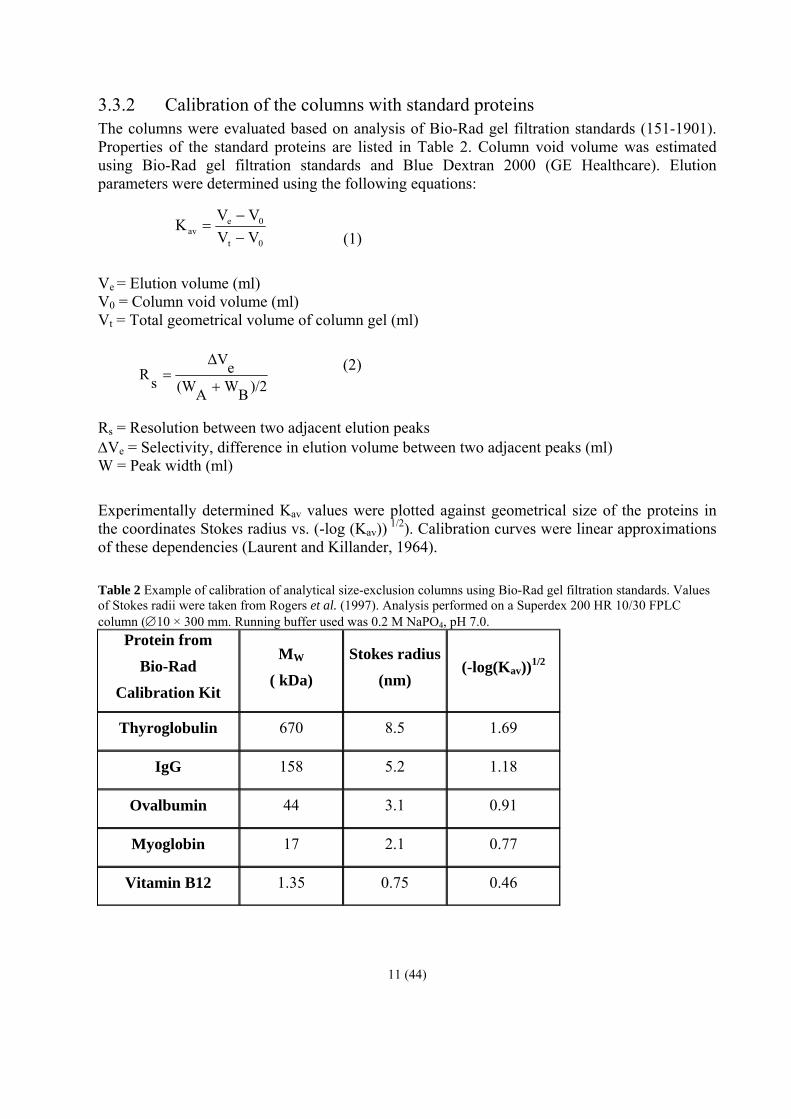
3.3.2 Calibration of the columns with standard proteins The columns were evaluated based on analysis of Bio-Rad gel filtration standards (151-1901). Properties of the standard proteins are listed in Table 2. Column void volume was estimated using Bio-Rad gel filtration standards and Blue Dextran 2000 (GE Healthcare). Elution parameters were determined using the following equations:
0t
0eav VV
VVK−−
= (1)
Ve = Elution volume (ml) V0 = Column void volume (ml) Vt = Total geometrical volume of column gel (ml)
)/2BWA(WeΔV
sR+
= (2)
Rs = Resolution between two adjacent elution peaks ΔVe = Selectivity, difference in elution volume between two adjacent peaks (ml) W = Peak width (ml)
Experimentally determined Kav values were plotted against geometrical size of the proteins in the coordinates Stokes radius vs. (-log (Kav)) 1/2). Calibration curves were linear approximations of these dependencies (Laurent and Killander, 1964). Table 2 Example of calibration of analytical size-exclusion columns using Bio-Rad gel filtration standards. Values of Stokes radii were taken from Rogers et al. (1997). Analysis performed on a Superdex 200 HR 10/30 FPLC column (∅10 × 300 mm. Running buffer used was 0.2 M NaPO4, pH 7.0.
Protein from
Bio-Rad
Calibration Kit
MW
( kDa)
Stokes radius
(nm) (-log(Kav))1/2
Thyroglobulin 670 8.5 1.69
IgG 158 5.2 1.18
Ovalbumin 44 3.1 0.91
Myoglobin 17 2.1 0.77
Vitamin B12 1.35 0.75 0.46
11 (44)

12 (44)
3.3.3 Instrumentation SE-HPLC analyses were performed on an Agilent HP 1100 workstation equipped with a binary pump, well plate autosampler, column thermostat, variable wavelength detector (VWD) and sample thermostat.
3.3.4 SE-HPLC with LS and RI detection IgG Octagam (10 mg/ml) was injected onto a TSKgel G3000SWXL (TosoH Biosep., 7.5 x 300 mm) SEC column operated on an Agilent HP 1100 workstation equipped with a static light scattering (LS) detector MiniDawn Tri Star (Wyatt Technology Corp., Santa Barbara) and with a refractive index (RI) detector Optilab® rEX (Wyatt) and a diode array UV detector (DAD). Data collection was obtained by manual synchronization of LS, RI signals with DAD detector. The molecular weight of the protein species separated on the column was absolutely determined from the LS and RI signals (Wyatt, 1993). The running buffer consisting of Dulbecco’s phosphate buffered saline (D-PBS) without Mg or Ca obtained from Invitrogen was run at a flow rate of 0.5 ml/min.
3.4 Self-interaction chromatography
3.4.1 Preparation of IgG Octagam for immobilization to column matrix 8 ml IgG Octagam stock solution was transferred to 0.2 M NaHCO3 + 0.5 M NaCl, pH 8.0 (coupling buffer) using four PD-10 columns with Sephadex G-25 pre-equilibrated with coupling buffer. Before immobilization the Octagam solution was concentrated to 200 mg/ml using ultra dialysis under vacuum in a collodion bag (Sartorius) over night on ice.
3.4.2 Immobilization of IgG Octagam on column matrix The column used was a HiTrap NHS-activated HP column, 1 ml (GE Healthcare) with N-hydroxysuccinimide (NHS) ester attached to Sepharose High Performance matrix. The isopropanol preserving the gel matrix was washed away using 6 ml cold 1 mM HCl before one column volume of the concentrated IgG Octagam was applied to the column. The column was then sealed and stored at room temperature for 30 minutes before the unbound protein was washed out using 3 ml coupling buffer. The remaining unreacted active groups were deactivated using a high pH buffer (0.5 M Tris + 0.5 M NaCl, pH 8.6) and a low pH buffer (0.1 M NaAc + 0.5 M NaCl, pH 4.0). Six column volumes of high pH buffer were applied to column followed by the same volume of low pH buffer. Another six column volumes of high pH buffer was applied before the column was sealed and incubated in room temperature for 30 minutes. Uncoupled ligands were washed off using the same high pH/low pH washing cycle before storing the column in 0.1 M NaPO4 + 0.005% sodium-azide, pH 7.0 at +4ºC.
As a result of the immobilization the bed volume of the column shrunk, so the slurry was transferred into another empty column of the dimensions ∅ 5 × 42 mm. The volume of the SIC column became Vt = 0.82 ml.

3.4.3 Preparation of control column A similar HiTrap NHS-activated HP column, 1 ml was washed with cold HCl as described above. 0.5 M Tris + 0.5 M NaCl, pH 8.6 was applied directly after washing and the column was incubated in room temperature for 1 hour so that all active groups on the gel were blocked. The low pH/ high pH washing cycle was applied before the column was prepared for storage with 0.1 M NaPO4 + 0.005% sodium azide, pH 7.0. No change in the bed volume was detected.
3.4.4 Self-interaction high performance liquid chromatography analysis SI-HPLC analyses were performed as SEC as described above, see section 3.3. Five microliters of IgG Octagam stock solution was injected at a flow rate of 0.25 ml/min. The column was pre-equilibrated with five milliliters of running buffer before each injection. The concentration of NaCl in the running buffer was varied between 0 and 0.5 M at each pH using the buffers listed in Table 3. Reagents were from Merck of highest chemical grade available.
Table 3 Buffers used in SIC experiments of IgG Octagam
No pH Buffer [NaCl] (M)1 3.0 20 mM Na-citrate 02 3.0 20 mM Na-citrate 0.53 4.0 20 mM Na-citrate 04 4.0 20 mM Na-citrate 0.55 5.0 20 mM Na-citrate 06 5.0 20 mM Na-citrate 0.57 6.0 20 mM MES 08 6.0 20 mM MES 0.59 7.0 20 mM HEPES 010 7.0 20 mM HEPES 0.511 8.0 20 mM HEPES 012 8.0 20 mM HEPES 0.5
3.5 Chemical cross-linking of IgG Octagam
3.5.1 Cross-linking of IgG Octagam using Glutaraldehyde Glutaraldehyde (Grade I, 25% in water) was obtained from Sigma-Aldrich. IgG Octagam (50 mg/ml) in the buffers without any salt added listed in Table 3 was diluted to 10 mg/ml, 5 mg/ml and 1 mg/ml before the cross-linker was added to a final concentration of 0.5% or 0.25%. The cross-linking mixtures were incubated in room temperature for 30 minutes for reaction to occur before the reactions were terminated by adding Tris-HCl (pH 7.5) to a final concentration of 0.1 M. SE-HPLC analysis was conducted on a TSKgel G3000SWXL column, 7.5 x 300 mm (TosoH Biosep.) using 0.1 M NaPO4, pH 7.0 as running buffer.
13 (44)

14 (44)
3.5.2 Cross-linking of IgG Octagam using Disuccinimidyl tartrate Disuccinimidyl tartrate (DST) was obtained from Pierce (Rockford, IL, USA). DST was dissolved in dimethyl sulfoxide (DMSO) obtained from Sigma to a final concentration of 25 mM. 200 µl human IgG Octagam (50 mg/ml) was transferred into 0.2 M NaPO4 at pH 7.0, 8.0 and 9.0 by gel filtration through pre-equilibrated Sephadex G-25 in order to investigate the dependence of pH for cross-linking to occur. DST was added to 100 µl Octagam solution at each pH to the final concentration of 5 mM DST. The remaining 100 µl protein solution was kept as control sample without addition of cross-linker.
Twenty microliters were taken from the cross-linking reactions after 20, 45 and 90 minutes in order to investigate the dependence of incubation time. The cross-linking reactions were terminated by gel filtration through Sephadex G-25 pre-equilibrated with corresponding sample buffer. The dependence of cross-linker concentration in the reactions was investigated in a similar way using DST concentrations of 1 mM, 2 mM and 5 mM.
3.6 SE-HPLC analysis of cross-linked aggregates The protein aggregates that were cross-linked using DST were run on a Superdex 200 prep grade gel packed into a XK26 column, 2.6 x 90 cm (GE Healthcare, Uppsala, Sweden) coupled to an ÄKTA FPLC system (GE Healthcare) controlled by computer software UNICORN Ver. 3.10.11 (GE Healthcare). The fractions eluted from the column were collected and pooled before SE-HPLC analysis. The SE-HPLC analysis was performed on a tandem column consisting of two TSKgel G3000SW columns (7.5 x 600 mm) coupled in series on the HPLC system described in section 3.3.3. The running buffer was 0.2 M sodium-phosphate, pH 7.0.
3.7 SDS-PAGE analysis of cross-linked aggregates SDS-PAGE analysis of the IgG aggregates cross-linked using DST was performed using NuPAGE Novex 3-8% Tris-Acetate gels (Invitrogen) under reducing and non-reducing conditions. The running buffer used was NuPAGE Tris-Acetate SDS running buffer (Invitrogen). NuPAGE LDS Sample buffer (Invitrogen) was used as the sample buffer. For the gel run under reducing conditions NuPAGE Sample Reducing Agent (Invitrogen) containing dithiothreitol was added to the sample buffer.
The size marker used was a HMW Native Marker Kit (GE Healthcare) with marker proteins ranging from Mr 66-669 kDa. The protein samples were diluted to 1 mg/ml in MilliQ-water before the sample buffer and reducing agent was added resulting in a final protein concentration of 0.65 mg/ml. The mixtures were heated on a heating block at 85 ºC for 7 minutes before 25 µl was loaded on gel. The gels were run for 80 minutes under a constant voltage of 150 V before staining according to protocol using Colloidal Blue Staining Kit (Invitrogen).
3.8 Reversed-phase high performance liquid chromatography Reversed-phase high performance liquid chromatography (RP-HPLC) analysis of cross-linked IgG Octagam was carried out on an Agilent HP 1100 HPLC workstation equipped with a binary

15 (44)
pump, diode array detector (DAD), column thermostat, fluorescence detector (FLD) and sample thermostat.
The RP column used was a Zorbax 300SB-C3 (Agilent, 4.6 x 50 mm) with a particle size of 3.5 µm. The mobile phases used were A: 99.9% MilliQ-water + 0.01% trifluoroacetic acid (TFA) from Pierce and B: 99.9% acetonitrile HPLC grade (Labscan Ltd.) + 0.01% TFA (Pierce). Gradient used: 10%B (0 min), 10%B (8 min), 30%B (8.5 min), 30%B (14 min), 70%B (94 min), 100%B (95 min), i.e. a gradient 30-70%B over 80 min resulting in a slope of 0.5% per minute. The flow rate was 1 ml/min. Protein elution was monitored by UV absorption at 214 and 280 nm and also by intrinsic fluorescence of protein tryptophan residues. Excitation wavelength was 280 nm and emitted light was detected at 345 nm. Bandwidths were 20 nm.
3.9 Dynamic light scattering DLS measurements were performed using a DynaPro Titan dynamic light scattering instrument from Wyatt Instruments (Santa Barbara, USA). The instrument was equipped with a laser (50 mW output at 825.4 nm) and a temperature-controlled microsampler. The instrument was controlled and data were processed by the Dynamics V6 version 6.7.7.9 (Wyatt Technology Corp.) software.
Experimentally measured time course of fluctuations of intensity of scattered light were converted into the intensity autocorrelation function (correlation function), which bear information about diffusion rates of particles of different sizes. It was assumed that viscosity of the solvent was equal to the one of D-PBS buffer. Regularization algorithm of the Dynamics program was used to approximate the experimental correlation function with a sum of exponentials. In this way experimental size distribution plots showing intensity of scattered light (%Int) vs. effective hydrodynamic radius (Stokes radius or Rh) of light scattering particles were obtained.
Besides Rh the software allowed extracting several other parameter, such as weighted average of molecular mass (MW-R) and peak polydispersity (%Pd). Peaks in size distribution plots with %Pd < 15% were considered to belong to homogeneous populations of macromolecules.
Samples for DLS studies were prepared in two ways. In experiments aimed to analyze aggregate composition liquid samples were centrifuged for 10 minutes at ~14000 g in a table centrifuge. For characterization of the protein macromolecule samples were centrifuged as above and then filtered through 0.1 μm filter. 20 µl of the sample was applied and the cuvette was sealed.
3.10 Other laboratory equipment Optical absorption spectra were recorded in the range of 220 – 400 nm using Beckman diode array D7400 spectrophotometer in standard quartz cuvettes with a 1 cm light path. Recording time for each spectrum was 1 s. A buffer blank was subtracted.
pH was measured by a microelectrode model Inlab 423, Mettler Toledo (Switzerland) coupled to a pH meter model Orion 420 A.

16 (44)
3.11 Signal manipulation HPLC signal manipulation and peak area computations were made with the help of HPLC software: ChemStation for LC 3D Rev. B.01.03 (204) and ChemStore C/S Rev. B.03.02 (Agilent Technologies).
Experimental data were approximated by straight lines using the “Add trend line” algorithm of the Excel 2000 program (Microsoft). Average values and standard deviations were calculated using the AVERAGE and STDEV, respectively functions of the Excel 2000 program. Relative standard deviation values (expressed in %) were calculated by dividing each standard deviation value by the corresponding average.

17 (44)
4 RESULTS
4.1 Size-exclusion high performance liquid chromatography of IgG Octagam
In order to use a SEC method as an analytical tool to study formation of protein aggregates it is necessary to select a suitable column and find the most optimal conditions of chromatography. Some important chromatographic parameters, e.g. dynamic range and column selectivity, are primarily determined by the column matrix and packing and cannot be affected by selection of mobile phase or column temperature. There are a number of commercially available SEC columns designed for protein studies (Corbett and Roche., 1984; Welling et al., 1986). The first task therefore was to select the best column suitable for separation of associated and aggregated macromolecules from monomeric IgG.
In SEC the separation of macromolecules is based on their differences in geometrical size, characterized by the effective hydrodynamic radius (Rh) often referred to as the Stokes radius (Siegel and Monty, 1966; Ackers, 1967; Horiike et al., 1983).
One should bear in mind that several factors may interfere with the SEC separation principle. One of them is unspecific interactions between the protein and the column matrix. Most such unspecific interactions are due to hydrophobic interactions or charge based interactions between the protein and the column matrix. The most common way to minimize these interactions is to adjust pH and ionic strength of the running buffer. The second task was therefore to select the most optimal chromatographic conditions, discover and minimize the non-specific interactions.
4.1.1 Optimization of SE-HPLC
4.1.1.1 Column selection Figure 1 shows the chromatograms of Bio-Rad gel filtration standards (see Material and Methods) for the five different size-exclusion columns tested and evaluated for analysis of IgG Octagam. Inserted in the figures are calibration curves obtained from the elution volumes and Stokes radii of the proteins in the standard mixture mentioned above (see Materials and Methods). An example of such calibration can be seen in Table 2. The obtained calibration curves showed a reasonably good linearity in the coordinates Stokes radius vs. (-log (Kav)) 1/2) (Laurent and Killander, 1964). From the chromatograms presented in Figure 1A-E one can see that the selectivity for the proteins in the standard mixture differs between the five columns. It is obvious from this comparison that the Zorbax GF-250 (Agilent) column is the least appropriate column for separation of these proteins. Also the TSKgel G2000SW (TosoH Biosep.) column showed bad separation between the eluting peaks. The best separation patterns for the standard proteins Thyroglobulin and bovine IgG were obtained with the Superdex 200 HR 10/30 (GE Healthcare) and TSKgel G3000SWXL (TosoH Biosep.) columns.

Figure 1 Chromatograms of Bio-Rad gel filtration standard on different analytical size-exclusion (SE) columns. 10 µl of 10 mg/ml protein mixture was injected in each case. The mixture of the standards contained the following species: Protein aggregates, void peak (1), Thyroglobulin, 670 kDa (2), Bovine γ-globulin, 158 kDa (3), Ovalbumin 44 kDa (4), Myoglobin, 17 kDa (5), Vitamin B12, 1.35 kDa (6). Panel A. TSKgel G2000SW column (TosoH Biosep.), 7.5 x 300 mm. Panel B. TSKgel G3000SW column (TosoH Biosep.), 7.5 x 600 mm. Panel C. TSKgel G3000SWXL column (TosoH Biosep.), 7.5 x 300 mm). Panel D. Superdex 200 HR10/30 FPLC column (GE Healthcare), 10 x 300 mm. Panel E. Zorbax GF-250 column (Agilent Technologies), 9.4 x 250 mm.
The preliminary conclusions drawn from the calibration standards were verified in experiments with the protein of interest, IgG Octagam. Chromatograms of IgG Octagam on different columns are shown in Figure 2 (A-E) along with the calibration curves of the protein standards (see Figure 1) obtained at the same conditions. Four of the five columns tested allowed separating at least two peaks in the protein preparation: the intense main peak, which is tentatively assigned to the IgG monomer and the pre-peakof dimerized or/and polymerized IgG (see Figure 2, panels A-D). The Zorbax GF-250 column was not able to separate the minor peak from the main one (Panel E in Figure 2).
Figure 2 Chromatograms of 25 µl of human IgG Octagam (50 mg/ml) on the different analytical SE columns. Inserted is calibration curves obtained from standards (Figure 1).
18 (44)

Table 4 shows the estimated Stokes radius for the main SEC peak of Octagam obtained from the standard curves for the different columns. The analysis performed on Superdex 200 HR 10/30 (GE Healthcare) resulted in the value of Stokes radius, Rh = 5.14 nm of IgG Octagam, which is the closest to the published value of the Stokes radius, Rh = 5.22 nm of monomeric IgG (Rogers et al., 1997). The peak identities were confirmed as the main peak of IgG Octagam was identified as monomers and the pre-peak was identified as a mixture of dimers and trimers by SE-HPLC analysis with light scattering (LS) and refractive index (RI) detection (see Figure 3).
Table 4 Estimation of hydrodynamic radius of IgG Octagam monomer using the different SE-HPLC columns
Column V0 (ml) Vt (ml) Ve (ml) Kav Est. Rh (nm)
Zorbax GF-250 7.08 17.35 9.07 0.193 4.58TSKgel G2000SW 5.31 13.25 6.09 0.099 5.01TSKgel G3000SW 9.6 26.5 14.66 0.299 4.33
TSKgel G3000SWXL 5.67 14.34 7.9 0.258 4.59Superdex 200 HR 10/30 8.16 24.00 12.05 0.246 5.14
Octagam monomer
The TSKgel G3000SWXL (TosoH Biosep.) column showed an underestimation of the Stokes radius (4.59 nm) compared to the published value. In conclusion, for the purpose to estimate the size of a protein the Superdex 200 HR 10/30 (GE Healthcare) column should be used. The obtained value of Rh also supports the assignment of the main SEC peak to monomeric IgG.
Figure 3 SE-HPLC of Octagam with LS and RI detection for estimation of molecular weight. Molecular mass determination from LS and RI signals of the main peak resulted in the value of 151 kDa, which implies that it may consist of monomers. The smaller pre-peak was estimated to be of the size of 335 kDa, which suggests that it consists mostly of IgG dimers.
The separation between Thyroglobulin and bovine IgG (Figure 1) as well as the separation of IgG Octagam pre-peak and main peak (Figure 2) indicates that the selectivity of the TSKgel G3000SWXL column is comparable to the selectivity of the analytical Superdex 200 column.
19 (44)

When comparing three similar silica columns (Figure 2A-C), it was found that the selectivity was dependent on the different particle and pore sizes. Chromatograms in Figure 2A-B were obtained on two columns that had the same particle size but different pore sizes (see Table 1). The column (TSKgel G3000SW) with the bigger pore size in the silica beads has a better selectivity compared to the column with the smaller pores. The selectivity is even further improved when using the same pore size (250 Å) in smaller particles (5 µm in diameter) as can be observed in Figure 2C.
The selectivity, determined by the column matrix, is not the only parameter of interest when evaluating different columns. The mobile phase, flow rate and column temperature during analysis may also influence the performance of the column by band broadening effects. The parameter of resolution, Rs, summarizes both the selectivity and the band broadening effects during analysis (see Eqn. 2). The resolution between the Octagam dimer and monomer peaks for the different columns are listed in Table 5.
Table 5 Resolution parameter for the Octagam peaks on different analytical SEC columns
Dimer MonomerColumn Ve (ml) Ve (ml) ΔVe (ml) (WA + WB) /2 (ml) Rs
Zorbax GF-250TSKgel G2000SW 5.39 6.09 0.70 1.09 0.6TSKgel G3000SW 11.89 14.66 2.77 3.75 0.7
TSKgel G3000SWXL 6.85 7.90 1.06 1.22 0.8Superdex 200 HR 10/30 10.20 12.05 1.85 1.88 1.0
No separation between the dimer and monomer peaks
From the data presented in it can be stated that the TSKgelG3000SW column (see Figure 2B) shows good selectivity but the broad peaks eluting from the column worsen the resolution of this column. For TSKgel G3000SWXL the peaks are narrow but the selectivity has a negative influence on the resolution between the two peaks eluting for IgG Octagam. In overall, the Superdex 200 presents the best resolution between the dimer and monomer peaks.
From these results it is concluded that the best columns for analytical SEC analysis of IgG Octagam is Superdex 200 HR10/30 FPLC column (GE Healthcare) and TSKgel G3000SWXL (TosoH Biosep.). However, the shorter analysis time (20 min) for the TSKgel G3000SWXL column makes it a more convenient column for analysis than the Superdex 200 column with analysis time of 50 minutes. Superdex 200 should be preferably used for estimation of Stokes radii of proteins of the size around 5 nm. For the sake of convenience in most of the experiments reported below the faster TSKgel G3000SWXL was used.
4.1.1.2 Ionic strength in running buffer The ionic strength of the running buffer is a factor that may influence the column resolution during analysis. This may be due to altered elution volume because of unspecific interactions between the solute and the column matrix. Such interactions may also be indicated by band broadening effects observed as broadening of the eluting peaks.
20 (44)

The chromatograms in Figure 4 show that the shape of the peaks as well as the elution volumes are changed when analyzing using a low ionic strength in the running buffer (blue traces) compared to when using higher ionic strengths (up to 0.4 M NaPO4 at pH 7.0). The peaks of the Bio-Rad gel filtration standards (Figure 4A) analyzed using 0.05 M NaPO4 at pH 7.0 differs significantly compared to when using 0.1-0.4 M NaPO4 at the same pH in the running buffer. The same phenomenon is observed for IgG Octagam (Figure 4B). For IgG Octagam this effect of unspecific interactions with the column matrix is observed in broadening of the elution peaks whereas the elution volumes of some proteins are altered when studying the Bio-Rad gel filtration standards (Figure 4A). Since this effect is observed for low ionic strengths this is probably because of electrostatic interactions between the solute protein and the column matrix. However, no visible effect of altered protein interactions such as increased or decreased dimer peak area could be observed at different ionic strengths in the running buffer.
Figure 4 SE HPL Chromatograms of Bio-Rad gel filtration standards and IgG Octagam on TSKgel G3000 SWXL SE column obtained at pH 7.0 and at different ionic strengths in running buffer indicating peak broadening effects at low ionic strengths in running buffer. A. Bio-Rad gel filtration standards: – blue trace - [NaPO4] = 0.05 M, – red trace - [NaPO4] = 0.1 M, – green trace - [NaPO4] = 0.4 M. B. IgG Octagam: – blue trace - [NaPO4] = 0.05 M, – red trace - [NaPO4] = 0.1 M, – green trace - [NaPO4] = 0.4 M. Analysis conducted at pH 7.0 with different ionic strengths in running buffer. Other conditions see Material and Methods.
The same behavior is observed when analyzing Bio-Rad standards and IgG Octagam, respectively, using sodium-acetate buffers (see Figure 5). The protein standards behave similarly when using 0.1-0.4 M NaAc in the running buffer whereas the elution volume and the peak broadening of the different proteins are altered at 0.05 M NaAc in running buffer (blue trace, Figure 5A). In Figure 5B the chromatograms of Octagam when using 0.05 M and 0.1 M sodium-acetate in running buffer are compared showing lower and broader peaks when using 0.05 M NaAc (blue trace).
21 (44)
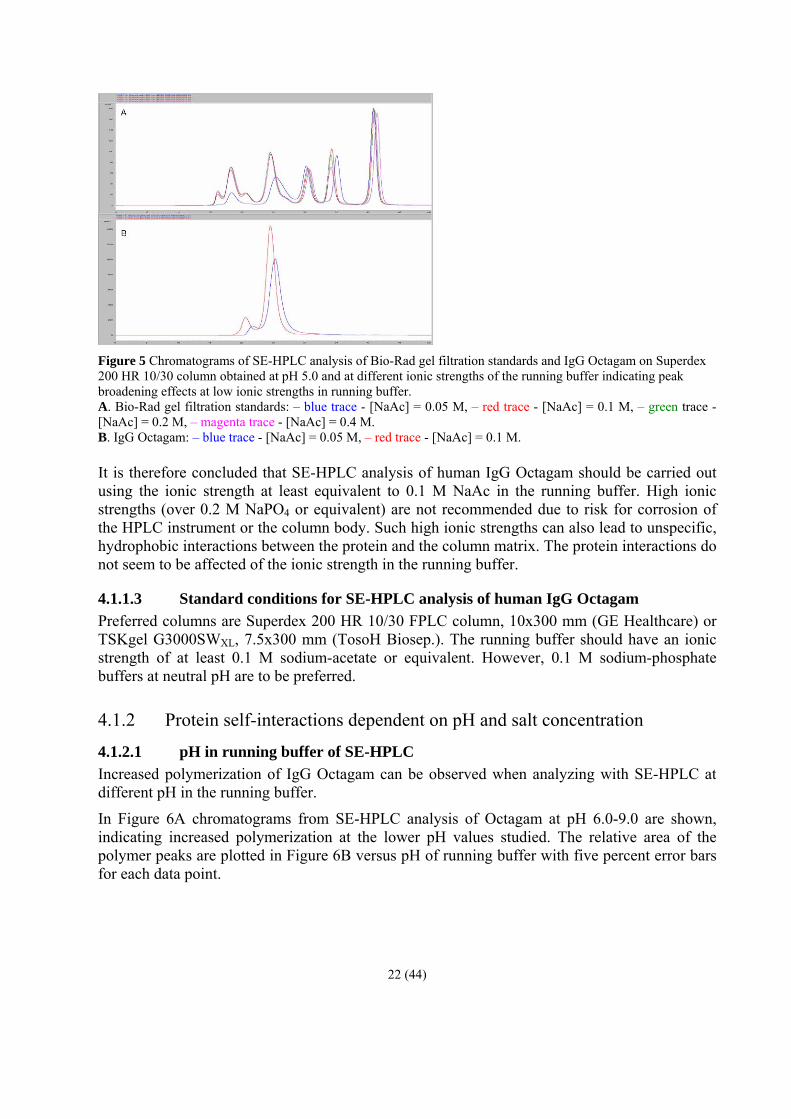
Figure 5 Chromatograms of SE-HPLC analysis of Bio-Rad gel filtration standards and IgG Octagam on Superdex 200 HR 10/30 column obtained at pH 5.0 and at different ionic strengths of the running buffer indicating peak broadening effects at low ionic strengths in running buffer. A. Bio-Rad gel filtration standards: – blue trace - [NaAc] = 0.05 M, – red trace - [NaAc] = 0.1 M, – green trace - [NaAc] = 0.2 M, – magenta trace - [NaAc] = 0.4 M. B. IgG Octagam: – blue trace - [NaAc] = 0.05 M, – red trace - [NaAc] = 0.1 M. It is therefore concluded that SE-HPLC analysis of human IgG Octagam should be carried out using the ionic strength at least equivalent to 0.1 M NaAc in the running buffer. High ionic strengths (over 0.2 M NaPO4 or equivalent) are not recommended due to risk for corrosion of the HPLC instrument or the column body. Such high ionic strengths can also lead to unspecific, hydrophobic interactions between the protein and the column matrix. The protein interactions do not seem to be affected of the ionic strength in the running buffer.
4.1.1.3 Standard conditions for SE-HPLC analysis of human IgG Octagam Preferred columns are Superdex 200 HR 10/30 FPLC column, 10x300 mm (GE Healthcare) or TSKgel G3000SWXL, 7.5x300 mm (TosoH Biosep.). The running buffer should have an ionic strength of at least 0.1 M sodium-acetate or equivalent. However, 0.1 M sodium-phosphate buffers at neutral pH are to be preferred.
4.1.2 Protein self-interactions dependent on pH and salt concentration
4.1.2.1 pH in running buffer of SE-HPLC Increased polymerization of IgG Octagam can be observed when analyzing with SE-HPLC at different pH in the running buffer.
In Figure 6A chromatograms from SE-HPLC analysis of Octagam at pH 6.0-9.0 are shown, indicating increased polymerization at the lower pH values studied. The relative area of the polymer peaks are plotted in Figure 6B versus pH of running buffer with five percent error bars for each data point.
22 (44)

Figure 6 Dependence of the amount of polymerized species of IgG Octagam on pH of the running buffer in SE HPLC. An increased polymerization of IgG Octagam is observed when lowering the pH to pH 6 and pH 7. A. SE HPL chromatograms: – blue trace - = pH 6.0; – red trace - = pH 7.0; – green trace - = pH 8.0; – magenta trace - = pH 9.0. Peaks assigned to a polymerized protein are indicated. B. Dependence of the relative area of the polymer peak area (in % of the area of the total protein peak) on pH. Estimated 5% errors are indicated. The column was Superdex 200 HR 10/30 FPLC column (GE Healthcare), 10 x 300 mm. The sample injected was 20 µl IgG Octagam (50 mg/ml). Running buffer was 0.2 M sodium-phosphate buffers at different pH.
This increase in peak area of the eluted polymer peak indicates increased protein interactions at pH 6 and pH 7 compared to pH 8 and 9. This might be due to hydrophobic interactions caused by increased hydrophobicity of at least some of the IgG molecules present in the heterogeneous protein mixture since the buffer used in this analysis was of high ionic strength (0.2 M sodium-phosphate buffer). This high ionic strength should decrease the possible electrostatic interactions and promote the hydrophobic interactions due to local salting-out effects around the protein.
4.1.2.2 Sample pre-incubation at low pH Even though some self-interactions could be observed just by varying the pH of the running buffer in the column, the protein was incubated at lower pH values in order to stabilize the interactions so they could be detected more easily using SE-HPLC.
23 (44)

Figure 7 shows the chromatograms of 10 mg/ml IgG Octagam after incubation at pH 3.0 in 0.05 M NaPO4 + 0.3 M NaCl. The blue trace represents the IgG Octagam sample stored at -70ºC for 96 hours and shows formation of multiple polymeric species after thawing the sample. When incubating the sample at the same pH, in the same buffer but at room temperature a lot more of high molecular weight (HMW) species are formed (eluting in column void volume). It is clear that the proteins in some way are sensitive to acidic environments themselves as well as freezing/thawing treatment at these conditions.
Figure 7 SE-HPL chromatograms of IgG Octagam incubated for 96 hours at pH 3.0 with NaCl present demonstrates formation of HMW protein species. Blue trace - frozen IgG Octagam sample, kept at -70 °C. Red trace – liquid sample of IgG Octagam incubated at room temperature. The sample was 10 mg/ml IgG Octagam solution in 50 mM Sodium phosphate, pH 3.0 with 0.3 M NaCl. The TSKgel G3000SWXL column (TosoH Biosep., 7.5 x 300 mm) was used. Running buffer was 50 mM HEPES, 0.3 M NaCl, pH 7.0.
The effects of incubation at different temperatures are almost diminished when studying the size-exclusion chromatograms of samples incubated at pH 4.0 in -70ºC and room temperature, respectively, in Figure 8. At pH 4.0 only small amounts of aggregates or other HMW species are detected after incubation for 96 hours at either of the temperatures mentioned above.
Figure 8 SE HPL chromatograms of IgG Octagam incubated for 96 hours at pH 4.0 and different temperatures showing no significant increase in HMW protein species. Blue traces - frozen Octagam sample, kept at -70 °C. Red traces - liquid sample of Octagam incubated at room temperature. The sample was 10 mg/ml IgG Octagam in 50 mM Na-Acetate with 0.3 M NaCl, pH 4.0. SE HPLC was performed as in Figure 7.
Figure 9 indicates a difference in protein interactions when comparing samples incubated at the same pH with different salt concentrations. In panel A the sample is incubated in 0.05 M
24 (44)

sodium-citrate at pH 3.5 and only a very small amount of aggregates are formed after 96 hours at room temperature. The sample stored at -70ºC shows almost no polymeric protein species after 96 hours incubation (blue trace).
When incubating the sample in 0.05 M sodium-acetate and 0.3 M sodium-chloride (see Figure 9B) for 96 hours at pH 3.5 in room temperature (red trace) a large amount of aggregates are formed compared to the sample incubated at -70ºC (blue trace). This result indicates that in acidic solutions increased salt concentration leads to increased formation of aggregates.
Figure 9 SE HPL chromatograms of IgG Octagam incubated for 96 hours at pH 3.5 with and without NaCl indicates more formed aggregates when NaCl is present. A. IgG Octagam, 10 mg/ml in 50 mM Na-Citrate, pH 3.5. B. IgG Octagam, 10 mg/ml in 50 mM Na-Acetate with 0.3 M NaCl, pH 3.5 Blue traces - frozen Octagam sample, kept at -70 °C. Red traces - liquid sample of Octagam incubated at room temperature. SE HPLC was performed as in Figure 7.
4.2 Self-interaction chromatography of IgG Octagam One method available to study weak interactions between protein macromolecules is self-interaction chromatography (SIC) (Patro and Przybycien, 1996; Tessier et al., 2002; Tessier and Lenhoff, 2003). SIC was here adopted to study interactions between human IgG molecules. Approximately 100 mg IgG Octagam was immobilized on the NHS-activated Sepharose matrix (see Material and Methods). SIC was performed in the way similar to SEC: IgG Octagam was injected and eluted isocratically. The interactions between the immobilized IgG molecules and the ones in the running buffer lead to retardation of the protein peak. Retention volume of the
25 (44)

mobile IgG was the average measure of self-interactions of human IgG Octagam Tessier et al. 2002).
Results presented in Figure 10 are examples of SIC studies concerning the influence of ionic strength on self-interaction of IgG. The SI column in these studies was equilibrated with a running buffer containing varying amount of sodium chloride. The same buffer was used for elution. Chromatograms in Panel A, Figure 10 were obtained at pH 3.0 and show that retention time of the maximum of the protein peak increases with salt concentration. At the same time the protein peak broadens and no changes in the column bed volume were observed. The retardation and broadening effects can therefore be explained by interaction of the IgG in the running buffer with the immobilized protein. In acidic solutions this self interaction increases with ionic strength.
Quite the opposite behavior of IgG was observed in neutral and slightly basic solutions, see for example data presented in Panel B, Figure 10.
Figure 10 Chromatograms of self-interaction of IgG Octagam obtained at pH 3.0 and pH 8.0 with different salt concentrations in running buffer showing differences in protein self-interactions at acidic and slightly alkaline pH, respectively. A. pH 3.0 (20 mM Na-citrate). B. pH 8.0 (20 mM HEPES) Each buffer contained the specified amount of salt: – blue trace - [NaCl] = 0 M, – red trace - [NaCl] = 0.1 M, – green trace - [NaCl] = 0.2 M, – magenta trace - [NaCl] = 0.3 M, – khaki trace - [NaCl] = 0.4 M, – cherry trace - [NaCl] = 0.5 M. SIC column was 0.82 ml of immobilized IgG in Sepharose matrix column (see Material and Methods). 5 µl of the same IgG protein (50 mg/ml stock solution) was injected onto the column in each chromatogram. In each case the column was pre-equilibrated with running buffer.
The results of SIC studies of IgG Octagam over a wide range of pH (3.0-8.0) with NaCl concentrations of 0 - 0.5 M are summarized in Figure 11 as dependences of the retention volume of the protein peak on sodium chloride concentration in the running buffer. It is evident that in the absence of salt self-interactions were greatly increased on going from pH 3.0 to pH 8.0. Addition of salt makes the pH dependence less pronounced, so that at 0.5 M NaCl there were practically no differences between the different pH levels.
26 (44)

It is also noted that at acidic and neutral pH the proteins behave differently upon addition of NaCl. At low pH (pH 3.0 and 4.0) the self-interactions were increased as the ionic strength increased, whereas the opposite was observed at pH 7.0 and 8.0. This may indicate that the protein has undergone some kind of conformation transition on going from low pH to neutral pH. At the intermediate pH levels (pH 5.0 - 6.0) the retention volume of the protein is at minimum when having added 0.2 M NaCl to the running buffer suggesting weaker protein-protein interactions compared to when running with other ionic strengths.
Control studies were performed in order to confirm that the described effects result from protein-protein self interaction and not from unspecific interactions of the injected sample with the material of the column matrix. The control experiments were made on a specially made blank deactivated control column (see Materials and Methods).
0,5
0,6
0,7
0,8
0,9
1
0 0,1 0,2 0,3 0,4 0,5 0,6
[NaCl] (M)
Ret
entio
n Vo
lum
e (m
l)
pH8.0pH7.0pH6.0pH5.0pH4.0pH3.0
Figure 11 Self-interaction chromatography of IgG Octagam at different pH. Dependence of protein elution volume on NaCl concentration in running buffer. The data points are the retention volumes of the peak maxima obtained from SI-HPLC of IgG Octagam at the different pH as presented in Figure 10. The lines in the curves just connect the experimental points obtained from the chromatograms.
Data presented in Figure 12, Panel A are from the experiments with the control column. Panel B in Figure 12 shows chromatograms obtained under the same conditions with the SIC column. In the case of the blank control column no significant retardation of the peak nor peak broadening were seen upon increase of sodium chloride concentration as compared to the SIC column. The total larger retention time of protein peak observed with the control column could be assigned to a larger volume of this column, 1.0 ml compared to the 0.82 ml of the SIC column (see Material and Methods).
27 (44)

Figure 12 Chromatograms of IgG Octagam self-interaction at pH 4.0 using different NaCl concentrations in running buffer. Comparison with a control column with no immobilized IgG Octagam. A. Chromatograms from IgG Octagam on a deactivated NHS-Sepharose control column (see Material and Methods). The column volume was 1 ml. B. Chromatograms of IgG Octagam injected onto the SIC column. The column contained immobilized IgG Octagam (see Material and Methods). The column volume was 0.82 ml. 5 µl of IgG Octagam 50 mg/ml stock solution was injected onto the column in each case. Before the injection the column was pre-equilibrated with the running buffer: 20 mM Na-citrate, pH 4.0, containing the specified NaCl concentration: – blue trace -[NaCl] = 0 M, – red trace -[NaCl] = 0.1 M, – green trace -[NaCl] = 0.2 M, – magenta trace -[NaCl] = 0.3 M, – khaki trace -[NaCl] = 0.4 M, – cherry trace - [NaCl] = 0.5 M.
Results of another control experiment are shown in Figure 13, where the behavior of IgG Octagam at two different pH (pH 4.0 and pH 8.0) is presented. An unusually strong retardation and is observed at pH 8.0 in absence of salt (red trace in Figure 13). Contrary to results with the SIC column in the region [NaCl] > 0.1 M no dependence of retention time on salt concentration could be observed neither at acidic nor at alkaline conditions in presence of salt.
0,5
0,6
0,7
0,8
0,9
1
1,1
1,2
1,3
1,4
1,5
0 0,1 0,2 0,3 0,4 0,5 0,6[NaCl] (M)
Rete
ntio
n vo
lum
e (m
L)
pH 8.0pH 4.0
Figure 13 SI-HPLC of IgG Octagam on the deactivated Sepharose control column indicates unspecific interactions between IgG Octagam and Sepharose matrix at pH 8.0 and no added NaCl. IgG Octagam, 5 µl of the 50 mg/ml stock solution was injected onto the deactivated control column at different pH of running buffer with varying NaCl concentration. The column was in each case pre-equilibrated with the running buffer; 20 mM Na-citrate, pH 4.0 (as in Figure 12) and 20 mM HEPES, pH 8.0 with different NaCl concentration before sample injection.
28 (44)

4.3 Chemical cross-linking of IgG Octagam
4.3.1 Cross-linking of IgG Octagam using Glutaraldehyde The SIC data described above showed evidence of protein self-interactions. It is conceivable that upon incubation the propensity of IgG to form associates may result in more or less stable complexes and aggregates detectable in SEC experiments.
In order to get additional support of the existence of self-associated IgG in solutions an attempt was made to stabilize weakly bound associates by covalent bonds. The aim was to convert protein associates into soluble stable complexes. One of the possible agents suitable for the purpose is the commonly used homobifunctional chemical cross-linker Glutaraldehyde (GA) (Habeeb and Hiramoto, 1968; Jansen et al., 1971; Payne, 1973; Migneault et al., 2004).
4.3.1.1 Optimization of GA cross-linking reaction A study was done to optimize the cross-linking procedure which yields soluble and stable aggregates. For this purpose buffers, protein and GA concentrations and time of incubation were varied. The selection principles were SE-HPLC and visual analysis of the appearance of insoluble aggregates. The protein concentration was varied between 1-10 mg/ml and GA concentration was varied between 0.25 - 0.5%. Incubation times ranging from 15 minutes up to 90 minutes were evaluated. For evaluation of cross-linking at all pH levels, around 150 injections were made onto the SE-HPLC column.
Figure 14, Panel B presents an example of how the amount of formed soluble aggregates was quantified using the relative polymer peak area in the SE chromatograms. All protein species larger than monomer were polymers as shown in the chromatograms.
Figure 14 SE-HPL Chromatograms of IgG Octagam cross-linked by Glutaraldehyde at pH 5.0 showing successful protein crosslinking at these conditions. A. Control: Octagam without additives. B. Octagam after 30 min incubation with 0.5% Glutaraldehyde at room temperature. Peaks of the monomer and of polymers are indicated.IgG Octagam concentration in both cases was 10 mg/ml; the buffer was 20 mM Na-citrate, pH 5.0. Cross-linking reaction was terminated by adding Tris-HCl to 0.1 M.
29 (44)

Figure 15 shows chromatograms from cross-linking reactions using different concentrations of IgG Octagam. When incubating 5 mg/ml IgG Octagam with 0.25% GA for 20 minutes (Figure 15A) almost no protein was detected using SE-HPLC. Apparently almost all of the protein was rapidly cross-linked into insoluble aggregates. Figure 15B shows the chromatogram from the analysis of the same reaction with 1 mg/ml IgG Octagam with different protein species detected indicating formation of soluble aggregates of different sizes.
Figure 15 Effects of protein concentration on cross-linking reactions visualized by SE-HPLC. A. 5 mg/ml of Octagam. B. 1 mg/ml of Octagam. The protein was incubated for 20 min at room temperature in 20 mM MES, pH 6.0 buffer with 0.25% Glutaraldehyde. SE-HPLC performed as in Figure 14.
The effect of altered protein concentration is summarized in Figure 16 where the two graphs indicate the total peak area in the chromatograms of cross-linking reactions at different pH as shown in Figure 15. When using a protein concentration of 5 mg/ml IgG Octagam the total peak area is dramatically decreased at pH 6.0 and above which indicates formation of insoluble aggregates. The total peak area decreases at higher pH also when using 1 mg/ml Octagam but not to the same low level as for the higher protein concentration. Also the Glutaraldehyde concentration contributes to the formation of insoluble aggregates but not in the same extent as the protein concentration.
30 (44)

0
10
20
30
40
50
60
70
80
90
100
2,0 3,0 4,0 5,0 6,0 7,0 8,0 9,0pH
Peak
are
a (%
of c
ontr
ol re
actio
ns)
5mg/ml1mg/ml
Figure 16 The peak area of the crosslinked protein samples compared to the unreacted control samples show a pH dependence of disappearance of soluble protein upon cross-linking.
It was finally determined that in the broad pH range, pH 3.0 – 8.0, it was sufficient to incubate 1 mg/ml of IgG with 0.25% of GA. Higher concentrations of either IgG Octagam or Glutaraldehyde resulted in formation of insoluble aggregates (precipitate). Figure 17 shows how much polymer is formed depending on pH when 1 mg/ml of IgG Octagam was incubated with 0.25% of GA for 20 minutes.
0
10
20
30
40
50
60
2 4 6 8pH
Pol
ymer
pea
k (%
of t
otal
pea
k ar
ea)
0.25%GA
Ctrl
Figure 17 Relative peak area of polymer peaks of IgG Octagam plotted vs. pH of cross-linking reaction shows increased crosslinking of protein as pH is increased. Data were obtained from integration of peaks in chromatograms, as indicated in Figure 14.
31 (44)

4.3.2 Cross-linking of IgG Octagam using disuccinimidyl tartrate (DST) Most of the methods for analysis of macromolecular composition need standards with defined properties. An attempt was therefore made to prepare a sufficient amount of such water soluble standards of self-associated and/or aggregated IgG by means of chemical cross-linking. The homobifunctional amine-reactive cross-linker DST (Smith et al., 1978; Park et al., 1986; Füzesi et al., 2005) was used. First, a study to find optimal conditions for cross-linking was carried out, and then the cross-linked products were fractionated using a preparative SEC column. The prepared fractions of cross-linked aggregates were characterized by means of analytical SE-HPLC, RPC, DLS and SDS-PAGE.
4.3.2.1 Optimization of cross-linking reaction The cross-linking reaction involving DST is most efficient in buffers at pH 7-9 and produces stable amide bonds between the reacting groups (mostly free amine groups of lysine residues in the proteins).
Figure 18 SE-HPLC analysis of IgG Octagam cross-linked with disuccinimidyl tartrate (DST). Comparison of products obtained at pH 7.0, pH 8.0 and pH 9.0. Octagam, 50 mg/ml was incubated with 5 mM disuccinimidyl tartrate (DST) in 0.2 M sodium-phosphate buffers at: pH 7.0 (blue trace), pH 8.0 (red trace) and pH 9.0 (green trace). SE-HPLC was run on a TSKgel G3000SWXL column (TosoH Biosep.), 7.4 mm × 30 cm with 0.1 M sodium-acetate, pH 5.0 as running buffer.
Figure 18 show SE-HPL chromatograms of products from DST - IgG reactions carried out at different pH. Effects of variation of DST concentration are illustrated in Figure 19. Reactions performed at pH 9.0 resulted in formation of higher levels of soluble aggregates. These are the species eluting in the column void volume, i.e. at 7 – 8 min. At pH 7.0 the relative amount of polymers is lower (see Figure 18). Formation of high molecular weight species was strongly dependent on DST concentration (see Figure 19). Only small amounts of HMW species were formed using 1 and 2 mM of DST (blue and red traces in Figure 19) compared to the very high degree of aggregates formed with 5 mM DST (green trace in Figure 19). The conditions of 5 mM DST and pH 8.0 were selected as the most optimal for further studies.
32 (44)

Figure 19 Effects of DST concentration on cross-linking of IgG Octagam. SE-HPLC analysis of IgG incubated with DST. The protein, 50 mg/ml was incubated for 30 min at room temperature with: 1 mM DST (blue trace), 2 mM DST (red trace) and 5 mM DST (green trace).Incubation buffer was: 0.2 M sodium-phosphate buffer pH 8.0. SE-HPLC was performed as in Figure 18 with UV detection at 214 nm.
4.3.2.2 Preparation of soluble associates cross-linked by DST A relatively large amount of IgG Octagam was cross-linked at pH 8.0 using 5 mM DST (see Material and Methods) resulting in high yield of soluble cross-linked material. Soluble associates of different sizes were then isolated by means of preparative SE-FPLC using a Superdex 200 prep grade column (see Material and Methods). The chromatogram is presented in Figure 20. Five species of different size were defined in the chromatogram and were pooled as indicated in Figure 20.
SE-HPLC analysis of the collected fractions allowed an identification of the peaks in the chromatogram. It was found that fraction 5 represents non-reacted protein, i.e. monomeric IgG. Fraction 4 is dimerized IgG. Fractions 2 and 3 appeared to be most heterogeneous of the cross-linked species.
Figure 20 SEC fractionation of IgG Octagam cross-linked by DST resulting in isolation of differently sized protein species. IgG Octagam; 50 mg/ml was incubated with 5 mM DST for 30 min at room temperature in 0.2 M sodium-phosphate buffer, pH 8.0. Fractions of five regions (#1 - #5), were defined and pooled as indicated in the chromatogram. Preparative SE-FPL chromatography was performed on Superdex200 preparative column, 2.6 × 90 cm (see Material and Methods) with 0.1 M sodium-acetate, pH 5.0 as running buffer.
33 (44)

The heterogeneous fractions 2 and 3 in Figure 20 were further rechromatographed on the same Superdex 200 prep grade column. Chromatograms from the second preparative chromatography of these fractions are shown in Figure 21. Fraction 2 (Figure 21A) clearly contains two separate protein species. Fractions containing the heaviest of these species were pooled together and mixed with fraction 1 from the first SEC preparation (see Figure 20). This pool was named pool A and according to SE HPLC represents the protein aggregates biggest in size. Aggregates of smaller size in this preparation were collected as pool B (see Panel A, Figure 21).
Figure 21B shows SE FPLC rechromatography of fraction 3 from the first SEC preparation (see Figure 20). It appeared to be the most heterogeneous of the aggregate fractions. The collected fractions from this second preparative chromatography were pooled into four different pools of cross-linked IgG aggregates (A-D) as indicated in Figure 21, Panel B.
Figure 21 Preparative re-chromatography of collected pools on SE-FPLC. A. SE-FPL chromatogram of pool 2 in Figure 20. Two regions indicated as A and B were selected for further analyses. B. Chromatogram of pool 3 in Figure 20. Four regions indicated A – D were pooled for further analyses. Fractions from regions A and B were pooled together with the corresponding fractions shown in Panel A. FPLC was conducted as described in Figure 20.
Figure 22 shows chromatograms of the cross-linked aggregate species of IgG Octagam indicated in Figure 20 and Figure 21 analyzed on two TSKgel G3000SW HPLC columns (see Material and Methods) coupled in sequence into a tandem column. Panel A shows the chromatogram of the aggregate peak (pool A), the complex which on the preparative Superdex 200 column was eluted in the void volume.
The chromatogram in panel B, Figure 22 represents aggregate pool B (see Figure 21). When comparing these two chromatograms it seems obvious that the dominating component of the both pools is the same with a certain admixture of smaller species, indicated by the slight tailing in the chromatograms. More tailing was observed with pool B as compared to Pool A (cf. Panels B and A in Figure 22).
Pool C (chromatogram in panel C, Figure 22) also seems to be heterogeneous and partly contain the same species as pool D (see panel D). These two pools originate from the same protein peak (see Figure 21B).
34 (44)

Panel E shows the chromatogram from the SE-HPLC analysis of the peak that was assigned to a dimer of IgG (fraction 5 in Figure 20). The main peak has a symmetrical gaussian shape which indicates a homogeneous sample.
Figure 22 SE-HPL chromatograms of collected cross-linked SE-FPLC pools. A-D. SE HPLC Analysis of the SE-FPLC Pools A-D in Figure 21. E. SE-HPLC Analysis of the fraction 4 in Figure 20. SE-HPLC was conducted on two sequentially coupled TSKgel G3000SW HPLC (TosoH Biosep.), 7.5 x 600 mm, columns in a 0.2 M sodium-phosphate pH, 7.0 as running buffer.
4.4 SDS-PAGE characterization of cross-linked IgG aggregates IgG Octagam aggregates formed using DST were characterized using SDS-PAGE. The gels were run under reducing and non-reducing conditions, respectively.
Figure 23, panel A shows the electrophoretic analysis of the cross-linked aggregates run under non-reducing conditions. This analysis method confirmed the results from the SEC analysis on size determination of the pools. Macromolecular species in pool E (Figure 22) and the IgG monomer (fraction 5 in Figure 20) appeared to be sufficiently homogeneous. Pool D contained a specie of the size ~350 kDa and also one of about 240 kDa. The SDS-PAGE band of pool B was extensively smeared either due to sample heterogeneity or to the properties of the gel. The protein band of in pool A was rather narrow and did not travel much into the gel.
35 (44)

Another important observation made in this gel is that in the cross-linked samples there were no protein bands of the size smaller than ~150 kDa. The result confirms the expectations that the fractionated aggregates of IgG are kept together with strong covalent bonds.
Some covalent bonds in the aggregates could be broken upon incubation with disulfide reducing reagent. Results are presented in Panel B, Figure 23, which shows the SDS-PAGE run under reducing conditions. From the comparison of the non-reducing (Panel A) and reducing (Panel B) gels follows that the cross-linked aggregates were separated into smaller chains upon reduction of disulfide bonds in the IgG molecules. The sharp intense band at ~60 kDa observed in all wells on the reducing gel, was assigned to the heavy chain of the IgG molecules.
Besides this specie several other, weaker bands of larger protein molecules (> 140 kDa) can be seen in all of the cross-linked samples (Lanes: Pool A, pool B, pool D and pool E in Figure 23, panel B). This indicates that the cross-linking has occurred at both the heavy and the light chains of IgG and that these bonds are resistant to reduction by DTT.
Figure 23 SDS-PAGE analysis of IgG aggregates cross-linked by DST. A. Non-reducing SDS-PAGE. From these results it is obvious that the fractionated protein species are more or less heterogeneous. B. Reducing SDS-PAGE indicates presence of covalent bonds after reduction by DTT. The gels used were 3-8% Tris-acetate (see Material and Methods). Protein samples loaded to a total amount of 16 µg each.
4.5 RP-HPLC characterization of cross-linked IgG aggregates The aggregate pools labeled A, B, D and E were also characterized using a RP-HPLC method (for details see Material and Methods).
Figure 24 shows the obtained reversed-phase chromatograms of different aggregate species overlaid in one figure. Values of elution volumes for the analyzed complexes measured in these chromatograms are presented in Table 6 along with data from SEC and DLS analysis.
36 (44)

Figure 24 RP-HPL Chromatograms of IgG aggregates cross-linked by DST. red trace – monomer IgG, pool 5 in Figure 20, load 30 µg. violet trace – Pool E, Figure 22, load 20 µg. light blue trace – Pool D, Figure 22, load 15 µg. dark blue – Pool B, Figure 22, load 12 µg. green trace – Pool A, Figure 22, load 10 µg. The brown trace represents the gradient of acetonitrile. Zorbax 300SB-C3 (Agilent, 4.6 x 50 mm) column was used and fluorescence detection (see Material and Methods). From these results it can be seen that the smallest protein specie analyzed (monomeric IgG Octagam) is eluted early in the gradient of increasing hydrophobicity. The bigger the specie is, the later it is eluted, i.e. at a higher percentage of acetonitrile. The results suggest that large associates of macromolecules of the same type are more hydrophobic than the smaller ones. Table 6 Summary of characterization of cross-linked aggregates. SEC analysis was conducted on tandem column consisting of two TSKgel G3000SW, 7.5 x 600 mm (TosoH Biosep.) columns. Rh estimated from calibration curve (see Material and Methods). Results from DLS analysis (see Material and Methods) showing estimations of protein Rh, molecular mass Mw and polydispersity (%Pd). Elution volumes from RPC analysis (Ve) are also listed.
Pool SEC Rh (nm) DLS Rh (nm) DLS %Pd DLS Est. Mw (kDa) RPC Ve (ml)A * 17.1 10.6 2566 16.6B 9.6 13.2 8.3 1407 16.4C 7.0 10.3 17.4 787 **D 6.7 9.3 13.1 623 15.6E 5.8 8.6 13.7 517 15.2
monomer 4.5 5.5 11.0 184 14.6 Notes: *) Samples eluting in column void volume making it impossible to estimate size. **) No sample analyzed using RPC.
37 (44)

4.6 DLS analysis of cross-linked IgG aggregates Figure 25 and Table 6 summarize results of DLS analysis of the pools A-E of cross-linked IgG Octagam aggregates and IgG monomers. Panel A, Figure 25 shows the light scattering size distribution histogram obtained from analysis of the pool with the biggest aggregates which elutes in the void volume of any SE column used. This pool appeared to be relatively homogeneous, which is indicated by the low polydispersity level, %Pd =10.6% (see Table 6). The result correlates with data obtained in non-reducing SDS-PAGE.
Figure 25, Panel B represents a similar DLS size distribution histogram of aggregate pool B. The hydrodynamic radius (Rh) is estimated to be 13.2 nm and the sample is homogeneous, %Pd = 8.3% (see Table 6).
Pool C (Panel C, Figure 25) appears to be more heterogeneous than the pools discussed above with a %Pd level of 17.4% (see Table 6). Pools D and E also show %Pd values (13.1 and 13.7%, respectively) lower than 15%, usually assigned to divide homogenous and heterogeneous species in DLS (Wyatt Corp., 2005). Panel E represents DLS data of the pool E, which was earlier assigned to IgG dimers cross-linked by DST. The value of Rh = 8.6 nm and the one of polydispersity %Pd = 13.7% suggest that the sample is composed mostly of dimers with the expected Rh = 6.9 nm (Rh dimer=1.26*Rh monomer) with a small admixture of larger species.
Figure 25 DLS analysis of cross-linked IgG Octagam aggregates. Light scattering size distribution histograms are presented. Panels A-E correspond to pools A-E in Fig. 22. Panel F represents the monomer. Values of the effective hydrodynamic radius Rh are also shown.
38 (44)

39 (44)
5 DISCUSSION SEC or gel filtration is a well established method for the analysis of the size of proteins (Laurent & Killander, 1964 and references therein). The separation principle is the difference in geometrical size of the macromolecules. SEC, therefore, provides information about the effective hydrodynamic (Stokes) radius of proteins. One of the advantages of SEC is that chromatography can be performed at conditions close to the native ones, i.e. in physiological buffers, and at normal temperature and pressure. Coupled to HPLC systems SEC is a rapid and convenient method for determination of macromolecular composition in protein solutions. However, the method is not free from artifacts, such as interference of unspecific interactions of the protein with the column matrix or self-association of the protein molecules during chromatography. This is why the first part of the present study was devoted to the selection of the optimal SEC column and screening of buffers needed for the analysis of IgG.
SEC analyses revealed that the original IgG Octagam preparation contained about 10% of polymerized species, mostly dimers. The ionic strength of the running buffer did not seem to affect this composition. It was also observed that the amount of IgG polymers was slightly higher at pH 6.0 – 7.0 as compared to pH 8.0 – 9.0 (Figure 6) suggesting that IgG molecules tend to form relatively stable complexes at lower pH values.
It was expected that higher amount of stable complexes will be formed upon a long term incubation of IgG. The expectations proved to be true. Results obtained from SEC analysis of samples pre-incubated at acidic pH for several days showed an increase of polymerized and aggregated material. The extent of polymerization was also growing with an increase of salt concentration in the incubation buffers. The observed salt effect suggests that the molecular mechanism of formation of stable complexes upon incubation is based on hydrophobic interactions.
The results discussed above points onto an altered molecule conformation of IgG in the acidic environment. A thermodynamic instability of IgG in solutions with pH under pH 4.5 has earlier been reported (Welfle et al., 1999 and Ahrer et al., 2006). The interest towards acidic conditions is, however, justified by the conventional purification procedure of antibodies: elution at pH around pH 3.5 from protein A affinity columns (Wang et al., 2006). It is conceivable that in acidic solutions molecules of IgG with altered conformation form relatively stable complexes with each other.
Due to the principle of SEC, based on separation of associated and monomeric species in space, protein-protein complexes that are bound by weak forces tend to dissociate and may not be detected. Such weak associations should manifest themselves in self-interaction chromatography. Results from SIC studies of IgG revealed a rather complex character of reaction. In acidic solutions, for example at pH 4.0, self-interaction between IgG molecules increased upon addition of sodium chloride, suggesting that hydrophobic forces were involved as proposed above in SEC experiments.

40 (44)
A completely different SIC behavior was observed at neutral or slightly alkaline pH. Here the interactions between IgG molecules decreased with an increase of the ionic strength, suggesting that electrostatic forces are involved.
The change in the SIC behavior of IgG on going from neutral to acidic conditions can also be explained by the change of protein structure at low pH suggested in SEC studies. The hydrophobic nature of the interactions below pH 4.0 indicates an exposure of hydrophobic amino acids in the protein due to a destabilized structure of IgG at this acidic condition.
It should be noted that the commercial preparation of human plasma IgG is heterogeneous (Ahrer et al., 2006). However, it is not likely that the heterogeneity may be responsible for the differences in self-association behavior at acidic and neutral conditions, because the protein elution volume in SIC represents an average of all protein interactions (Patro and Przybycien, 1996).
Similar to SIC data, the cross-linking of IgG with Glutaraldehyde increased with pH. Covalently linked protein polymers were formed in larger amount around neutral pH compared to more acidic conditions. This observation together with the knowledge that cross-linking efficiency of Glutaraldehyde is less dependent on pH than on protein properties (Jansen et al., 1971), suggests that protein-protein interactions of IgG Octagam are increased on going from acid to neutral pH.
The isoelectric point (pI) of human plasma IgG has been reported to be in the range of 4.35 to 9.95, with a prevailing peak around pH 8 (Prin et al., 1995). It may therefore be proposed that the increase in protein interactions with pH observed in SIC and the cross-linking experiments is related to the pI of the proteins. It is likely that the forces involved in these interactions are hindered when the net charge of the IgG molecules are high and therefore, the interactions are increased as the net charge is decreased. These weak interactions do not lead to formation of stable complexes of IgG detectable by SEC.
Data from characterization of protein complexes linked with another chemical cross-linker, disuccinimidyl tartrate, showed that the amino acids involved in the interactions are present at both the heavy and the light chains of human IgG. The big diversity of different complex species also implicates that the interaction sites are spread throughout the polypeptide chains. At the same time, the fact that SDS-PAGE patterns of the DST cross-linked species change upon reduction of disulfide bridges (Figure 23) indicates that under the experimental conditions DST was preferentially acting on the surfaces of macromolecules and was not able to access all of the intramolecular contacts between the heavy and light chains of IgG.
Results from RPC analysis (Figure 24) showed that the retention time increased with size of the protein complex suggesting an increase in total amount of hydrophobic area on the protein surface upon increase of the size of the protein. Such behavior is characteristic to water soluble globular proteins (Scopes, 1982) because of a high percentage of hydrophobic patches on the protein surface.

41 (44)
6 CONCLUSION In this project a set of chromatographic techniques were employed for the purpose of studying self-association and amount of aggregates in solutions of an antibody. Human plasma IgG Octagam was used as an example. Optimal parameters for SE-HPLC analyses of monomeric and aggregated IgG using several different columns were determined.
Relatively weak interactions between IgG molecules were detected by means of self-interaction chromatography and chemical cross-linking. These interactions were stronger at neutral and slightly alkaline pH and a long-term incubation did not result in formation of stable complexes detectable by SEC.
Both SIC and SEC data indicated conformational transitions of IgG molecules under acidic conditions. Long-term incubation of the acidic altered protein resulted in formation of relatively stable polymeric forms of IgG detected with SEC.
Several covalently cross-linked polymeric species of IgG Octagam was here prepared and purified. These species were characterized by analytical SE-HPLC, RPC and SDS-PAGE in order to further investigate the nature of IgG aggregates.
7 ACKNOWLEDGEMENTS I am very greatful to my supervisor Sergei Kuprin for excellent supervision and help throughout the entire project. My appreciations also go to Michael Wouda, Mariann Brunkener and Sofia Zwedberg for valuable help and assistance with different equipments. Further more, I would like to thank the section Glycans & Proteins and the rest of Analytical Sciences for making me feel very welcome at Biovitrum.

42 (44)
8 REFERENCES Ackers, G.K. (1967) A New Calibration Procedure for Gel Filtration columns. J. Biol. Chem.,
242, 3237-3238.
Ahrer, K., Buchacher, A., Iberer, G., Josic, D. and Jungbauer, A. (2003) Analysis of aggregates of human immunoglobulin G using size-exclusion chromatography, static and dynamic light scattering. J. Chromatogr. A., 1009, 89-96.
Ahrer, K., Buchacher, A., Iberer, G. and Jungbauer, A. (2006) Thermodynamic stability and formation of aggregates of human immunoglobulin G characterized by differential scanning calorimetry and dynamic light scattering. J. Biochem. Biophys. Methods, 66, 73-86.
Calamai, M., Taddei, N., Stefani, M., Ramponi, G. and Chiti, F. (2003) Relative influence of hydrophobicity and net charge in the aggregation of two homologous proteins. Biochemistry, 42, 15078 -15083.
Corbett, R.J.T. and Roche, R.S. (1984) Use of High-Speed Size-Exclusion Chromatography for the study of protein folding and stability. Biochemistry, 23, 1888-1894.
Cromwell, M.E., Hilario, E. and Jacobson, F. (2006) Protein Aggregation and Bioprocessing AAPS J., 8, E572-E579.
Fink, A.L. (1998) Protein aggregation: folding aggregates, inclusion bodies and amyloid. Fold Des., 3, R9-R23.
Füzesi, M., Gottschalk, K-E., Lindzen, M., Shainskaya, A., Küster, B., Garty, H and Karlish, S.J.D. (2005) Covalent Cross-links between the γ Subunit (FXYD2) and α and β Subunits of Na,K-ATPase. J. Biol. Chem., 280, 18291-18301.
Goldsby, R.A., Kindt, T.J., Osborne, B.A., Kuby, J. Immunology. 5th ed. New York: W.H Freeman; 2002. p. 76-90.
Habeeb, A.F.S.A. and Hiramoto, R. (1968) Reaction of Proteins with Glutaraldehyde. Arch. Biochem. Biophys., 126, 16-26.
Horiike, K., Tojo, H., Yamano, T. and Nozaki, M. (1983) Interpretation of the Stokes Radius of Macromolecules Determined by Gel Filtration Chromatography. J. Biochem., 93, 99-106.
Jansen, E.F., Tomimatsu, Y. and Olson, A.C. (1971) Cross-linking of α-Chymotrypsin and Other Proteins by Reaction with Glutaraldehyde. Arch. Biochem. Biophys., 144, 394-400.
Laurent, T.C. and Killander, J. (1964) A theory of gel filtration and its experimental verification. J. Chrom. A, 14, 303.
Migneault, I., Dartiguenave, C., Bertrand, M.J. and Waldron, K.C. (2004) Glutaraldehyde: behavior in aqueous solution, reaction with proteins, and application to enzyme Cross-linking. BioTechniques, 37, 790-802.
43 (44)
Park, L.S., Friend, D., Gillis, S. and Urdal, D.L. (1986) Characterization of the Cell Surface Receptor for a multi-lineage Colony-stimulating Factor (CSFn2a). J. Biol. Chem., 261, 205-210.
Patro, S.Y. and Przybycien, T.M. (1994) Simulations of kinetically irreversible protein aggregate structure. Biophys J., 66, 1274-1289.
Patro, S.Y. and Przybycien, T.M. (1996) Self-Interaction Chromatography: A Tool for the Study of Protein-Protein Interactions in Bioprocessing Environments. Biotechnol. Bioeng., 52, 193-203.
Payne, J.W. (1973) Polymerization of Proteins with Glutaraldehyde. Biochem. J., 135, 867-873.
Prin, C., Bene, M.C., Bobert, B., Montagne, P. and Faure, G.C (1995) Isoelectric restriction of human immunoglobulin isotypes. Biochim. Biophys. Acta, 1243, 287-290.
Remmele, R.L Jr., Callahan, W.J., Krishnan, S., Zhou, L., Bondarenko, P.V., Nichols, A.C., Kleemann, G.R., Pipes, G.D., Park, S., Fodor, S., Kras, E. and Brems, D.N (2006) Active Dimer of Epratuzumab Provides Insight into the Complex Nature of an Antibody Aggregate. J. Pharm. Sci., 95, 126-145.
Rogers, K., Rodwell, V.W. and Geiger, P. (1997) Estimation of the Stokes Radii of Serum Proteins. Biochim. Biophys. Acta, 427, 231-237.
Rosenberg, A.S. (2006) Effects of protein Aggregates: An Immunologic Perspective. AAPS J., 8, E501-E507.
Scopes, R.K. Protein purification - Principles and practice. New York: Springer-Verlag; 1982.
Siegel, L.M. and Monty, K.J. (1966) Determination of molecular weights and frictional ratios of proteins in impure systems by use of gel filtration and density gradient centrifugation. Application to crude preparations of sulfite and hydroxylamine reductases. Biochim. Biophys. Acta, 112, 346-362.
Smith, R.J., Capaldi, R.A., Muchmore, D. and Dahlquist, F. (1978) Cross-linking of Ubiquinone Cytochrome c Reductase (Complex 111) with Periodate-Cleavable Bifunctional Reagents. Biochemistry, 17, 3719-3737.
Tessier, P.M., Lenhoff, A.M. and Sandler, S.I. (2002) Rapid Measurement of Protein Osmotic Second Virial Coefficients by Self-Interaction Chromatography. Biophys. J., 82, 1620-1631.
Tessier, P.M. and Lenhoff, A.M. (2003) Measurements of protein self-association as a guide to crystallization. Curr. Opin. Biotechnol., 14, 512-516.
Vermeer, A.W.P. and Norde, W. (2000) The thermal stability of Immunoglobulin: Unfolding and Aggregation of a Multi-domain protein. Biophys. J., 78, 394-404.
Wang, L., Hale, G. and Ghosh, R. (2006) Non-size-based membrane chromatographic separation and analysis of monoclonal antibody aggregates. Anal. Chem., 78, 6863-6867.
Wang, W. (2005) Protein aggregation and its inhibition in biopharmaceutics. Int. J. Pharm., 289, 1-30.

44 (44)
Wang, W., Singh, S., Zeng, D.L., King, K. and Nema, S. (2007) Antibody structure, instability and formulation. J. Pharm. Sci., 96, 1-26.
Welfle, K., Misselwitz, R., Hausdorf, G., Höhne, W. and Welfle, H. (1999) Conformation, pH-induced conformational changes, and thermal unfolding of anti-p24 (HIV-1) monoclonal antibody CB4-1 and its Fab and Fc fragments. Biochim. Biophys. Acta, 1431, 120-131.
Welling, G.W., Slopsema, K. and Welling-Wester, S. (1986) Size-exclusion high-performance liquid chromatography of Sendai virus membrane proteins in different detergents a comparison of different columns. J. Chrom. A, 359, 307-314.
Wright, A. and Morrison, S.L. (1997) Effect of glycolsylation on antibody function: Implications for genetic engineering. Trends Biotechnol., 15, 26-32.
Wyatt, P.J. (1993) Light scattering and the absolute characterization of macromolecules. Anal. Chim. Acta, 272, 1-40.
Wyatt Technology Corp. (2005) DYNAMIC User’s Guide version 6.7. M1400 Rev. B.