ChIP-Seq & MDB-Seq Service - e-biogen.com
19
ChIP-Seq & MDB-Seq Service
Transcript of ChIP-Seq & MDB-Seq Service - e-biogen.com

ChIP-Seq & MDB-Seq Service

BioResearch Service

MBD-Seq ChIP-SeqExome
DNA-SeqDNA
total RNA
RNA-SeqRNA mRNA-SeqQuantSeq3’mRNA-Seq
miRNA-SeqBacteria
mRNA-Seq
▪DNA MethylationProfiling
▪Epigenome 분석▪~ 2㎍ gDNA
▪DNA-ProteinInteractions
▪Histone modifications▪~20㎕ IP-DNA
▪Whole Exome Sequencing
▪SNP, CNV, Mutation▪~ 2㎍ gDNA
▪mRNA-Seq분석외lncRNa분석
▪Whole Transcriptome▪~ 2㎍ total RNA
▪Gene Expression,Isoform, GO/Pathway
▪ Splicing, Gene Fusion▪~ 2㎍ total RNA
▪ mRNA ExpressionProfiling
▪ Low Quantity & Quality RNA 샘플실험가능
▪ ~ 2㎍ total RNA
▪microRNAExpression Profiling
▪ Target Gene 분석외▪~ 2㎍ total RNA
▪Gene Expression Profiling
▪GO/Pathway/Network▪~ 2㎍ total RNA
NGS Service

ChIP-Seq Sample Preparation

Genomic DNA (>1ug)Fragmented DNA
CG
CH3
CG
CH3
CG
CH3
Methylated DNA
MBD
QC and Library Construction
MBD-Seq Sample Preparation

DNA Sample Prep / Shearing
Genomic DNA의 전기영동
1 2 3 4 M
1, 2 : 실험에 좋은 샘플의 예
3, 4 : 사용할 수 없는 샘플의 예
Genomic DNA의 Shearing
다양한 조건에서 shearing을 진행하여 알맞은 size의 DNA 단편획득 (300~500nt)

Methylated DNA qRT-PCR
Quantitative Analysis
Comparative Analysis (ΔΔCT)
Sample Quality Control (QC)
Known methylated region/known unmethylated region 에 대한 qRT-PCR
CG
CH3
CG
CH3
CG
CH3

Library Generation
Eletropherogram of DNA library

Sequencing
Illumina HiSeq-2500

Summary and Visualization
Peaks finding
Genome Mapping
DataPreprocessing
DAVID, KEGG, MeV
macs
Bowtie
FastQC
Quality Control Reports
Mapping
DNA abundance
GO/Pathway analysis
Data Mining
Other Data Analysis Tools for Data Processing, Mining, Visualization : MISO, Quick GO, ClueGO, CytoScape,
GSEA, UCSC Genome, IGV, IPA, Others
Work Flow of Data Analysis

Data Analysis – Data preprocessingFastQ 파일 안에서 각 position의 base에 대한 quality 값의 영역을 보여 줌

Adapted from slide set by: Stuart M. Brown, Ph.D., Center for Health Informatics & Bioinformatics, NYU School of Medicine & from Jothi, et al. Genome-wide identification of in vivo protein–DNA binding sites from ChIP-Seq data. NAR (2008), 36: 5221-31
How to find peak
•Fragments contain the TF binding site
at a (mostly) random position within
them.
•Reads are (randomly) from left or right
edges (sense or antisense) of fragments.
•Thus peak for sense tags will be 1/2 the
fragment length upstream…
•Binding site position = mid-way
between sense tag peak & antisense tag
peak.
•To get binding site peak, shift sense
downstream by ½ fragsize & antisense
upstream by ½ fragsize.

Peak annotation/ Motif discovery

Peak Image
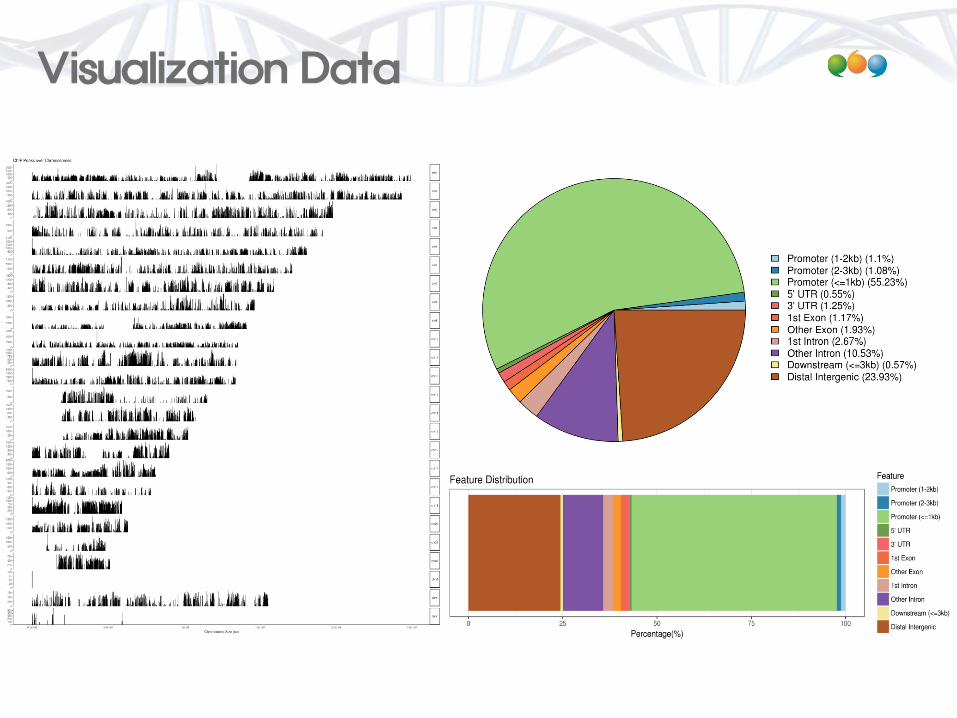
Visualization Data

Visualization Data

Transcription Factor Binding Site

Searching…
DATA
ANALYSIS
TOOLS