Chinese economic growth and the demand for metals
29
1 Chinese economic growth and the demand for metals China and the world economy Roberto Castello Branco EPGE, March 2011
-
Upload
eaton-watts -
Category
Documents
-
view
33 -
download
0
description
Chinese economic growth and the demand for metals. China and the world economy Roberto Castello Branco EPGE, March 2011. Agenda. Growth skepticism Chinese role in the global metals markets Are commodity exporters doomed to poverty?. Growth skepticism. - PowerPoint PPT Presentation
Transcript of Chinese economic growth and the demand for metals

1
Chinese economic growth and the demand for metals
China and the world economyRoberto Castello Branco
EPGE, March 2011
China and the world economyRoberto Castello Branco
EPGE, March 2011
2
Growth skepticism
Chinese role in the global metals markets
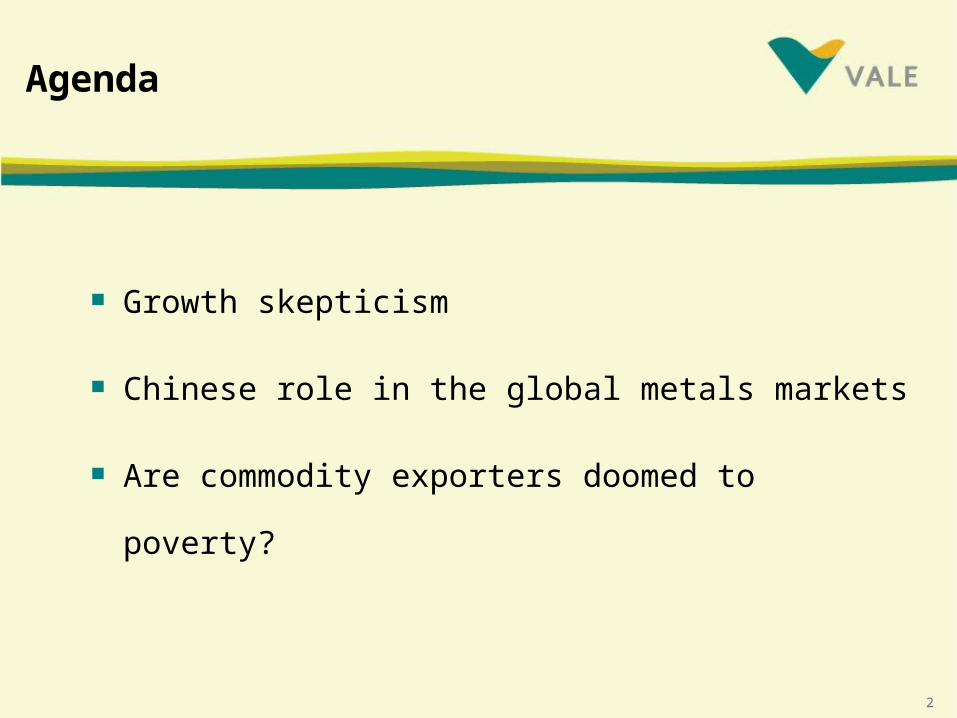
Are commodity exporters doomed to poverty?
Agenda

3
Growth skepticism

4
50
100
150
200
250
300
350
400
450
500
550
1820 1830 1840 1850 1860 1870 1880 1890 1900 1910 1920 1930 1940 1950
index
The Asian growth path showed a sharp contrast with the experience of developed nations
Real per capita GDP growth – developed economies
Source: Angus Maddison, “Countours of the world economy, 1-2030 AD”, Oxford University Press, 2007
5
0
100
200
300
400
500
600
700
800
900
1,000
1,100
t t + 5 t + 10 t + 15 t + 20 t + 25 t + 30
years after the start of growth acceleration
index
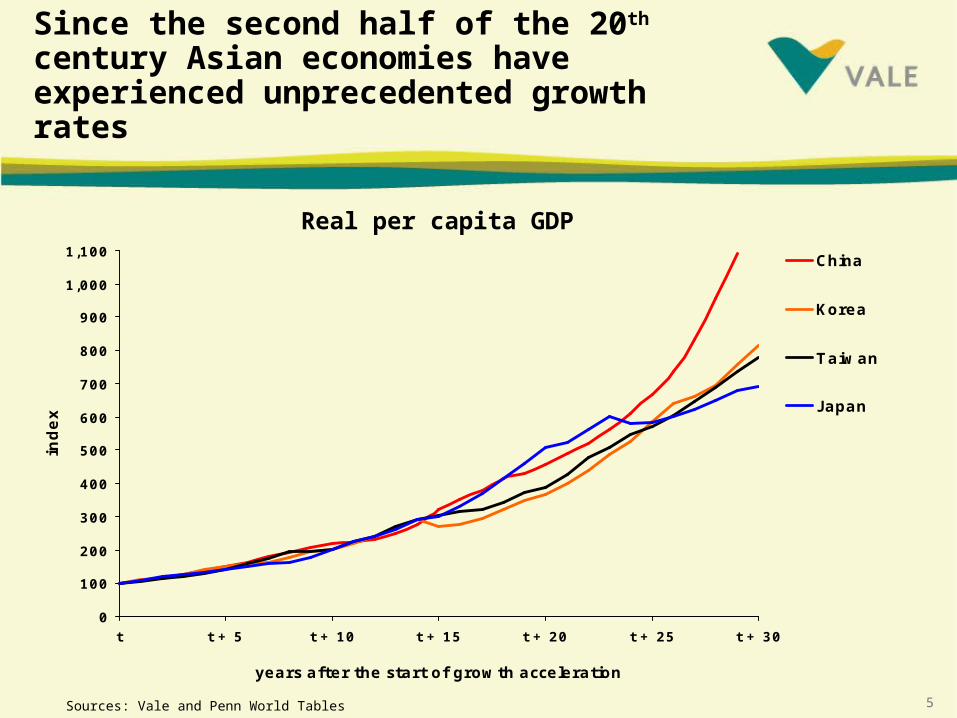
China
Korea
Taiwan
J apan
Real per capita GDP
Sources: Vale and Penn World Tables
Since the second half of the 20th century Asian economies have experienced unprecedented growth rates

6
Expansion multiples of GDP
China¹ 12.5
Korea² 8.2
Taiwan² 7.8
Japan³ 6.9
Hong Kong² 6.7
Singapore² 6.6
Developed economies4 5.3
1 1978-20072 1965-19943 1950-19794 1820-1950Sources: Vale and Penn World Tables

7
Gross enrollment rates in China
¹ 2005Sources: US NCES and UNESCO
Primary Secondary Tertiary school school school
1980 113 46 2
2006 111 76 19¹

8
Sources of China’s growth
Source: “Accounting for growth: comparing China and India”, B. Bosworth and S. Collins, NBER working paper 12943, February 2007.
Output Contribution of total
factor productivity
1978-2004 9.3 3.8
1978-1993 8.9 3.6
1993-2004 9.7 4.0
%

9
Chinese role in the global metals markets
10
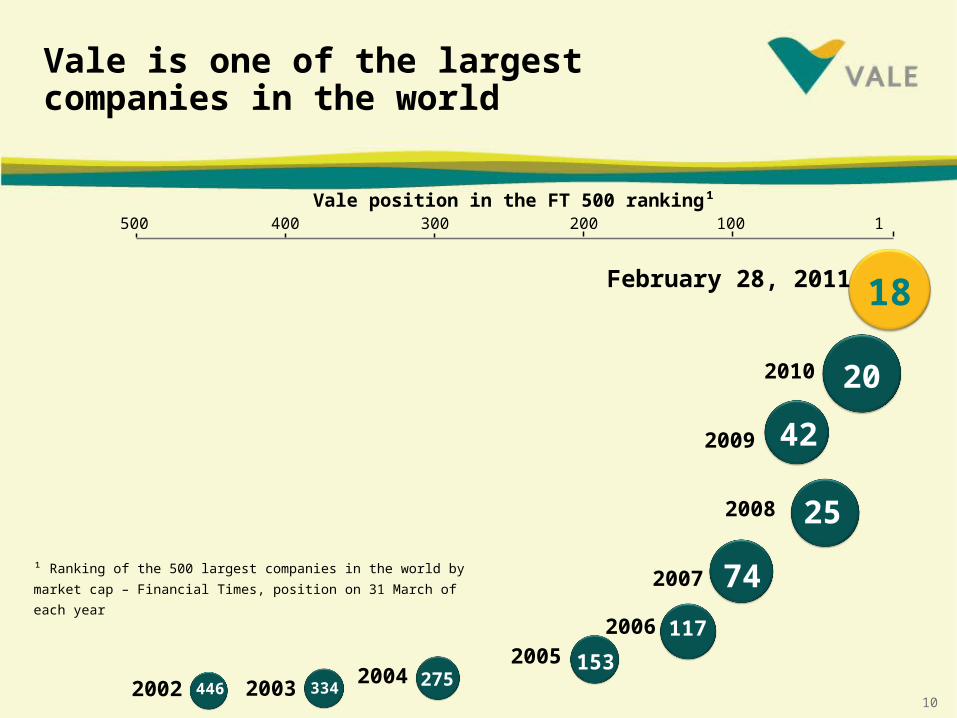
Vale is one of the largest companies in the world
2002 20032004
20052006
2007
February 28, 2011
Vale position in the FT 500 ranking¹
¹ Ranking of the 500 largest companies in the world by market cap –
Financial Times, position on 31 March of each year
500 400 300 200 100 1
18
74
117
153275334446
25
42
2008
2009
202010

11
Vale in 2011
A global company, with offices and operations on all continents…

12
Coal
Iron ore & pellets
Nickel, cobalt &
PGMs
Copper
Potash & phosphates
Manganese &
ferroalloys
Logistics
Brazil54%
North America
25%
Asia10%
Australasia10%
Other1%
... and a global base of world-class assets
Asset baseby geography
Asset portfolio

13
A large exposure to Asia: major operations and offices in the Asia Pacific

14
Supporting Asian growth
Revenues
Asia26.6%
China7.7%
2002
US$ 4.3 billion
China33.1%
Asia53.3%
2010
US$ 46.5 billion

15
We are the only company in the Americas listed on a major Asian stock exchange
New York2000
Paris2008
São Paulo 1943
Hong Kong2010
¹ with the listing in Hong Kong.

16
0
10
20
30
40
50
60
70
1903
1910
1917
1924
1931
1938
1945
1952
1959
1966
1973
1980
1987
1994
2001
2008
US China
China’s steel consumption intensity has been much higher than the US peak level not only due to accelerated growth but also due to structural characteristics
Steel consumption intensityton / US$ 1,000 of real GDP
Source: World Steel Association, IMF, USGS and Vale

17
0
100
200
300
400
500
600
700
800
900
1995
1997
1999
2001
2003
2005
2007
2009
China
Developed economies
Copper consumption intensitykilos / US$ 1,000 of real GDP
Source: World Steel Association, WBMS, IMF and Vale
0
10
20
30
40
50
60
70
19
95
19
96
19
97
19
98
19
99
20
00
20
01
20
02
20
03
20
04
20
05
20
06
20
07
20
08
20
09
China
Developed economies
Nickel consumption intensitykilos / US$ 1,000 of real GDP
China’s consumption intensity of base metals has surpassed developed economies

18
0
10
20
30
40
50
60
70
19
95
19
96
19
97
19
98
19
99
20
00
20
01
20
02
20
03
20
04
20
05
20
06
20
07
20
08
20
09
20
10
Iron Ore
Steel
Nickel
Copper
Share of China in global consumption of metals%
Source: World Steel Association, WBMS, IMF and Vale
As a consequence, China has become the number one consumer of industrial metals in the world

19
0
500
1,000
1,500
2,000
2,500
3,000
3,500
4,000
4,500
5,000
1970
1972
1974
1976
1978
1980
1982
1984
1986
1988
1990
1992
1994
1996
1998
2000
2002
2004
2006
2008
2010
LMEX index¹
¹ LME base metals prices index, includes: copper, aluminum, nickel, zinc, tin and leadSources: Vale and Reuters Ecowin
Strong Chinese demand expansion has been the main factor underlying the sharp rise in base metals prices
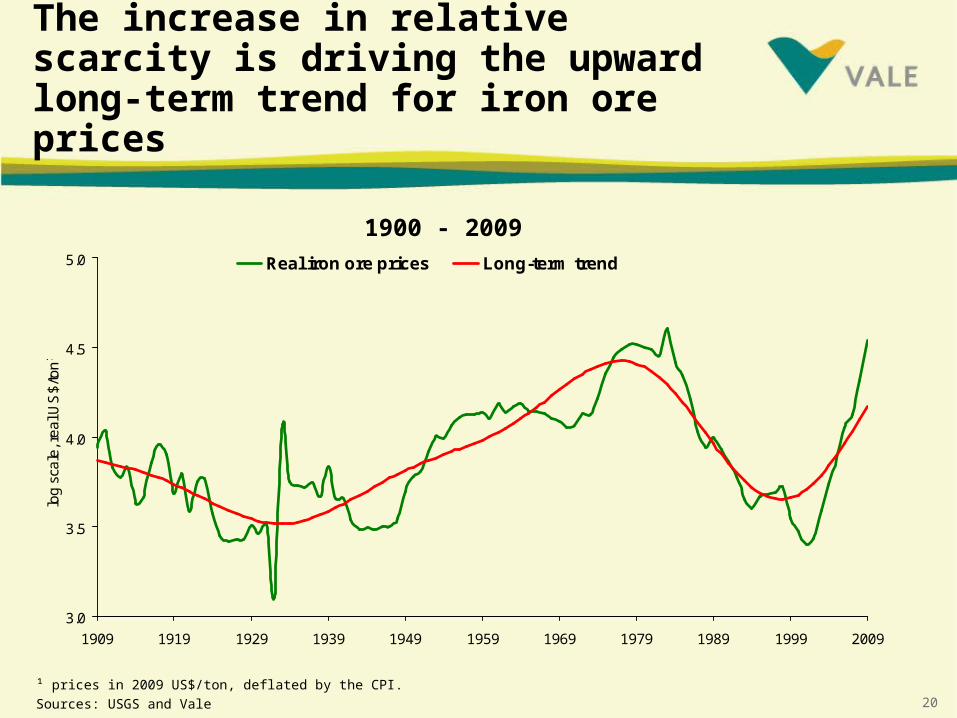
20¹ prices in 2009 US$/ton, deflated by the CPI.Sources: USGS and Vale
3.0
3.5
4.0
4.5
5.0
1909 1919 1929 1939 1949 1959 1969 1979 1989 1999 2009
log
sca
le, r
ea
l US
$/to
n¹
Real iron ore prices Long-term trend
The increase in relative scarcity is driving the upward long-term trend for iron ore prices
1900 - 2009

21
Chinese dependency on imported iron ore
Source: World Steel and Vale
0
0.1
0.2
0.3
0.4
0.5
0.6
0.7
1985 1990 1995 2000 2005 2010
0.62
Despite Chinese efforts to boost iron ore output, it is increasingly dependent on imports
0%
10%
20%
30%
40%
50%
60%
70%
1990 1995 2000 2005 2010
Japan Germany China
Share in global iron ore seaborne trade

22
Japanese trading companies acquired stakes in mining
assets across the globe.
Japanese official financial institutions provided funding for
project development.
Apparently, the Chinese are willing to replicate the
Japanese experience to guarantee a steady supply of raw
materials.
In the past, in a less liquid world, Japan played the dual role of being the demand driver and financier of mining

23
In the past there was no financial globalization.
Different models: private sector versus state-owned
companies.
The Japanese investment was not sufficient to
change the long-term trend.
Lessons from the Japanese experience
24
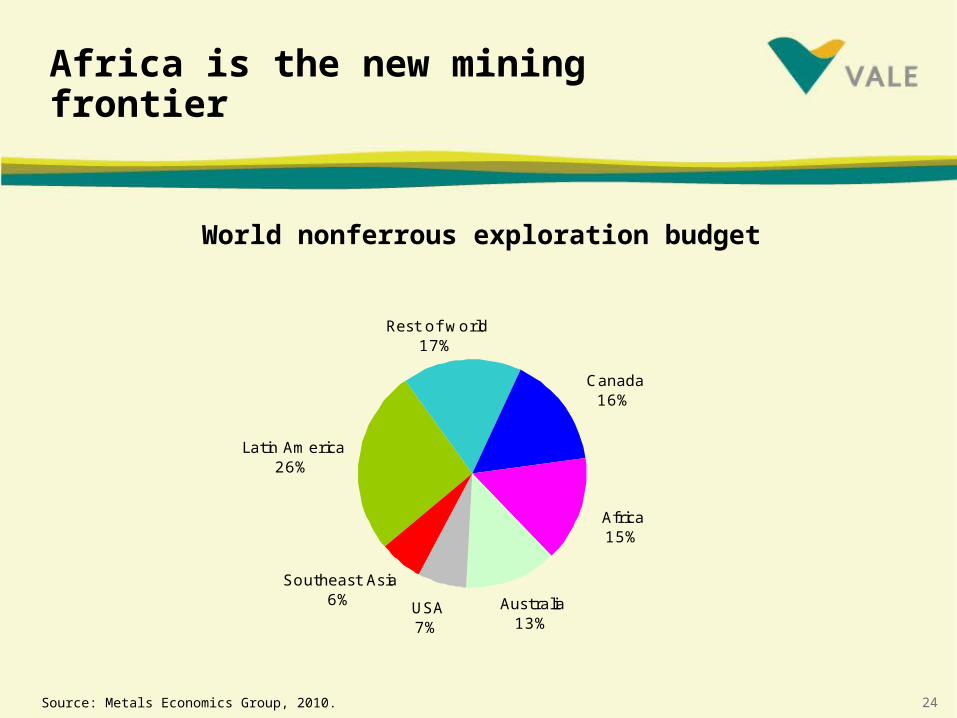
Africa is the new mining frontier
Source: Metals Economics Group, 2010.
World nonferrous exploration budget
Southeast Asia6%
Rest of world17%
Latin America26%
USA7%
Canada16%
Africa15%
Australia13%

25
Are commodity exporters doomed to poverty?

26
The strong global demand growth for commodities caused significant gains in terms of trade for Brazil
Source: Funcex
80
90
100
110
120
130
140
150
160
170
180
1990
1993
1996
1999
2002
2005
2008
2011
index,
1990 =
100

27
Commodity exporters can be rich
¹ 2009
Sources: IMF, Haver Analytics, PennWorld tables, MIDC-SECEX, StatCan, Statistics Norway.
Commodities and economic development
US Australia CanadaNew
ZealandNorway Chile Brazil
(A) Commodity exports¹ - US$ billion 308.2 128.2 175.9 17.6 93.1 34.1 83.0
(B) Total exports ¹ - US$ billion 1,068.5 195.5 324.2 24.8 120.1 53.8 153.0
(C) GDP¹ - US$ billion 14,119.1 994.3 1,336.1 117.8 378.6 161.7 1,574.0
(A) / (B) - % 28.8 65.6 54.3 71.0 77.5 63.4 54.2
(A) / (C) - % 2.2 12.9 13.2 15.0 24.6 21.1 5.3
Real per capita GDP relative to the US, 2007 - %
100.0 87.1 85.7 60.2 118.4 47.3 22.1

28
Investment in human capital and infrastructure.
Quality of institutions.
Policies stimulative of private sector investment.
Flexible exchange rate regime.
Countercyclical fiscal policies.
Natural resources and economic growth