
Chinese Consumer Demand for Animal Products and...
14
Journal of Agricultural and Applied Economics, 30, l(July 1998): 127–140 0 1998 Southern Agricultural Economics Association Chinese Consumer Demand for Animal Products and Implications for U.S. Pork and Poultry Exports Qingbin Wang, Frank Fuller, Dermot Hayes, and Catherine Halbrendt ABSTRACT This paper examines Chinese consumer preference for major animal products and assesses the potential impacts of a reduction in China’s import tariff on its pork and poultry demand and net import. Our analysis suggests that China’s demand for animal products will con- tinue to grow as income increases. Using a trade model, results of our scenario analysis indicate that a reduction in China’s import tariffs will significantly increase its net pork and poultry imports and the U.S. will capture most of the increases. Nevertheless, the impact on the market price in China and the U.S. is likely to be very small. Key Words: Almost Ideal Demand System, China, consumer demand, demand elasticity, food demand, partial equilibrium model, two-stage budgeting, U.S. meat export. China’s rapid economic growth and gradual transition toward a market economy have brought about significant changes in its food consumption patterns and trade behavior. With increased income and improved market acces- sibility, Chinese consumers, especially those in urban areas, are shifting their food con- sumption from grains to meats and other high- value food products (Wang, Jensen, and John- son). Between 1984 and 1996, China’s per capita grain consumption declined from 142 kg to 94 kg in urban areas, and from 267 kg to 256 kg in rural areas, whereas the per capita Wang is an assistant professor and Halbrendt is a pro- fessor, both in the Department of Community Devel- opment and Applied Economics, the University of Ver- mont. Hayes is a professor and Fuller is a research associate, both in the Center for Agriculture and Rural Development (CARD), Iowa State University. This is Journal Paper No. J-17823 of the Iowa Ag- ricultural and Home Economics Experiment Station, Ames, Iowa, Project No. 3487. consumption of meats, eggs, milk, vegetable oils, and fruits increased significantly in both urban and rural areas (State Statistical Bureau of China). As a result of the ongoing transition in food consumption patterns, extremely lim- ited per capita arable land, and significant re- ductions in import restrictions, China’s food imports have increased dramatically in recent years. For example, China’s com trade re- versed from a net export of 11.1 million metric tons (MMT) in 1993 to a net import of 5.2 MMT in 1995, while total grain imports in- creased from 7.3 MMT to 20.4 MMT over the same period. China has also substantially ex- panded its imports of high-value food products such as edible oils—which jumped from 1.1 MMT in 1993 to 3.7 MMT in 1995 [U.S. De- partment of Agriculture (USDA) 1996]. Changes in China’s food situation and trade behavior have important implications for U.S. agricultural exports. China has been a large buyer of U.S. wheat since the late 1970s, and
Transcript of Chinese Consumer Demand for Animal Products and...
Journal of Agricultural and Applied Economics, 30, l(July 1998): 127–1400 1998 Southern Agricultural Economics Association
Chinese Consumer Demand for AnimalProducts and Implications for U.S.Pork and Poultry Exports
Qingbin Wang, Frank Fuller, Dermot Hayes, andCatherine Halbrendt
ABSTRACT
This paper examines Chinese consumer preference for major animal products and assessesthe potential impacts of a reduction in China’s import tariff on its pork and poultry demandand net import. Our analysis suggests that China’s demand for animal products will con-tinue to grow as income increases. Using a trade model, results of our scenario analysisindicate that a reduction in China’s import tariffs will significantly increase its net porkand poultry imports and the U.S. will capture most of the increases. Nevertheless, theimpact on the market price in China and the U.S. is likely to be very small.
Key Words: Almost Ideal Demand System, China, consumer demand, demand elasticity,food demand, partial equilibrium model, two-stage budgeting, U.S. meat export.
China’s rapid economic growth and gradualtransition toward a market economy havebrought about significant changes in its foodconsumption patterns and trade behavior. Withincreased income and improved market acces-sibility, Chinese consumers, especially thosein urban areas, are shifting their food con-sumption from grains to meats and other high-value food products (Wang, Jensen, and John-son). Between 1984 and 1996, China’s percapita grain consumption declined from 142kg to 94 kg in urban areas, and from 267 kgto 256 kg in rural areas, whereas the per capita
Wang is an assistant professor and Halbrendt is a pro-fessor, both in the Department of Community Devel-opment and Applied Economics, the University of Ver-mont. Hayes is a professor and Fuller is a researchassociate, both in the Center for Agriculture and RuralDevelopment (CARD), Iowa State University.
This is Journal Paper No. J-17823 of the Iowa Ag-ricultural and Home Economics Experiment Station,Ames, Iowa, Project No. 3487.
consumption of meats, eggs, milk, vegetableoils, and fruits increased significantly in bothurban and rural areas (State Statistical Bureauof China). As a result of the ongoing transitionin food consumption patterns, extremely lim-ited per capita arable land, and significant re-ductions in import restrictions, China’s foodimports have increased dramatically in recentyears. For example, China’s com trade re-versed from a net export of 11.1 million metrictons (MMT) in 1993 to a net import of 5.2MMT in 1995, while total grain imports in-creased from 7.3 MMT to 20.4 MMT over thesame period. China has also substantially ex-panded its imports of high-value food productssuch as edible oils—which jumped from 1.1MMT in 1993 to 3.7 MMT in 1995 [U.S. De-partment of Agriculture (USDA) 1996].
Changes in China’s food situation and tradebehavior have important implications for U.S.agricultural exports. China has been a largebuyer of U.S. wheat since the late 1970s, and
128 Journal of Agricultural and Applied Economics, July 1998
3,0007
2,500 4
J-=T-+——0
1986 1987 1988 1989 1990 1991 1992 1993 1994 1995
Figure 1. U.S. agricultural trade with China,
,4 /’
1,200
1,000
+ 8002
J 600
? 400
200
Year
986–95
/1 I !?!! Edible Oils& Oilseeds
o “ I I I I I I I I I I
1986 1987 1988 1989 1990 1991 1992 1993 1994 1995Year
Figure 2. U.S. agricultural exports to China,
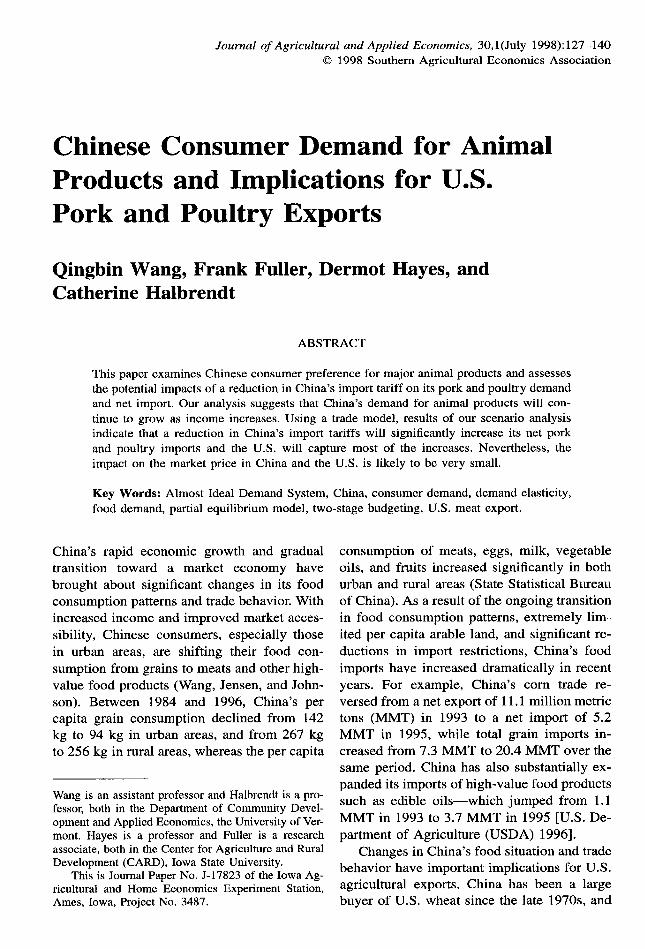
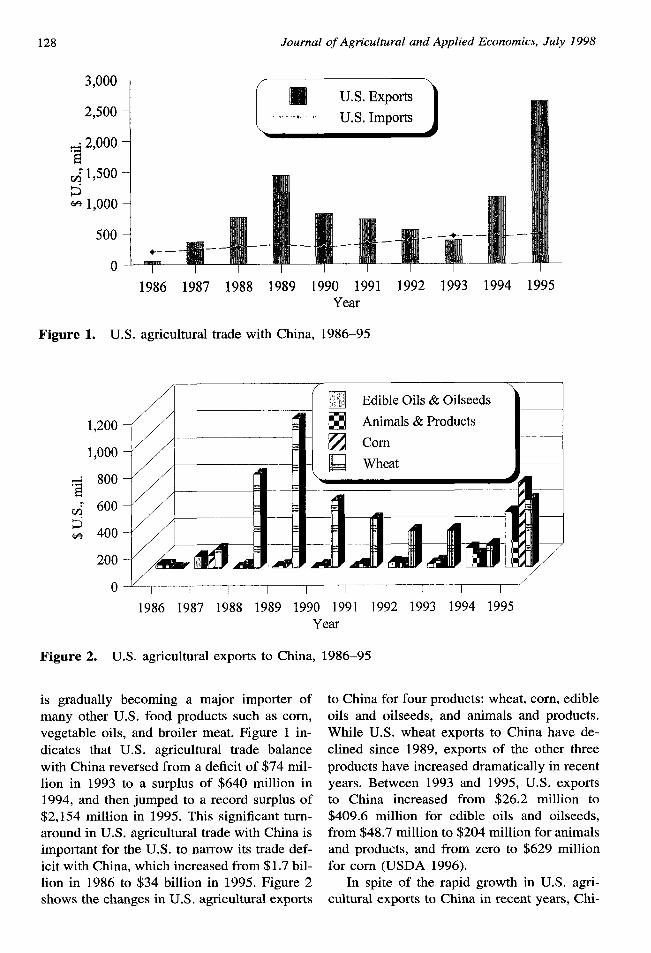
is gradually becoming a major importer ofmany other U.S. food products such as corn,vegetable oils, and broiler meat. Figure 1 in-dicates that U.S. agricultural trade balancewith China reversed from a deficit of $74 mil-lion in 1993 to a surplus of $640 million in1994, and then jumped to a record surplus of$2,154 million in 1995. This significant turn-around in U.S. agricultural trade with China isimportant for the U.S. to narrow its trade def-icit with China, which increased from $1.7 bil-lion in 1986 to $34 billion in 1995. Figure 2shows the changes in U.S. agricultural exports
1986–95
to China for four products: wheat, corn, edibleoils and oilseeds, and animals and products.While U.S. wheat exports to China have de-clined since 1989, exports of the other threeproducts have increased dramatically in recentyears. Between 1993 and 1995, U.S. exportsto China increased from $26.2 million to
$409.6 million for edible oils and oilseeds,from $48.7 million to $204 million for animalsand products, and from zero to $629 millionfor corn (USDA 1996).
In spite of the rapid growth in U.S. agri-cultural exports to China in recent years, Chi-
Wang et al.: China’s Food Demand and U.S. Pork and Poultry Exports 129
na is still viewed as a tough market by manyU.S. food marketers because of its many nu-ances and subtleties that are not well under-stood by U.S. producers and marketers. Insti-tutional barriers such as import quotas andtariffs are partly to blame, but it cannot bedenied that a simple lack of information andstudy of the underlying mechanisms of theChinese market also contribute to the difficul-ty faced by U.S. traders. China’s trade libera-tion has been limited in many respects, butthere is evidence that China’s food demandand trade behavior are increasingly determinedby consumers.
The major objective of this study is to ex-amine Chinese consumer preference for majoranimal products and to assess the potential im-pacts of a reduction in China’s import tariff onits pork and poultry demand and net import.The following sections review the trends inChina’s meat markets, present the results of anempirical demand analysis and a scenarioanalysis of the impact of a liberalization ofChinese pork and poultry markets, and sum-marize major conclusions.
Trends in China’s Meat Market andImplications for U.S. Exports
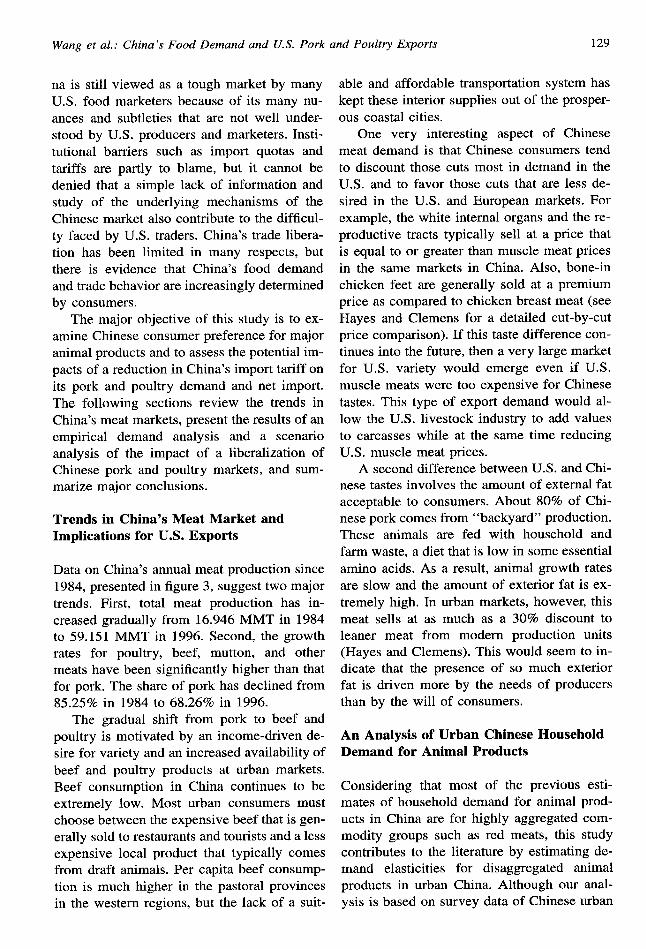
Data on China’s annual meat production since1984, presented in figure 3, suggest two majortrends. First, total meat production has in-creased gradually from 16.946 MMT in 1984to 59.151 MMT in 1996. Second, the growthrates for poultry, beef, mutton, and othermeats have been significantly higher than thatfor pork. The share of pork has declined from85.25% in 1984 to 68.26% in 1996.
The gradual shift from pork to beef andpoultry is motivated by an income-driven de-sire for variety and an increased availability ofbeef and poultry products at urban markets.Beef consumption in China continues to beextremely low. Most urban consumers mustchoose between the expensive beef that is gen-erally sold to restaurants and tourists and a lessexpensive local product that typically comesfrom draft animals. Per capita beef consump-tion is much higher in the pastoral provincesin the western regions, but the lack of a suit-
able and affordable transportation system haskept these interior supplies out of the prosper-ous coastal cities.
One very interesting aspect of Chinesemeat demand is that Chinese consumers tendto discount those cuts most in demand in theU.S. and to favor those cuts that are less de-sired in the U.S. and European markets. Forexample, the white internal organs and the re-productive tracts typically sell at a price thatis equal to or greater than muscle meat pricesin the same markets in China. Also, bone-inchicken feet are generally sold at a premiumprice as compared to chicken breast meat (seeHayes and Clemens for a detailed cut-by-cutprice comparison). If this taste difference con-tinues into the future, then a very large marketfor U.S. variety would emerge even if U.S.muscle meats were too expensive for Chinesetastes. This type of export demand would al-low the U.S. livestock industry to add valuesto carcasses while at the same time reducingU.S. muscle meat prices.
A second difference between U.S. and Chi-nese tastes involves the amount of external fatacceptable to consumers. About 80% of Chi-nese pork comes from “backyard” production.These animals are fed with household andfarm waste, a diet that is low in some essentialamino acids. As a result, animal growth ratesare slow and the amount of exterior fat is ex-tremely high. In urban markets, however, thismeat sells at as much as a 30% discount toleaner meat from modem production units(Hayes and Clemens). This would seem to in-dicate that the presence of so much exteriorfat is driven more by the needs of producersthan by the will of consumers.
An Analysis of Urban Chinese HouseholdDemand for Animal Products
Considering that most of the previous esti-mates of household demand for animal prod-ucts in China are for highly aggregated com-modity groups such as red meats, this studycontributes to the literature by estimating de-mand elasticities for disaggregated animalproducts in urban China. Although our anal-ysis is based on survey data of Chinese urban
130 Journal of Agricultural and Applied Economics, July 1998
60 -/
Other Meat
o /’ I I I I I I I I I I I (19841985198619871988198919901991 19921993199419951996
Year
Figure 3. China’s production of major animal products, 1984–96
households, the study is expected to shedsome light on the general trends of consumerdemand for animal products in China as ruralresidents follow the urban income growth pat-terns.
Two commonly used demand systems, thealmost ideal demand system (AIDS) (Deatonand Muellbauer) and the translog demand sys-tem (Christensen, Jorgenson, and Lau), areused to estimate the demand elasticities for sixanimal products: pork, beef and mutton(B&M), poultry, eggs, fish, and milk in urbanChina. A test procedure for nonnested hypoth-eses proposed by Vuong is used to comparethe two demand systems. Compared with thetraditional nonnested test procedure throughan artificial nesting model, this test procedurenot only avoids the estimation of an artificialmodel, but also guarantees a unique conclu-sion regarding the relative explanatory powerof the two demand models.
This study uses the most recently availabledata from China’s National Urban HouseholdSurvey. The survey has been administered bythe State Statistical Bureau of China (SSB)and implemented at the provincial level sincethe early 1980s. Sample households were se-lected by using a three-stage stratified sam-pling scheme: (a) cities were first selected
from each province, (b) enterprises and insti-tutions were then selected from each selectedcity, and finally, (c) households were selectedfrom each selected enterprise and institution.The participating households were requestedto keep detailed records of their daily incomeand expenditures by using the account booksprovided by the SSB. The account books werecollected, examined, aggregated, and reportedby local statistical agencies every month.
The data used to estimate the proposed de-mand models are the pooled data of samplemeans by seven income groups and two citygroups (small versus medium and large) from1986–92. Because the data for 1986 are avail-able for only medium and large cities, our dataset includes 91 observations (seven observa-tions for 1986, and 14 observations for eachyear from 1987 through 1992). Similar datasets by income groups or provinces, but withgreater product aggregation and shorter peri-ods, have been used in several previous stud-ies (e.g., Lewis and Andrews; Wang andChern). The nominal expenditures are con-verted into real ones by using the Urban Liv-
ing Cost Index published by the SSB. As not-ed, six animal products are included in thedemand models: pork, beef and mutton(B&M), poultry, eggs, fish, and milk. Beef and
Wang et al.: China’s Food Demand and U.S. Pork and Poultry Exports 131
mutton always have been aggregated into onemeat group in China’s statistical system. Likemany other empirical demand studies usinghousehold survey data (e.g., Cheng andCapps; Gao, Wailes, and Cramer), unit valuesderived from expenditures and quantities areused as prices in the estimation. City size andhousehold size are incorporated into the de-mand models as two demographic variables.
The maximum-likelihood estimates of theAIDS and translog demand system with ho-mogeneity and symmetry restrictions imposedare derived using the iterated seemingly un-related regression technique. Test results of thetwo demand systems based on the nonnestedtest procedure suggest that these two demandmodels are not significantly different in ex-planatory power for the Chinese data at the1% significance level.
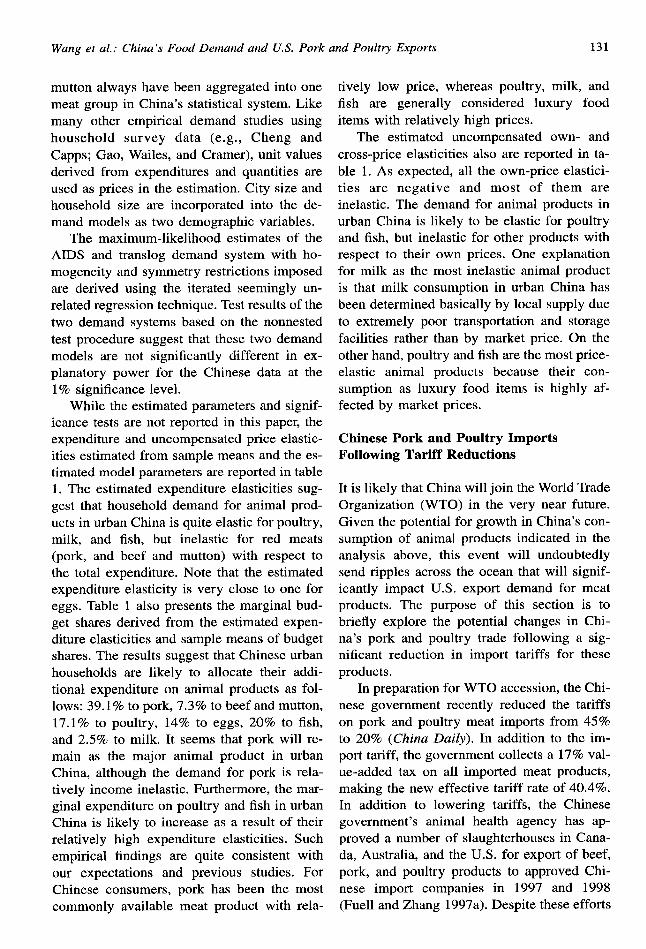
While the estimated parameters and signif-icance tests are not reported in this paper, theexpenditure and uncompensated price elastic-ities estimated from sample means and the es-timated model parameters are reported in table1. The estimated expenditure elasticities sug-gest that household demand for animal prod-ucts in urban China is quite elastic for poultry,milk, and fish, but inelastic for red meats(pork, and beef and mutton) with respect tothe total expenditure. Note that the estimatedexpenditure elasticity is very close to one foreggs. Table 1 also presents the marginal bud-get shares derived from the estimated expen-diture elasticities and sample means of budgetshares. The results suggest that Chinese urbanhouseholds are likely to allocate their addi-tional expenditure on animal products as fol-lows: 39.1 Yoto pork, 7.3% to beef and mutton,17. 1% to poultry, 14?ii to eggs, 20% to fish,and 2.5% to milk. It seems that pork will re-main as the major animal product in urbanChina, although the demand for pork is rela-tively income inelastic. Furthermore, the mar-ginal expenditure on poultry and fish in urbanChina is likely to increase as a result of theirrelatively high expenditure elasticities. Suchempirical findings are quite consistent withour expectations and previous studies. ForChinese consumers, pork has been the mostcommonly available meat product with rela-
tively low price, whereas poultry, milk, andfish are generally considered luxury fooditems with relatively high prices.
The estimated uncompensated own- andcross-price elasticities also are reported in ta-ble 1. As expected, all the own-price elastici-ties are negative and most of them areinelastic. The demand for animal products inurban China is likely to be elastic for poultryand fish, but inelastic for other products withrespect to their own prices. One explanationfor milk as the most inelastic animal productis that milk consumption in urban China hasbeen determined basically by local supply dueto extremely poor transportation and storagefacilities rather than by market price. On theother hand, poultry and fish are the most price-elastic animal products because their con-sumption as luxury food items is highly af-fected by market prices.
Chinese Pork and Poultry ImportsFollowing Tariff Reductions
It is likely that China will join the World TradeOrganization (WTO) in the very near future.Given the potential for growth in China’s con-sumption of animal products indicated in theanalysis above, this event will undoubtedlysend ripples across the ocean that will signif-icantly impact U.S. export demand for meatproducts. The purpose of this section is tobriefly explore the potential changes in Chi-na’s pork and poultry trade following a sig-nificant reduction in import tariffs for theseproducts.
In preparation for WTO accession, the Chi-nese government recently reduced the tariffson pork and poultry meat imports from 45 Voto 2090 (China Daily). In addition to the im-port tariff, the government collects a 1790 val-ue-added tax on all imported meat products,making the new effective tariff rate of 40.4Y0.In addition to lowering tariffs, the Chinesegovernment’s animal health agency has ap-proved a number of slaughterhouses in Cana-da, Australia, and the U.S. for export of beef,pork, and poultry products to approved Chi-nese import companies in 1997 and 1998(Fuell and Zhang 1997a). Despite these efforts
132 Journal of Agricultural and Applied Economics, July 1998
Table 1. Estimated Demand Elasticities for Chinese Urban Households
Expen-diture Marginal Marshallian Price Elasticity of Good i
Animal Elas- Budget with Respect to Good j
Products ticities (%) Pork B&M Poultry Eggs Fish Milk
Pork 0.8327 39.14 –0.8503 –0.1305 0.0876 0.0844 –0.0130 –0.0227B&M 0.8492 7.26 –0.7002 –0.6745 0.0907 0.2301 0.1736 0.0717Poultry 1.4895 17.11 0.0549 0.0092 –1.3362 –0.5057 0.2939 –0.0068Eggs 0.9858 14.00 0.2380 0.1281 –0.3448 –0.7766 –0.1902 0.0132Fish 1.1909 19.99 –0.2067 0.0544 0.2337 – 0.2000 – 1.0253 –0.0629Milk 1.2689 2.50 –0.8070 0.2608 –0.0303 0.0281 –0.5703 –0.2884
to diminish the barriers to meat imports, offi-cial trade in meat products has not grown sig-nificantly in recent months. The industry per-ception in the U.S. is that, even at the reducedtariff rates, it is still too costly to import meatproducts through official channels. Unofficialtransshipments and smuggling of pork prod-ucts into China through Hong Kong is esti-mated to be as much as seven times greaterthan official imports (Fuell and Zhang 1997b).These “grey channels” are a viable, less ex-pensive alternative to direct imports. However,this trade is not reflected in reported trade sta-tistics. Lowering import tariffs to a level thatmakes direct import of meat products cheaperthan illegal alternatives could cause a notableincrease in official trade, not only due to lowerimport costs, but also as a result of trade shift-ing from “grey” to official import channels.
Using a partial equilibrium model of Chi-na’s livestock and grain sectors, we have ex-amined the impact of a 100% reduction in theofficial tariff rate on Chinese pork and poultryimports. The 17?Z0value-added tax is assumedto remain in place, making the effective tariffrate in the scenario 17%. The demand side ofthe simulation model is divided into urban andrural components for both livestock productsand grains. As in the demand analysis above,Chinese consumers are assumed to maximizea weakly separable utility function subject totheir income constraint. Consequently, con-sumption is modeled as a two-stage budgetingprocess in which consumers allocate their in-come to broad commodity groups in the firststage, and then divide group expenditures
among individual commodities in the secondstage. The model does not contain a completerepresentation of the first-stage decision pro-cess; rather, each commodity group’s share ofconsumer expenditures is determined by anEngle curve augmented by a price term. Thelivestock product group is the largest com-modity group, containing beef, pork, mutton,poultry, eggs, aquatic products, and milk. Thegrain group includes wheat, rice, soybeans,corn, and barley. The second-stage allocationsfor the two commodity groups are modeled byseparate almost ideaJ demand systems (AIDS)(Deaton and Muellbauer).
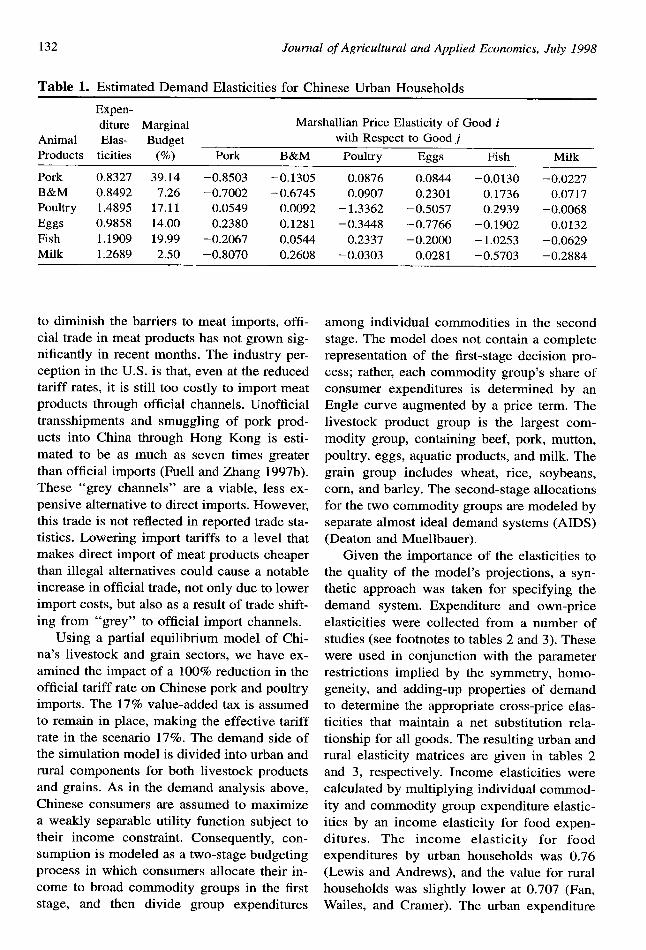
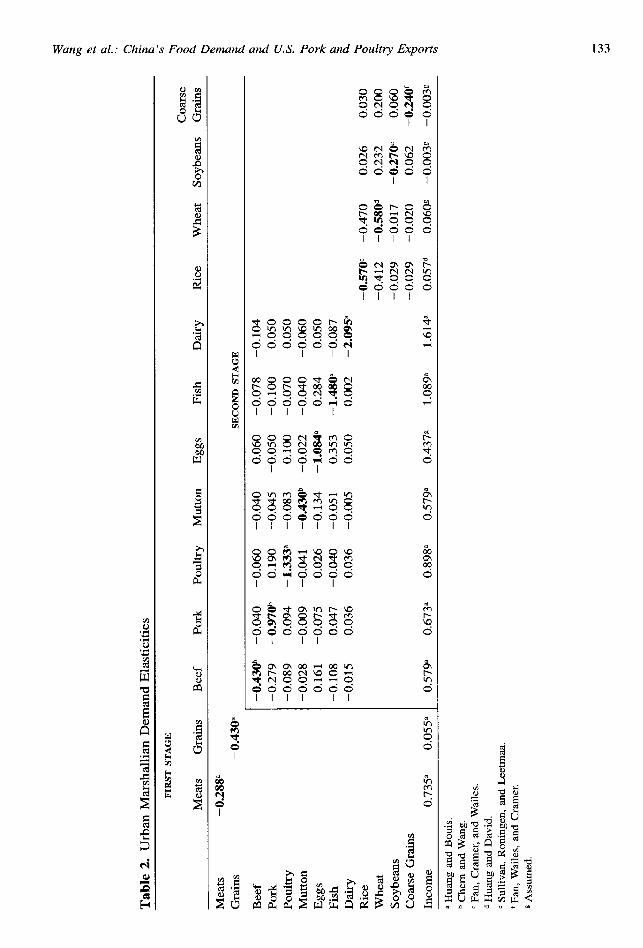
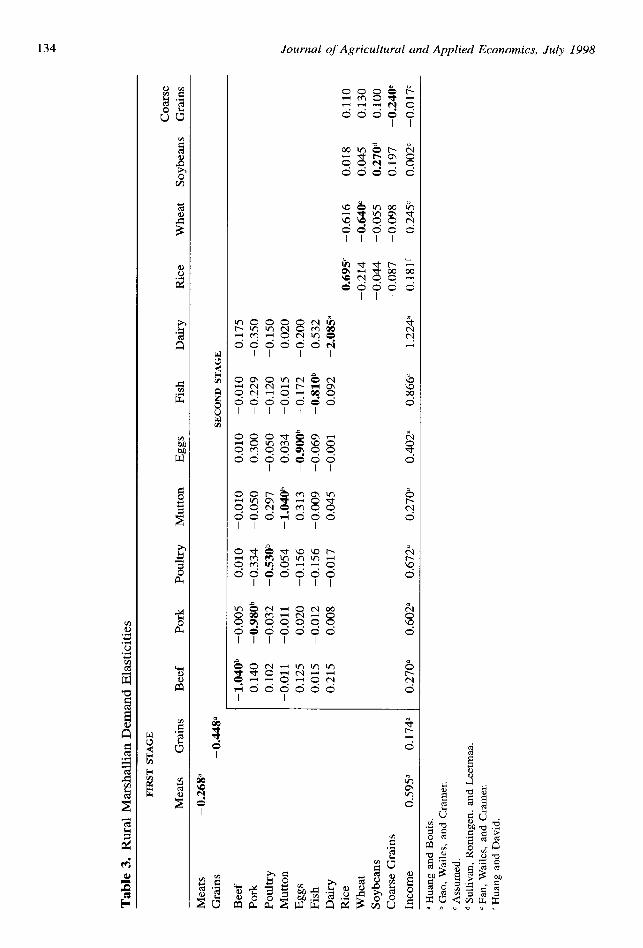
Given the importance of the elasticities tothe quality of the model’s projections, a syn-thetic approach was taken for specifying thedemand system. Expenditure and own-priceelasticities were collected from a number ofstudies (see footnotes to tables 2 and 3). Thesewere used in conjunction with the parameterrestrictions implied by the symmetry, homo-geneity, and adding-up properties of demandto determine the appropriate cross-price elas-ticities that maintain a net substitution rela-tionship for all goods. The resulting urban andrural elasticity matrices are given in tables 2and 3, respectively. Income elasticities werecalculated by multiplying individual commodi-ty and commodity group expenditure elastic-ities by an income elasticity for food expen-ditures, The income elasticity for foodexpenditures by urban households was 0.76(Lewis and Andrews), and the value for ruralhouseholds was slightly lower at 0.707 (Fan,Wailes, and Cramer). The urban expenditure
Wang et al.: China’s Food Demand and U.S. Pork and Poultry Exports 133
134 Journal of Agricultural and Applied Economics, July 1998
Wang et al.: China’s Food Demand and U.S. Pork and Poultry Exports 135
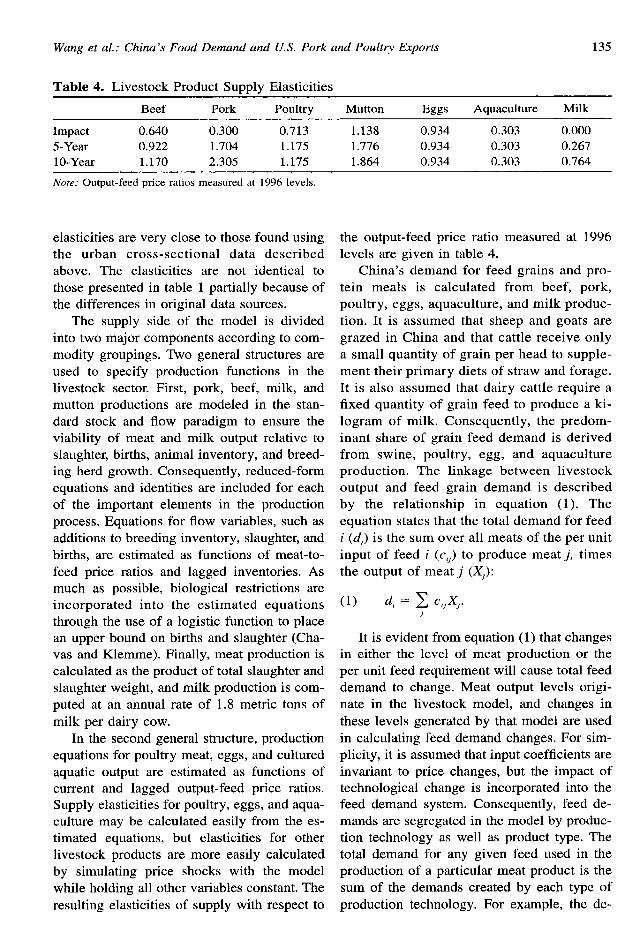
Table 4. Livestock Product Supply Elasticities
Beef Pork Poultry Mutton Eggs Aquiculture Milk
Impact 0.640 0.300 0.713 1.138 0.934 0.303 0.0005-Year 0,922 1.704 1.175 1.776 0.934 0.303 0.26710-Year 1.170 2.305 1.175 1.864 0.934 0.303 0.764
Note: Output-feed price ratios measured at 1996 levels.
elasticities are very close to those found usingthe urban cross-sectional data describedabove. The elasticities are not identical tothose presented in table 1 partially because ofthe differences in original data sources.
The supply side of the model is dividedinto two major components according to com-modity groupings. Two general structures areused to specify production functions in thelivestock sector. First, pork, beef, milk, andmutton productions are modeled in the stan-dard stock and flow paradigm to ensure theviability of meat and milk output relative toslaughter, births, animal inventory, and breed-ing herd growth. Consequently, reduced-formequations and identities are included for eachof the important elements in the productionprocess. Equations for flow variables, such asadditions to breeding inventory, slaughter, andbirths, are estimated as functions of meat-to-feed price ratios and lagged inventories. Asmuch as possible, biological restrictions areincorporated into the estimated equationsthrough the use of a logistic function to placean upper bound on births and slaughter (Cha-vas and Klemme). Finally, meat production iscalculated as the product of total slaughter andslaughter weight, and milk production is com-puted at an annual rate of 1.8 metric tons ofmilk per dairy cow.
In the second general structure, productionequations for poultry meat, eggs, and culturedaquatic output are estimated as functions ofcurrent and lagged output-feed price ratios.Supply elasticities for poultry, eggs, and aqui-culture may be calculated easily from the es-timated equations, but elasticities for otherlivestock products are more easily calculatedby simulating price shocks with the modelwhile holding all other variables constant. Theresulting elasticities of supply with respect to
the output-feed price ratio measured at 1996levels are given in table 4.
China’s demand for feed grains and pro-tein meals is calculated from beef, pork,poultry, eggs, aquiculture, and milk produc-tion. It is assumed that sheep and goats aregrazed in China and that cattle receive onlya small quantity of grain per head to supple-ment their primary diets of straw and forage.It is also assumed that dairy cattle require afixed quantity of grain feed to produce a ki-logram of milk. Consequently, the predom-inant share of grain feed demand is derivedfrom swine, poultry, egg, and aquicultureproduction. The linkage between livestockoutput and feed grain demand is describedby the relationship in equation (1). Theequation states that the total demand for feedi (d,) is the sum over all meats of the per unitinput of feed i (c,,) to produce meat j, timesthe output of meat j (Xj):
(1) d, = ~ C,JX1.
It is evident from equation (1) that changesin either the level of meat production or theper unit feed requirement will cause total feeddemand to change. Meat output levels origi-nate in the livestock model, and changes inthese levels generated by that model are usedin calculating feed demand changes. For sim-plicity, it is assumed that input coefficients areinvariant to price changes, but the impact oftechnological change is incorporated into thefeed demand system. Consequently, feed de-mands are segregated in the model by produc-tion technology as well as product type. Thetotal demand for any given feed used in theproduction of a particular meat product is thesum of the demands created by each type ofproduction technology. For example, the de-
136 Journal of Agricultural and Applied Economics, July 1998
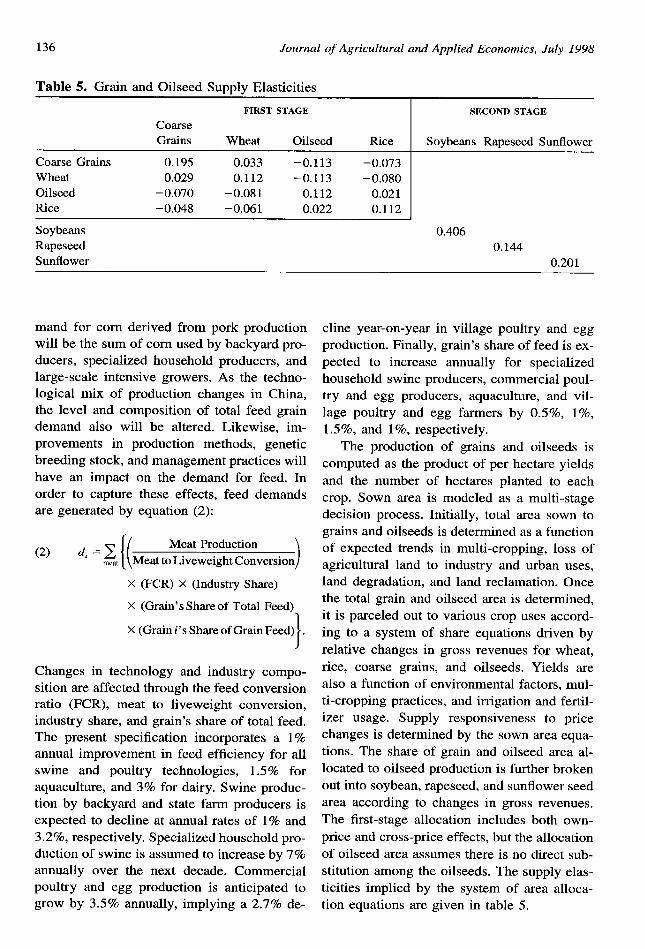
Table 5. Grain and Oilseed Supply Elasticities
FIRSTSTAGE SECOND STAGE
CoarseGrains Wheat Oilseed Rice Soybeans Rapeseed Sunflower
Coarse Grains 0.195 0.033 –0.113 –0.073Wheat 0.029 0.112 –0.113 –0.080Oilseed –0.070 –0.081 0.112 0.021Rice –0.048 –0.061 0.022 0.112
Soybeans 0.406Rapeseed 0.144Sunflower 0.201
mand for corn derived from pork productionwill be the sum of corn used by backyard pro-ducers, specialized household producers, andlarge-scale intensive growers. As the techno-logical mix of production changes in China,the level and composition of total feed graindemand also will be altered. Likewise, im-provements in production methods, geneticbreeding stock, and management practices willhave an impact on the demand for feed. Inorder to capture these effects, feed demandsare generated by equation (2):
(2) d,=~[(
Meat Production
~,.~ Meat to Liveweight Conversion )
X (FCR) X (Industry Share)
X (Grain’s Share of Total Feed)
1X (Grain i’s Share of Grain Feed) .
Changes in technology and industry compo-sition are affected through the feed conversionratio (FCR), meat to liveweight conversion,industry share, and grain’s share of total feed.The present specification incorporates a 1%annual improvement in feed efficiency for allswine and poultry technologies, 1.5% foraquiculture, and 3TOfor dairy. Swine produc-tion by backyard and state farm producers isexpected to decline at annual rates of 1% and3.2Y0, respectively. Specialized household pro-duction of swine is assumed to increase by 796annually over the next decade. Commercialpoultry and egg production is anticipated togrow by 3.5% annually, implying a 2.7% de-
cline year-on-year in village poultry and eggproduction. Finally, grain’s share of feed is ex-pected to increase annually for specializedhousehold swine producers, commercial poul-try and egg producers, aquiculture, and vil-lage poultry and egg farmers by 0.5Y0, 190,1.590, and 1%, respectively.
The production of grains and oilseeds is
computed as the product of per hectare yieldsand the number of hectares planted to eachcrop. Sown area is modeled as a multi-stagedecision process. Initially, total area sown tograins and oilseeds is determined as a functionof expected trends in multi-cropping, loss ofagricultural land to industry and urban uses,land degradation, and land reclamation. Oncethe total grain and oilseed area is determined,it is parceled out to various crop uses accord-ing to a system of share equations driven byrelative changes in gross revenues for wheat,rice, coarse grains, and oilseeds. Yields arealso a function of environmental factors, mul-ti-cropping practices, and irrigation and fertil-izer usage. Supply responsiveness to pricechanges is determined by the sown area equa-tions. The share of grain and oilseed area al-located to oilseed production is further brokenout into soybean, rapeseed, and sunflower seedarea according to changes in gross revenues.The first-stage allocation includes both own-
price and cross-price effects, but the allocationof oilseed area assumes there is no direct sub-stitution among the oilseeds. The supply elas-ticities implied by the system of area alloca-tion equations are given in table 5.
Wang et al.: China’s Food Demand and U.S.
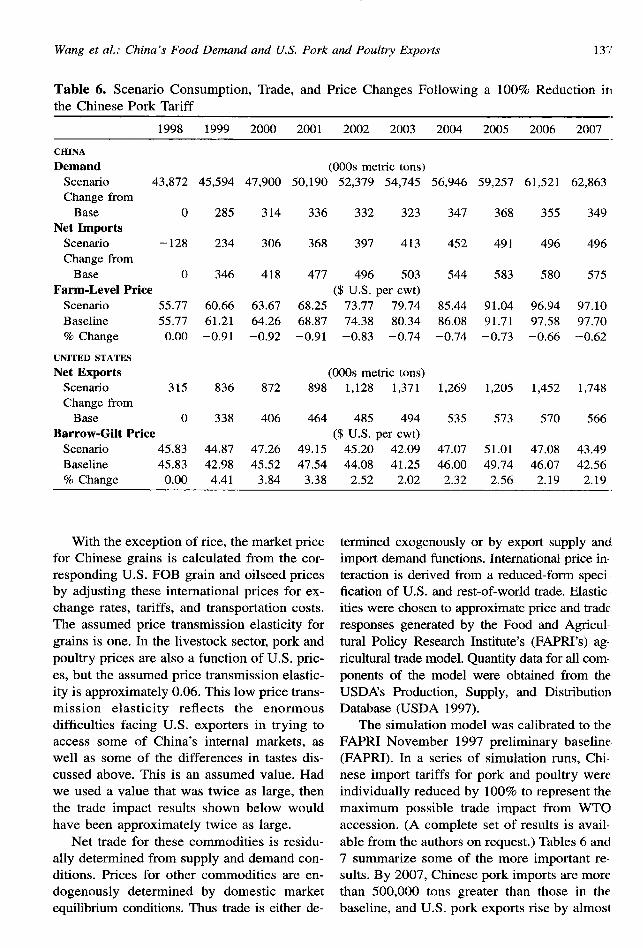
Table 6. Scenario Consumption, Trade,the Chinese Pork Tariff
Pork and Poultry Exports 13’/
and Price Changes Following a 100% Reduction ir~
1998 1999 2000 2001 2002 2003 2004 2005 2006 2007
CHINA
Demand (000s metric tons)Scenario 43,872 45,594 47,900 50,190 52,379 54,745 56,946 59,257 61,521 62,863
Change fromBase o
Net ImportsScenario –128Change from
Base oFarm-Level Price
Scenario 55.77
Baseline 55.77% Change 0.00
UNITED STATES
Net ExportsScenario 315Change from
Base oBarrow-Gilt Price
Scenario 45.83
Baseline 45.83‘%. Change 0.00
285
234
346
60.6661.21–0.91
836
338
44,87
42.98
4.41
314 336 332 323
306 368 397 413
418 477 496 503($ U.S. per cwt)
63.67 68.25 73.77 79.7464.26 68.87 74.38 80.34–0.92 –0.91 –0.83 –0.74
(000s metric tons)872 898 1,128 1,371
406 464 485 494
($ U.S. per cwt)47.26 49.15 45.20 42.0945.52 47.54 44,08 41.25
3.84 3.38 2.52 2.02
With the exception of rice, the market pricefor Chinese grains is calculated from the cor-responding U.S. FOB grain and oilseed pricesby adjusting these international prices for ex-change rates, tariffs, and transportation costs.The assumed price transmission elasticity forgrains is one. In the livestock sector, pork andpoultry prices are also a function of U.S. pric-es, but the assumed price transmission elastic-ity is approximately 0.06. This low price trans-mission elasticity reflects the enormousdifficulties facing U.S. exporters in trying toaccess some of China’s internal markets, aswell as some of the differences in tastes dis-cussed above. This is an assumed value. Hadwe used a value that was twice as large, thenthe trade impact results shown below wouldhave been approximately twice as large.
Net trade for these commodities is residu-ally determined from supply and demand con-ditions. Prices for other commodities are en-dogenously determined by domestic marketequilibrium conditions. Thus trade is either de-
347 368 355
452 491 496
544 583 580
85,44 91.04 96.9486.08 91.71 97,58-0.74 –0.73 –0.66
1,269 1,205 1,452
535 573 570
47.07 51.01 47,0846.00 49.74 46.07
2.32 2.56 2.19
349
496
575
97.1097.70–0.62
1,748
566
43.4942.56
2.19
termined exogenously or by export supply anclimport demand functions. International price interaction is derived from a reduced-form specification of U.S. and rest-of-world trade. Elasticities were chosen to approximate price and traderesponses generated by the Food and Agricultural Policy Research Institute’s (FAPRI’s) agricultural trade model, Quantity data for all corn.ponents of the model were obtained from theUSDA’s Production, Supply, and Distribution!,Database (USDA 1997).
The simulation model was calibrated to theFAPRI November 1997 preliminary baselinfi(FAPRI). In a series of simulation runs, Chi.nese import tariffs for pork and poultry wertindividually reduced by 100% to represent themaximum possible trade impact from WTClaccession. (A complete set of results is avail.able from the authors on request.) Tables 6 ancl7 summarize some of the more important re-sults. By 2007, Chinese pork imports are morethan 500,000 tons greater than those in thebaseline, and U.S. pork exports rise by almosl
138 Journal of Agricultural and Applied Economics, July 1998
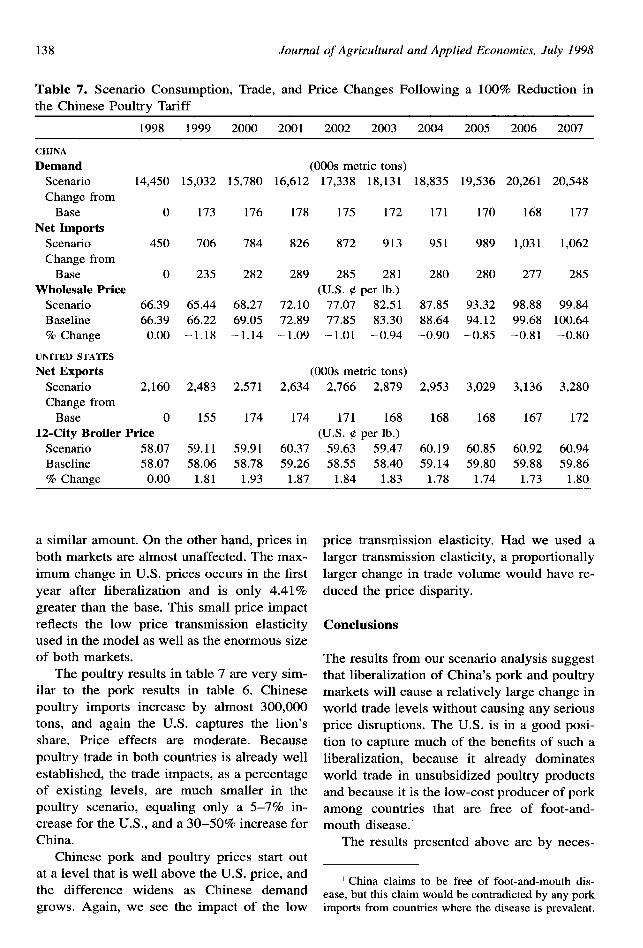
Table 7. Scenario Consumption, Trade, and Price Changes Following a 100’3i0Reduction inthe Chinese Poultry Tariff
1998 1999 2000 2001 2002 2003 2004 2005 2006 2007
CHINA
DemandScenario 14,450Change from
Base oNet Importx
Scenario 450Change from
Base oWholesale Price
Scenario 66.39Baseline 66.39% Change 0.00
UNITED STATES
Net ExportsScenario 2,160Change from
Base o12-City Broiler Price
Scenario 58.07Baseline 58.07% Change 0.00
(000s metric tons)16,612 17,338 18,131 18,83515.032 15,780 19.536 20,261 20,548
173 176 178 175 172 171 170 168 177
706 784 826 872 913 951 989 1,031 1,062
235 282 289 285 281 280(U.S. o per lb.)
72.10 77.07 82.51 87.8572.89 77.85 83.30 88.64– 1.09 – 1.01 –0.94 –0.90
280 277 285
65.4466.22–1.18
68.2769.05–1.14
93.3294.12–0.85
98.88 99.8499.68 100.64–0.81 –0.80
(000s metric tons)2,634 2,766 2,879 2,9532,483 2,571 3,136 3,2803,029
155 174 174 171 168 168(U.S. # per lb.)
60.37 59.63 59.47 60.1959.26 58.55 58.40 59.14
1.87 1.84 1.83 1.78
168 167 172
59.1158.06
1.81
59.9158.78
1.93
60.8559.80
1.74
60.92 60.9459.88 59.86
1.73 1.80
a similar amount. On the other hand, prices inboth markets are almost unaffected. The max-
price transmission elasticity. Had we used alarger transmission elasticity, a proportionallylarger change in trade volume would have re-duced the price disparity.
imum change in U.S. prices occurs in the firstyear after liberalization and is only 4.41%greater than the base. This small price impactreflects the low price transmission elasticityused in the model as well as the enormous sizeof both markets.
The poultry results in table 7 are very sim-ilar to the pork results in table 6. Chinesepoultry imports increase by almost 300,000tons, and again the U.S. captures the lion’sshare. Price effects are moderate. Becausepoultry trade in both countries is already wellestablished, the trade impacts, as a percentage
Conclusions
The results from our scenario analysis suggestthat liberalization of China’s pork and poultrymarkets will cause a relatively large change inworld trade levels without causing any seriousprice disruptions. The U.S. is in a good posi-tion to capture much of the benefits of such aliberalization, because it already dominatesworld trade in unsubsidized poultry productsand because it is the low-cost producer of porkamong countries that are free of foot-and-mouth disease. 1
The results presented above are by neces-
of existing levels, are much smaller in thepoultry scenario, equaling only a 5–790 in-crease for the U. S., and a 30–50% increase forChina.
Chinese pork and poultry prices start outat a level that is well above the U.S. price, and
1China claims to be free of foot-and-mouth dis-ease, but this claim would be contradicted by any porkimports from countries where the disease is prevalent.
the difference widens as Chinese- demandgrows. Again, we see the impact of the low
Wang et al.: China’s Food Demand and U.S. Pork and Poultry Exports 139
sity based on a simplified trade model. Werewe to fully model the taste differences thatexist across countries, it seems likely Chinawould be an exporter of pork loins and chick-en breasts and a large importer of less-expen-sive cuts and variety meats. Another simplifi-cation concerns the dollar-Yuan exchange rate.Casual observation would seem to suggest thatthe Yuan is undervalued relative to the dollar.The trade effects would have been much great-er had we built in an appreciation of the Yuan.A third simplification is the arbitrarily lowprice transmission elasticity chosen for thestudy.
The key results from this study are the fol-lowing, First, Chinese meat consumption willcontinue to be sensitive to per capita incomes.Continued growth in incomes at levels closeto those seen recently will cause large increas-es in demand for meat products. Second, ifmarkets are allowed to decide where these ad-ditional supplies should originate, U.S. exportsof poultry and pork should increase dramati-cally. Third, so long as the trade increases gen-erated by market liberalization are close to thelevels projected in this study, the price impactin U.S. and Chinese markets will be relativelysmall.
References
Chavas, J.P., and R, Klernme. “Aggregate MilkSupply Response and Investment Behavior onU.S. Dairy Farms. ” Amer. J. Agr. Econ.
68(February 1986):55-66.Cheng, H.T., and 0. Capps, Jr. “Demand Analysis
of Fresh and Frozen Fintish and Shellfish in theUnited States.” Amer. J Agr. Econ. 70(1988):533–42.
Chern, W., and G. Wang. “The Engle Function andComplete Food Demand System for ChineseUrban Households.” China Econ. Rev. 4(1994):35–57.
China Daily. 26 September 1998. Beijing, People’sRepublic of China.
Christensen, L.R., D.W. Jorgenson, and L.J. Lau.“Transcendental Logarithmic Utility Func-tions.” Amer. Econ. Rev. 65(1975):367–83.
Deaton, A., and J. Muellbauer. “An Almost IdealDemand System.” Amer. Econ. Rev. 70(June1980):312–26,
Fan, S., G. Cramer, and E. Wailes. “Food Demand
in Rural China: Evidence from Rural HouseholdSurvey.” Agr. Econ. 11(1994):61–69.
Fan, S., E. Wailes, and G. Cramer. “Household De-mand in Rural China: A Two-Stage LES-AIDSModel. ” Amer. J. Agr. Econ. 77( February1995):54-62.
Food and Agricultural Policy Research Institute(FAPRI). The Rainbow Book: A Summary of the
November 1997 FAPRI Baseline. FAPRI, Uni-versity of Missouri, Columbia, 1997.
Fuell, L., and J. Zhang. “CAPQ Circular on MeatImports for Retail Markets. ” Voluntary AttachReport, AGR No. CH7027, USDA/Foreign Ag-ricultural Service, Washington DC, 18 June1997a.
—. “China’s Pork, Beef, and Mutton Im-ports. “ Voluntary Attach Report, AGR No.CH7020, USDA/Foreign Agricultural Service,Washington DC, 14 April 1997b.
Gao, X.M., E.J. Wailes, and G.L. Cramer. “A llvo-Stage Rural Household Demand Analysis: Micro-data Evidence from Jiangsu Province, China. ”Amer. J. Agr. Econ. 78(August 1996):604-13.
Hayes, D., and R. Clemens, “Marketing VarietyMeats in China: Products and Prices. ” U.S.
Meat Export Analysis and Trade News (14 April1997):1, 3–5.
Huang, J., and H. Bouis. “Structural Changes inthe Demand for Food in Asia. ” Food, Agricul-ture, and the Environment Discus. Pap. No. 11,International Food Policy Research Institute,Washington DC, March 1996,
Huang, J., and C. David. “Demand for CerealGrains in Asia: The Effect of Urbanization. ”Agr. Econ. 8(1993): 107–24.
Lewis, I?, and N. Andrews. “Household Demandin China.” Appl. Econ. 21(1989):793–807.
State Statistical Bureau of China, China’s Statisti-
cal Yearbook. Beijing: China Statistical Publish-ing House, Various years, 198 1–97.
Sullivan, J,, V. Roningen, and S. Leetmaa. “A 1989Global Database for the Static World PolicySimulation (SWOPSIM) Modeling Frame-work. ” Staff Rep. No. AGES 9215, USDA/Eco-nomic Research Service, Washington DC, May1992.
U.S. Department of Agriculture (USDA). Interna-
tional Agricultural and Trade Reports: China.
USDA/Economic Research Service, Washing-ton DC, 1996.
—. The Production, Supply, and Distribution(PS&D) Database [electronic database]. USDA,Washington DC, November 1997.
Vuong, Q.H. “Likelihood-Ratio Tests for Model
140 Journal of Agricultural and Applied Economics, July 1998
Selection and Non-Nested Hypotheses. ” Econ- Wang, Z., and W.S. Chern. “Effects of Rationingometrica 57(March 1989):307–33. on the Consumption Behavior of Chinese Urban
Wang, Q., H.H. Jensen, and S.R. Johnson. “China’s Households During 198 1–1987.” J. Compara-Nutrient Availability and Sources, 1950–199 1.“ tive Econ. 16(1992): 1–26.Food Policy 18( 1993):403–1 3.


