Chinese Building Technologies Industry: Moving Toward Better Integration and Greener Concepts
19
Chinese Building Technologies Industry: Moving Toward Better Integration and Greener Concepts Archana Amarnath Team Leader, Economic Research and Analytics Division Environmental and Building Technologies Industry
-
Upload
frost-sullivan -
Category
Business
-
view
2.801 -
download
0
Transcript of Chinese Building Technologies Industry: Moving Toward Better Integration and Greener Concepts

Chinese Building Technologies Industry: Moving Toward Better Integration and Greener Concepts
Archana AmarnathTeam Leader,
Economic Research and Analytics DivisionEnvironmental and Building Technologies Industry

2
Focus Points
Focus Points
Green Buildings and Green Cities in China
Policy Backdrop and Incentives for the Industry
Growth Opportunities and Future Roadmap of the Industry
Economic Slowdown and Impact on the Industry
Integration of Systems Leading to Intelligent Buildings
Design and Construction Standards in China
Segments in the Building Technologies Industry

3
Segments in the Building Technologies Industry
For the purpose of the briefing, the building technologies industry is divided into two
segments of controls and equipment and services.
Building Technologies Industry
Controls & Equipment Services
• HVAC & Refrigeration
• Building Automation Systems
• Fire & Life Safety Equipments
• Lighting Controls and Products
• Integrated Facilities
Management
• Performance Contracting
4
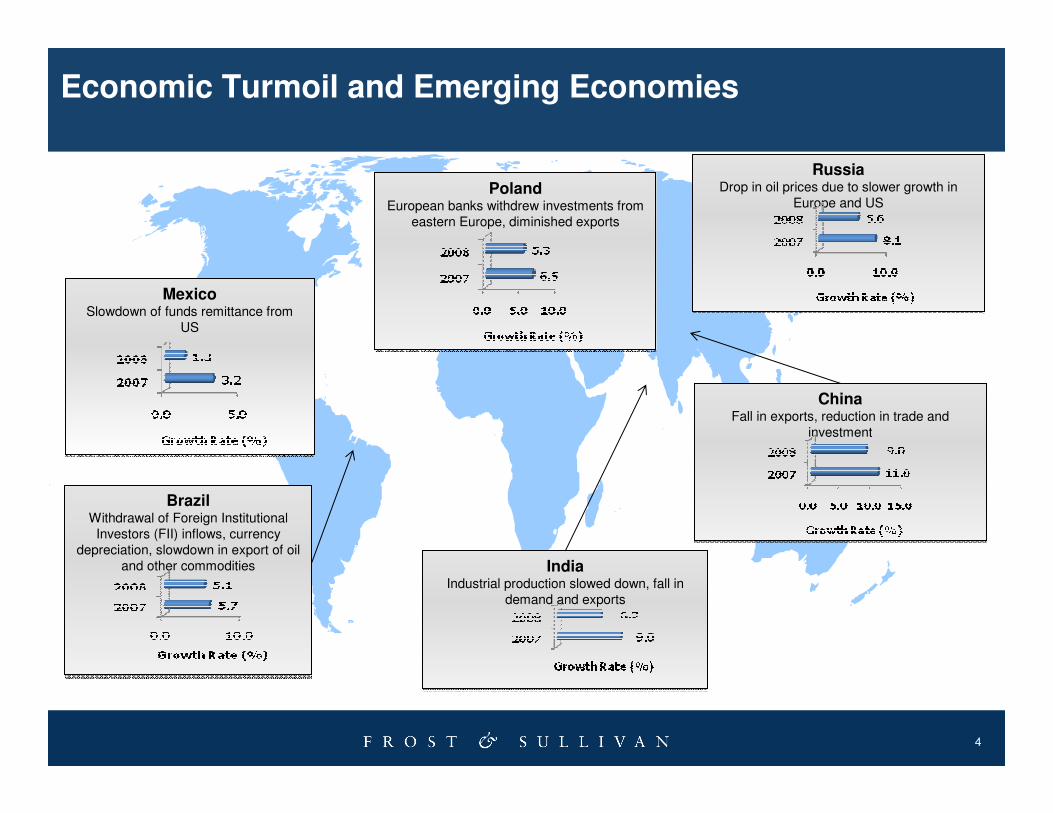
Economic Turmoil and Emerging Economies
BrazilWithdrawal of Foreign Institutional
Investors (FII) inflows, currency depreciation, slowdown in export of oil
and other commodities
BrazilWithdrawal of Foreign Institutional
Investors (FII) inflows, currency depreciation, slowdown in export of oil
and other commodities
ChinaFall in exports, reduction in trade and
investment
ChinaFall in exports, reduction in trade and
investment
PolandEuropean banks withdrew investments from
eastern Europe, diminished exports
PolandEuropean banks withdrew investments from
eastern Europe, diminished exports
RussiaDrop in oil prices due to slower growth in
Europe and US
RussiaDrop in oil prices due to slower growth in
Europe and US
IndiaIndustrial production slowed down, fall in
demand and exports
IndiaIndustrial production slowed down, fall in
demand and exports
MexicoSlowdown of funds remittance from
US
MexicoSlowdown of funds remittance from
US

5
Way to Recovery - Stimulus Measures and Current Economic Outlook
Brazil Total $22 billion package- auto industry and exports- Increased lending by state banks,
Central Bank support for corporate foreign debt and monetary easing to partly offset impact of
global slow downQ1 2009 – 1.7%
Q2 2009 – 2%
Brazil Total $22 billion package- auto industry and exports- Increased lending by state banks,
Central Bank support for corporate foreign debt and monetary easing to partly offset impact of
global slow downQ1 2009 – 1.7%
Q2 2009 – 2%
PolandFiscal measures- Additional fiscal spending, additional credit. June 2009- Unemployment
dropping and overall industry growth and trade improving
Q1 2009 - 0.8 % Q2 – maintain 0.8%
PolandFiscal measures- Additional fiscal spending, additional credit. June 2009- Unemployment
dropping and overall industry growth and trade improving
Q1 2009 - 0.8 % Q2 – maintain 0.8%
Russia$58 billion package –tax breaks, loans, cuts in
interest rates. June 2009- Unemployment falling, investment and retail sales rising
Q1 2009 – (9.5%)
Q2 - expected between 1.3 – 2.8%
Russia$58 billion package –tax breaks, loans, cuts in
interest rates. June 2009- Unemployment falling, investment and retail sales rising
Q1 2009 – (9.5%)
Q2 - expected between 1.3 – 2.8%
Mexico
Lower interest rates are less effective in jump-starting economy. Dramatic fall in tourism.
Q1 2009 decreased by (8.2%)
Q2 2009 decreased by (10.4%)
Mexico
Lower interest rates are less effective in jump-starting economy. Dramatic fall in tourism.
Q1 2009 decreased by (8.2%)
Q2 2009 decreased by (10.4%)
IndiaStimulus packages with tax cuts, Cut in Reserve Bank of
India repo rate and fall in Cash Reserve Ratio. June 2009 - Business and investment improving. Economic
growth to gain momentum in second half of 2009Q1 2009 - 5.8%
Q2 – 4.7%
IndiaStimulus packages with tax cuts, Cut in Reserve Bank of
India repo rate and fall in Cash Reserve Ratio. June 2009 - Business and investment improving. Economic
growth to gain momentum in second half of 2009Q1 2009 - 5.8%
Q2 – 4.7%
ChinaStimulus package-$586 bn – targeted toward infrastructure development and post quake
reconstructionEconomic Growth
Q1 2009 - 6.1 % Q2 2009 - 7.9 %
ChinaStimulus package-$586 bn – targeted toward infrastructure development and post quake
reconstructionEconomic Growth
Q1 2009 - 6.1 % Q2 2009 - 7.9 %

6
Impact of the Economic Recession on the Building Technologies Industry
North America
European Union
China
Australia
China: Relatively Higher potential in the construction sector in China – driven by government support, energy saving incentives, investment and ongoing and proposed PPP projects.
China: Relatively Higher potential in the construction sector in China – driven by government support, energy saving incentives, investment and ongoing and proposed PPP projects.
Eastern Europe• Decline in segments in equipment
viewed discretionary such as HVAC, refrigeration
• Decline in new construction decreased growth of fire and life safety
Eastern Europe• Decline in segments in equipment
viewed discretionary such as HVAC, refrigeration
• Decline in new construction decreased growth of fire and life safety
Latin America• Postponement of investments in new
construction projects• Less demand for BT products,
services that are viewed discretionary
Latin America• Postponement of investments in new
construction projects• Less demand for BT products,
services that are viewed discretionary
North America• Fall in construction output
and consumer confidence in 2008
• Demand from refurbishment of old buildings decreased in 2008 to increase gradually in 2009
North America• Fall in construction output
and consumer confidence in 2008
• Demand from refurbishment of old buildings decreased in 2008 to increase gradually in 2009
GLOBAL IMPACT OF RECESSION• HVAC&R – Most impacted• I- FM – Least Affected
GLOBAL IMPACT OF RECESSION• HVAC&R – Most impacted• I- FM – Least Affected

7
Chinese Building Technologies Industry
An Insight into Key Trends and Green Initiatives in Buildings in China

8
Performance of Construction Sector in China in 2009
Government Support to Rejuvenate the Construction Sector in 2009
• A long-term development scheme - provide housing at affordable prices, issuing of loans for real-estate businesses and other financial products for property developers has been proposed by MOHURD
• Property tax (for first time buyers for properties smaller than 90 square meters) reduced from 3 percent to 1 percent in 2009
• The percent for down payment reduced from 30 percent to 20 percent in 2009.
• Stimulus plan - the development of 5.2 million low-rent properties from 2009 to 2012 and housing at subsidized rates for 7.5 million poor families from 2009 to 2011.
Government Support to Rejuvenate the Government Support to Rejuvenate the
Construction Sector in 2009Construction Sector in 2009
• A long-term development scheme - provide housing at affordable prices, issuing of loans for real-estate businesses and other financial products for property developers has been proposed by MOHURD
• Property tax (for first time buyers for properties smaller than 90 square meters) reduced from 3 percent to 1 percent in 2009
• The percent for down payment reduced from 30 percent to 20 percent in 2009.
• Stimulus plan - the development of 5.2 million low-rent properties from 2009 to 2012 and housing at subsidized rates for 7.5 million poor families from 2009 to 2011.
Economic Growth, China (2004-2010)
Newly Built Residential Buildings, China (2004-2008)
Signs of Recovery for the Construction Sector Since May 2009
• Drivers - the $585 billion stimulus plan and issuance of loans for real estate businesses.
• Real estate sales have increased by 45.3% from January to May 2009 as compared to the same period in 2008.
• Investments in the construction sector increased by 6.8% during the same period.
• Housing prices have increased by 0.6 percent month-on-month in May 2009.
Signs of Recovery for the Construction Sector Signs of Recovery for the Construction Sector
Since May 2009Since May 2009
• Drivers - the $585 billion stimulus plan and issuance of loans for real estate businesses.
• Real estate sales have increased by 45.3% from January to May 2009 as compared to the same period in 2008.
• Investments in the construction sector increased by 6.8% during the same period.
• Housing prices have increased by 0.6 percent month-on-month in May 2009.
5.69
6.616.30
6.88 6.956.80 6.84
7.758.1
6.67
0.0
1.0
2.0
3.0
4.0
5.0
6.0
7.0
8.0
9.0
2004 2005 2006 2007 2008Floor Space of Newly Built Residential
Buildings in 100 Million Square Meters
Urban Rural
10.1 10.411.1
11.9
9.08.0
9.0
0
2
4
6
8
10
12
14
2004 2005 2006 2007 2008 2009 2010
In Percent

9
Stimulus Package and Impact on the Chinese Building Technologies Industry
Social Welfare,
$58.55 billion,
10%
Technology
Advancement,
$54.16 billion,
9%
Post Quake
Reconstruction,
$146.37 billion,
25%
Educational &
Cultural Projects,
$21.96 billion,
4%
Rural
Development,
$54.16 billion,
9%
Public
Infrastructure,
$219.56 billion,
38%
Sustainable
Development,
$30.74 billion,
5%
Note:
Conversion Rate: 1 RMB = 0.146374 USD
Breakdown Of $585 Billion Stimulus Package, Breakdown Of $585 Billion Stimulus Package,
China (2008)China (2008)Potential for Building Technologies Industry
Around 38% allocated for roads, railways, airports and power grids
• Infrastructure
• Property Market
Sales volume showing 29% growth in Beijing, Shanghai, and Chongqing as of April 2009
• Housing and Commercial Buildings
Construction of low-rent properties, subsidized housing for the poor and investment in post quake reconstruction. Reduction in property tax and the percent of down payment to encourage housing sales.
• Sustainable Development
Around 5% of plan allocated for energy conservation and emission cuts
Key Sectors Future Plans

10
Design and Construction Standards Driving Energy Conservation in China
Number Name of Design Standard
1 Design Standard for Energy Efficiency of Residential Buildings in Hot Summer and Cold Winter Zone
2 Standard for Energy Efficiency Inspection of Heating ResidentialBuildings
3 Technical Code for Renovation of Existing Heating Residential Buildings
4 Energy Conservation Design Standard for New Heating Residential Buildings
5 Energy Conservation Design Standard on Building Envelope and AirConditioning for Tourist Hotels
6 Energy Conservation Design Standard for New Heating Residential Buildings
Number Name of Construction Standard
1 Thermal Design Code for Civil Building
2 Lighting Design Code for Civil Building
3 Design Code for Heating, Ventilating and Air Conditioning
4 Design Code for Tourist Hotels
National Energy Strategy for Buildings
• Targets to reduce energy consumption by buildings by 50% by 2010 and by 65% by 2020 as compared to 1980 levels of energy consumption has been set
Targets Under Eleventh National Five Year Plan
• A target to reduce energy per of GDP by 20% has been set.
• Emphasis is on on energy efficient solutions for buildings
Other Laws
• China Building Code
• Energy Saving Law
• Product Quality Law (Amended 2000)
• Standardization Law (1988)
Other Legislations Driving Other Legislations Driving
Energy Efficiency in BuildingsEnergy Efficiency in Buildings

11
Government Initiatives for Energy Efficient Equipment in China
China Energy Label Program (2003)
Certification Programs For Controls and
Equipments
Light Emitting Diode (LED)
Lighting Research & Development Fund
(2008)
China Green Lights Project
(2001-2005)(Demand Pull and Technology Push
Strategies)
National CFL Standard
Program to Promote Efficient Lighting
Products in China (2008)
• Safety standard
• Performance standard
• Energy efficiency standard
• Electromagnetic Compatibility (EMC) standard
• Compulsory Certification CCC (2002)
• RoHS Compliance Certificates
• Energy Star Certificate
Energy Energy
Efficient Efficient
EquipmentEquipment

12
Technology Development Driving Intelligent and Green Buildings in China
Green And Intelligent Buildings in China
Electric Controls and Pneumatic Transmission
Electronic Controls
Multiplex Control Systems
Direct Digital Controls and Personal Computers
BACnet and LONWorks Revolution
Increasing Convergence of IT and BAS
Wireless Technologies with P2P Architecture
Integration of Building Services with A Single IT Platform (Open Systems)
Closing the Gap Between IT and BAS
BA
SIT 2005
End-users with large complex building
facilities are demanding integrated systems.
Opportunities lie in airport, government buildings, healthcare
and R&D facilities
Integration of Building Services and Functions w
ith IT Infrastructure
China BAS: From Proprietary Communication Protocols to Open Systems
2005
2005
1980
1980
2000
2000
“Energy Efficiency in Existing Buildings”(EEEB) Project (2006-
2010) – Propagation of advanced technologies and energy efficient solutions

13
Green City and Green Buildings Projects: Taking the LEED in China
Green BuildingsGreen Buildings Green CitiesGreen Cities
Drivers
• Government Support, Legislation and Investment
• Investment from Private sector and in R&D
• High Oil and Electricity prices pushing green measures and investment
Opportunities:
• Green Supply Chain - eco-friendly materials,
construction parts, and knowledge
• Community Waste Management
• Water Treatment and Purification
• Combined Heat and Power Systems
Evaluation Standard for Green Buildings (2006)
• Three Star System - Green buildings rated on three grades, 1 star, 2-star and 3-star.
• Similar to the LEED program.
Number of Green Buildings
• Three Star (2009)
8 Certified and 4 at Three Star Level
• LEED
161 registered and 12 certified
Category 3 STAR LEED v2.2
Sustainable Site 9 14+1
Energy & Atmosphere 14 17+3
Water Efficiency 7 5
Materials & Resources 10 13+1
Indoor Environmental Quality 9 15+2
Operations and Maintenance 8
Innovation 5
Total 57 69
3 Star Rating System In China 3 Star Rating System In China –– Comparison with LEEDComparison with LEED

14
Opportunities for Building Automation Systems Companies in China – End User Demand
Commercial Sectors (52% in 2008)
• Offices
• Retail and wholesale trade buildings
• Other commercial buildings
Other Non-residential Sectors (30% in 2008)
• Educational buildings• Health and aged care facilities• Entertainment and recreational facilities• Public facilities
Industrial Sectors (18% in 2008)
• Factories and other production buildings
• Warehouses
• Other industrial buildings
52%
30%
18%

15
Growth Opportunities in the Building Technologies Industry – On the Rebound from 2010
North America
European Union
China
Australia
Opportunities in Segments of:
Home Automation, BAS, CFLs, Integrated Systems, Open Platforms and Standards
Opportunities in Segments of:
Home Automation, BAS, CFLs, Integrated Systems, Open Platforms and Standards
CEE• High replacement demand would
drive refrigeration and lighting.• Continued growth of IFM due to small
specialized packages• Catch up with Western Standards due
to EU funding
CEE• High replacement demand would
drive refrigeration and lighting.• Continued growth of IFM due to small
specialized packages• Catch up with Western Standards due
to EU funding
Latin America• Rising Government infrastructure
spending in 2010 -2011 to improve demand for BAS
• Energy saving standards to increase demand for CFLs and HVAC
Latin America• Rising Government infrastructure
spending in 2010 -2011 to improve demand for BAS
• Energy saving standards to increase demand for CFLs and HVAC
North America• Green technology to
increase in 2010• Investment in construction
to improve demand
North America• Green technology to
increase in 2010• Investment in construction
to improve demand
EU• Legislation to drive energy efficient
lighting.• IFM providers to focus on performance
contracting
EU• Legislation to drive energy efficient
lighting.• IFM providers to focus on performance
contracting
GLOBAL IMPACTPeriod of Recovery (Q1 2010 -2011)
• Design, R&D and value added services to improve• Emphasis on low cost green products• Construction related demand to increase
GLOBAL IMPACTPeriod of Recovery (Q1 2010 -2011)
• Design, R&D and value added services to improve• Emphasis on low cost green products• Construction related demand to increase

16
Future Roadmap of the Building Technologies Industry in China
Level 1: 2009
Focus on Energy Conservation in Buildings and Infrastructure Development
Level 1: 2009
Focus on Energy Conservation in Buildings and Infrastructure Development
Level 2: 2010
Continued Growth of Energy Saving Technologies with Custom Interfaces for BAS
Level 2: 2010
Continued Growth of Energy Saving Technologies with Custom Interfaces for BAS
Level 3: 2011
Emergence of High-Tech Green Cities and More ‘Intelligent Green’ Buildings
Level 3: 2011
Emergence of High-Tech Green Cities and More ‘Intelligent Green’ Buildings
Level 4: 2012
Numerous Green and Intelligent Matching International Standards in China
Level 4: 2012
Numerous Green and Intelligent Matching International Standards in China
WorldChina

17
Next Steps
� Request a proposal for a Growth Partnership Service to support you and your team to accelerate the growth of your company. ([email protected])1-877-GoFrost (1-877-463-7678)
� Join us at our annual Growth, Innovation, and Leadership 2009: A Frost & Sullivan Global Congress on Corporate Growth, September 13-16 2009, Hyatt Scottsdale Resort & Spa at Gainey Ranch, Scottsdale, AZ(www.gil-global.com)
� Register for the next Chairman’s Series on Growth:
The CEO's Growth Team™: The CEO’s Growth Survey and its Economic
Outlook for 2010 (September 3, 2009) (http://www.frost.com/growth)
� Register for Frost & Sullivan’s Growth Opportunity Newsletter and keepabreast of innovative growth opportunities(www.frost.com/news)

18
Your Feedback is Important to Us
Growth Forecasts?
Competitive Structure?
Emerging Trends?
Strategic Recommendations?
Other?
Please inform us by taking our survey.
What would you like to see from Frost & Sullivan?

19
For Additional Information
Jake Wengroff
Global Director
Corporate Communications
+ 001 (210) 247-3806
Sandeep Maheshwari
Vice President
Economic Research and Analytics (ERA) Division
+001 (210) 326-0456
T.J. Sivan
Industry Manager
Economic Research and Analytics (ERA) Division
+91 (044) 420-44502