China y América Latina: hacia una relación estratégica UDUAL...China y América Latina: hacia una...
40
China y América Latina: hacia una relación estratégica Osvaldo Rosales Director International Trade and Integration Division ECLAC I Seminario Internacional China y A. Latina y el Caribe UNAM, Ciudad de México, México 28 th May, 2012
Transcript of China y América Latina: hacia una relación estratégica UDUAL...China y América Latina: hacia una...

China y América Latina: hacia una relación
estratégica Osvaldo Rosales
Director International Trade and Integration Division
ECLAC
I Seminario Internacional
China y A. Latina y el Caribe
UNAM, Ciudad de México, México
28th May, 2012

I. Emergent Economies: The New Geography of Economic Growth

The South has driven much of the upturn in international trade
GROWTH IN WORLD TRADE AND
CONTRIBUTION OF DEVELOPING COUNTRIES,
2003-2010 (Percentages)
Source: ECLAC, on the basis of data
from CPB Netherlands Bureau for
Economic Policy Analysis.
3
WORLD: DISTRIBUTION OF EXPORTS,
1985 AND 2010 (Percentages of world trade)
1985 2010 a
S-S From 6% to 24%
N-N : From 63% to 38%
Source: ECLAC, on the basis of United
Nations Commodity Trade Database
(COMTRADE).
a Estimate on the basis of 90% of world
exports.
South-South trade has become more significant within world trade in the wake of the crisis
and could exceed North-North trade by 2017
EXPORTS BY REGION, 1985-2020 (Percentages of the total)
Source: ECLAC, on the basis of official figures
Nota Figures for 2011-2020 are projections on the basis of the
long-term linear trend.

4
Regions / Countries 2008 2009 2010 2011
Developed Economies 0,12 -1,79 1,55 1,22
United States 0,00 -0,53 0,56 0,53
European Union 0,15 -0,87 0,36 0,35
Japan -0,07 -0,37 0,23 0,08
Others 0,04 -0,02 0,40 0,25
Developing Countries 2,74 1,27 3,46 3,18
Sub-Saharan Africa 0,13 0,07 0,12 0,14
Latin America and the Caribbean 0,37 -0,15 0,52 0,40
Developing Asia 1,64 1,66 2,29 2,10
China 1,13 1,19 1,40 1,37
Middle East and North Africa 0,25 0,09 0,19 0,20
Central and Eastern Europe 0,11 -0,12 0,15 0,12
World 2,87 -0,52 5,01 4,40
CONTRIBUTION TO WORDL GDP GROWTH, 2008-2011 (Growth rates)
The South led the recovery of world economy in 2010, with Developing Asia and Latin America and the Caribbean playing a protagonist role
Fuente: ECLAC based on IMF data
LAC and DA (2.8 combined)
accounting for 56% of world growth of 5.0 % in 2010. LAC’s
contribution was similar to that of the
US that year

5
In 2010, developing countries received 50% of global FDI flows
Source: ECLAC, on the basis of figures from World Investment Report 2011 (UNCTAD).
FDI FLOWS BY RECIPIENT REGION, 1990-2010
(Billions of dollars and percentages of the total)

The crisis hastened the reduction of the per capita income gap between the developing countries and the advanced economies
WORLD: PER CAPITA INCOME GAP, 1980-2016
(Index of difference in per capita GDP with respect to the developed economies,
in logarithms and 1980=100)
Source: ECLAC, on the basis of IMF (2011), “World Economic Outlook Database,” and World Economic and Financial Surveys. Note: the lines correspond the evolution of the gap. A positive trend denotes a widening of the gap, while a negative trend denotes a narrowing of the gap (convergence).
6
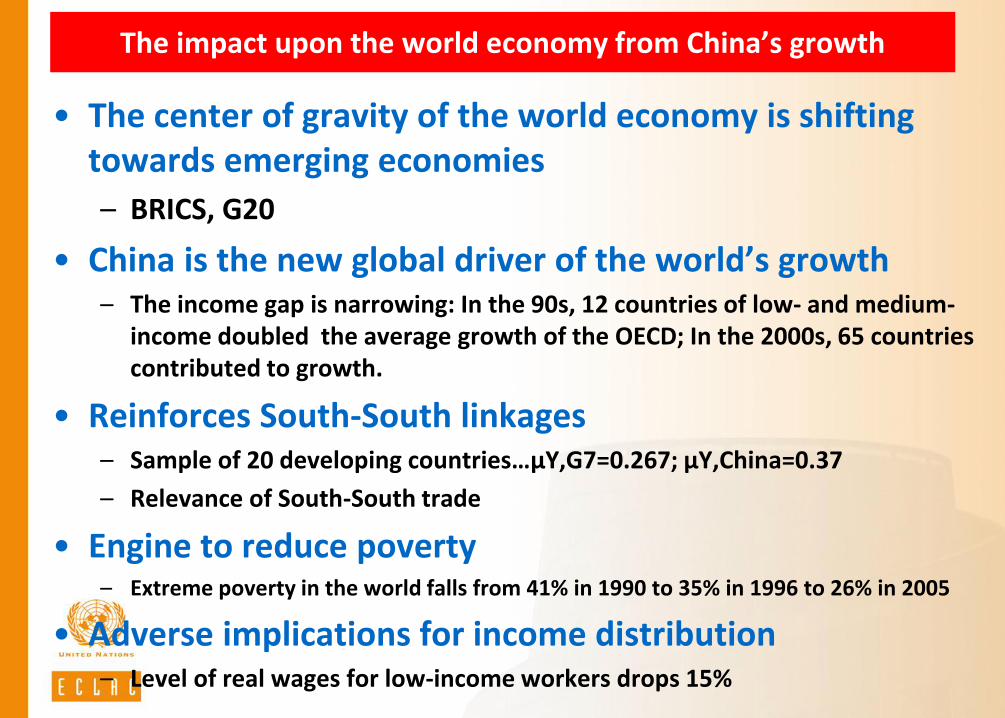
The impact upon the world economy from China’s growth
• The center of gravity of the world economy is shifting towards emerging economies
– BRICS, G20
• China is the new global driver of the world’s growth – The income gap is narrowing: In the 90s, 12 countries of low- and medium-
income doubled the average growth of the OECD; In the 2000s, 65 countries contributed to growth.
• Reinforces South-South linkages – Sample of 20 developing countries…µY,G7=0.267; µY,China=0.37
– Relevance of South-South trade
• Engine to reduce poverty – Extreme poverty in the world falls from 41% in 1990 to 35% in 1996 to 26% in 2005
• Adverse implications for income distribution – Level of real wages for low-income workers drops 15%

8
En 2030, 2/3 of the world middle- class will be in East Asia.
This region will explain 60% of the world consumption
expenditure
POBLACIÓN Y GASTOS DE CONSUMO DE LA CLASE MEDIA,
POR REGIONES, 2009, 2020 Y 2030 a
Fuente: CEPAL, sobre la base de Homi Kharas, “The Emerging Middle Class in Developing Countries”, enero de 2010.
a Las cifras de 2020 y 2030 son proyecciones.
b Los gastos de consumo se calcularon sobre la base de la paridad del poder adquisitivo (PPA).
Población
(En porcentajes del total mundial)
Gastos de consumo b
(En porcentajes del total mundial)
0%
10%
20%
30%
40%
50%
60%
70%
80%
90%
100%
2009 2020* 2030*
América del Norte
Europa
Africa sub-sahara
Oriente Medio yAfrica del Norte
América Latina y elCaribe
Asia y Oceania
0%
10%
20%
30%
40%
50%
60%
70%
80%
90%
100%
2009 2020* 2030*

Developing Asia and Latin America and the Caribbean will be leading world growth Contribution to World Economic Growth by Region,
2011-2021 (In percentages)
BBVA. “Economic Outlook, Eagles”, Annual Report 2012, Economic Analysis

II. Main features of trade between Latin America and East
Asia

FEALAC-LAC trade with Asia Pacific has been growing fast
A. Exports B. Imports
6,4
1,3
4,2
21,6
33,4
13,7
8,9
10,8
- 10 20 30 40
World
United States
European Union
Asia Pacific
China
Other Asia
Latin America and the Caribbean
Rest of the World
9,2
5,9
9,2
14,8
22,6
9,1
8,1
9,5
- 05 10 15 20 25
World
United States
European Union
Asia Pacific
China
Other Asia
Latin America and the Caribbean
Rest of the World
LATIN AMERICA AND THE CARIBBEAN, INTERNATIONAL TRADE, BY MAJOR PARTNER, 2006-2010 (Annualised growth rates)
Source: Economic Commission for Latin America and the Caribbean

Asia-Pacific, and especially China, has been a key factor in diversifying markets for the region. However, the dynamism of AP
does not lie solely in China
A. Exports B. Imports
0
10
20
30
40
50
60
19
90
19
91
19
92
19
93
19
94
19
95
19
96
19
97
19
98
19
99
20
00
20
01
20
02
20
03
20
04
20
05
20
06
20
07
20
08
20
09
20
10
Latin America and the Caribbean China
Other Asia United States
European Union
0
10
20
30
40
50
60
19
90
19
91
19
92
19
93
19
94
19
95
19
96
19
97
19
98
19
99
20
00
20
01
20
02
20
03
20
04
20
05
20
06
20
07
20
08
20
09
20
10
LATIN AMERICA AND THE CARIBBEAN, INTERNATIONAL TRADE, BY MAJOR PARTNER, 1990-2010 (Share in regional total)
Source: ECLAC based on COMTRADE.

FEALAC-AP is already a significant export market for some Latin American countries. From the AP viewpoint, Latin America has not been a major trading
partner, which results in a highly asymmetrical relationship
A. FEALAC-AP Exports B. FEALAC-LAC Exports
99.282
99.710
93.072
10.483
64.314
55.028
58.492
52.455
50.943
44.066
52.417
55.053
39.134
42.485
23.286
44.031
.007
.029
.161
1.209
1.403
1.682
1.862
1.979
2.530
2.595
2.741
3.270
4.332
4.974
5.077
6.493
0 50 100
Brunei Darussalam
Lao P.D.R.
Myanmar
Cambodia
Australia
Malaysia
Indonesia
Philippines
Thailand
Viet Nam
Singapore
New Zealand
FEALAC-AP
Japan
China
Koorea, Rep. of
FEALAC-AP
FEALAC-LAC
1.067
1.619
2.554
2.716
3.462
3.678
3.844
4.034
5.225
6.060
9.784
12.077
12.400
15.893
17.199
21.574
23.415
39.219
39.953
29.559
26.761
6.520
65.664
4.382
33.866
33.284
4.259
70.047
29.624
21.959
18.052
45.778
41.554
62.193
22.264
17.545
17.648
7.175
0 20 40 60 80 100
El Salvador
Nicaragua
Mexico
Panama
Venezuela, R. B.
Guatemala
Ecuador
Paraguay
Colombia
Costa Rica
FEALAC-LAC
Uruguay
Argentina
Bolivia (E.P.)
Brazil
Peru
Chile
Cuba
FEALAC-AP
FEALAC-LAC
SHARE OF FEALAC-AP AND FEALAC-LAC TRADE IN TOTAL TRADE 2008-2010 (percentages)
ECLAC based on COMTRADE and official national statistics.

Trade between AP and LAC is almost entirely inter-industrial, though with some differences among AP countries
LATIN AMERICA AND THE CARIBBEAN : EXPORT STRUCTURE BY TECHNOLOGICAL INTENSITY
(Percentage) A. MAJOR EXPORT MARKETS, 2008-2010
24%
62%
28%
52%
23%
25%
12%
24%
0%
10%
20%
30%
40%
50%
60%
70%
80%
90%
100%
Latin Americaand the
Caribbean
Asia Pacific United States EuropeanUnion
High tech manufactures Medium tech manufacturesLow tech manufactures Natural Resource-based ManufacturesPrimary Products
B. SELECTED ASIAN MARKETS, 2007-2009
0%10%20%30%40%50%60%70%80%90%
100%
ASEAN Aus+NZl China Japan Korea, Rep. of
Others World
Source: ECLAC based on COMTRADE.
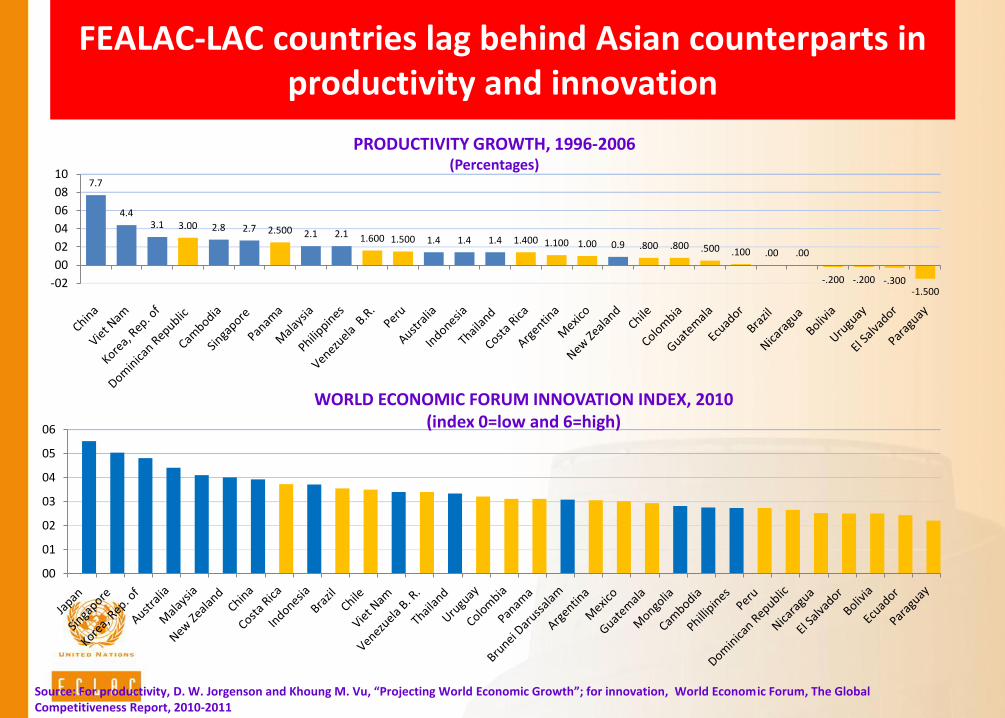
FEALAC-LAC countries lag behind Asian counterparts in productivity and innovation
7.7
4.4 3.1 3.00 2.8 2.7 2.500 2.1 2.1 1.600 1.500 1.4 1.4 1.4 1.400 1.100 1.00 0.9 .800 .800 .500 .100 .00 .00
-.200 -.200 -.300 -1.500
-02
00
02
04
06
08
10
00
01
02
03
04
05
06
PRODUCTIVITY GROWTH, 1996-2006 (Percentages)
WORLD ECONOMIC FORUM INNOVATION INDEX, 2010 (index 0=low and 6=high)
Source: For productivity, D. W. Jorgenson and Khoung M. Vu, “Projecting World Economic Growth”; for innovation, World Econom ic Forum, The Global Competitiveness Report, 2010-2011

FEALAC-AP countries perform much better in poverty reduction and income distribution than FEALAC-LAC counterparts. This presents
formidable challenges for the latter
AUS
CHN
IDN
JPN
KHM
KOR LAO
MNG MYS
NZL
PHL SGP THA
VTM
ARG
BOL
BRA
CHI
COL
CRI
DOM
ECU GTM
MEX
NIC PAN
PER PRY
SLV UGY
VEN
20
25
30
35
40
45
50
55
60
0 5000 10000 15000 20000 25000 30000 35000 40000 45000 50000
GN
I In
dex
GDP per capita
INCOME DISTRIBUTION OF FEALAC COUNTRIES IN RELATION TO GDP PER CAPITA, 2009 (Dollars and GNI Index)
Source: ECLAC based on World Bank World Economic Development Indicators, 2010.

III. Main features of trade between Latin America and China

China has become a very important trading partner for some countries in LAC particularly with respect to imports.
A. Exports B. Imports
Source: ECLAC based on data from COMTRADE
LATIN AMERICA AND THE CARIBBEAN: ASIA-PACIFIC AND CHINA’S PARTICIPATION IN TRADE, 2010
(In percentages of total imports and exports of each country)
0 10 20 30 40 50 60
NicaraguaBahamasGrenada
St. Vincent and the GrenadinesBelize
El SalvadorSaint Lucia
Saint Kitts & NevisJamaica
GuatemalaMexico
Trinidad and TobagoParaguaySuriname
HaitiBarbadosDominica
GuyanaEcuador
HondurasDominican Republic
Bolivia, Plur. St. ofCosta RicaColombia
PanamaUruguay
Venezuela, Bol. Rep. ofArgentina
Lat. Am. & CaribbeanBrazilPeruChileCuba
China Others Asia /a
9.1
0 10 20 30 40 50 60
NicaraguaSaint Lucia
Saint Kitts & NevisGrenada
HondurasTrinidad and Tobago
BarbadosBahamas
JamaicaBelize
El SalvadorPanama
Costa RicaGuatemala
MexicoGuyana
HaitiDominica
EcuadorSuriname
Bolivia, Plur. St. ofVenezuela, Bol. Rep. of
Dominican RepublicLat. Am. & Caribbean
CubaUruguay
St. Vincent & the GrenadinesColombiaArgentina
BrazilChilePeru
Paraguay
China
Others Asia /a
13.0

In eight short years, China’s importance as a trading partner for Latin America has increased significantly.
Destination of Exports Source of Imports
2000 2008 2000 2008
Argentina 6 2 4 3
Brazil 12 1 11 2
Chile 5 1 4 2
Colombia 35 4 15 2
Peru 4 2 13 2
Venezuela 37 3 18 3
Costa Rica 26 2 16 3
Mexico 25 5 6 3
Cuba 5 2 5 2
China has a presence in 21 Latin American nations
• Top 5 in 10 countries
• Top 1-2- in 6 countries
… in almost 32 markets
• Top 5 in 23 countries
• Top 2 in 5 countries

LAC (16 countries): Share of the main destinations in total exports, 2000-2020 (In %)
Source: Economic Commission for Latin America and the Caribbean (ECLAC), based on data from the COMTRADE database and national sources. Notes: The 16 countries are: Argentina, Bolivia (Plurinational State of), Brazil, Chile, Colombia, Costa Rica, Ecuador, El Salvador, Guatemala, Honduras, Mexico, Panama, Paraguay, Peru, Uruguay, Venezuela (Bolivarian Republic of). Estimates and projections based on GDP growth rates for the years 2000-2009 in the United States, European Union, China, Latin America and the Caribbean, Asia-Pacific, and the Rest of World. A growth rate of trade which converges to the economies' long-term growth rate is expected.
LAC (16 countries): Share of the Main Sources of Total Imports, 2000-2020. (In %)
Source: Economic Commission for Latin America and the Caribbean (ECLAC), based on data from the COMTRADE database and national sources. Notes: the 16 countries are: Argentina, Bolivia (Plurinational State of), Brazil, Chile, Colombia, Costa Rica, Ecuador, El Salvador, Guatemala, Honduras, Mexico, Panama, Paraguay, Peru, Uruguay, Venezuela (Bolivarian Republic of). Estimates and projections based on GDP growth rates for the years 2000-2009 in the United States, European Union, China, Latin America and the Caribbean, Asia-Pacific, and Rest of World. It is expected a growth rate of trade which converges to the economies' long-term growth rate.
China is displacing EU as the second largest trading partner of LAC

Recent features of trade between China and Latin America
• Trade is concentrated in few countries and few products
– Brazil, Chile and Argentina account for 77% of exports
– Copper (30%) and Soy (12%)
• In each country, few products (2-3) make up 80-90% of exports to China (with the exception of Brazil and Mexico)
• They are basic products that are not technologically intensive or knowledge-based (with the exception of Mexico and Costa Rica)
Recent features of trade between LAC-AP
• Trade ties with China and Asia-Pacific are different among the regions.
– In South America they are of a complementary nature and South America has a slight surplus.
– Competition and deficits in Mexico and Central America
• High asymmetries between elevated trade flows and low reciprocal investment
• Trade with China is excessively of an inter-industrial nature.
– Lat. Am. exports raw materials and imports manufactures.
– Less room for diversifying exports
– Productive and technological alliances are more difficult.

Exports, imports and trade balance with China (In millions of dollars)
Source: ECLAC on the basis of COMTRADE data, official data and DOTs (IMF).
Trade pattern of LAC with China is
different among South America and
Mexico and Central America

IV. Conocer los desafíos de China para aprovechar oportunidades
29

Los desafíos de China
• Apoyarse más en el mercado interno y en el consumo doméstico
• Equilibrar la costa con el interior
– Reducir las desigualdades
– Mejorar la distribución del ingreso
• Construir una red de apoyo social
30

Osvaldo Rosales 31 6/5/2012
Agenda interna de negociaciones en China
• Política del “Go West” busca reducir diferencias campo ciudad y entre la costa y zonas rurales
• El delta del Yangtze –Shangai es el más dinámico
• La zona de Guangdong – en torno al delta Pearl River- busca competir con Shangai, creando una amplia zona de LC hasta la frontera con India

Osvaldo Rosales 32 6/5/2012
El 9+2, un TLC inédito
• Area integrada de comercio que incluye 9 provincias más Hong Kong y Macao – 1/3 de la población china
– 30% de las X chinas
– 40% del PIB de China
– Objetivo: llevar el dinamismo de la costa a las provincias más pobres del interior
– 9 provincias: Guangdong, Fujian, Jiangxi, Hunan, Guangxi, Hainan, Guizhou, Yunnan, Sichuan
– 9+2 vía Yunnan conduce a la India !!!!!!

Osvaldo Rosales 33 6/5/2012
EL TLC 9+2

Los desafíos de China
• Apoyarse más en el mercado interno y en el consumo doméstico
• Equilibrar la costa con el interior
• Construir una red de apoyo social
• Reducir drásticamente la contaminación
34

35

36

Los desafíos de China
• Apoyarse más en el mercado interno y en el consumo doméstico
• Equilibrar la costa con el interior
• Construir una red de apoyo social
• Reducir drásticamente la contaminación
• Asegurar un desarrollo bajo en carbono
• Asegurar una adecuada oferta agrícola y de materias primas
• Compatibilizar lo anterior con su nuevo rol en Asia y en la economía global
– Convertibilidad del yuan
– Apertura de su cuenta de capitales
– Internacionalización de empresas
37

V. Building a strategic economic and trade relationship with
China/Asia.

Main Issues • China is more important for South America’s growth
than the United States.
• Positive cycle for international prices for commodities for the remainder of the decade (relevant for South America)
– Possibility of a “super cycle”
– Risk: excessive support for commodities with low value added, exchange rate appreciation, obstacles for export diversification and productive transformation
– Challenge: Take advantage of the opportunities
• “Dutch Disease?” The curse of natural resources?
• New central-peripheral cycle in the XXI century?

Improving relationships between China and Latin America: challenges for L. America
• Privilege multinational approaches. Less emphasis to unilateral approaching initiatives to China and Asia Pacific
– Scale matters: more coverage initiatives capable of attracting resources in larger
– Larger scale of initiatives
• Coordinate efforts between LatAm countries
• Define regional priorities in an agreed agenda
– Export diversification
– Attracting Chinese FDI: investing in Asian value-chains
– Business and technology Sino-Lat Am alliances
– Advancing on trade and investment operations in renminbi

Improving relationships between China and Latin America: challenges for China
• Increase and diversify its FDI in Lat Am
• Understand the political and institutional features of Lat Am
– Separation of powers; legislation on visas; labor and environment legislation; role of civil society
• Funds to support export diversification of Lat AM SMEs
– Traceability in natural resources exports
– Quality certification
– Technical standards
– Reducing carbon footprint in exports
– Joint promotion in China

Joint challenges for China and Lat Am
• Increase levels of bilateral trade and investment
– Improve dialogue on trade remedies.
– Transparency on SPS issues and health protocols
– NTB in line with WTO provisions
– Mechanisms for consultation, negotiation, mediation and arbitration to resolve commercial disputes
• Cooperation on the global agenda
– Reform the international monetary system and international financial regulation
– Climate change
– Early warning and policy coordination against threats of international economic crisis
– South-South cooperation mechanisms in preventing financial impacts, preventing contagion and preserving trade flows.

Advancing an agenda for China-Latam cooperation
• Strengthening S-S dialogue on issues of the global agenda
– International monetary system reform
– Climate Change
• Increasing Trade
– Transparency on SPs and sanitary protocols
– NTB in line with WTO provisions
– Arbitrations and negotiated settlements to avoid excessive AD accusations
• Fostering reciprocal investments
• Diversifying Trade (Chinese fund for LA X diversification)
– Traceability in natural resource exports
– Food safety and sustainable agriculture
– Reducing carbon in exports
– Tech standards, quality certifications
• Fostering reciprocal investments
– Regional portal on Investment opportunities
– Attract Chinese investors to invest in LA infrastructures
– Support LA investment in China and Asia Pacific (CCPIT may help)
• Working for a China-Latin America Summit

Latin America’s Challenges
• Diversify Exports
• Invest in China
• Participate in Asian supply value
chains
• Coordinated policy on China
• Work towards a China-Latin America
Summit.
China’s Challenges
• Increase FDI in Latin America
• Funds to support SMEs exporters
• Technological Cooperation
• Understand political-institutional
aspects of Latin America
Joint Challenges
• Improve dialogue between ministries of
trade (trade remedies)
• Identify joint opportunites in China, Asia
and Latin America
• Trade, investment and technological
business partnerships
• Create a forum for an ongoing dialogue
• Cooperation on issues of the global
agenda

45
How to deal with these challenges?
Please, read it.