CHINA OVERVIEW Department of Education and Early Childhood Development Victorian Group Jane Wallis,...
51
CHINA OVERVIEW Department of Education and Early Childhood Development Victorian Group Jane Wallis, Trade Commissioner Shen Xiuyun
-
Upload
jack-terry -
Category
Documents
-
view
217 -
download
0
Transcript of CHINA OVERVIEW Department of Education and Early Childhood Development Victorian Group Jane Wallis,...

CHINA OVERVIEWDepartment of Education and Early Childhood Development Victorian Group
Jane Wallis, Trade Commissioner
Shen Xiuyun

Austrade
• The Australian Trade Commission (Austrade) is the Australian Government’s trade and investment development agency
• Austrade delivers a comprehensive suite of international business services to Australian companies entering and expanding in overseas markets and to potential buyers and foreign investors from overseas markets
• As at 13 September 2010, Trade Minister is Dr Craig Emerson

Austrade - worldwide

Austrade’s China network
Virtual industry teams to share intelligence, focus operations and develop the business environment
• 14 offices
• 100 staff
• 10 industry teamsAgribusiness
Auto & Advance ManufacturingBuilding & Construction
Clean Energy & EnvironmentConsumer & Creative
EducationFood & Beverage
ICT, Health & BiotechMining & resources
Services
• Strong local market knowledge
• Industry specialists
• Extensive contacts

Transfer of marketing & promotion functions
• From 1 July 2010, marketing and promotion of Australian education transferred from AEI to Austrade
• Austrade: Marketing and Promotion• AEI: Policy• Departmental change but no overall difference• Cross- industry value

Austrade: A new but familiar China team
Jane WallisTrade Commissioner,
Beijing
China Education Leader
North China Liu Zhen
Vacant
East China Vivian Zhao Molly Liu Lily Wu
South China Jeffrey Yang
Iris ZhangJoie Liang
Shen XiuyunTeam Coordinator
(Beijing based)

China overview

Australian trade with China
Australian trade with China
• Total trade valued at A$83 billion 2008-9 (30% increase over previous year)
• Australia was China’s 7th largest supplier of goods and services in 2009
• Australia was China’s 11th largest buyer of goods and services in 2009
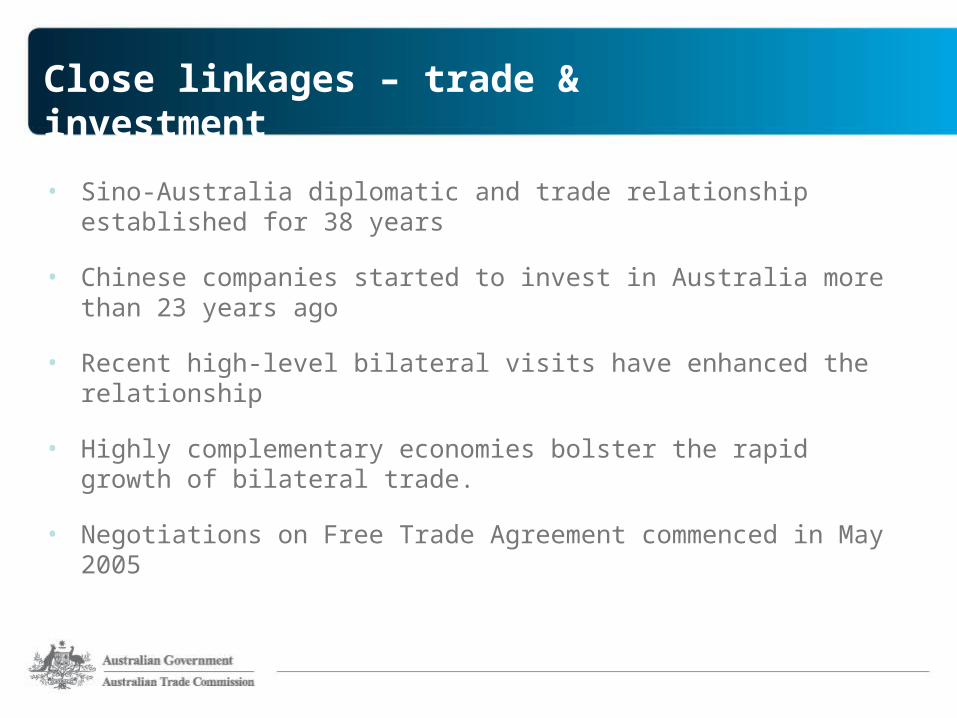
• Sino-Australia diplomatic and trade relationship established for 38 years
• Chinese companies started to invest in Australia more than 23 years ago
• Recent high-level bilateral visits have enhanced the relationship
• Highly complementary economies bolster the rapid growth of bilateral trade.
• Negotiations on Free Trade Agreement commenced in May 2005
Close linkages – trade & investment

Remarkable Growth
Over the past three years … • China’s per capita GDP grew by an estimated 40%• China added about 20,000 kilometres of new railway lines and
expressways• Annual auto production rose 56% to reach nearly 14 millions
units last year, surpassing the US (1,200 new cars/ day in Beijing)
• Successfully navigated its way through global financial crisis – GDP growth 8.7% in 2009

August 17 2010
China’s steady climb
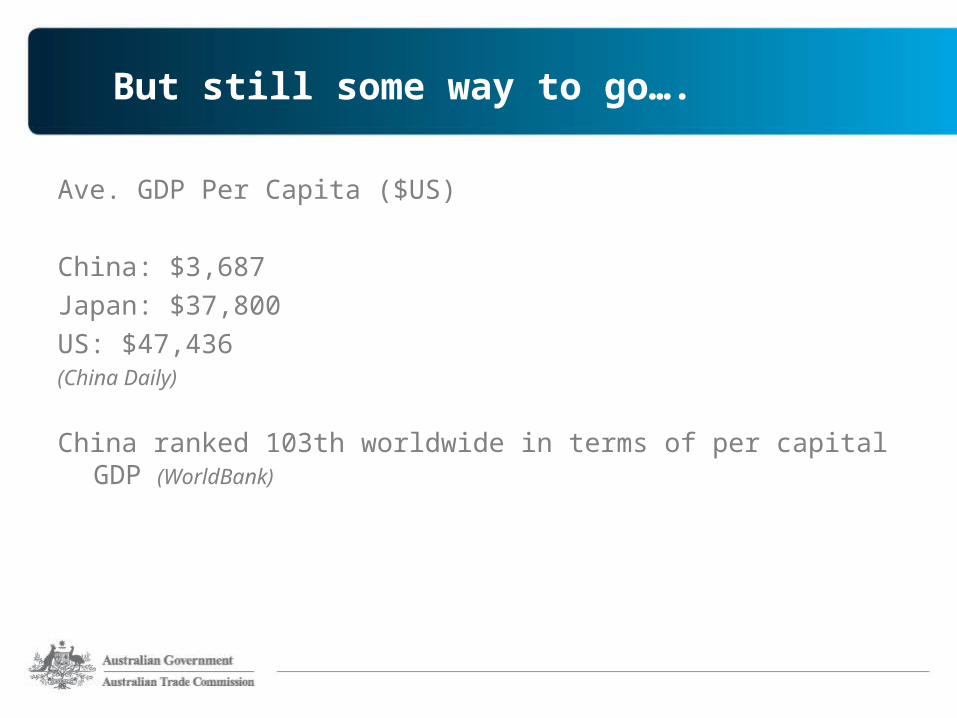
But still some way to go….
Ave. GDP Per Capita ($US)
China: $3,687
Japan: $37,800
US: $47,436(China Daily)
China ranked 103th worldwide in terms of per capital GDP (WorldBank)

Fast facts…
• Inner Mongolia has recorded the fastest growth rate for the last seven years, grew by 17%
• Ordos, a city of 1.5 million in inner Mongolia, recorded a per capita GDP of US$ 15,000
• Between 2001 and 2008, China’s expressways more than trebled in length to 60,000 km, equal to those of Canada, Germany and France combined
• By 2012, China’s high-speed railway is expected to amount for 50% of the world’s total length
• China built 6 major airports in 2009, bringing the national total to 166• Under current planning, there will be 244 airports in China by 2020, with
over 80% of China’s 1.3 billion people living within 100 km of an airport

GDP Growth
…
Dragonomics, China Economic Outlook Feb 2009
GDP Growth

Perspective - GDP growth of IMF advanced economies
Source: National Agencies.
Per cent
Note: The above graph includes 24 of the 33 IMF advanced economies. Those excluded include Slovenia, Iceland, Slovak Republic, Denmark, Ireland, Luxembourg, Israel, Cyprus and Austria, who all reported negative growth of between -0.8 per cent and -9.2 per cent.
Australia’s economy grew during the worst of the crisis.
-10
-8
-6
-4
-2
0
2
Finla
nd
Taiw
an Italy
Japa
n
Swed
en
Germ
any
Unite
d Ki
ngdo
m
Neth
erla
nds
Euro
Are
a
Czec
h Re
publ
ic
Spain
Belg
ium
Unite
d St
ates
Portu
gal
Hong
Kon
g SA
R
Singa
pore
Cana
da
Fran
ce
Switz
erlan
d
Norw
ay
Kore
a
New
Zeala
nd
Gree
ce
Aust
ralia
(Through the year GDP growth – June 2009)

Government stimulus
Central government public investment 2009 Rmb bn
%
Infrastructure (roads, rail, airports, ports) 231.7 25.5
Rural infrastructure 208.1 22.9
Earthquake reconstruction 130.0 14.3
Social services 71.3 7.9
Green projects 68.0 7.5
Other key projects 65.0 7.2
Affordable housing 49.3 5.4
Innovation & technology 45.2 5.0
Other social investment 39.4 4.3
Total 908.0 100

The numbers tell the story
• 1.4 billion people• 700-800 million peasants• 150m aspiring middle class• 50m middle class• 14m engineers• 140k lawyers• 33 cities over 2 million• $US1.4 trillion in reserves

By 2025:• 350 million people will be added to urban population
• 1 billion people will live in China’s cities by 2030
• 8 mega-cities will emerge by 2025 (Beijing, Shanghai, Guangzhou, Tianjin, Shenzhen, Chongqing, Chengdu, Wuhan)
• 221 Chinese cities will have 1 million +
• 5 billion square meters of road will be paved
• 170 mass-transit systems could be built
• 5 million buildings - 40 billion sqm of floor space
• GDP will increase 5 times
• China has to raise its nuclear power capacity to 75 million megawatts (mW) by 2020, eight times that of the current 9.08 million mW capacity, to offset the pressure of emission reduction. (source NDRC)
Source: McKinsey Global Institute 2008

China Economic Review © 2010
Largest cities by population, 2008
MillionLand area(sq km)
1 Chongqing 28.39 7,152
2 Shanghai 18.88 5,299
3 Beijing 16.95 12,484
4 Tianjin 11.76 7,418
5 Chengdu (Sichuan) 11.25 2,177
6 Guangzhou (Guangdong) 10.18 3,718
7 Nanyang (Henan) 9.95 2,722
8 Harbin (Heilongjiang) 9.90 4,272
9 Fuyang (Anhui) 9.88 1,749
10 Shijiazhuang (Hebei) 9.55 456
11 Handan (Hebei) 9.28 2,226
12 Xuzhou (Jiangsu) 9.46 1,038
13 Weifang (Shandong) 8.63 1575
14 Shenzhen (Guangdong) 2.28 1,953
15 Wuhan (Hubei) 8.33 8,494
16 Jining (Shandong) 8.23 905
17 Heze (Shandong) 9.14 1,415
MillionLand area(sq m)
18 Xinyang (Henan) 8.03 3,604
19 Hangzhou (Zhejiang) 7.97 4,272
20 Qingdao (Shandong) 7.62 1,411
21 Quanzhou(Fujian) 7.79 1,035
22 Wenzhou (Zhejiang) 7.65 1,187
23 Xi'an (Shaanxi) 8.38 3,547
24 Changchun (Jilin) 7.46 3,603
25 Nanchong (Sichuan) 7.49 2,527
26 Nanjing (Jiangsu) 7.41 3,495
27 Zhengzhou (Henan) 7.44 1,010
28 Tangshan (Hebei) 7.29 1,230
29 Maoming (Guangdong) 7.16 1,082
30 Shenyang (Liaoning) 7.76 4,723
31 Liu'an (Anhui) 7.02 3,583
32 Nanning (Guangxi) 6.92 1,799
33 Zhanjiang (Guangdong) 6.90 1,460
34 Fuzhou (Fujian) 6.36 2,121

MillionLand area(sq km)
35 Changsha (Hunan) 6.59 556
36 Yantai (Shandong) 6.52 2,722
37 Jingzhou (Hubei) 6.46 1,576
38 Luoyang (Henan) 6.54 544
39 Kunming (Yunan) 6.24 3,946
40 Suzhou (Anhui) 6.17 2,868
41 Suzhou (Jiangsu) 6.30 1,650
42 Changde (Hunan) 6.14 2749
43 Anqing(Anhui) 6.14 3,543
44 Dalian (Liaoning) 5.78 2,415
45 Jinan (Shandong) 6.04 3,257
46 Wuxi (Jiangsu) 6.24 1,623
47 Foshan (Guangdong) 3.64 3,848
48 Xiangfan (Hubei) 5.84 3,672
49 Yongzhou (Hunan) 5.83 3,177
50 Bozhou (Anhui) 5.76 2,226
51 Taizhou (Zhejiang) 5.74 1,536
MillionLand area(sq km)
52 Qiqihar (Heilongjiang) 5.69 4,310
53 Ningbo (Zhejiang) 5.68 2,560
54 Taian (Shandong) 5.46 2,087
55 Mianyang (Sichuan) 5.41 1,570
56 Huaian (Jiangsu) 5.34 3,171
57 Shantou(Guangdong) 5.07 1,956
58 Guilin(Guangxi) 5.08 1,254
59 Luzhou (Sichuan) 4.94 2,155
60 Hefei (Anhui) 4.87 1,490
61 Jiujiang(Jiangxi) 4.76 4,772
62 Kaifeng(Hennan) 4.84 1,460
63 Yiyang (Hunan) 4.70 1,935
64 Yangzhou (Jiangsu) 4.60 980
65 Nanchang (Jiangxi) 4.95 617
66 Zibo (Shandong) 4.21 2,970
67 Shaoxing(Zhejiang) 4.37 874
68 Jilin (Jilin) 4.33 3,636China Economic Review © 2010
Largest cities by population, 2008

Spending power on the rise
Source: The McKinsey Quarterly 2006 special edition: Serving the Chinese consumer

Life expectancy
Male Female Combined
1950-1955 39.3 42.3 40.8
1955-1960 43.1 46.2 44.6
1960-1965 48.7 50.4 49.5
1965-1970 58.8 60.4 59.6
1970-1975 62.5 63.9 63.2
1975-1980 64.5 66.3 65.3
1980-1985 65.5 67.8 66.6
1985-1990 65.8 68.4 67.1
1990-1995 66.5 70.0 68.1
1995-2000 67.8 71.9 69.7
2000-2005 69.8 73.3 71.5
2005-2010 70.8 74.3 71.9
Male Female Combined
2010-2015* 71.3 75.5 73.3
2015-2020* 71.7 76.2 73.8
2020-2025* 72.2 76.9 74.4
2025-2030* 73 77.7 75.3
2030-2035* 74 78.6 76.2
2035-2040* 74.9 79.4 77.1
2040-2045* 75.8 80.2 78.0
2045-2050* 76.6 80.9 78.7
* Projected
Source: UNPD
China Economic Review © 2010

1.4 1.7 2.7 3.0 3.31.53.7
9.6
18.2
26.8
52.2
2003 2004 2005 2006 2007 2008
M&A
Organic
Source: Dealogic; McKinsey; J.P.Morgan
2.95.4
12.3
21.2
30.1
(US$b)
52.2
Growing Chinese outbound FDI
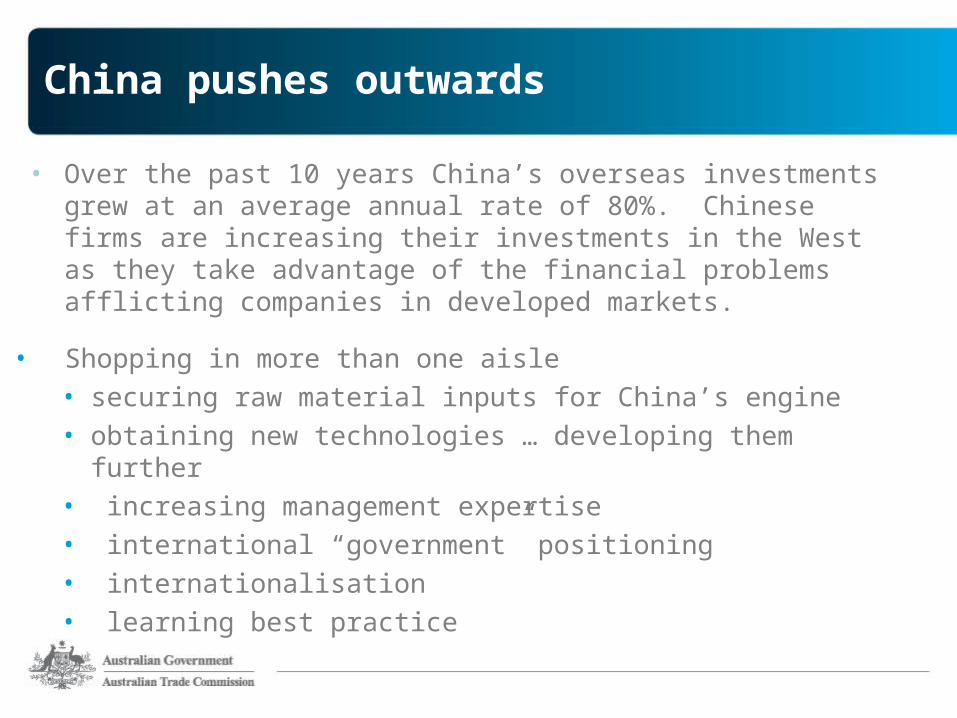
China pushes outwards
• Shopping in more than one aisle• securing raw material inputs for China’s engine• obtaining new technologies … developing them further• increasing management expertise• international “government” positioning• internationalisation• learning best practice
• Over the past 10 years China’s overseas investments grew at an average annual rate of 80%. Chinese firms are increasing their investments in the West as they take advantage of the financial problems afflicting companies in developed markets.

Doing business in China

Culture
•Culture can be likened to an iceberg.
• Difficult to understand the behaviour of people from different cultures as we rarely know the core values and beliefs which are below the surface.
• We usually interpret observable behaviour based on our own values and beliefs.

"The Chinese parties don’t understand in sufficient depth the different legal systems to which they are exposed when they invest outside China."
Mr McCubbin, Partner Decons. who recently returned from speaking at a SASAC conference in Beijing speaking on the chairman of SASAC’s view that legal risk was the greatest challenge facing state-owned enterprises
The Australian Feb 16 2010
“The only way to increase the chances of agreements proceeding (with the Chinese) was to focus on relationship-building, not fixating on legal concerns. We are more into due diligence in terms of legal matters but not in terms of due diligence of relationships - what the Chinese call guanxi”
Samir Ranjan Chatterjee, Curtin University of Technology Professor of International Management
Sydney Morning Herald Feb 16 2010
"If Comrade Mao Zedong was still alive, he wouldn’t put up with this kind of thinking." Chairman of CISA, Wu Xichun, regarding the current (iron ore) talks:
The Australian, Feb 15 2010
"One person said to me he'd heard there were 200 million cane toads in Queensland and he'd take them all” John Burrey, United Game Processors, after returning from a 10-day visit to China, stating that demand for toad products was
overwhelming. Toads are prized in China not only for their value as traditional medicine but also for their meat.
Sydney Morning Herald Feb 16 2010
Cultural is still very relevant today

Rules of thumb
• Research and advice• Conservative estimates• Sound commercial practice• Good business ethics• Scepticism• Risk mitigation• Partnerships • Adaptability

Education Update

China Education System
School Education System:
• Regular Education• Adult Education
Computer-based Network Education System
Industries (Enterprises) Education System
Social Education System

China Education System
Pre-school Education• Kindergaten, Pre-school classes
Primary Education
Secondary Education• Junior High School – Regular Junior High School
- Comprehensive Junior High School - Vocational Junior High School
• Senior High School - Regular Senior High School - Comprehensive Senior High School - Vocational Senior High School
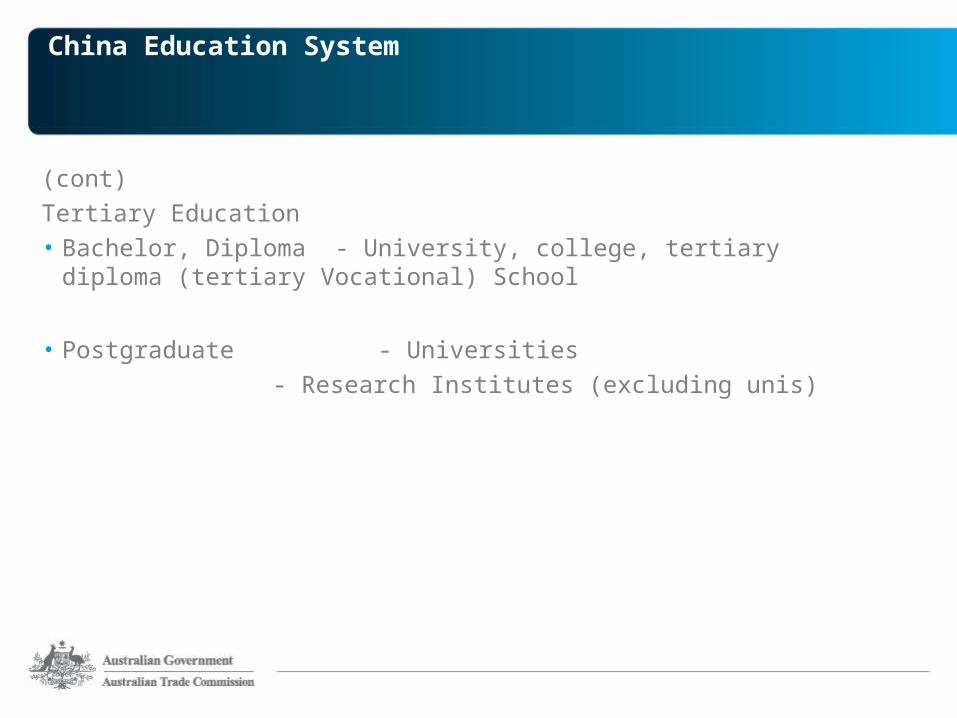
China Education System
(cont)Tertiary Education• Bachelor, Diploma - University, college, tertiary diploma (tertiary
Vocational) School
• Postgraduate - Universities - Research Institutes (excluding unis)

China Education System
Primary Education – Adult Primary education including anti-illiteracy programs
Secondary Education- Adult Secondary Education
Tertiary Education – Radio & Television University - Schools for Employees and Farmers - Colleges for Cadre at administrative level (party &
politics) - Education colleges - Independent correspondence colleges - Night Universities, department of correspondence
education
Non-award Education & Training and Continued Education

Industries Education System & Social Education System
Industries (Enterprises) Education System• Pre and on-the-job training and rotation training
Social Education System• Library, museum, science museum mass media and etc• Community education: education in spare time (on holiday),
education for senior citizens and etc

Chinese Education Structure and Qualification Framework
Bachelor, Diploma
Postgraduate Universities
Research institutes (excluding unis)
University, college, tertiary diploma (tertiary vocational) school
Junior High School
Senior High School
Regular Junior High School
Comprehensive Junior High School
Primary School
Regular Senior High School
Vocational Junior High School
Comprehensive Senior High School
Vocational Senior High School
Kindergarten, Pre-school classes
Tertiary Education
Pre-school Education
Primary Education
Secondary Education

2009 International Enrolments in Australia
Nationality 2002 2006 2007 2008 2009 08-09 Share
China 49,144 93,533 110,846 131,210 154,777 18% 24%
India 11,316 38,649 62,818 96,407 120,913 25% 19%
South Korea 18,558 30,861 34,230 35,133 35,708 2% 6%
Thailand 15,655 17,708 19,736 22,229 26,460 19% 4%
Nepal 1,506 2,670 9,076 18,002 24,579 37% 4%
Viet Nam 4,078 6,711 9,626 15,844 23,755 50% 4%
Malaysia 17,459 19,029 19,732 21,091 23,103 10% 4%
Indonesia 20,957 14,885 14,776 15,975 17,867 12% 3%
Brazil 4,216 10,086 12,433 15,899 17,529 10% 3%
Saudi Arabia 125 1,864 3,631 7,788 12,599 62% 2%
Others 130,705 143,957 153,171 161,566 174,645 8% 28%
Totals 273,719 379,953 450,075 541,144 631,935 17%

2009 China – Enrolments (by sector)
Sector 2002 2006 2007 2008 2009 2008-09
Higher Education 16,149 46,772 49,778 53,590 64,406 20%
Vocational 6,059 15,524 19,801 26,548 33,796 27%
Schools 9,794 9,837 11,439 13,679 12,593 -8%
English 14,709 17,915 25,761 31,635 36,114 14%
Non-Award 2,433 3,485 4,067 5,758 7,868 37%
Totals 49,144 93,533 110,846 131,210 154,777 18%

Sector 2002 2006 2007 2008 2009 2008-09
Higher Education 9,742 18,961 19,666 23,472 30,235 29%
Vocational 4,173 8,651 11,196 15,771 19,326 23%
Schools 5,821 4,316 6,076 6,972 5,523 -21%
English 10,957 13,660 20,566 24,768 28,552 15%
Non-Award 1,715 2,150 2,867 4,210 5,664 35%
Totals 32,408 47,738 60,371 75,193 89,300 19%
2009 China – Commencements (by sector)
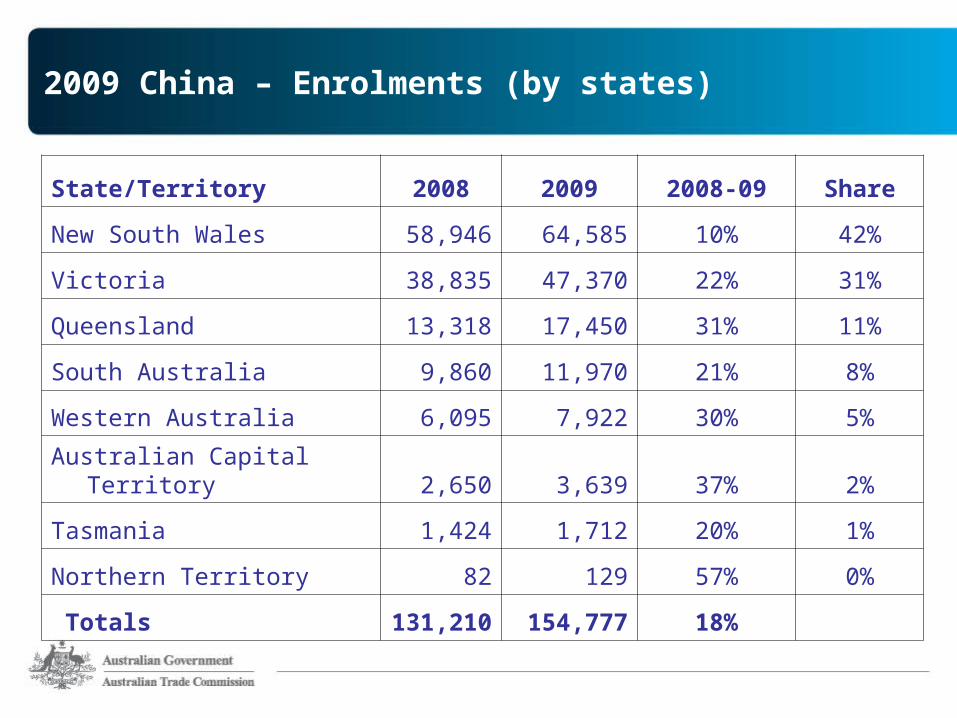
State/Territory 2008 2009 2008-09 Share
New South Wales 58,946 64,585 10% 42%
Victoria 38,835 47,370 22% 31%
Queensland 13,318 17,450 31% 11%
South Australia 9,860 11,970 21% 8%
Western Australia 6,095 7,922 30% 5%
Australian Capital Territory 2,650 3,639 37% 2%
Tasmania 1,424 1,712 20% 1%
Northern Territory 82 129 57% 0%
Totals 131,210 154,777 18%
2009 China – Enrolments (by states)

NationalityYTD July
2009YTD July
2010
Growth on YTD July
09
Share of all nationali
ties
China 133,920 149,049 11.3% 27.3%
India 103,584 88,297 -14.8% 16.2%
Republic of Korea 30,791 29,591 -3.9% 5.4%
Vietnam 19,762 23,038 16.6% 4.2%
Malaysia 22,150 22,421 1.2% 4.1%
Other Nationalities 232,094 233,018 0.4% 42.7%
All Nationalities 542,301 545,414 0.6% 100%
Latest Data on Enrolments (YTD July 10)

Current Challenges and opportunities

• Australia is losing market share in China;• Australia was estimated with a loss of between 10%
and 20% of its market share over the last six months;• Other major competitors are enjoying growth to various
degrees, even some Asian countries;• The USA is expanding its market share rapidly in China
Several Key Points for China Market

• Canada will be strengthening its position, and UK is holding its approximate position in the market;
• Top Australian universities are comparatively still popular, as Chinese students would choose high-end institutes like Go8 instead of those low-ranking unis and VET institutes;
Several Key Points:

Challenges for Study in Australia
Key causes behind Australia’s loss of market share
Soaring costsNarrowed migration pathway (new SOL) Institution closures Limited Scholarship ProgramsMore rigorous entry requirementsVisa difficulties

China’s study abroad market is continually growing Australia remains one of the leading studying abroad
destinations More matured and better regulated study abroad
market in China Transnational education
Opportunities for Australian Education Providers

Austrade activities
Chinese Government-Led CIEET and CEE - National level- CIEET (Mar) and CEE (Oct)
- Provincial level
Agent-led Exhibitions Run by MoE-licensed agents
Australian Government-led exhibitions Education exhibitions/road shows run by Austrade and some states
Category of Education Exhibitions in China

Importance of Education Agents
• The majority of Chinese students (over 70%) planning to
study overseas tend to resort to agents
• Australian providers rely heavily on the big agents in
recruitment and other market activities
Working with Education Agents

Licensed Agents in Mainland China
0
50
100
150
200
250
300
Beijing Shanghai Guangzhou
MoE Agents
Evisa Agents
258
55
82
31
57
14
Working with Education Agents

China planning
• Strategic planning – Qingdao
• Close cooperation with AEI
• Meeting/updating companies/institutions
• Market information package
• Media strategy
• Tailored services