Children's Services Committee
63
Children's Services Committee Date: Tuesday, 16 October 2018 Time: 10:00 Venue: Edwards Room, County Hall, Martineau Lane, Norwich, Norfolk, NR1 2DH Persons attending the meeting are requested to turn off mobile phones. Membership For further details and general enquiries about this Agenda please contact the Committee Officer: Mr D Collis Ms E Corlett Mr J Mooney Mr S Dark - Vice-Chairman Ms J Oliver Mr J Fisher Mr M Smith-Clare Mr R Hanton Mr B Stone Mr H Humphrey Ms S Squire Mr E Maxfield Mr V Thomson Church Representatives Mrs H Bates Mr P Dunning Nicola LeDain on 01603 223053 or email [email protected] Under the Council’s protocol on the use of media equipment at meetings held in public, this meeting may be filmed, recorded or photographed. Anyone who wishes to do so must inform the Chairman and ensure that it is done in a manner clearly visible to anyone present. The wishes of any individual not to be recorded or filmed must be appropriately respected. 1
Transcript of Children's Services Committee
Children's Services Committee
Date: Tuesday, 16 October 2018 Time: 10:00 Venue: Edwards Room, County Hall,
Martineau Lane, Norwich, Norfolk, NR1 2DH
Persons attending the meeting are requested to turn off mobile phones.
Membership
For further details and general enquiries about this Agenda
please contact the Committee Officer:
Mr D Collis
Ms E Corlett Mr J Mooney
Mr S Dark - Vice-Chairman Ms J Oliver
Mr J Fisher Mr M Smith-Clare
Mr R Hanton Mr B Stone
Mr H Humphrey Ms S Squire
Mr E Maxfield Mr V Thomson
Church Representatives
Mrs H Bates Mr P Dunning
Nicola LeDain on 01603 223053 or email [email protected]
Under the Council’s protocol on the use of media equipment at meetings held in public, this meeting may be filmed, recorded or photographed. Anyone who wishes to
do so must inform the Chairman and ensure that it is done in a manner clearly visible
to anyone present. The wishes of any individual not to be recorded or filmed must be
appropriately respected.
1

A g e n d a
1. To receive apologies and details of any substitute members attending
2. Minutes from the meeting held on Tuesday 11 September 2018. To follow.
3. Declarations of Interest If you have a Disclosable Pecuniary Interest in a matter to be considered at the meeting and that interest is on your Register of Interests you must not speak or vote on the matter. If you have a Disclosable Pecuniary Interest in a matter to be considered at the meeting and that interest is not on your Register of Interests you must declare that interest at the meeting and not speak or vote on the matter In either case you may remain in the room where the meeting is taking place. If you consider that it would be inappropriate in the circumstances to remain in the room, you may leave the room while the matter is dealt with. If you do not have a Disclosable Pecuniary Interest you may nevertheless have an Other Interest in a matter to be discussed if it affects - your well being or financial position - that of your family or close friends - that of a club or society in which you have a management role - that of another public body of which you are a member to a greater extent than others in your ward. If that is the case then you must declare such an interest but can speak and vote on the matter.
4. Any items of business the Chairman decides should be considered as a matter of urgency
5. Public QuestionTime Fifteen minutes for questions from members of the public of which due notice has been given. Please note that all questions must be received by the Committee Team ([email protected]) by 5pm Thursday 11 October 2018. For guidance on submitting a public question, view the Constitution at www.norfolk.gov.uk/what-we-do-and-how-we-work/councillors-meetings-decisions-and-elections/committees-agendas-and-recent-decisions/ask-a-question-to-a-committee
6. Local Member Issues/ Member Questions Fifteen minutes for local member to raise issues of concern of which due notice has been given. Please note that all questions must be received by the Committee Team ([email protected]) by 5pm on Thursday 11 October 2018.
2
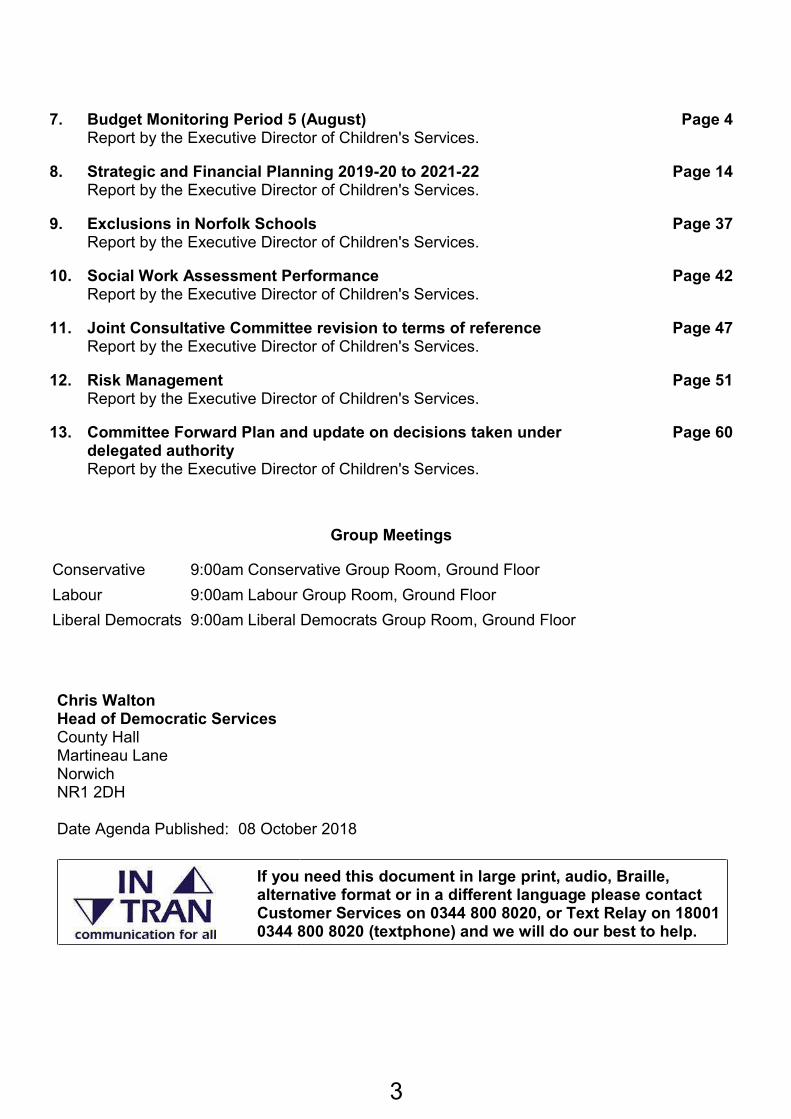
7. Budget Monitoring Period 5 (August) Report by the Executive Director of Children's Services.
Page 4
8. Strategic and Financial Planning 2019-20 to 2021-22 Report by the Executive Director of Children's Services.
Page 14
9. Exclusions in Norfolk Schools Report by the Executive Director of Children's Services.
Page 37
10. Social Work Assessment Performance Report by the Executive Director of Children's Services.
Page 42
11. Joint Consultative Committee revision to terms of reference Report by the Executive Director of Children's Services.
Page 47
12. Risk Management Report by the Executive Director of Children's Services.
Page 51
13. Committee Forward Plan and update on decisions taken under delegated authority Report by the Executive Director of Children's Services.
Page 60
Chris Walton Head of Democratic Services County Hall Martineau Lane Norwich NR1 2DH Date Agenda Published: 08 October 2018
If you need this document in large print, audio, Braille, alternative format or in a different language please contact Customer Services on 0344 800 8020, or Text Relay on 18001 0344 800 8020 (textphone) and we will do our best to help.
Group Meetings
Conservative 9:00am Conservative Group Room, Ground Floor
Labour 9:00am Labour Group Room, Ground Floor
Liberal Democrats 9:00am Liberal Democrats Group Room, Ground Floor
3

Children’s Services Committee
Item No……
Report title: Budget Monitoring Period 5 (August)
Date of meeting: 16 October 2018
Responsible Chief Officer:
Sara Tough Executive Director of Children’s Services
Strategic impact The report sets out the Period 5 (August) financial forecast for Children’s Services, and the programme of transformation and improvement that is continuing.
Executive summary This report sets out:
the financial resources to deliver the Safer Children and Resilient Families Strategy of Norfolk Futures.
forecast revenue expenditure for 2018/19
Recommendations: That the Committee considers, comments and notes: (i) the forecast overspend of £3.958m for General Fund Children’s Services (ii) the forecast use of Children’s Services General Fund reserves and provisions (iii) the forecast overspend of £6.389m for Dedicated Schools Grant Children’s
Services that will need to be offset by a. £4.268m against DSG balances and recovered in future years b. £2.121m against the General Fund
(iv) the amendments to and reprofiling of the Children’s Services Capital Programme
1. Service Summary 1.1 The Budget Monitoring reports for Period 4 (as at the end of July 2018) to
Children’s Services Committee have provided details of the national and local context for Norfolk’s Children’s Services. The context includes the service’s purpose, the financial resources available (NCC General Fund and Dedicated Schools Grant), pressures faced, and transformation work being undertaken to manage these pressures for the medium to longer term.
1.2 As the financial year progresses, these circumstances and pressures still remain.
Whilst the work to transform services is progressing to manage these pressures for the medium to longer term, as separately reported to Children’s Services Committee in September 2018, the financial pressures in the short term remain.
2. Forecast Revenue Outturn General Fund Children’s Services 2.1 An overspend of £3.958m is currently forecast for General Fund Children’s
Services. This is a mid-case forecast based upon the information currently available and after taking account of the anticipated impact of identified management actions to address pressures. Table 1 displays the overall forecast position as at the end of August (Period 5).
4

Ta le : Fore ast Reve ue Outtur Childre ’s Servi es Ge eral Fu d
Budget Current
Forecast Variance to Budget
Variance to P4
P5 £m £m % £m
Social Work 86.214 91.666 5.452 6.3% 0.617
Early Help & Prevention 25.299 25.186 (0.113) -0.4% 0.000
Performance & Challenge 5.486 5.574 0.088 1.6% 0.008
Education 39.422 40.364 0.942 2.4% 0.260
Resources (including capital charges) 29.527 29.527 0.000 0.0% 0.000
Sub-total 185.948 192.317 6.369 3.4% 0.885
Use of Reserves (0.411) (0.411) (0.211)
Schools capital funded by borrowing (2.000) (2.000) 0.000
NCC General Fund Total 185.948 189.906 3.958 3.4% 0.674
2.2 Significant areas of financial pressure remain within Social Work. These are
primarily driven by spend on placements (Children Looked After, Staying Put and Leaving Care) and staffing costs. Within Education Services the pressures are primarily transport and assessment of special educational needs.
2.3 Early in the year, a stabilisation of Children Looked After placements was seen
and it was expected that the original planned trajectory would be achieved by the end of the financial year. As the year has progressed, this position continues to be reviewed using more detailed transformation planning and demand information, and this has resulted in a forecast £1.365m overspend. This is a complex area to forecast, with continuous changes to the children and young people who are looked after and changes to placements to ensure that their needs are being met. The variance of £0.356m compared to prior reporting is due to a multitude of relatively small changes, alongside a review of the forecasts for those aged 18. The Directorate continues to be focused on an ambitious plan to implement transformational change at a fast pace; including aiming for more children to be able to return home where it is appropriate for them to do so and supporting more children in foster care placements rather than in residential placements.
2.4 The budget for Staying Put and Leaving Care is placement costs is £5.443m, and
is currently forecasting a £0.956m overspend, a minimal increase of £0.010m compared to the prior forecast. This reflects increasing numbers of care leavers compared to previous years, combined with insufficient funding from Central Government for the Staying Put initiative.
2.5 A single case of support for a child with disabilities requiring extensive nursing
support has led to a forecast £0.494m pressure on the £0.576m budget for children with extreme nursing needs.
2.6 The staffing budget for operational teams, including social work, early help and
independent reviewing officers, is £32.113m. There is currently a forecast pressure of £1.862m, a small increase of £0.076m compared to prior reporting. The pressure includes:
£0.107m for in-house residential unit staffing due to changes to in-house residential staffing levels necessitated to meet the complex needs of the young people being supported in these settings. This is a reduction of
5

(£0.147m) compared to prior reporting, due to lower than previously anticipated sickness cover costs.
£0.806m for Norfolk Institute of Practice Excellence (NIPE) salary costs for newly qualified social workers prior to placement in social work teams. These staff are provided with the opportunity to gain the experience, and provided with the appropriate supervision and support needed, to enable them to be placed in substantive roles.
(£0.353m) forecast underspend on agency social worker top-ups reflecting reduced reliance on agency staff.
£1.393m overspend within front line operational social work teams, due to the level of workload that is currently experienced. A reduction in throughput of workload from the ‘front door’ has been seen since the start of this year with changes made to the Multi Agency Safeguarding Hub (MASH). However, the number of children and young people already being supported at the edge of and within statutory services remains high. Reprofiling of the workforce, including the introduction of different roles and professions, is being undertaken. This is expected to enable the operational teams to manage within their base budget once complete. This work has been delayed due to the desire to get it right first time. Breckland Locality has been recruiting to vacancies in line with this reprofiling as an opportunity to gain proof of concept.
2.7 The budget provides £3.310m for legal costs. There is currently a forecast
pressure of £0.750m due to the high level of court proceedings, an increase of £0.150m compared to the previous forecast. This forecast includes the expected impact of the increased focus on managing spend in this area, including ensuring legal resource is not used for elements of case preparation that can be carried out more efficiently by other teams. However, there is an increased level of proceedings being experienced by most Children’s Services Authorities, and Norfolk is no different. The level of proceedings commenced this year are significantly higher compared to both 2017-18, when the budget was set. Feedback received suggests that the complexity of work is increasing. This reflects the additional number of children that are currently looked after. The forecast has been reviewed accordingly.
2.8 The forecast overspend for Education Services reflects pressures on special
school transport, due to the numbers of children requiring transport to school places. The other primary pressure is the assessment of costs for children with special educational needs. There is a high level of demand for Education Health and Care Plan (EHCP) assessment being received by the authority and a backlog of assessments is outstanding. Action is being taken to manage this level of referrals and nearly 40% of referrals do not result in an EHCP. It is a statutory duty to make these assessments where a referral has taken place. Smaller variations to budget include: £0.270m pressure in relation to vacant school property costs; a review of the profiling of contributions towards the PFI resulting in a one-off under-spend of (0.250m); and, forecast additional income for the School Attendance team of (£0.189m) following increases in penalty charges for pupils missing school.
2.9 Careful monitoring of the position continues, with improvements made to
arrangements for placements panels, performance information available to managers and closer scrutiny of plans for children to return home or to move from one placement type to another.
A number of approaches are being pursued:
6

A recruitment drive and marketing for in-house fostering (placement numbers have increased since the start of 2018-19);
Developing supported semi-independent accommodation, with initial development expected to be completed within this financial year;
Further improving how the Multi Agency Service Hub (MASH) and the front door to Children’s Services operate (the number of cases flowing through from MASH to assessment teams has seen a downward trend following implementation of early changes);
Redesigning social work teams to improve administration and to make the best use of professional resources;
Continuing emphasis on early help and preventative services;
Expansion of the boarding school placement model in appropriate cases. 2.10 A further in-depth review of reserves, grants, contributions and provisions has
been undertaken following a high-level review last at Period 4. This has identified an additional (£0.211m) available that can be released; a total of (£0.411m).
2.11 The capital programme was reviewed at Period 4 with a view to maximising
service revenue funding. £2m of planned revenue contributions in 2018/19 will instead be funded by borrowing.
2.12 The significant forecast variances to budget are summarised within Table 2,
alongside the movement in forecast compared to Period 4 (reported period to this Committee in September)
Table 2: Forecast Significant Revenue Outturn Variances General Fund
Childre ’s Servi es
Expenditure Budget
Variance over(+)/under Primary Reason
£m £m
Children Looked After placements 41.777 1.365 Number of children
accommodated and the complexity of need
Leaving Care and Staying Put 4.424 0.956 Number of young
people in excess of funding provided
Legal costs 3.310 0.750 Number and
complexity of proceedings
Children with disabilities placements
0.576 0.494 Extensive nursing
support
Social Work, Early Help, and Independent Reviewing Officers staffing costs
32.113 1.862 Additional staffing due
to workloads
Home to School, Special School and Post 16 College Transport
29.082 0.441 Number of children requiring transport
Assessment of Special Educational Needs
2.868 0.580 Statutory duty to meet
high level of demand
Vacant School Properties 0.000 0.270 Security costs
PFI Reserve contribution 0.220 (0.160) Reduced contribution
7

School Attendance team 0.376 (0.189) Increased penalty
charge income
Other 71.202 0.000
Use of Reserves (0.411)
Schools capital funded by borrowing
(2.000)
Total 185.948 3.958
3. Forecast Reserves and Provisions General Fund Children’s Services 3.1 Projected changes to Children’s Services General Fund reserves and provisions
are set out in the table below:
Table 3: Forecast Reserves a d Provisio s Ge eral Fu d Childre ’s Servi es
Reserve or provision
Balance April 2018
Net Movement Increase /
(Decrease)
Forecast Balance March
2019
£m £m
Transport days equalisation 0.494 (0.081) 0.413
Holiday pay provision 0.015 (0.015) 0.000
Repairs and renewals fund 0.147 (0.136) 0.011
Information Technology earmarked reserve
0.030 (0.024) 0.006
Post-OFSTED improvement fund 0.004 (0.004) 0.000
Grants and contributions 3.063 (1.906) 1.157
Totals 3.753 (2.166) 1.587
3.2 Of the £1.906m of grants and contributions that are forecast to be used by the
end of this financial year, approximately half were set aside to fund Children’s Centres in this financial year. The remainder of the funds are for a large number of differing purposes primarily received on a one-off basis across Education and Social Work.
3.3 The Transport Days Equalisation reserve is to enable each year’s transport
budget to reflect an average year, with the variation in the number of academic days in each financial year being taken account of by this reserve. In 2018-19 it is expected that there will be a small use of this reserve in line with its purpose. The remainder of the reserve is expected to be required for 2019-20, in line with its purpose.
3.4 The forecast in-year usage of the reserves and provisions includes £0.177m
released that are no longer needed for the purposes originally identified. This release offsets the overall forecast position and contributes to the (£0.411m) shown in table 1 earlier in this report. The remainder of the (£0.411m) has been identified from a review of creditors that are no longer required.
4. Forecast Revenue Outturn Dedicated Schools Grant Children’s Services 4.1 An overspend of £6.389m is currently forecast for Dedicated Schools Grant
Children’s Services as shown in table 4 below; this is a mid-case forecast. The
8
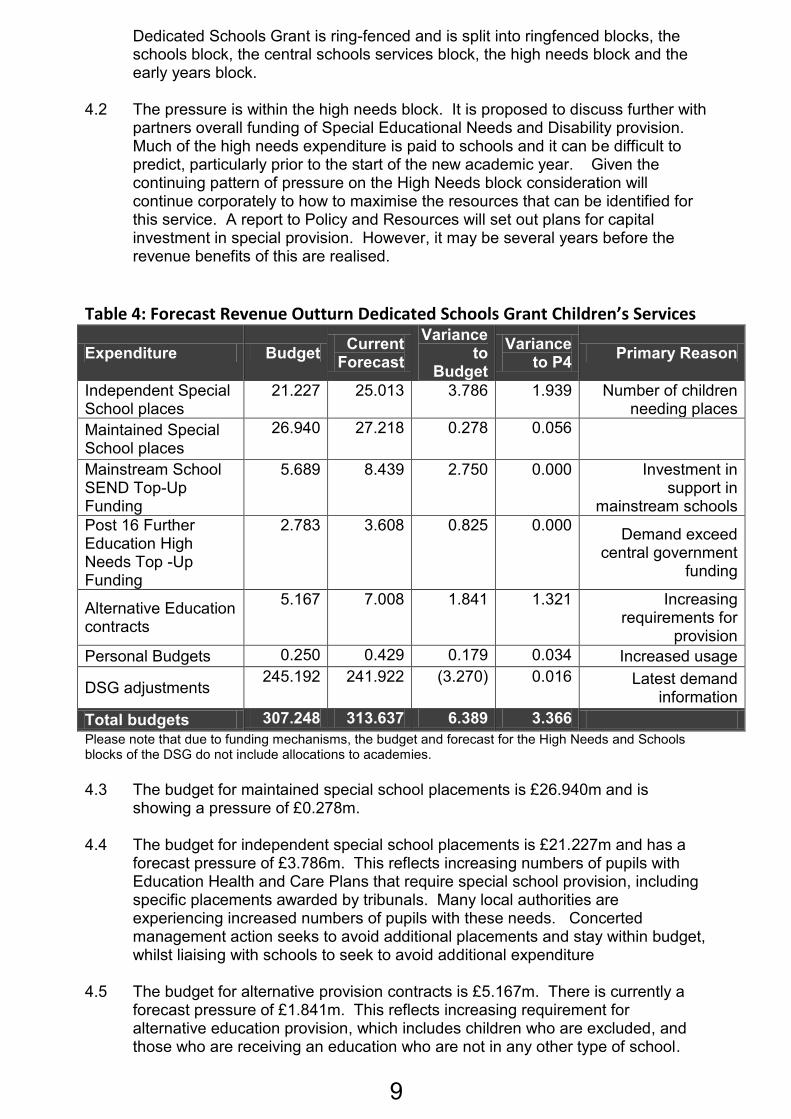
Dedicated Schools Grant is ring-fenced and is split into ringfenced blocks, the schools block, the central schools services block, the high needs block and the early years block.
4.2 The pressure is within the high needs block. It is proposed to discuss further with
partners overall funding of Special Educational Needs and Disability provision. Much of the high needs expenditure is paid to schools and it can be difficult to predict, particularly prior to the start of the new academic year. Given the continuing pattern of pressure on the High Needs block consideration will continue corporately to how to maximise the resources that can be identified for this service. A report to Policy and Resources will set out plans for capital investment in special provision. However, it may be several years before the revenue benefits of this are realised.
Table 4: Forecast Revenue Outturn Dedicated Schools Grant Childre ’s Servi es
Expenditure Budget Current
Forecast
Variance to
Budget
Variance to P4
Primary Reason
Independent Special School places
21.227 25.013 3.786 1.939 Number of children needing places
Maintained Special School places
26.940 27.218 0.278 0.056
Mainstream School SEND Top-Up Funding
5.689 8.439 2.750 0.000 Investment in support in
mainstream schools
Post 16 Further Education High Needs Top -Up Funding
2.783 3.608 0.825 0.000 Demand exceed
central government funding
Alternative Education contracts
5.167 7.008 1.841 1.321 Increasing requirements for
provision
Personal Budgets 0.250 0.429 0.179 0.034 Increased usage
DSG adjustments 245.192 241.922 (3.270) 0.016 Latest demand
information
Total budgets 307.248 313.637 6.389 3.366 Please note that due to funding mechanisms, the budget and forecast for the High Needs and Schools blocks of the DSG do not include allocations to academies.
4.3 The budget for maintained special school placements is £26.940m and is
showing a pressure of £0.278m. 4.4 The budget for independent special school placements is £21.227m and has a
forecast pressure of £3.786m. This reflects increasing numbers of pupils with Education Health and Care Plans that require special school provision, including specific placements awarded by tribunals. Many local authorities are experiencing increased numbers of pupils with these needs. Concerted management action seeks to avoid additional placements and stay within budget, whilst liaising with schools to seek to avoid additional expenditure
4.5 The budget for alternative provision contracts is £5.167m. There is currently a
forecast pressure of £1.841m. This reflects increasing requirement for alternative education provision, which includes children who are excluded, and those who are receiving an education who are not in any other type of school.
9
The pressure has increased following a review in August of the full 2017-18 academic year spend, where a significant increase in the provision required was seen during the summer term compared to trends seen earlier in the year.
4.6 The budget for personal budgets is £0.250m. There is currently a forecast
pressure of £0.179m. This reflects an increase in the number of personal budgets requested as an alternative to high cost placements.
4.7 The budget for Post 16 Further Education High Needs Provision is £5.517m.
There is currently a forecast pressure of £0.825m. This reflects demand for placements exceeding the funding provided by central government.
4.8 It is proposed to look at the DSG outturn in its totality at the end of 2018/19. It is
expected that there will be flexibility to meet an element of the forecast High Needs overspend by underspending on other blocks including the Schools Block or the Early Years block; a high-level assumption based upon current demand trends is included in the forecast. This position will be reviewed as the year progresses.
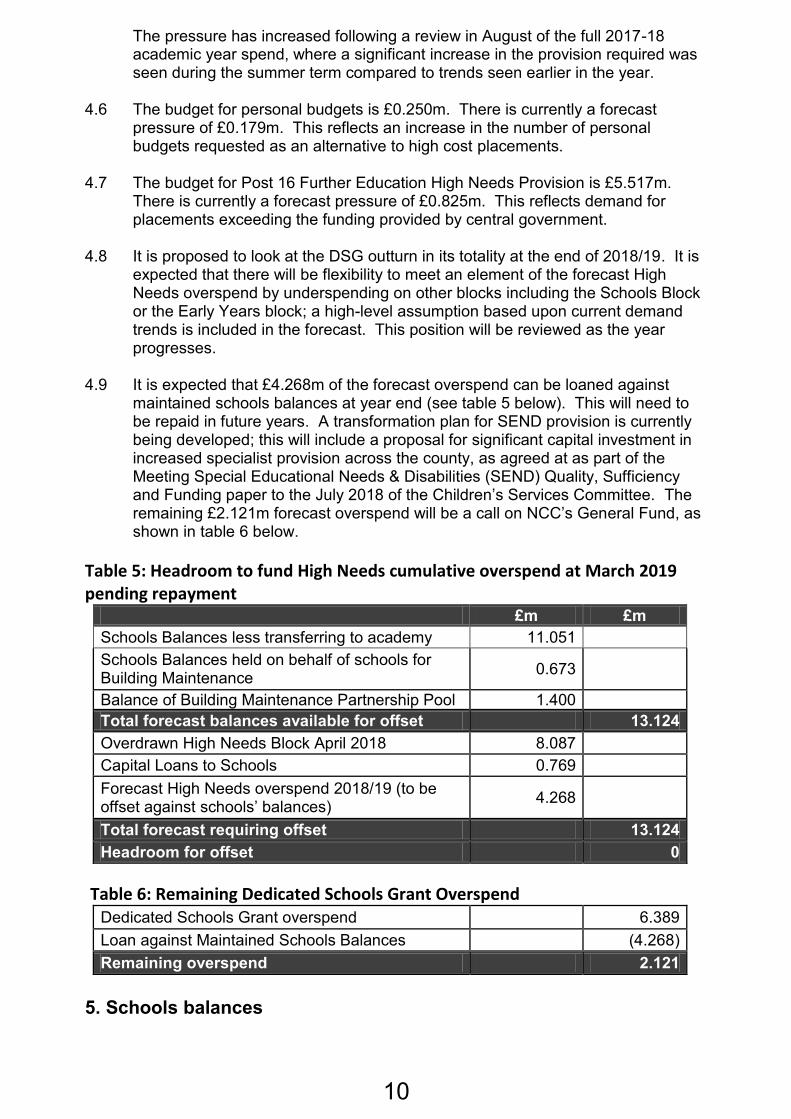
4.9 It is expected that £4.268m of the forecast overspend can be loaned against
maintained schools balances at year end (see table 5 below). This will need to be repaid in future years. A transformation plan for SEND provision is currently being developed; this will include a proposal for significant capital investment in increased specialist provision across the county, as agreed at as part of the Meeting Special Educational Needs & Disabilities (SEND) Quality, Sufficiency and Funding paper to the July 2018 of the Children’s Services Committee. The remaining £2.121m forecast overspend will be a call on NCC’s General Fund, as shown in table 6 below.
Table 5: Headroom to fund High Needs cumulative overspend at March 2019
pending repayment
£m £m
Schools Balances less transferring to academy 11.051
Schools Balances held on behalf of schools for Building Maintenance
0.673
Balance of Building Maintenance Partnership Pool 1.400
Total forecast balances available for offset 13.124
Overdrawn High Needs Block April 2018 8.087
Capital Loans to Schools 0.769
Forecast High Needs overspend 2018/19 (to be offset against schools’ balances)
4.268
Total forecast requiring offset 13.124
Headroom for offset 0
Table 6: Remaining Dedicated Schools Grant Overspend
Dedicated Schools Grant overspend 6.389
Loan against Maintained Schools Balances (4.268)
Remaining overspend 2.121
5. Schools balances
10

5.1 There is a projected decrease in school balances because of schools converting to academies and the use of school balances to fund expenditure within the financial year. Cluster balances are planned to decrease as the Local Authority moves away from funding Special Educational Needs through the cluster model.
Table 7: Projected School Balances as at March 2019
April 2018 March 2019 Variance
Schools becoming
Academies
£m £m £m £m
Nursery schools 0.007 0.067 0.060 0.000
Primary schools 11.765 9.091 (2.674) (0.244)
Secondary schools
0.562 0.100 (0.462) 0.000
Special schools 1.402 2.375 0.973 (0.577)
School Clusters 1.230 0.239 (0.991) 0.000
Totals 14.966 11.872 (3.094) (0.821)
5.2 Schools Reserves and Provisions are balances held on behalf of local authority
maintained schools for a specific purpose. The usage currently forecast for 2018-19 is for building maintenance required by schools. The Building Maintenance Partnership Pool is currently in the fourth year of a 5-year scheme that schools have the option to buy in to.
Table 8: Projected Schools Reserves and Provisions
Reserve or provision April 2018 Net Movement
Increase / (Decrease)
Forecast March 2019
£m £m
Non-teaching activities 0.730 (0.155) 0.575
Building Maintenance Partnership Pool
2.582 (1.182) 1.400
Sickness Insurance scheme 0.000 0.000 0.000
Playing surface sinking fund 0.054 0.000 0.054
Non-partnership maintenance fund
0.780 (0.108) 0.672
Totals 4.146 (1.445) 2.701
6. Capital Programme 6.1 Since the capital programme was approved, there has been both reprofiling to
future years from 2018-19 and other changes both in 2018-19 and in future years, as per the table below.
Ta le 9: Childre ’s Servi es Capital Progra e
Breakdown of capital programme
Approved budget
Reprofiling Other
changes
Current Capital Budget
£m £m £m £m
2018-19 87.764 (3.379) 6.116 90.501
Future Years' 2019-21 49.848 3.379 53.227
11

6.2 Changes have been made to the capital programme that reflect the latest information available. Updates of costs have been received, mainly for 2 schools currently in the feasibility stage of development and for another during the build stage.
6.3 The financing of the capital programme is from a combination of sources. The
financing expectations have been updated in line with the changes made to the capital programme.
Ta le : Fu di g of the Childre ’s Servi es Capital Progra e
Funding Stream
2018-19 Programme
Future Years' Forecast
£m £m
Prudential Borrowing 10.427 0.325
Revenue & Reserves (0.029)
Grants and Contributions:
Department for Education 55.993 48.811
Developer Contributions 22.428 2.532
Other 1.682 1.556
Total 90.501 53.224
7. Risks 7.1 The financial forecast is a middle case forecast. There are however risks that will
need to be carefully monitored and managed as the financial year progresses.
Ensuring the delivery of planned transformation projects
The planned rapid pace of improvement in practice and delivery
The risk of increasing numbers of looked after children and the availability of the most suitable provision for each child
The risk of increasing numbers of children requiring high needs funding
An increased level of unavoidable legal proceedings and tribunals
Management actions being taken expeditiously to achieve the planned effect within the financial year
Continued effective working with partners to achieve coordinated and cost-effective services
Continuing improvement and development of the front door to serves and the Multi-Agency Service Hub
Attracting and retaining suitably qualified teams to deliver a wide range of services
8. Background Papers Meeting Special Educational Needs & Disabilities (SEND) Quality, Sufficiency and Funding (Item 12, 10 July 2018 Children’s Services Committee) http://norfolkcc.cmis.uk.com/norfolkcc/Meetings/tabid/128/ctl/ViewMeetingPublic/mid/496/Meeting/1469/Committee/8/Default.aspx
Officer Contact If you have any questions about matters contained or want to see copies of any assessments, eg equality impact assessment, please get in touch with: If you have any questions about matters contained in this paper please get in touch with:
12

Officer Name: Tel No: Email address: Dawn Filtness 01603 228834 dawn.filtness @norfolk.gov.uk
If you need this report in large print, audio, Braille, alternative format or in a different language please contact 0344 800 8020 or 18001 0344 800 8020 (textphone) and we will do our best to help.
13

C:\Program Files (x86)\neevia.com\docConverterPro\temp\NVDC\1E155902-DCD5-490B-9FD4-F70048AFB848\30d95ca3-738e-4ad9-8d53-a3cf67b1e8d2.docx
1
Children’s Services Committee
Item No……
Report title: Strategic and Financial Planning 2019-20 to 2021-22
Date of meeting: 16 October 2018
Responsible Chief Officer:
Sara Tough, Executive Director of Children’s Services
Strategic impact This report provides an update on the Service Committee’s detailed planning to feed into the Council’s budget process for 2019-20. The Council’s budget setting activity is informed by a range of documents including the Medium Term Financial Strategy, and the Council’s Vision and Strategy. Together, these help to set the context for medium term service and financial planning, which support the development of a robust, balanced budget for 2019-20. In particular, the report sets out Children’s Services Committee’s specific proposals for savings in the context of the approach to developing options that was agreed at the Committee’s meeting in September. Savings are now presented for consideration and recommendation to Policy and Resources Committee, which will agree the savings to go into the consultation process for 2019-20 budget setting later in October. The report also provides the latest information about the Council’s overall budget planning position, including the forecast budget gap for 2019-20 to 2021-22.
Executive summary This report forms part of the strategic and financial planning framework for Service Committees. It provides an update on the Council’s budget setting process and sets out details of the actions required by Service Committees to enable the Council to set a balanced budget for 2019-20. The report details the link between the Council Strategy, the Norfolk Futures transformation programme, and the development of transformation and savings plans relevant to this Committee. Children’s Services Committee is recommended to: 1) Consider the content of this report and the continuing progress of change and
transformation of Children’s services;
2) Note the Council’s latest budget assumptions and pressures, and the resulting revised forecast budget gap of £45.322m, which has been updated by Policy and Resources Committee to reflect the latest available information and following Service Committee input in September (paragraph 4.3 and table 1);
3) Note the revised council tax planning assumptions set out in table 2; 4) Approve the proposed savings for the 2019-20 budget round for recommendation
to Policy and Resources Committee in October (table 5), in particular confirming
14

C:\Program Files (x86)\neevia.com\docConverterPro\temp\NVDC\1E155902-DCD5-490B-9FD4-F70048AFB848\30d95ca3-738e-4ad9-8d53-a3cf67b1e8d2.docx
2
those savings that are recommended to require consultation as set out in paragraph 6.13.
5) Consider and identify any further key areas of risk in relation to 2019-22 budget
planning for the Committee’s budgets, including any additional pressures and the robustness of existing planned savings as set out in table 4, noting that any changes may impact on the overall budget gap and will require additional offsetting savings to be found;
6) Note the budget planning timetable (section 7).
1. Introduction
1.1. The County Council agreed the 2018-19 Budget and Medium Term Financial Strategy (MTFS) to 2022 at its meeting 12 February 2018, at the same time as it agreed a new Strategy for the County Council, Norfolk Futures. The Council has a robust and well-established framework for strategic and financial planning which updates the MTFS position through the year to provide Members with the latest available financial forecasts to inform wider budget setting work across the organisation.
1.2. In July 2018, Policy and Resources Committee considered how the 2019-20
budget planning process would be aligned with the Council’s Strategy, Norfolk Futures. The Committee agreed: budget assumptions and key areas of risk in relation to 2019-22 budget planning, the budget planning principles and guidance for 2019-20, and commissioned Service Committees to begin developing savings proposals.
1.3. In September, Children’s Services Committee:
Agreed the proposed approach and key themes to focus on in developing savings proposals for 2019-20 to 2021-22, including how the principles of the Council’s Strategy, Norfolk Futures, would inform and shape budget planning activity, having regard to the existing savings for 2019-20 and beyond which were agreed as part of the 2018-19 budget round; and
Commissioned officers to develop detailed savings proposals to be presented to the Committee for consideration at this meeting in order to help close the forecast 2019-20 to 2021-22 budget gap.
1.4. This report builds on the position reported to Service Committees in September
and represents the next stage of the Council’s budget planning process. In particular, the paper sets out details of the saving proposals identified for 2019-20 and subsequent years, for the Committee’s consideration.
2. County Council Strategy and Norfolk Futures
2.1. The report to Policy and Resources Committee sets out how the Council’s Vision and Strategy will inform the development of the 2019-20 Budget.
15

C:\Program Files (x86)\neevia.com\docConverterPro\temp\NVDC\1E155902-DCD5-490B-9FD4-F70048AFB848\30d95ca3-738e-4ad9-8d53-a3cf67b1e8d2.docx
3
2.2. Caring for our County, the vision for Norfolk, approved by Members in February 2018, outlines the Council’s commitment to playing a leading role in:
Building communities we can be proud of;
Installing infrastructure first;
Building new homes to help young people get on the housing ladder;
Developing the skills of our people through training and apprenticeships;
Nurturing our growing digital economy; and
Making the most of our heritage, culture and environment.
2.3. The Council’s Strategy for 2018-2021 – Norfolk Futures – will provide the mechanism to enable these ambitions for the County across all of its activities.
2.4. Norfolk Futures will deliver these transformational commitments in a context where demand for our services is driven both by demographic and social trends, and where increasingly complex and more expensive forms of provision are becoming prevalent.
2.5. Norfolk Futures is guided by four core principles that will frame the transformation we will lead across all our work:
Offering our help early to prevent and reduce demand for specialist services;
Joining up work so that similar activities and services are easily accessible, done once and done well;
Being business-like and making best use of digital technology to ensure value for money; and
Using evidence and data to target our work where it can make the most difference.
2.6. Under the banner of Norfolk Futures we will deliver sustainable and affordable services for the people who need them most. The whole Council needs to change to keep up with increasing demands and ever better ways of working.
2.7. These principles frame the transformation that we must lead across all our services and activities. This is all underpinned by evidence and political support, to change how the Council works and how we work with the people of Norfolk.
2.8. By 2021 the strategy and underpinning Service Plans will have moved the Council
towards a more sustainable future with affordable, effective services. This means that we will have radically changed the ways we do some things. We will know our citizens and manage their needs effectively using the best evidence to enable the most appropriate outcomes. We will be working jointly across the Council on our biggest challenges by default, and changing the way we work to reflect new technology and ways of working. This will enable us to work smarter, better and plan long term to be the Council the County needs.
2.9. These principles frame the transformation across all our services and activities and we currently have 7 priorities to help us to deliver the strategy:
Safer Children and Resilient Families;
Promoting independence for Vulnerable Adults;
Smarter Information and Advice;
16

C:\Program Files (x86)\neevia.com\docConverterPro\temp\NVDC\1E155902-DCD5-490B-9FD4-F70048AFB848\30d95ca3-738e-4ad9-8d53-a3cf67b1e8d2.docx
4
Towards a Housing Strategy;
Digital Norfolk;
Local Service Strategy; and
Commercialisation. 2.10. Further information about the Norfolk Futures priorities relevant to this Committee,
and how they will inform and support 2019-20 budget planning, are set out below.
3. Service Transformation 3.1. This section proposes an approach for the Committee to adopt in developing
saving proposals for 2019-20, and explains how this will be aligned to the Norfolk Futures principles.
3.2. Children’s Services in Norfolk continue to operate in a challenging context. As is
the case for almost all local authorities, we are experiencing high and increasing levels of need across numerous areas of service and, in particular, in relation to children with special educational needs and children at risk of harm. We are responding to new issues within society and the range responsibilities for the department is widening to tackle issues such child sexual and criminal exploitation and the threat of radicalisation.
3.3. We are tackling these challenges in the context of ever diminishing resources. The level of grant funding to local authorities diminishes year on year and there is now a clear national evidence base around a significant strategic funding shortfall in Children’s Services, estimated by the Association of Directors of Children’s Services to be growing to around £2 billion by 2020 for the nation as a whole.
3.4. Furthermore, the evidence shows that the pressure on, and need for, children’s
services are driven to a very large extent by external factors beyond the control of Children’s Services. The levels of deprivation, the size of the local 0-25 population, levels of household income, levels of unemployment and levels of crime have been identified as the key contributing factors nationally and in many of these areas our own analysis of the demographics shows an increasingly challenging picture in Norfolk. We know that relative deprivation is increasing in the County, our population of children and young people is expanding and the national economic outlook is having an impact. Those trends are now beginning to translate into additional demand for services and pressure on budgets and capacity.
17

C:\Program Files (x86)\neevia.com\docConverterPro\temp\NVDC\1E155902-DCD5-490B-9FD4-F70048AFB848\30d95ca3-738e-4ad9-8d53-a3cf67b1e8d2.docx
5
3.5. Although this is a challenging context, Norfolk County Council and its Children’s Services are responding in a bold, positive and ambitious way. That began with the business case for a major investment in transformational change agreed at Policy and Resources Committee in September 2017 and the Launch of the Norfolk Futures Transformation programme as part of the committee plan at the May children service committee 2018. That high-level business case committed an allocation of £12-15million of up-front investment in Children’s Services to enable the development of new service models that can respond to the changing needs in communities and allow us to continue to achieve positive outcomes for children and families.
3.6. More than half of total expenditure across Children’s Services is on direct delivery of assessment, support and care through demand-led budgets to the most vulnerable or highest need children. That includes placements budgets of £52m for children looked after, support and care for children with special educational needs and disabilities £33.5m and Home to School Transport for children with Special Educational Needs £13.6m. In addition, a substantial proportion of the budget is spent on services and interventions that support children looked after and children with Special Educational Needs. The children looked after and transport costs are funded from Children’s Services core budget and represent very significant proportion of total Children’s Services funding. The SEN placements are funded via the Dedicated Schools Grant High Needs Block. It is important to recognise that there are significant inter-relationships with our base budget because sometimes the same children and young people will be receiving support (and funding) from both an SEN education perspective and from within the Children’s Social Care model.
3.7. Given this pattern of high spend on the highest needs cohort, it is clear that our response to the financial challenge needs to focus on these major budget areas and follow the principles set out in the Norfolk Futures Strategy of offering our help early to prevent and reduce demand for specialist services and using evidence and data to target our work where it can make the most difference.
3.8. Only by intervening effectively at the right point will we be able to unlock significant financial savings; following that principle, we are developing a comprehensive programme of transformation, as illustrated in diagram 1. This thinking was first outlined to Committee through the Demand Management & Prevention Strategy: Children’s Services which was agreed at Policy and Resources Committee in September 2017 which included the allocation of £12-15m of pump-priming investment to enable transformation and change. The programme has been developed in more detail and now forms the Safer Children and Resilient Families strand of the Norfolk Futures Programme; with an update presentation was delivered to Children’s Services Committee at their September 2018 meeting. Some of the key themes are summarised below.
18

C:\Program Files (x86)\neevia.com\docConverterPro\temp\NVDC\1E155902-DCD5-490B-9FD4-F70048AFB848\30d95ca3-738e-4ad9-8d53-a3cf67b1e8d2.docx 6
Diagram 1: Children’s Transformation Strategic Approach
19

C:\Program Files (x86)\neevia.com\docConverterPro\temp\NVDC\1E155902-DCD5-490B-9FD4-F70048AFB848\30d95ca3-738e-4ad9-8d53-a3cf67b1e8d2.docx
7
3.9. Our demand management programme is driving forward projects within four broad themes:
3.9.1. Inclusion – we are working with children, their families and our partners in schools to further enable more children with additional needs to be educated locally and, wherever possible and appropriate, within their mainstream school. Our proposals include a very significant investment in Specialist Resource Bases across the county, giving access to specialist intervention and support so that children and families are not travelling great distance to access appropriate support to meet needs. We are also investing in additional capacity to support and challenge education providers, work with children and families to ensure needs are met in a timely and appropriate way, and to enable technology so that children get the extra help and equipment they need to succeed in mainstream settings. For children who have additional needs which are such that they should attend a high quality special or complex needs school, or access an alternative, specialist level of provision, our intention is to increase this capacity, locally, by further expanding existing special / complex needs schools, develop more residential opportunities and build new special schools in geographical areas of need. The aim is to intervene earlier, enable local solutions to meet need, mitigating the high volume of higher costs places in the independent/non-maintained sector, significantly reducing travel time and improving local specialism to meet need. The primary financial impact will be a reduction in the level of pressure on the High Needs Block element of the Dedicated Schools Grant funding, but the inclusion strategy will also impact positively on transport costs for children with special educational needs.
3.9.2. Prevention and Early Intervention – we are investing capacity ‘upstream’ in a range
of areas to support families before their needs escalate to the point of crisis. Our plans include a transformed model at the front door with a highly skilled social work and early help duty team, enabling more demand to be managed at the point of initial contact and allowing the social work teams to focus only on appropriate higher risk cases. Our transformation of the Children’s Centre service model will specifically target additional outreach support to families whose needs might otherwise escalate – including those where mental health, substance misuse and family relationship issues are present. We are also enhancing our wider Early Help offer with a particular focus on building capacity in the partnership system to intervene effectively, and on ensuring that we develop and use community and voluntary sector support alongside our own interventions. The impact of these workstreams will be to reduce the demand flowing into the statutory social work system.
3.9.3. Effective Practice Model – we are proposing a number of improvements to the core practice model to free up capacity within teams; enabling staff to spend more time directly with families to help them to work through their challenges and effect change. We are also designing proposals to reduce the number of hand-offs and changes of lead worker that children and families experience, recognising that the stability of relationships is essential to successful work to help families keep children safe. We are continuing to drive quality interventions through our involvement in the national Signs of Safety and restorative practice programmes; as the quality of practice continues to improve we will see better outcomes for children and families. The impact of these workstreams will be seen through cases
20

C:\Program Files (x86)\neevia.com\docConverterPro\temp\NVDC\1E155902-DCD5-490B-9FD4-F70048AFB848\30d95ca3-738e-4ad9-8d53-a3cf67b1e8d2.docx
8
successfully de-escalating as a result of social work support and fewer cases reaching the point where children need to be accommodated.
3.9.4. Edge of care support and alternatives to care – Where needs have escalated to a point where consideration is being given to taking children into care, we will look to deploy a range of new approaches as alternatives and will only take children into the care system once other options have been exhausted. Our first alternative will always be to explore the wider family and community network to find people who have the capacity to provide care, and we will be delivering a major development programme across our workforce to embed approaches to ‘family finding’ at the heart of our social work model. We are also investing in new ‘edge of care’ interventions such as an intensive therapeutic service and a time-limited short breaks offer for families who would benefit from some additional time and space in order to work through their challenges.
3.10. The cumulative impact of all of these proposals will be fewer children needing to be looked after and / or requiring high-level specialist SEND provision; this will deliver a corresponding financial benefit to the local authority.
3.11. As well as managing demand through earlier intervention, our transformation and budget planning strategy includes a strong focus on effective commissioning and market management. These proposals will follow the Norfolk Futures principles of being business-like to ensure value for money and using evidence and data to target our work where it can make the most difference.
3.12. Our analysis of the care market for looked after children shows an over-reliance on high cost forms of care such is external residential provision, external semi-independent provision and independent foster care agencies. Therefore, there is a need to re-shape this market proactively to create the value-for-money provision we need for our children and young people. We are therefore proposing strategic capital investments in a range of placement types including additional semi-independent placements, a new enhanced fostering model, new short breaks and shared care placements and potentially in new in-house residential capacity. In addition to these major commissioning projects we are also leading a transformation of our own Fostering Service; utilising behavioural insight techniques to understand the motivations of existing and potential foster carers. This will allow us to develop a completely new approach to recruiting and retaining carers and, therefore, over time, reducing the reliance on costly external agencies.
3.13. Our analysis of the care market for children with Special Educational Needs also highlights sufficiency challenges and a corresponding reliance on high-cost specialist placements. We are bringing forward proposals for a step-change capital investment to develop four new special schools and additional Specialist Resource Bases attached to mainstream schools, to ensure that the right services are available in the right place, thus reducing ongoing revenue costs for the future.
3.14. A final strand of our response to the financial challenge is informed by the Norfolk Futures principle of joining up work so that similar activities and services are easily accessible, done once and done well. This principle is particularly important in our work alongside health partners to design services which respond to health and care needs in coherent and seamless way. To that end we have recently established integrated commissioning arrangements with our health partners and are working with them to examine our collective spend as a system,
21

C:\Program Files (x86)\neevia.com\docConverterPro\temp\NVDC\1E155902-DCD5-490B-9FD4-F70048AFB848\30d95ca3-738e-4ad9-8d53-a3cf67b1e8d2.docx
9
to eliminate any duplication and to align our commissioning priorities and contracts. We are also looking to join up our operational arrangement where this can improve outcomes. In particular we are looking to create an integrated model of Children’s Mental Health Services; co-designing this in the coming months with the Clinical Commissioning Groups, local Child and Adolescent Mental Health Services (CAMHS) and, of course, with children and families. These areas of work have strong potential to deliver both better outcomes through more integrated provision, and a range of financial efficiencies across the system.
4. 2019-20 Budget Planning 4.1. The Medium Term Financial Strategy (MTFS) was agreed in February 2018
including £78.529m of savings and with a remaining gap of £94.696m. The MTFS provided the starting point for the Council’s 2019-20 Budget planning activity. Full details of cost pressures assumed in the Council’s MTFS are set out in the 2018-19 Budget Book.1 The September report to this committee set out:
Budget planning principles 2019-20
Budget assumptions 2019-20
Council tax assumptions
Budget risks identified
Indicative savings requirements 2018-19 budget position 4.2. The latest information about the 2018-19 budget position is set out in the budget
monitoring report elsewhere on the agenda. Budget planning for 2019-20 is based on the assumption that the 2018-19 Budget is fully delivered (i.e. that all savings are achieved as planned and there are no significant overspends). Further pressures in the forecast 2019-20 Budget have been provided for as detailed later in this report.
Latest forecast budget gap 2019-20 to 2021-22 4.3. In September, following feedback from Service Committees, Policy and Resources
Committee then considered the latest planning information and an updated budget position. The current position, taking into account the changes agreed by Policy and Resources Committee, and assuming that new savings can be identified at the required level of £22.089m for 2019-20, is shown in the table below. Changes in the Council’s funding assumptions have mitigated some of the identified pressures.
4.4. Assuming that collectively Service Committees are successful in identifying savings at the indicative level required for 2019-20 (as identified in the July Policy and Resources report), the latest gap position indicates a reduced forecast gap of £45.322m for the period 2019-20 to 2021-22, with a small £0.609m gap remaining to be closed in 2019-20.
4.5. Policy and Resources Committee will receive a further update on the overall gap
position for the County Council in October. The budget position and the associated
1 https://www.norfolk.gov.uk/-/media/norfolk/downloads/what-we-do-and-how-we-work/budget-and-council-tax/budget-book-2018-22.pdf?la=en
22

C:\Program Files (x86)\neevia.com\docConverterPro\temp\NVDC\1E155902-DCD5-490B-9FD4-F70048AFB848\30d95ca3-738e-4ad9-8d53-a3cf67b1e8d2.docx
10
assumptions are kept under continuous review, and will be updated to reflect any changes arising from the Government’s Autumn Budget, or further information about the Council’s funding position as it becomes available up until budget-setting by County Council in February.
Table 1: Latest forecast budget gap 2019-20 to 2021-222
2019-20
2020-21
2021-22
Total
£m £m £m £m
Forecast gap as reported to September Service Committees (agreed at 16 July 2018 Policy and Resources)
22.089 48.454 24.153 94.696
Pressures
Children’s Services budget pressures including Children Looked After demographic growth
5.000 2.000 2.000 9.000
Children's Preventing Radicalisation pressure 0.120 0.000 0.000 0.120
Children's Centres saving delay 1.700 -1.700 0.000 0.000
Adult market pressures 2.000 0.000 0.000 2.000
Leap year pressure in Adult Social Care 0.550 -0.550 0.000 0.000
Property savings (including income targets) at risk 1.500 1.000 0.500 3.000
Pressure from 2019-20 national pay award and associated salary scale changes
0.345 0.000 0.000 0.345
Total new pressures 11.215 0.750 2.500 14.465
Proposed mitigations
Collection Fund -4.688 0.000 0.000 -4.688
Council tax tax base (additional 1.5%) -5.918 -6.305 -6.341 -18.564
MRP pressure reprofiled 0.000 -5.000 5.000 0.000
Additional capital receipts 0.000 -10.000 0.000 -10.000
2% Council Tax increase 2021-22 0.000 0.000 -8.498 -8.498
Total mitigations -10.606 -21.305 -9.839 -41.750
Delivery of 2019-20 savings target (as identified at 16 July 2018 Policy and Resources)
-22.089 0.000 0.000 -22.089
Latest forecast gap for planning purposes (24 September 2018 Policy and Resources)
0.609 27.899 16.814 45.322
4.6. In view of the budget gap and the difficulty in identifying future year savings, Policy
and Resources Committee has been recommended to consider incorporating a planning assumption that council tax in 2021-22 be increased by 1.99% as shown in the table above. The level of council tax is ultimately subject to agreement by Full Council each year, and there will be an opportunity to consider the required level of council tax in light of any future Government announcements relating to the Fair Funding Review and Comprehensive Spending Review. The MTFS planning position set out in this paper is therefore based on the following council tax increase
2 As presented to Policy and Resources Committee September 2018 (please note this does not reflect any amendments arising from Policy and Resources Committee decisions in September).
23

C:\Program Files (x86)\neevia.com\docConverterPro\temp\NVDC\1E155902-DCD5-490B-9FD4-F70048AFB848\30d95ca3-738e-4ad9-8d53-a3cf67b1e8d2.docx
11
assumptions (and also assumes there is no scope to increase the Adult Social Care precept in 2019-20 under the current terms set out by Government):
Table 2: Council Tax assumptions (as per Policy and Resources Committee 24 September 2018)
2019-20 2020-21 2021-22
Assumed increase in general council tax
2.99% 1.99% 1.99%
Assumed increase in Adult Social Care precept
0.00% 0.00% 0.00%
Total assumed council tax increase 2.99% 1.99% 1.99%
4.7. The planned 2.99% increase in council tax is based on the current understanding
of updated assumptions and flexibility offered by the Government in the 2018-19 local government finance settlement. Any reduction in this increase will require additional savings to be found. The assumed council tax increases are subject to Full Council’s decisions on the levels of council tax, which will be made before the start of each financial year.
4.8. Assumptions around increases in the council tax base have been increased to 2.0% (from the original assumption of 0.5% annual growth), based on recent trends.
Key budget risks 2019-20 4.9. Uncertainties remain about a number of items which have not currently been
reflected in the budget planning assumptions, but which could potentially result in an increase in the overall gap. As a result, additional pressures, which have not currently been provided for, may arise in 2019-20 relating to: Further pressures arising within Service Committee budgets including:
o SEND High Needs pressures (Children's) – see section 6.1 below o Pressures relating to the Health system (Adults)
Increasing the level of the General Fund reserve; and
Changes in the forecast 2018-19 level of savings delivery to allow for any mitigation of undeliverable savings.
4.10. The risks and assumptions relating to the 2019-20 Budget will continue to be
monitored and updated as budget planning activity proceeds.
5. Savings allocation 5.1. The following table sets out indicative savings required to close the identified gap
by Committee which were agreed by Policy and Resources Committee and reported to Service Committees in September. As set out above, there may be an opportunity for the level of savings required in 2020-21 and 2021-22 to be reduced in future years based on the latest budget planning position.
24
C:\Program Files (x86)\neevia.com\docConverterPro\temp\NVDC\1E155902-DCD5-490B-9FD4-F70048AFB848\30d95ca3-738e-4ad9-8d53-a3cf67b1e8d2.docx
12
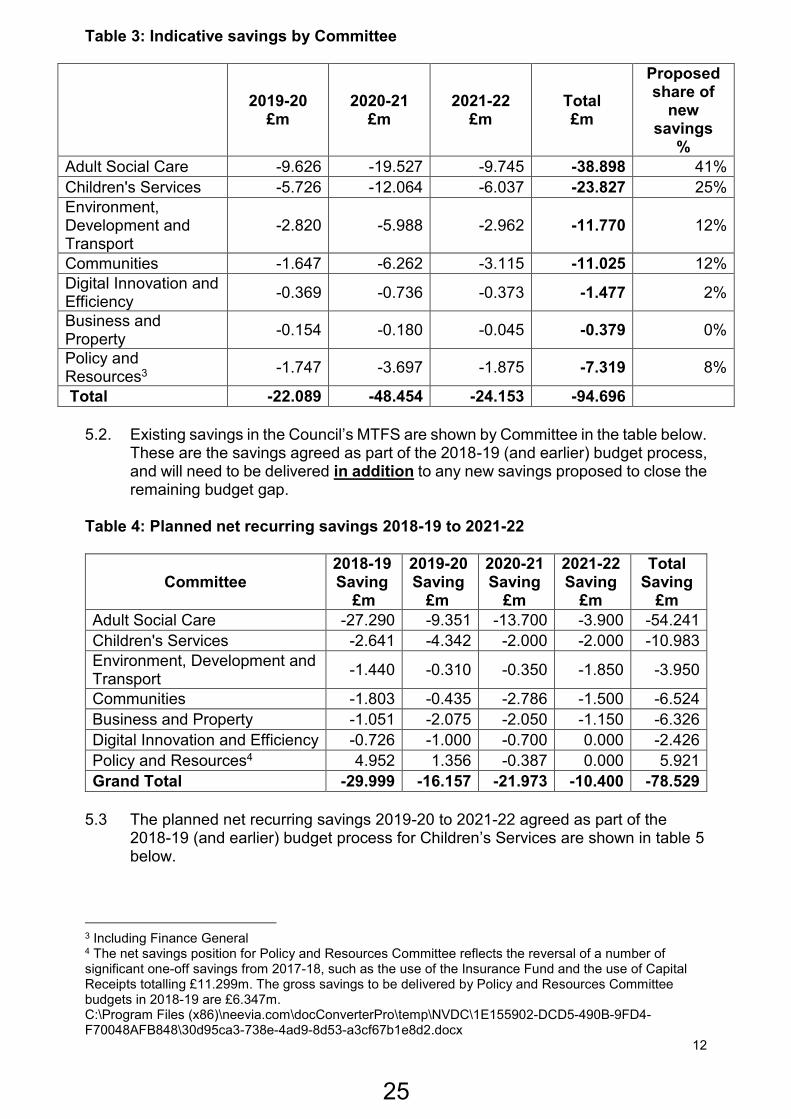
Table 3: Indicative savings by Committee
2019-20
£m 2020-21
£m 2021-22
£m Total £m
Proposed share of
new savings
%
Adult Social Care -9.626 -19.527 -9.745 -38.898 41%
Children's Services -5.726 -12.064 -6.037 -23.827 25%
Environment, Development and Transport
-2.820 -5.988 -2.962 -11.770 12%
Communities -1.647 -6.262 -3.115 -11.025 12%
Digital Innovation and Efficiency
-0.369 -0.736 -0.373 -1.477 2%
Business and Property
-0.154 -0.180 -0.045 -0.379 0%
Policy and Resources3
-1.747 -3.697 -1.875 -7.319 8%
Total -22.089 -48.454 -24.153 -94.696
5.2. Existing savings in the Council’s MTFS are shown by Committee in the table below.
These are the savings agreed as part of the 2018-19 (and earlier) budget process, and will need to be delivered in addition to any new savings proposed to close the remaining budget gap.
Table 4: Planned net recurring savings 2018-19 to 2021-22
Committee 2018-19 Saving
£m
2019-20 Saving
£m
2020-21 Saving
£m
2021-22 Saving
£m
Total Saving
£m
Adult Social Care -27.290 -9.351 -13.700 -3.900 -54.241
Children's Services -2.641 -4.342 -2.000 -2.000 -10.983
Environment, Development and Transport
-1.440 -0.310 -0.350 -1.850 -3.950
Communities -1.803 -0.435 -2.786 -1.500 -6.524
Business and Property -1.051 -2.075 -2.050 -1.150 -6.326
Digital Innovation and Efficiency -0.726 -1.000 -0.700 0.000 -2.426
Policy and Resources4 4.952 1.356 -0.387 0.000 5.921
Grand Total -29.999 -16.157 -21.973 -10.400 -78.529
5.3 The planned net recurring savings 2019-20 to 2021-22 agreed as part of the
2018-19 (and earlier) budget process for Children’s Services are shown in table 5 below.
3 Including Finance General 4 The net savings position for Policy and Resources Committee reflects the reversal of a number of significant one-off savings from 2017-18, such as the use of the Insurance Fund and the use of Capital Receipts totalling £11.299m. The gross savings to be delivered by Policy and Resources Committee budgets in 2018-19 are £6.347m.
25
C:\Program Files (x86)\neevia.com\docConverterPro\temp\NVDC\1E155902-DCD5-490B-9FD4-F70048AFB848\30d95ca3-738e-4ad9-8d53-a3cf67b1e8d2.docx
13
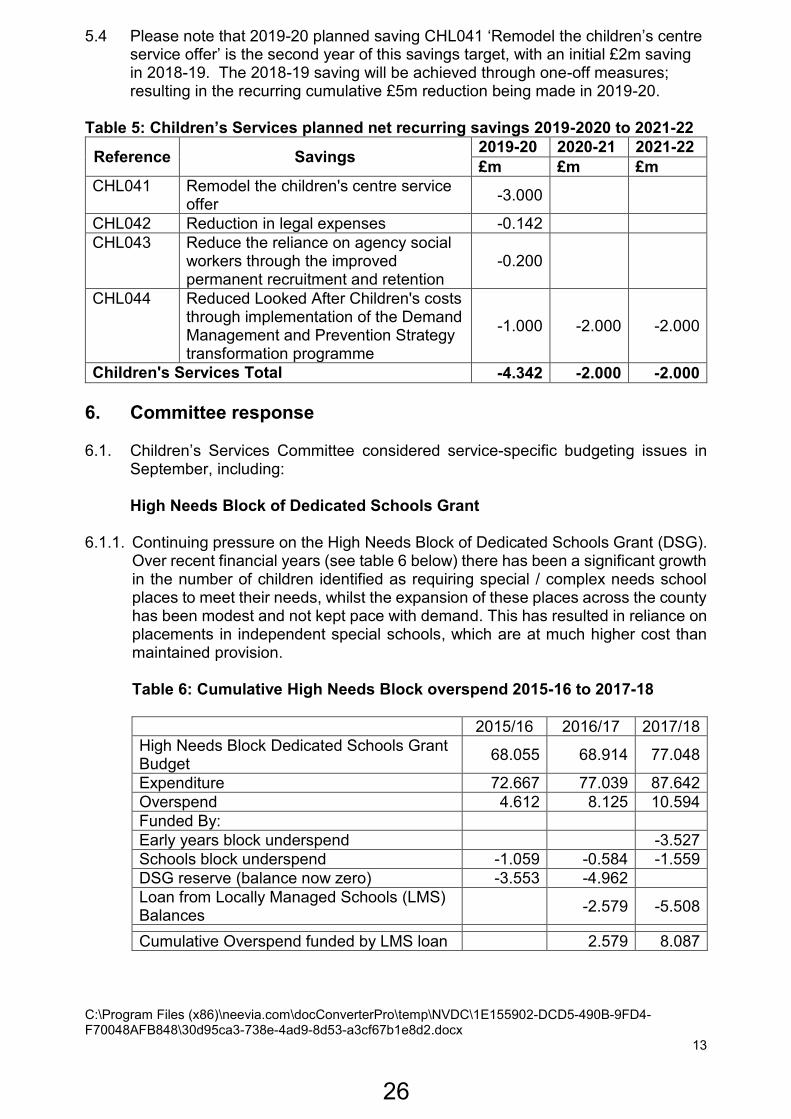
5.4 Please note that 2019-20 planned saving CHL041 ‘Remodel the children’s centre service offer’ is the second year of this savings target, with an initial £2m saving in 2018-19. The 2018-19 saving will be achieved through one-off measures; resulting in the recurring cumulative £5m reduction being made in 2019-20.
Table 5: Children’s Services planned net recurring savings 2019-2020 to 2021-22
Reference Savings 2019-20 2020-21 2021-22
£m £m £m
CHL041 Remodel the children's centre service offer
-3.000
CHL042 Reduction in legal expenses -0.142
CHL043 Reduce the reliance on agency social workers through the improved permanent recruitment and retention
-0.200
CHL044 Reduced Looked After Children's costs through implementation of the Demand Management and Prevention Strategy transformation programme
-1.000 -2.000 -2.000
Children's Services Total -4.342 -2.000 -2.000
6. Committee response 6.1. Children’s Services Committee considered service-specific budgeting issues in
September, including:
High Needs Block of Dedicated Schools Grant 6.1.1. Continuing pressure on the High Needs Block of Dedicated Schools Grant (DSG).
Over recent financial years (see table 6 below) there has been a significant growth in the number of children identified as requiring special / complex needs school places to meet their needs, whilst the expansion of these places across the county has been modest and not kept pace with demand. This has resulted in reliance on placements in independent special schools, which are at much higher cost than maintained provision. Table 6: Cumulative High Needs Block overspend 2015-16 to 2017-18
2015/16 2016/17 2017/18
High Needs Block Dedicated Schools Grant Budget
68.055 68.914 77.048
Expenditure 72.667 77.039 87.642
Overspend 4.612 8.125 10.594
Funded By:
Early years block underspend -3.527
Schools block underspend -1.059 -0.584 -1.559
DSG reserve (balance now zero) -3.553 -4.962
Loan from Locally Managed Schools (LMS) Balances
-2.579 -5.508
Cumulative Overspend funded by LMS loan 2.579 8.087
26

C:\Program Files (x86)\neevia.com\docConverterPro\temp\NVDC\1E155902-DCD5-490B-9FD4-F70048AFB848\30d95ca3-738e-4ad9-8d53-a3cf67b1e8d2.docx
14
6.1.2. The cause of the pressures on the DSG High Needs Block (HNB) can be
summarised as follows:
The Central Government funding calculation for the HNB includes only an additional £4k p.a. for each high-cost specialist placement. This results in each of these additional placements putting pressure upon existing resources within the block, due to the additional funding allocated being only a fraction of the actual cost of each place.
About half of the HNB calculation is based on historical spending. This allows a system of caps and floors to be operated to protect some authorities from large annual changes. A new funding formula introduced in 2018/19 has led to gains for Norfolk in the High Needs Block; however, this increase has not fully reflected the increase in demand for high-level SEND provision
The balance of the block is distributed according to deprivation and educational achievement. These are proxy measures used by Department for Education (DFE) to assess the need to spend. The measures are, at best, indirectly linked to the increasing numbers of children requiring provision
Past and forecast increases in the HNB do not therefore reflect the rapidly increasing numbers of children with specialist / complex needs in Norfolk
There is insufficient maintained specialist educational provision in Norfolk. This has forced the use of much costlier independent provision. The cost differential is around £23,000 per annum for each child placed
The HNB must also meet the cost of making alternative provision for permanently excluded pupils or for excluded pupils, from day 6 of exclusion (or day 1 for a child looked after), until they are reintegrated into a mainstream school, or a newly funded place is secured in a special / complex needs school, or other form of alternative provision
6.1.3. The current overdrawn position of the high needs block is set out in the Period 5 monitoring report elsewhere on this agenda. The overdrawn position funded by LMS balances must also be repaid. It is proposed to do so by the end of 2023/24
6.1.4. The options available to bring the HNB to a sustainable financial basis include:
Transforming the system for Special Educational Needs and Disability (SEND) in Norfolk;
Making transfers from other DSG blocks: (i) any such budgeted transfers are subject to external approvals and must be renewed annually; (ii) it may also be possible to use any unplanned underspends on other DSG blocks on a year by year basis.
Support from NCC’s General Fund
More information on these options is set out below:
27

C:\Program Files (x86)\neevia.com\docConverterPro\temp\NVDC\1E155902-DCD5-490B-9FD4-F70048AFB848\30d95ca3-738e-4ad9-8d53-a3cf67b1e8d2.docx
15
Transforming the system 6.1.5. October Policy and Resources Committee is considering capital investment in the
region of £120m to transform the system of SEND in Norfolk through the creation of new specialist provision and a programme to dramatically support and challenge mainstream inclusion.
Use of other DSG Blocks
6.1.6. The Schools Forum has agreed to make a 0.5% transfer from the Schools Block to the High Needs Block in 2019-20. The value of the transfer is forecast to be £2.388m. A similar transfer was made in 2018-19.
6.1.7. Schools Funding for 2019-20 is currently in consultation with school leaders and
governors for the adoption of a new funding for 2019 / 20. As part of this consultation the Schools Forum Formula Working Group’s recommended option to consultees includes an additional transfer from the Schools Block Funding over and above the 0.5% already agreed. The proposed value of the additional transfer is £4.552m. This is the difference between 2018-19 allocations to schools and what would be their new National Funding Formula allocations in 2019-20. The additional transfer would require Secretary of State approval.
Support from the General Fund
6.1.8. Further analysis and modelling is being undertaken to establish the extent of any
General Fund support that may be required from 2019-20 onwards, in addition to transfers between DSG blocks detailed above. It is expected that a significant cost will be identified, but it is not possible to quantify the extent at this stage; instead this will be reported to meetings of both Policy and Resources and future Children’s Services committees.
Children Looked After Placements Budget
6.1.9. The number of children entering care nationally continues to increase, and Norfolk
is no different to other authorities. The number of children looked after and the total expenditure on associated placements and support are currently above the levels anticipated in initial budgeting, and in the forecast trajectory set out in the Outline Business Case for the Safer Children and Resilient Families transformation programme. This primarily reflects the increase in LAC numbers which occurred between December 2017 and January 2018, and, whilst the numbers have broadly stabilised since, there has not yet been any decrease and so spending is beyond budget. There is currently no demand growth built into Children’s Service’s budgets; the proposed pressure incorporated in the latest forecast of the budget gap for 2019-20 to 2021-22 (Table 1) recognises the growth in this financial year and expected in future financial years.
Children’s Centre service
6.1.10 The decision previously taken to extend the existing Children’s Centre service
contracts for an additional 6-months prior to the implementation of the transformed model has necessitated a re-phasing of the saving planned from Children’s Centre
28

C:\Program Files (x86)\neevia.com\docConverterPro\temp\NVDC\1E155902-DCD5-490B-9FD4-F70048AFB848\30d95ca3-738e-4ad9-8d53-a3cf67b1e8d2.docx
16
service for 2019-20. This re-phasing has been built into the 2019-22 budget planning assumptions (Table 1).
2019-20 Budget proposals
6.2. Table 7 summarises the new proposals put forward to Children’s Services
committee. Further details about each proposal follows.
Table 7: New 2019-20 to 2021-22 Saving Proposals
Proposal
Note: savings are shown as a negative figure 2019-20 2020-21 2021-22
2019-22 Total
Risk Assessment
£m £m £m £m RAG
More effective and efficient commissioning of mental health assessments
-0.750 0.000 -0.750 Amber
Cost efficiencies delivered by strategic partnership and joint commissioning with Mental Health Services
-0.300 -0.200 0.000 -0.500 Amber
Move to best practice model of parenting assessments
-0.500 0.000 -0.500 Amber
Reverse CHL044 'Reduced Looked After Children's costs' and combine with Norfolk Futures Safer Children and Resilient Families Programme below
1.000 2.000 2.000 5.000
Norfolk Futures Safer Children and Resilient Families Programme: Better outcomes for children and young people and reducing demand for services
-3.630 -1.584 -2.000 -7.214 Amber
Total new savings proposed -4.180 0.216 0.000 3.964
6.3. More effective and efficient commissioning of mental health assessments
Why is this being considered? A review of our approach to the commissioning of mental health assessments has been undertaken and a more efficient approach has been identified.
What would be required? A change to practice that embeds assessment as part of the overall therapeutic care package with increasing collaboration between providers, resulting in better trained and supported staff, whilst reducing duplication. What are the implications of the proposal? The proposal does not seek to reduce the amount of mental health assessments or treatment undertaken. Cost efficiencies will be delivered compared to the costs
29

C:\Program Files (x86)\neevia.com\docConverterPro\temp\NVDC\1E155902-DCD5-490B-9FD4-F70048AFB848\30d95ca3-738e-4ad9-8d53-a3cf67b1e8d2.docx
17
of commissioning separately for the assessment and the care provision, releasing financial resources for other purposes.
6.4. Cost efficiencies delivered by strategic partnership and joint commissioning with Mental Health Services
Why is this being considered? By more effective coordination and partnership it will be possible to reduce management costs. What would be required? A Strategic Partnership with Child and Adolescent Mental Health Services (CAMHS) has been established and are developing a more aligned and integrated care model. What are the implications of the proposal? The joint commissioning and partnership working will look to identified shared cost efficiencies that have no negative impact upon services delivered; thus, releasing Council resources through avoiding unnecessary management costs.
6.5. Move to best practice model of parenting assessments
Why is this being considered? Having reviewed best practice, it is proposed that the model of parenting assessments within care proceedings is amended. Practice reviewed elsewhere shows that not only will this change achieve better outcomes, but there will also be cost efficiencies delivered. What would be required? A new model will be developed that allows assessments to take place in community or family home settings, as opposed to always in specialist residential and overnight settings currently utilised. What are the implications of the proposal? The new service model will deliver assessments within more natural contexts, providing a better way of assessing capacity, whilst offering a more positive experience for families. This model will reflect current best practice, whilst also being more cost effective by avoiding the cost of residential accommodation.
6.6. Norfolk Futures Safer Children and Resilient Families Programme: Better outcomes for children and young people and reducing demand for services Why is this being considered? The Norfolk Futures Safe Children and Resilient Families programme is being developed with the aim of reducing the number of children that are having to be in care and to change the mix of care placements. Further information was provided
30
C:\Program Files (x86)\neevia.com\docConverterPro\temp\NVDC\1E155902-DCD5-490B-9FD4-F70048AFB848\30d95ca3-738e-4ad9-8d53-a3cf67b1e8d2.docx
18
earlier in this report in section 3, as well as in the Children’s Services Transformation Paper that was part of Children’s Services Committee’s agenda in September 2018. Analysis of existing placement expenditure shows a comparatively high proportion of children placed in residential or other high costs care provision. What would be required? The new provision includes an investment in semi-independent care for 16 and 17-year olds, the expansion of the in-house fostering service, the development of an enhanced fostering model for children and young people with more complex needs and the expansion of our boarding school placement model. We are also working to transform the system of safeguarding services such that it builds the resilience of families, intervenes earlier, provides intensive and effective interventions for families at the edge of care and supports children to return home from care wherever this is possible. In the short term we have a targeted focus on supporting children to return home from care safely and are changing the way we use resource panels to put interventions in place earlier and support families before they reach the point of crisis. In the medium term our strategic investments include moving capacity ‘upstream’ in an enhanced Front Door model and new edge of care services, enhancing the early help offer and we are making changes to the social work model to free up capacity for teams to do the direct work which can help families to address risks and avert the needs for children to come into care. What are the implications of the proposal? The new service models that are being developed and implemented will achieve positive outcomes for children and families and reduced demand for services; ensuring that the right support is in the right place at the right time.
6.7. To provide clarity of the overall impact of the proposals, table 8 shows the cumulative impact of the previously agreed budget savings, proposed amendments to these savings, and the newly proposed budget savings.
31

C:\Program Files (x86)\neevia.com\docConverterPro\temp\NVDC\1E155902-DCD5-490B-9FD4-F70048AFB848\30d95ca3-738e-4ad9-8d53-a3cf67b1e8d2.docx
19
Table 8: Summary Overall Impact of 2019-20 to 2021-22 Agreed Budget Savings and Proposals
Savings / Proposals Note: savings are shown as a negative figure
Reference 2019-20 2020-21 2021-22 2019-22
Total
£m £m £m £m
New Savings Proposed
More effective and efficient commissioning of mental health assessments
-0.750 0.000 -0.750
Cost efficiencies delivered by strategic partnership and joint commissioning with Mental Health Services
-0.300 -0.200 0.000 -0.500
Move to best practice model of parenting assessments
-0.500 0.000 -0.500
Reverse CHL044 'Reduced Looked After Children's costs' and combine with Norfolk Futures Safer Children and Resilient Families Programme below
1.000 2.000 2.000 5.000
Norfolk Futures Safer Children and Resilient Families Programme: Better outcomes for children and young people and reducing demand for services
-3.630 -1.584 -2.000 -7.214
Proposed Amendments to Agreed Budget Savings
Children's Centres saving delay 1.700 -1.700 0.000 0.000
Agreed Budget Savings from 2018-19 Budget
Remodel the children's centre service offer
CHL041 -3.000 -3.000
Reduction in legal expenses CHL042 -0.142 -0.142
Reduce the reliance on agency social workers through the improved permanent recruitment and retention
CHL043 -0.200 -0.200
Reduced Looked After Children's costs through implementation of the Demand Management and Prevention Strategy transformation programme
CHL044 -1.000 -2.000 -2.000 -1.000
Children's Services Total -6.822 -3.484 -2.000 -12.306
Please note (as per section 5.4 above) that 2019-20 planned saving CHL041 ‘Remodel the children’s centre service offer’ is the second year of this savings target, with an initial £2m saving in 2018-19. The 2018-19 saving will be achieved through one-off measures; resulting in the recurring cumulative £5m reduction being made in 2019-20.
2019-20 Budget proposals requiring consultation 6.8. Our budget proposals for 2019-20 assume that council tax will increase overall by
2.99%. As in previous years we are inviting comments on this approach via our consultation hub on Citizen Space.
6.9. Where any of our individual budget saving proposals require public consultation we will publish them on the Council’s consultation hub, Citizen Space. We will make any consultation documents available in other formats on request, make extra effort to find out the views of people who may be affected and carry out impact
32

C:\Program Files (x86)\neevia.com\docConverterPro\temp\NVDC\1E155902-DCD5-490B-9FD4-F70048AFB848\30d95ca3-738e-4ad9-8d53-a3cf67b1e8d2.docx
20
assessments. Our consultation will take place between November and the end of the year. Consultation feedback on both individual budget proposals and council tax will be available for Committees in January.
6.10. We will promote opportunities for people to have their say on budget proposals and council tax - through the Your Norfolk residents’ magazine, news releases, online publications and social media.
6.11. As part of the 2019-20 budget planning process, it is considered that none of these proposals require public consultation. However, consultation with relevant partners and agencies will take place where necessary.
7. Budget Timetable 7.1. The Council’s overarching budget setting-timetable for 2019-20 was agreed by
County Council in February as part of the 2018-19 Budget. The timetable is updated as further information becomes available (for example about the timing of
33

C:\Program Files (x86)\neevia.com\docConverterPro\temp\NVDC\1E155902-DCD5-490B-9FD4-F70048AFB848\30d95ca3-738e-4ad9-8d53-a3cf67b1e8d2.docx
21
Government announcements). The latest version of the timetable is set out in the table below.
Table 9: Budget setting timetable 2019-20 to 2021-22
Activity/Milestone Time frame
County Council agree recommendations for 2018-22 including that further plans to meet the shortfall for 2019-20 to 2021-22 are brought back to Members during 2018-19
12 February 2018
Spring Statement 2018 announced 13 March 2018
Consider implications of service and financial guidance and context, and review / develop service planning options for 2019-22
February – June 2018
Member review of the latest financial position on the financial planning for 2019-22
July 2018
Development of savings proposals 2019-22 June – September 2018
Member review of service and budget planning position including savings proposals
Committees in October 2018
Consultation on new planning proposals and council tax 2019-22
November to December 2018
Chancellor’s Autumn Budget 2018 29 October 2018
Provisional Local Government Finance Settlement
December 2018
Service reporting to Members of service and financial planning and consultation feedback
January 2019
Committees agree revenue budget and capital programme recommendations to Policy and Resources Committee
Mid-January 2019
Confirmation of District Council tax base and Business Rate forecasts
31 January 2019
Final Local Government Finance Settlement TBC February 2019
Policy and Resources Committee agree revenue budget and capital programme recommendations to County Council
28 January 2019
County Council agree Medium Term Financial Strategy 2019-20 to 2021-22, revenue budget, capital programme and level of council tax for 2019-20
11 February 2019
8. Financial implications
8.1. Potentially significant financial implications for the Committee’s Budget are discussed throughout this report. Any implications of the Autumn Budget and the three changes expected to be implemented in 2020-21 will be reflected as far as possible in the Council’s 2019-20 budget planning, and these impacts will need to be refined as further information is made available by Government.
8.2. Specific financial risks in this area are also identified in the Corporate Risk Register, including the risk of failing to manage significant reductions in local and national
34
C:\Program Files (x86)\neevia.com\docConverterPro\temp\NVDC\1E155902-DCD5-490B-9FD4-F70048AFB848\30d95ca3-738e-4ad9-8d53-a3cf67b1e8d2.docx
22
income streams (RM002) and the risk of failure to effectively plan how the Council will deliver services (RM006).
8.3. Risks relating to budget setting are also detailed in the Council’s budget papers. There is a risk in relation to the Comprehensive Spending Review and the Fair Funding Review that a failure by the Government to provide adequate resources to fund local authorities could lead to a requirement for further service reductions, particularly where the Fair Funding Review results in a redistribution between authority types or geographical areas.
8.4. Much of Children’s Services spend is demand led, leading to associated difficulties
with both accurately predicting and managing the demand, and the related costs. Action is being taken to manage and reduce demand; though the impact of doing so can take time to flow through the wider system.
9. Issues, risks and innovation
9.1. Significant risks, assumptions, or implications have been set out throughout the report. Further comments on the primary risks for individual proposals are set out below.
More effective and efficient commissioning of mental health assessments:
The change to the approach is not embedded within staff teams resulting in assessments continue to be commissioning separately from care provision
Cost efficiencies delivered by strategic partnership and join commissioning with Mental Health Services
Redesign work is delayed due to lack of capacity or lack of engagement by some or all partners
Move to best practice model of parenting assessments
Additional travelling time reduces cost efficiencies
Norfolk Futures Safer Children and Resilient Families Programme: Better outcomes for children and young people and reducing demand for services
Unexpected increases in either the number of children looked after or the complexity of need
Unforeseen legislative changes to local authorities’ responsibilities
Difficulties recruiting, training and retaining staff for the skills mix required and / or suitably qualified and experienced in-house foster carers in excess of modelled turnover
9.2. Equality issues were considered in the Equality Impact Assessment of 2018-19
budget proposals. Decisions about significant savings proposals with an impact on levels of service delivery will require public consultation. As in previous years, new 2019-22 saving proposals, and the Council’s Budget as a whole, will be subject to equality and rural impact assessments later in the budget-setting process.
35

C:\Program Files (x86)\neevia.com\docConverterPro\temp\NVDC\1E155902-DCD5-490B-9FD4-F70048AFB848\30d95ca3-738e-4ad9-8d53-a3cf67b1e8d2.docx
23
Background Papers Norfolk County Council Vision and Strategy https://www.norfolk.gov.uk/what-we-do-and-how-we-work/policy-performance-and-partnerships/policies-and-strategies/corporate/council-vision-and-strategy Norfolk County Council Revenue and Capital Budget 2018-22 (Item 4, County Council 12 February 2018) http://norfolkcc.cmis.uk.com/norfolkcc/Meetings/tabid/70/ctl/ViewMeetingPublic/mid/397/Meeting/592/Committee/2/SelectedTab/Documents/Default.aspx Norfolk County Council Budget Book 2018-22 https://www.norfolk.gov.uk/-/media/norfolk/downloads/what-we-do-and-how-we-work/budget-and-council-tax/budget-book-2018-22.pdf?la=en Strategic and Financial Planning 2019-20 to 2021-22 (Item 10, Policy and Resources Committee, 16 July 2018) http://norfolkcc.cmis.uk.com/norfolkcc/Meetings/tabid/128/ctl/ViewMeetingPublic/mid/496/Meeting/1419/Committee/21/SelectedTab/Documents/Default.aspx Strategic and Financial Planning reports to Committees in September 2018 http://norfolkcc.cmis.uk.com/norfolkcc/Meetings.aspx Children’s Services Transformation Programme (Item 8, Children’s Services Committee, 11 September 2018) http://norfolkcc.cmis.uk.com/norfolkcc/Meetings/tabid/128/ctl/ViewMeetingPublic/mid/496/Meeting/1470/Committee/8/Default.aspx Strategic and Financial Planning 2019-20 to 2021-22 (Item 9, Policy and Resources Committee, 24 September 2018) http://norfolkcc.cmis.uk.com/norfolkcc/Meetings/tabid/128/ctl/ViewMeetingPublic/mid/496/Meeting/1420/Committee/21/SelectedTab/Documents/Default.aspx
Officer Contact If you have any questions about matters contained in this paper please get in touch with: Officer Name: Tel No: Email address: Sara Tough 01603 222600 [email protected] Simon George 01603 222400 [email protected] Fiona McDiarmid 01603 223810 [email protected]
If you need this report in large print, audio, Braille, alternative format or in a different language please contact 0344 800 8020 or 18001 0344 800 8020 (textphone) and we will do our best to help.
36

Children’s Services Committee Item No……
Report title: Exclusions in Norfolk Schools
Date of meeting: 16 October 2018
Responsible Chief Officer:
Sara Tough, Executive Director of Children’s Services
Strategic impact Children’s Services is committed to reducing the number of Permanent Exclusion from Norfolk’s schools. Current rates remain proportionally higher than the national average. This can impact negatively on both those pupils who are excluded, and on the capacity and resources available to the education system.
Executive summary To support this report, a presentation has been prepared for Committee to be delivered by the Head of the Education Achievement and Early Years Service and the Head of Education Vulnerable Groups Achievement and Access Service, providing an analysis of trends in exclusion in Norfolk and nationally, and outlining some actions being taken to address high exclusions. Understanding the picture for exclusions at a local and national level is complex. Each Local Authority (LA) will have different approaches and systems for working with schools in relation to exclusions. Some authorities, especially some smaller than Norfolk, have long established systems between schools where children move before an exclusion takes place, and so report no permanent exclusions at all. There are issues about the robustness of reporting exclusions both locally and nationally ad this again will be more, or less reliable in different authorities. This report will identify the data as we collect and collate it in Norfolk and will make some comparisons with the most recent national data where possible. It will not explore the reasons behind the data. The Task and Finish Group, set up by members of the Children’s Services Committee in 2016/17 explored reasons for exclusions by visiting schools and talking to professionals and children. This work was reported to the previous committee and led to specific actions which have been undertaken and remain a priority. The report does not name schools, nor distinguish between Academies and LA maintained schools. All but two secondary schools are now Academies and the number of primary phase exclusions, whilst unacceptably high is still too small to draw any conclusions when scrutinised by type of school. Recommendations: The Committee are requested to
note the contents of the report and the associated presentation;
provide comments to steer the direction of LA work to support the education system in Norfolk in being more inclusive and meet the needs of all pupils.
1. Background 1.1 The data in the report is drawn from Department for Education (DfE) statistics
published at https://www.gov.uk/government/collections/statistics-exclusions and our own database. DfE data is drawn from school census data, local authority data is sent directly by schools.
37
1.2 Local authority exclusions data is reliant on schools fulfilling their statutory duty to inform the local authority about all exclusions. For permanent exclusions we know this captures every exclusion. We know that fixed term exclusions are under reported and we are improving our processes to capture more of these.
1.3 DfE statistics are collected two terms in arrears to ensure that the period when an exclusion can be appealed has ended. This has the consequence that if a school closes and reopens as a sponsored academy there will be a loss of the final two terms of data from the school. The impact is that DfE statistics do not capture all exclusions.
2. Statutory Responsibilities 2.1 Statutory guidance is published by DfE which makes clear the legal
responsibilities in relation to exclusion at https://www.gov.uk/government/publications/school-exclusion.
2.2 A pupil may be excluded for one or more fixed periods (up to a maximum of 45
school days in a single academic year), or permanently. 2.3 Only the head teacher of a school can exclude a pupil and this must be on
disciplinary grounds. A decision to exclude a pupil permanently should only be taken in response to a serious breach or persistent breaches of the school's behaviour policy; and where allowing the pupil to remain in school would seriously harm the education or welfare of the pupil or others in the school.
2.4 Most fixed period exclusions last for one day. A fixed period exclusion can be for
part of the school day. Rarely (in less than 2% of cases), a fixed period exclusion lasts for more than one week, in which case the school must arrange suitable full-time education from the sixth school day of the exclusion. Schools should have a strategy for reintegrating a pupil who returns to school following a fixed-period exclusion and for managing their future behaviour.
2.5 Governing bodies are legally required to consider parents’ representations about
an exclusion and in some cases, including all permanent exclusions, consider the reinstatement of the excluded pupil.
2.6 If applied for by parents, the local authority or (in the case of an academy) the
academy trust must arrange for an independent review panel hearing to review the decision of a governing board not to reinstate a permanently excluded pupil.
2.7 Where pupils are permanently excluded, the local authority must arrange suitable
full-time education from the sixth school day of the exclusion. 3 National Context 3.1 National rates of permanent exclusions (number of exclusions per 100 pupils)
across all state-funded primary, secondary and special schools followed a downward trend from 2007 until 2013. Since 2013 national rates of exclusion have been increasing exponentially.
3.2 In response to concerns around the national increase in the use of permanent
exclusion, the DfE launched a Review of School Exclusion in March 2018, chaired by Edward Timpson CBE. Norfolk officers contributed to the review. The findings and recommendations of this review are expected by the end of 2018.
38

4. Exclusion data in Norfolk 4.1 The rate (number of excluded pupils per 100 pupils) of permanent exclusion in
Norfolk schools remains well above the average proportion nationally. Ten years ago, Norfolk permanent exclusion rates were below the national average and have increased since then, reaching a peak in 2015-16.
4.2 Permanent exclusion rates are declining in Norwich, Breckland and Broadland.
There was an increase in the number of PEX in King’s Lynn and West Norfolk last academic year.
4.3 Nationally and in Norfolk, the majority of exclusions are in secondary schools.
National rates of exclusion are increasing in primary and in secondary schools. 4.4 In Norfolk the high number of permanent exclusions in secondary schools has
remained at around 190 pupils in the last two years. Four in every ten exclusions are in years 9 or 10. The most common age for exclusion is 14.
4.5 The number of permanent exclusions in primary schools has fallen over the last
three years, from 83 to 66 pupils. 4.6 The use of permanent exclusion by Norfolk special schools is very infrequent. In
2017/18 no pupil was permanently excluded from a Norfolk Special School. 4.7 National rates of fixed term exclusion (FEX) followed a downward trend from
2007/08 until 2012/13, and like permanent exclusions, the rate has been rising since then.
4.8 Since 2009, Norfolk FEX rates have been similar to national rates. Norfolk FEX
rates remain in line with national figures in primary and secondary schools. The use of fixed term exclusion in Norfolk special schools is much lower than nationally.
4.9 Boys are far more likely to be excluded than girls in Norfolk and nationally. In
2017/18 boys accounted for 73% of all fixed term exclusions and 74% of all permanent exclusions.
4.10 The percentage of permanently excluded pupils who are eligible for Free School
Meals (FSM) in Norfolk has declined in the last three years. FSM pupils make up a disproportionately large proportion of all exclusions.
4.11 The proportion of exclusions of pupils with Special Educational Needs or
Disabilities (SEND) has declined significantly. The significant overall increase in exclusion nationally and in Norfolk has been of non-SEND pupils.
4.12 The overwhelming majority of exclusions in Norfolk are of white British pupils,
who represent around 80% of the Norfolk school population. Looking at data over several years as cohorts in Norfolk are very small - Gypsy/Roma and Traveller of Irish Heritage pupils and Black Caribbean pupils have the highest rates of fixed term exclusion, in line with national trends.
5. Local Authority action to reduce exclusion 5.1 In order to reduce the use of exclusion, we need to work in partnership with the
school system to bring about an increased confidence to meet the needs of
39

children and young people inclusively. We need to challenge more where practice is not inclusive and celebrate and share the best practice that exists within the system.
5.2 The annual conversation with every Academy Trust focused had a significant
focus on exclusion data during the most recent round. The local data has been shared with the Regional Schools Commissioner.
5.3 Schools are risk assessed by the LA. A key indicator in the risk assessment is
inclusion markers, including exclusion. This information, and the LA risk is shared with school leaders under a confidential agreement.
5.4 The most recent LA collated exclusion data, both permanent and fixed term, and
our analysis will be sent to all Norfolk schools this month, with an expectation that this is shared and discussed with governors where appropriate. Some schools where permanent and fixed period exclusion data is significant will receive a letter from the Assistant Director Children’s Services, Education, to ask for a specific meeting and expressing concern with regard to the volume of exclusions.
5.5 The Education Vulnerable Groups Achievement and Access Service (EVGAAS)
was created last January to promote the achievement and inclusion of vulnerable pupils. This service established a new Inclusion Helpline from January 2018, for schools, to provide a first line of support to schools when they need help - typically around challenging behaviour with a specific pupil. The helpline has been used well throughout the year and received 18 calls, from 14 different schools in the first 8 days of the 2017/18 autumn term.
5.6 EVGAAS have appointed two new Inclusion Challenge Partners whose role is to
work with school leaders to understand the inclusion issues facing schools and the school system. They will work in partnership to develop a deeper understanding of the culture within schools and Multi-Academy Trusts in order to target support and challenge appropriately in a timely manner.
5.7 Links are being developed between different services to provide a faster and
more informed response to concerns when they are raised. These relationships are being developed both within Norfolk County Council teams and with external agencies e.g. Carers’ Trust who provide support for young carers.
5.8 We are working with the Headteacher Association (Educate Norfolk) and the
Norwich Opportunity Area, sharing data to promote peer challenge and support around inclusion. Both the Head of the Education Vulnerable Groups Achievement and Access Service and the primary phase Inclusion Challenge Partner sit on the Inclusion steering group which in turn oversees the Norwich Inclusion Charter. A bid has been submitted for significant funding to work with schools signed up to the Norwich Inclusion Charter to develop more inclusive practice and, in the long term, more inclusive cultures within schools.
5.9 We are working with education leaders to find better mechanisms for children to
move through the system, to meet more pupils needs locally and return more pupils to a mainstream education.
6. Definition of terms and acronyms used in this report DfE – Department for Education (national government) PEX - Permanent exclusion
40

FEX – Fixed period exclusion (sometimes called fixed term exclusion) SEND – Special Educational Needs or Disabilities FSM – Free School Meals – pupils who are eligible for and claiming free school meals Exclusion rate – number of pupils excluded per 100 pupils on roll at the school as at the January Census day of the relevant academic year. EVGAAS – Education Vulnerable Groups Achievement and Access Service – an education service in Norfolk County Council children’s services set up in January 2018 to focus on improving outcomes for vulnerable children Norwich Opportunity Area one of the 12 DfE social mobility and opportunity areas (see https://www.gov.uk/government/publications/social-mobility-and-opportunity-areas) 7. Further information Statutory guidance: https://www.gov.uk/government/publications/school-exclusion National exclusion statistics: https://www.gov.uk/government/collections/statistics-exclusions
Officer Contact If you have any questions about matters contained or want to see copies of any assessments, eg equality impact assessment, please get in touch with: If you have any questions about matters contained in this paper please get in touch with: Officer Name: John Crowley Tel No: 01603 222557 Email address: [email protected]
If you need this report in large print, audio, Braille, alternative format or in a different language please contact 0344 800 8020 or 0344 800 8011 (textphone) and we will do our best to help.
41
1
Children’s Services Committee
Item No……
Report title: Social Work Assessment Performance
Date of meeting: 16 October 2018
Responsible Chief Officer:
Sara Tough, Executive Director of Children’s Services
Strategic impact
Under the Children Act 1989, Local Authorities are required to provide services for children in need for the purposes of safeguarding and promoting their welfare and undertaking an assessment of their needs in accordance with protocol outlined in Working Together 2018.
The completion of Social Work Assessments within 45 days is a key performance measure submitted in central data returns, a comparator nationally and regionally, and judged by the inspectorate, Ofsted, as a signifier of the quality of response in adequately protecting and offering support to children and their families locally. It is a hallmark of timely and decisive action taken on behalf of vulnerable children and young people.
Executive summary If following a referral to what was Norfolk’s Multi-Agency Safeguarding Service (now Norfolk’s Children’s Advice and Duty Service), there are indications through the initial triage and decision-making process that a child may be a child in need of services to safeguard them and/or promote their wellbeing, then Children’s Social Work Service will conduct a Social Work Assessment. In respect of the timeliness of Social Work Assessments, Norfolk’s social work teams have persistently underperformed across the County since September 2017 (12-month average figure of 65.5%), and have been an outlier in respect of national, regional and Statistical Neighbour comparison (National Average: 82.9%, Statistical Neighbour Average: 83.8% and Regional Average: 83.9%). This is in addition to falling markedly short of an internal target set at 80%. Previous meetings of the Children’s Services Committee, have requested a more detailed and updated account around that performance, the challenges underlying it and management actions taken to remedy and improve timeliness. This report summaries how the new Children’s Services and Social Work Senior Leadership Teams’ concerted focus, working alongside frontline teams and managers, and despite continued significant operational pressures, has resulted in recent improvements in assessments being completed on time. This is with a confidence that this trajectory can be maintained in a sustainable way that does not unduly compromise the quality of the work whilst solely achieving a deadline. Issues concerning the migration and system shift from Carefirst to Liquid Logic, has meant that reporting an accurate average monthly figure on assessment timeliness since April 2018 has not been possible until now.
42

2
Recommendations: That Committee make note of and comment on recent improvements in Social Work Assessment timescales and actions taken to achieve and sustain this improvement going forward.
1. Background and context 1.1 In respect of the timeliness of Social Work Assessments, Norfolk’s social work
teams have persistently underperformed across the County since September 2017 (12-month average figure of 65.5%), and have been an outlier in respect of national, regional and Statistical Neighbour comparison (National Average: 82.9%, Statistical Neighbour Average: 83.8% and Regional Average: 83.9%). This is in addition to falling markedly short of an internal target set at 80%.
1.2 There are a number of factors which have contributed to this less than optimal
performance, and include;
1.3 A legacy of a service under formal intervention for a prolonged period since 2013, meaning whilst frontline practice and management oversight has been improving over time, and formally recognised by Ofsted in their inspection November 2017, the quality, consistency and timeliness continues to need attention to ensure continual improvement.
1.4 Whilst Ofsted’s most recent judgement of the Council’s Children’s Services was ‘Requires Improvement’, a key remaining recommendation recognised that the large volume of referrals was overwhelming the staff at the front door leading to drift and delay for children.
1.5 This was resulting in too many assessments being undertaken, the majority of which (60%+) were not leading to a social work service, unmanageable caseloads in the social work assessment teams, and high turnover and reliance on locums.
1.6 As such, the quantity of assessments has significantly undermined the timeliness, and to an extent the quality of assessments, which has been an urgent priority and focus of the social work management team, recognising that whilst this is a process target, at the core of it remains decisive and purposeful action to safeguard and protect children.
2. Actions to address 2.1 A change in operational management in MASH following inspection in November
2017 and focusing on improved processes and management oversight at the front door, has seen a 15% decrease over time in new assessments being initiated across the County and increase in those assessments leading to a social work service from 32.2% to 42.5%. This has helped reduce caseloads gradually and create an environment where greater attention can be paid to timeliness and quality as volume is decreased.
2.2 An external and comprehensive review of MASH/front door arrangements
reported at last Committee, suggesting that the introduction of the new Children’s
43

3
Advice and Duty Service approach from 17/10/18, should reduce assessment levels by a further 1/3, will enhance this further, and will accelerate improvements in qualitative and quantitative performance.
2.3 A new performance management framework introduced in June 2018, means that all social work teams, including assessment teams, are now expected to meet on a weekly basis to address performance in proactive ways, where those assessments at periodic intervals and nearing the 45-day deadline are prioritised for completion.
2.4 Temporary gaps in Liquid Logic reporting functionality to date has been dealt with by development of a Social Work Assessment Tracker which is sent around to managers on a weekly basis, which gives a locality by locality breakdown and trends in relation to assessments that are ‘In Time’, ‘Becoming Overdue’ (open between 34-45 days) and ‘Overdue’. This allows operational managers to target their actions and individual workers earlier where there may be a breach of timescales.
2.5 There is oversight of the tracker at the weekly Social Worker Leadership Team chaired by the Assistant Director for Social Work where improvements or drops in performance in any specific area or locality can be explored and acted on.
2.6 Alongside more rigorous monitoring of assessment timescales, there is a focus on the quality of assessments, to ensure that good practice that is analytical, curious and effective, is being evidenced and most importantly is the foundation for decision-making and interventions that support children at the right level and right time.
2.7 To this end the Quality Assurance Team are undertaking audit of assessment work across all 6 localities, including an evaluation of management grip and decision making. In the case of 1 locality, poor performance in respect of the later was identified and robust performance of that individual manager has led to their departure from the service.
2.8 Alongside auditing, Assessment and Analysis workshops are being held with all
assessment teams and a ‘Getting To Good Assessment & Planning’ workshop is included in the NIPE induction package for newly qualified Social Workers.
3. Impact and current performance 3.1 There has been a significant increase in the percentage of Social Work
Assessments completed and authorised in 45 working days since the low of 50.2% in February 2018. August’s figure of 78.10% is the highest in the past 12 months and for 2 consecutive months we have been close to our 80% target.
44

4
3.2 The data also shows that where cases are of a more serious concern e.g.
requiring child protection intervention, then completion of those assessments are prioritised;
% of SWA with CP/ strategy discussion as an outcome completed in 45 w/d
% of SWA with CIN as an outcome completed in 45 w/d
May-18 86% 53%
Jun-18 83% 62%
Jul-18 81% 70%
Aug-18 70% 80%
Sep-18 93% 79%
Average 82.6% 68.80%
3.3 Using the Social Work Assessment Tracker, locality performance for authorising
assessment within 45 working days can be broken down as follows;
Locality No SWA no completed in 45 w/d % in 45 w/d
Breckland 90 88 97.8%
Gt Yarmouth 97 71 73.2%
North and Broadland 53 44 83.0%
Norwich 100 65 65.0%
South 104 58 55.8%
West 104 98 94.2%
3.4 This shows significant difference in performance with Breckland and West both
over 90%, whilst South completed only 55.8% in timescales. However, this reflects known issues regarding staffing and management within the Assessment Teams in the locality which are being addressed.
45

5
3.5 It is also acknowledged that with the introduction of weekly analysis of open assessments, there has been a focus on ensuring overdue assessments are completed and closed, which will have had an impact on those localities clearing a backlog of overdue assessments, and in addition to greater management oversight and challenge on quality, can result in a temporary, but defensible, drop or slowing in improvement rates concerning timelines.
3.6 Whilst Norwich’s performance is under 70%, this is a significant improvement
from 36% in March and 49% in April. Breckland have improved from a low of 36% in March, whilst North and Broadland’s performance is over 80% for the first time in 12 months, the previous high being 70% in August 2017. West have maintained their previously good performance, whilst Gt Yarmouth have remained fairly static.
4. Conclusion and next steps 4.1 There is clear evidence demonstrated in this report that progress has been made
in improving the completion of Social Work Assessments within timescale that is bringing Norfolk increasingly close to national, regional and statistical neighbour performance.
4.2 Likewise, that the groundwork is being prepared for further improvement to meet
and exceed the Council’s 80% target, that is now well within reach. 4.3 However, the service recognises the significance of this particular indicator as a
measure of addressing unacceptable drift and delay for children. As such, it commits to continued focus in this area, not only to address timeliness, but with reduced volumes, drive down on the quality and purposefulness of social work interventions at this stage.
Officer Contact If you have any questions about matters contained or want to see copies of any assessments, eg equality impact assessment, please get in touch with: If you have any questions about matters contained in this paper, please get in touch with: Officer Name: Phil Watson Tel No: 01603 217653 Email address: [email protected]
If you need this report in large print, audio, Braille, alternative format or in a different language please contact 0344 800 8020 or 0344 800 8011 (textphone) and we will do our best to help.
46

Children’s Services Committee
Report title: Joint Consultative Committee revision to terms of reference
Date of meeting: 16 October 2018
Responsible Chief Officer:
Sara Tough, Executive Director of Children’s Services
Strategic impact The teachers’ Joint Consultative Committee (JCC) is the mechanism through which the LA (as employer in some maintained schools) consults with teachers’ representatives on issues affecting employees, such as terms and conditions. The proposals to amend the terms of reference of this group reflect the changing education landscape, and the complexities of the LA as employer within that context.
Executive summary The proposal is to refocus the group in a way that recognises the employer obligations whilst recognising that the LA is just one part of an educational system with many layers of accountability. The proposals are that the representation on the group is reduced on both sides and will include representation from school governors. Recommendations: That the attached draft terms of reference are approved for consideration at the first revised JCC. That membership of the revised JCC is made up of four members of Children’s Services Committee. That the Chair of CS Committee continues to be one of the four members of the revised JCC arrangement and that three other members are nominated for membership.
1. Proposal 1.1 The proposal is to streamline the arrangements for JCC to more properly reflect
the position of the LA as the employer in some maintained schools and to work with a smaller group of both employer and employee representatives.
1.2 JCC originally had a membership make up comprising eleven employer
representatives and eleven trade union representatives. The proposals allow for a reduction in membership numbers to four on each side, plus an associate member representing school governors.
1.3 The aim is to allow JCC to work more efficiently, with a real focus on issues
affecting the teacher workforce within schools. 1.4 Trade union representatives of the group have been consulted and are in favour
of the changes. Cllr David Collis has also been involved in discussions about the changes.
47

2. Evidence 2.1 The group has jointly agreed this is the right way to shape itself for the future.
The reduction in membership numbers will not adversely affect representation as all unions remain represented.
3. Financial Implications 3.1 There are no cost implications, other than a reduction in the cost of time spent on
attending, as there will be fewer attendees.
4. Issues, risks and innovation 4.1 This has been jointly discussed and the terms of reference jointly agreed-
employment responsibilities have been considered.
5. Background Background Papers Draft terms of reference.
Officer Contact If you have any questions about matters contained or want to see copies of any assessments, eg equality impact assessment, please get in touch with: If you have any questions about matters contained in this paper please get in touch with: Officer Name: Chris Snudden Tel No: 01603 223492 Email address: [email protected]
If you need this report in large print, audio, Braille, alternative format or in a different language please contact 0344 800 8020 or 0344 800 8011 (textphone) and we will do our best to help.
48

DRAFT – February 2018
1
NORFOLK COUNTY COUNCIL
DRAFT TERMS OF REFERENCE OF THE JOINT CONSULTATIVE
COMMITTEE
(TEACHERS)
Membership
Four elected members of the Children’s Services Committee including the Chair of the
Children’s Services Committee to be appointed annually by the Children’s Services
Committee.
Four teachers to be appointed by the unions as follows:
NEU 1
NASUWT 1
Association of Teachers and Lecturers 1
Association of School and College Leaders 1
The Committee will be chaired by the Chair of the Children’s Services Committee
when present and in his/her absence, by one of the teacher representatives.
The Assistant Director, Children’s Services and one of the appointed teachers act as Joint Secretaries to the Committee.
The Assistant Director, Children’s Services may call other officers to attend as required.
Purpose of the Committee
The purpose of the Committee is to provide a forum in which members, officers and
unions work together in a changing and variable educational landscape to ensure that
staff can work effectively for the benefit of Norfolk children.
49

DRAFT – February 2018
2
Terms of reference
1) To establish a means of consultation between the Local Authority and its
teachers where that is required
2) To establish a means of communication for major organisational projects or
changes planned by the Local Authority
3) To establish the means of consulting on health and safety issues
4) To consider any relevant matter referred to it by the Children’s Services
Committee or by the teachers. Matters raised by teachers should be put forward
by their own Joint Secretary and should reflect an understanding of the reach of
the Local Authority in schools and academies.
Meetings
The Committee will meet once a term.
The joint secretaries will agree on the agenda before each meeting and this will be
circulated 5 working days before the meeting, along with minutes of the last meeting.
A minute taker will attend all meetings, unless the JCC agrees otherwise.
The quorum of the Committee is two representatives of each side.
If a resolution is to be carried, it requires a majority of the members present on each
side of the Committee In the event of the Committee being unable to arrive at an
agreement or Children’s Service Committee disagreeing with the recommendations of
the Committee, the Children’s Services Committee’s decision is final.
Proceedings of the Committee will be reported as necessary to the Children’s Services
Committee.
50

Children’s Services Committee Item No.
Report title: Risk Management
Date of meeting: 16 October 2018
Responsible Chief Officer:
Sara Tough, Executive Director of Children’s Services
Strategic impact One of the Children’s Services Committee’s roles is to consider the management of Children’s Services risks. Assurance on the effectiveness of risk management and the Children’s departmental risk register helps the Committee undertake some of its key responsibilities. Risk Management contributes to achieving departmental objectives, and is a key part of the performance management framework.
Executive summary
This report provides the Committee with the Children’s departmental risk register, as at October 2018, following the latest review conducted in September 2018. The reporting of risk is aligned with, and complements, the performance and financial reporting to the Committee.
Recommendations: Members are asked to consider:
a) The corporate and departmental risks reported on the Children’s Services departmental risk register, in the risk register report (Appendix A);
b) whether the recommended mitigating actions identified in Appendix A for the risks presented are appropriate, or whether risk management improvement actions are required (as per Appendix B);
c) The background information on risk management (Appendix C).
1. Proposal
1.1 The recommendations for Members to consider are set out above.
2. Evidence
2.1. The Children’s Services Committee risk data detailed in this report reflects those key business risks that are managed by the Children’s Services Leadership Team, and Senior Management Teams of the services that report to the Committee including Early Help, Social Work, Education, and Performance and Challenge. Key business risks materialising could potentially result in a service failing to achieve one or more of its key objectives and/or suffer a financial loss or reputational damage. The Children’s Services departmental risk register is regularly reviewed and updated in accordance with the Council’s Risk Management Policy and Procedures.
2.2. The latest progress against the risks on the Children’s Services departmental
51
risk register can be viewed in the context of the full risks at Appendix A. In summary:
For RM014a - The increasing demand for SEND assessments coupled with the amount spent on home to school transport at significant variance to predicted best estimates, A Member/Officer deep dive within Children’s Services took place in August 2018 to further explore the element of current strategic planning within the context of a commitment in principle to build 4 new special schools and 170 more specialist resource base places to increase special school capacity, reduce travel time and associated travel costs.
For RM14157 - Lack of Corporate capacity and capability reduces the ability of Children's Services to improve, the data flowing from the new system is still somewhat limited in terms of reporting the reporting capability. The Intelligence & Analytics team are working to resolve this, with Children’s Services closely monitoring progression with resolution.
For RM14148 - Over reliance on agency social workers, there is a detailed action plan to reduce the reliance on agency workers, and if successful this will be within tolerance by July 2019, when we will only be using agency workers to cover maternity/paternity and sickness.
For RM13906 - Looked After Children overspends, the plans to prevent the need to accommodate children and when accommodated to return them home when it is safe to do so are becoming established. We expect to see a decrease in numbers as these plans begin to have impact.
2.3.
2.4.
To assist Members with considering whether the recommended actions identified in this report are appropriate, or whether another course of action is required, a list of such possible actions, suggested prompts and challenges are presented for information in Appendix B.
A note of the criteria used to determine which risks sit at which level can be located at Appendix C of this report.
3. Financial Implications
3.1. The financial implications for the risks identified in this risk report relate to SEND transport spend and increasing demand for EHCP’s, the increase in children becoming looked after and the cost of agency social workers versus the cost of a permanent children’s social work workforce. These financial implications continue to be addressed and are noted within the risks.
4. Issues, risks and innovation
4.1. We are currently undertaking an exercise to identify and formally document any further service level risks not already recorded within the different services of the department. Going forward, these will be managed on service level risk registers.
5. Background
52

5.1. Background information regarding risk scoring, can be found in Appendix C.
Officer Contact If you have any questions about matters contained in this paper or want to see copies of any assessments, eg equality impact assessment, please get in touch with:
Officer name : Debby McKechnie Tel No. : 01603 223172
Email address : [email protected]
Officer name : Thomas Osborne Tel No. : 01603 222780
Email address : [email protected]
If you need this report in large print, audio, braille, alternative format or in a different language please contact 0344 800 8020 or 0344 800 8011 (textphone) and we will do our best to help.
53

Lik
elih
oo
d
Imp
act
Ris
k s
core
Lik
elih
oo
d
Imp
act
Ris
k s
core
Lik
elih
oo
d
Imp
act
Ris
k s
core
Target
Date
Prospects
of meeting
Target Risk
Score by
Target Date
3 3 9 5 3 15 2 2 4 Mar-19 Amber
Continue to enforce education transport policy, and work with commissioners re school placements.
Continually review the transport networks, to look for integration and efficiency opportunities.
Work with Norse to reduce transport costs and ensure the fleet is used efficiently and effectively.
Look for further, more innovative, ways to plan, procure and integrate transport.
Overall risk treatment: Treat
Progress update
The year-end figure for FY2017/18 confirmed ongoing underspends for mainstream and post 16 transport
and ongoing overspend for SEN transport; we anticipate a similar pattern of spend against budget for the
FY2018/19 with potential pressure of approx. £450k. Currently, the strategy to address this overspend
pressure remains the same, i.e : Norfolk County Council and HCT independent travel training joint
initiative is now being implemented with a payment by results model, based on 100 pupils per year over 5
years to deliver a proportion of savings required. Recently (summer term) P&R Committee & CS
Committee have received the outputs of the consultants, Red Quadrant, review of SEN transport and
both committees have asked for these to be considered within the context of a commitment in principle to
build 4 new special schools and 170 more specialist resource base places to increase special school
capacity, reduce travel time and associated travel costs. A Member/Officer deep dive within Children’s Services took place in August 2018 to further explore this element of current strategic planning.
Risk Description
There is an increasing demand on services as our numbers of SEND are rising, this coupled with
ensuring there is appropriate sufficient placement choice is having an impact on cost. Rising transport
costs, the nature of the demand-led service (particularly for students with special needs) and the inability
to reduce the need for transport or the distance travelled will result in a continued overspend on the home
to school transport budgets and an inability to reduce costs.
Original Current Tolerance Target
Tasks to mitigate the risk
Risk NameThe increasing demand for SEND assessments coupled with the amount spent on
home to school transport at significant variance to predicted best estimates
Risk Owner Chris Snudden Date entered on risk register 04 November 2015
Appendix A
Risk Number RM014a Date of update 25 September 2018
54

Lik
elih
oo
d
Imp
act
Ris
k s
core
Lik
elih
oo
d
Imp
act
Ris
k s
core
Lik
elih
oo
d
Imp
act
Ris
k s
core
Target
Date
Prospects
of meeting
Target Risk
Score by
Target Date
4 4 16 3 4 12 2 3 6 Dec-18 Amber
A new locality panel to allocate resource earlier will commence within the month of October 2018. A
centralised and integrated commissioning approach has now been established. A Social Impact Bond has
been agreed to commence January 2019 providing intensive family therapy to keep families together. An
extensive programme of transformation is focused on looked after children analysis spend and prediction
of future need and spend.
Overall risk treatment: Treat
Progress update
The plans to prevent the need to accommodate children and when accommodated to return them home
when it is safe to do so are becoming established. We expect to see a decrease in numbers as these
plans begin to have impact. Risks prevail as other agencies also see a decrease in funded activity which
reduces available resources to support families.
Risk Description
That the Looked After Children’s budget could result in significant overspends that will need to be funded from elsewhere within Children’s Services or other parts of Norfolk County Council
Original Current Tolerance Target
Tasks to mitigate the risk
Risk Name Looked After Children overspends
Risk Owner Sara Tough Date entered on risk register 18 May 2011
Appendix A
Risk Number RM13906 Date of update 25 September 2018
55

Lik
elih
oo
d
Imp
act
Ris
k s
core
Lik
elih
oo
d
Imp
act
Ris
k s
core
Lik
elih
oo
d
Imp
act
Ris
k s
core
Target
Date
Prospects
of meeting
Target Risk
Score by
Target Date
3 5 15 3 3 9 1 3 3 Dec-18 Amber
Corporate sign-up to support Children's Services, with all support Departments prioritising Children's
Services.
Replacement Social Care Recording System (Liquidlogic) went live in May 2018. This will have a positive
impact on the number and type of report available to managers with the ability to 'self serve'. It will also
mean that with the ability to work remotely workers will have added efficiencies built into their day.
Liquidlogic and its proposed support model will mean a streamlined support service to all system users
that will reduce the need for direct contact with Intelligence & Analytics.
Overall risk treatment: Treat
Progress update
Liquidlogic system was implemented and has begun to embed into day to day practice, the workforce talk
mostly positively about the new system. The data flowing from the new system is still somewhat limited in
terms of reporting the reporting capability. The Intelligence & Analytics team are working to resolve this.
Given the progress with initial mobilisation and roll out of phase 2 the risk continues to reduce with the
exception of reporting.
Risk Description
Lack of NCC capacity and infrastructure to support the back-office functions that Children's Services
needs in particular ICT and I&A capacity limitations
Original Current Tolerance Target
Tasks to mitigate the risk
Risk NameLack of Corporate capacity and capability reduces the ability of Children's Services to
improve.
Risk Owner Sara Tough Date entered on risk register 13 March 2014
Appendix A
Risk Number RM14157 Date of update 25 September 2018
56

Lik
elih
oo
d
Imp
act
Ris
k s
core
Lik
elih
oo
d
Imp
act
Ris
k s
core
Lik
elih
oo
d
Imp
act
Ris
k s
core
Target
Date
Prospects
of meeting
Target Risk
Score by
Target Date
4 5 20 2 4 8 1 3 3 Jul-19 Green
Greater understanding of workforce data as it relates to geographical variation and the County as a
whole.
Review and update of our offer to social workers, to include the new social care academy.
Where agency staff are working in operational teams, we will seek to retain the same worker in each role
until a substantive replacement is secured.
Overall risk treatment: Treat
Progress update
There is a detailed action plan to reduce the reliance on agency workers, if successful this will be within
tolerance by July 2019, when we will only be using agency workers to cover maternity/paternity and
sickness.
Risk Description
Overreliance on interim capacity in social worker teams leads to unsustainable performance
improvement.
Original Current Tolerance Target
Tasks to mitigate the risk
Risk Name Over reliance on agency social workers
Risk Owner Sara Tough Date entered on risk register 01 December 2013
Appendix A
Risk Number RM14148 Date of update 25 September 2018
57

Appendix B Risk management discussions and actions
Reflecting good risk management practice, there are some helpful prompts that can help scrutinise risk, and guide future actions. These are set out below.
Suggested prompts for risk management improvement discussion
In reviewing the risks that have met the exception reporting criteria and so included in this report, there are a number of risk management improvement questions that can be worked through to aid the discussion, as below:
1. Why are we not meeting our target risk score? 2. What is the impact of not meeting our target risk score? 3. What progress with risk mitigation is predicted? 4. How can progress with risk mitigation be improved? 5. When will progress be back on track? 6. What can we learn for the future?
In doing so, committee members are asked to consider the actions that have been identified by the risk owner and reviewer.
Risk Management improvement – suggested actions A standard list of suggested actions have been developed. This provides members with options for next steps where reported risk management scores or progress require follow-up and additional work. All actions, whether from this list or not, will be followed up and reported back to the committee. Suggested follow-up actions
Action Description
1 Approve actions Approve recommended actions identified in the exception reporting and set a date for reporting back to the committee
2 Identify alternative/additional actions
Identify alternative/additional actions to those recommended in the exception reporting and set a date for reporting back to the committee
3 Refer to Departmental Management Team
DMT to work through the risk management issues identified at the committee meeting and develop an action plan for improvement and report back to committee
4 Refer to committee task and finish group
Member-led task and finish group to work through the risk management issues identified at the committee meeting and develop an action plan for improvement and report back to committee
5 Refer to County Leadership Team
Identify key actions for risk management improvement and refer to CLT for action
6 Refer to Policy and Resources Committee
Identify key actions for risk management improvement that have whole Council ‘Corporate risk’ implications and refer them to the Policy and Resources committee for action.
58

Background Information Appendix C
A corporate risk is one that requires:
strong management at a corporate level, thus the County Leadership Team should direct any action to be taken.
input from more than one Executive Director for mitigating any cross departmental tasks. If not managed appropriately, it could potentially result in the County Council failing to achieve one or more of its key corporate objectives and/or suffer a significant financial loss or reputational damage.
A departmental risk is one that requires:
strong management at a departmental level thus the Departmental Management Team should direct any action to be taken.
input from the departmental management team. If not managed appropriately, it could potentially result in the County Council failing to achieve one or more of its key departmental objectives and/or suffer a significant financial loss or reputational damage.
A Service Risk is one that requires:
strong management at a service level, thus the Head of the Service should direct any action to be taken.
input from the Head of Service for mitigating tasks. If not managed appropriately, it could potentially result in the County Council failing to achieve one or more of its key service objectives and/or suffer a significant financial loss or reputational damage.
Each risk score is expressed as a multiple of the impact and the likelihood of the event occurring.
Original risk score – the level of risk exposure before any action is taken to reduce the risk
Current risk score – the level of risk exposure at the time the risk is reviewed by the risk owner, taking into consideration the progress of the mitigation tasks
Target risk score – the level of risk exposure that we are prepared to tolerate following completion of all the mitigation tasks.
The prospects of meeting target scores by the target dates reflect how well the risk owners
consider that the mitigation tasks are controlling the risk. It is an early indication that additional
resources and tasks or escalation may be required to ensure that the risk can meet the target
score by the target date. The position is visually displayed for ease in the “Prospects of meeting the target score by the target date” column as follows:
• Green – the mitigation tasks are on schedule and the risk owner considers that the target
score is achievable by the target date.
• Amber – one or more of the mitigation tasks are falling behind and there are some concerns
that the target score may not be achievable by the target date unless the shortcomings are
addressed.
• Red – significant mitigation tasks are falling behind and there are serious concerns that the
target score will not be achieved by the target date and the shortcomings must be addressed
and/or new tasks introduced.
59

1
Children’s Services Committee
Report title: Committee Forward Plan and update on decisions
taken under delegated authority
Date of meeting: 16 October 2018
Responsible Chief
Officer:
Sara Tough
Executive Director of Children’s Services
Strategic impact Providing regular information about key service issues and activities supports the
Council’s transparency agenda and enables Members to keep updated on services within their remit. It is important that there is transparency in decision making processes to enable
Members and the public to hold the Council to account.
Executive summary This report sets out the Forward Plan for Children’s Services Committee. The Forward Plan is a key document that enables Members to shape future meeting agendas and items for consideration. Each of the Council’s committees has its own Forward Plan, and these are published monthly on the County Council’s website. The current Forward Plan for this Committee is included at Appendix A.
This report is also used to update the Committee on relevant decisions taken under delegated powers by the Executive Director (or her team), within the Terms of Reference of this Committee. There are no relevant delegated decisions to report to this meeting.
Recommendations:
1. To review the Forward Plan at Appendix A and identify any additions, deletions
or changes to reflect key issues and priorities the Committee wish to consider.
1. Proposal
1.1. Forward Plan
1.1.1. The Forward Plan is a key document for this committee in terms of considering
and programming its future business.
1.1.2. The current version of the Forward Plan is attached at Appendix A.
1.1.3. The Forward Plan is published monthly on the County Council’s website to enable service users and stakeholders to understand the planning business for
this Committee. As this is a key document in terms of planning for this
Committee, a live working copy is also maintained to capture any
changes/additions/amendments identified outside the monthly publishing
60

2
schedule. Therefore, the Forward Plan attached at Appendix A may differ slightly
from the version published on the website. If any further changes are made to
the programme in advance of this meeting they will be reported verbally
to the Committee.
1.2. Delegated decisions
1.2.1. The report is also used to update on any delegated decisions within the Terms of
Reference of this Committee that are reported by the Executive Director as being
of public interest, financially material or contentious. There are no relevant
delegated decisions to report for this meeting.
Evidence
2.1. As set out in the report and appendices.
3. Financial Implications
3.1. There are no financial implications arising from this report.
4. Issues, risks and innovation
4.1. There are no other relevant implications to be considered by Members.
5. Background
5.1. N/A
Officer Contact If you have any questions about matters contained in this paper or want to see copies of
any assessments, eg equality impact assessment, please get in touch with:
Officer name : Sara Tough Tel No. : 01603 222600
Email address : [email protected]
If you need this report in large print, audio, braille,
alternative format or in a different language please contact
0344 800 8020 or 0344 800 8011
(textphone) and we will do our best to help.
61
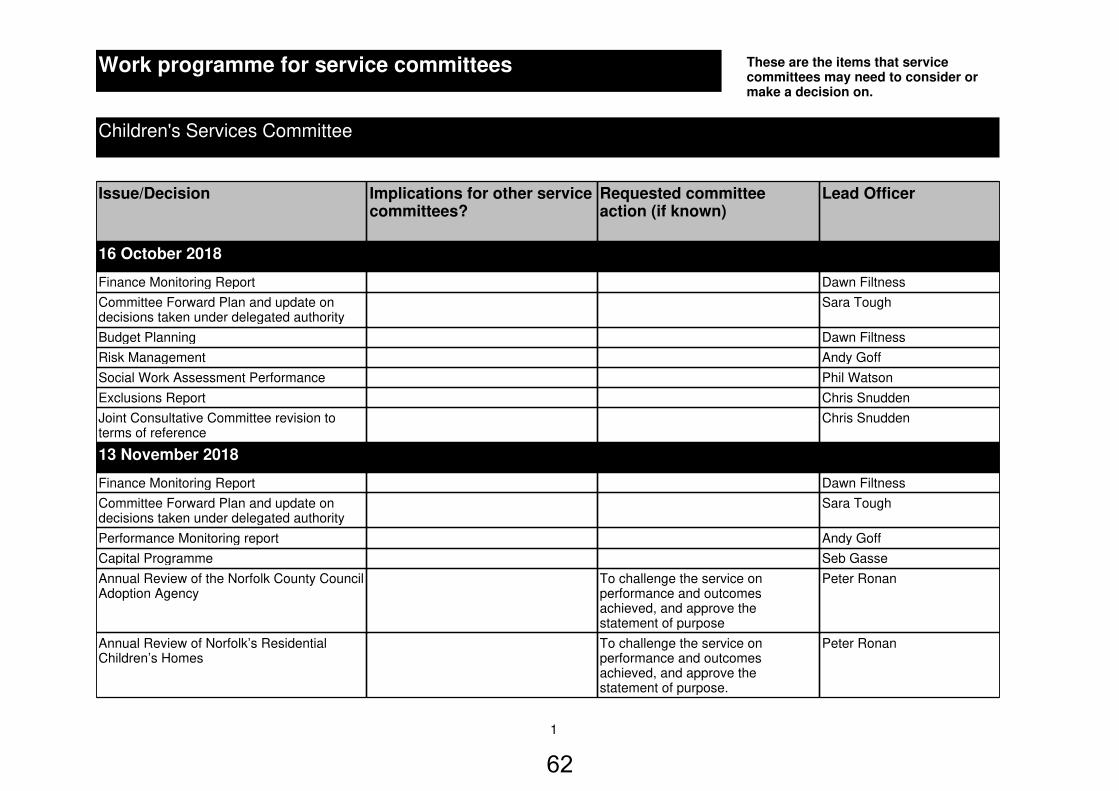
Issue/Decision Implications for other service committees?
Requested committee action (if known)
Lead Officer
16 October 2018
Finance Monitoring Report Dawn Filtness
Committee Forward Plan and update on decisions taken under delegated authority
Sara Tough
Budget Planning Dawn Filtness
Risk Management Andy Goff
Social Work Assessment Performance Phil Watson
Exclusions Report Chris Snudden
Joint Consultative Committee revision to terms of reference
Chris Snudden
13 November 2018
Finance Monitoring Report Dawn Filtness
Committee Forward Plan and update on decisions taken under delegated authority
Sara Tough
Performance Monitoring report Andy Goff
Capital Programme Seb Gasse
Annual Review of the Norfolk County Council Adoption Agency
To challenge the service on performance and outcomes achieved, and approve the statement of purpose
Peter Ronan
Annual Review of Norfolk’s Residential Children’s Homes
To challenge the service on performance and outcomes achieved, and approve the statement of purpose.
Peter Ronan
Children's Services Committee
1
Work programme for service committees These are the items that service committees may need to consider or make a decision on.
62

Issue/Decision Implications for other service committees?
Requested committee action (if known)
Lead Officer
Annual Review of Norfolk’s Fostering Service To challenge the service on performance and outcomes achieved, and approve the statement of purpose.
Peter Ronan
Recruitment & Retention Elly Starling
SEND Sufficiency & Transformation Strategy Michael Bateman
22 January 2019
Finance Monitoring Report Dawn Filtness
Committee Forward Plan and update on decisions taken under delegated authority
Sara Tough
Budget Planning Dawn Filtness
Performance Monitoring report Andy Goff
Determination of 2020/21 Admissions arrangements
Sebastian Gasse
Local Growth & Investment Plan Seb Gasse
Children's Centre Consultation Sarah Jones
12 March 2019
Finance Monitoring Report Dawn Filtness
Committee Forward Plan and update on decisions taken under delegated authority
Sara Tough
Performance Monitoring report Andy Goff
Validated Post 16 Education Outcomes Seb Gasse
Review of Children's Services MASH Phil Watson
2
Work programme for service committees These are the items that service committees may need to consider or make a decision on.
63