Chiba Bank IR Day
28
April 2016 Chiba Bank IR Day
Transcript of Chiba Bank IR Day

April 2016
Chiba Bank IR Day

Organization
Loans for Corporate Customers
Group Subsidiaries
Branch Network Strategy
Housing Loans
Sales of Investment Type Financial Products
Business Environment
Purposes
Achievements
Spreading Effect
Achievements
Channels
Promotions
Video Advertisements for Quick Power
Management Policy
1
Table of Contents
Business Strategy
Inheritance-related Business
Unsecured Consumer Loan Business
3
4
5
6
7
8
10
11
12
13
15
16
17
18
Chiba – Musashino Alliance (1)
Chiba – Musashino Alliance (2)
TSUBASA Alliance (1)
TSUBASA Alliance (2)
Alliance Strategies
Capital Policy
(Reference)
Summary of Financial Results for the Third Quarter of FY2015
Deposit and Loan Portfolios as of December 2015
20
21
22
23
24
25
26
27

Business Strategy
2
Business Strategy

3
Organization
●Operation Planning
Division
●EDP System Division
●IT Strategy Office
●Business Operation
Division
●Operation Division
●Business Promotion Division
●Customer Service Division
●Corporate Business Division
●Regional Revitalization Division
●Trust Business Division
●Consumer Loan Business Division
●Retail Business Division
●Asset Management Support
Division
●Treasury Division
●Treasury Operation Division
●Credit Division
●Business Support
Division
●General
Secretariat
●Corporate Planning Division
●Public Relations and CSR Division
●Corporate Administration Division
●Human Resources Division
●Diversity Management Division
●Risk Management Division
●Compliance Division
●Audit and
Inspection
Division
Board of Directors
Board of Designated Directors
Audit & Supervisory Board Members
Audit & Supervisory Board
Staff
General Meeting of Shareholders
Business Promotion HeadquartersCorporate Planning and
Administration Headquarters(Operation and
EDP System Unit) (Credit Unit)
(Internal Audit and
Inspection Unit)

3,534.2
3,722.1 3,800.0
4,200.0
3,000
3,500
4,000
4,500
14/12 15/12 17/3 20/3
4,533
3,285
4,400
5,000
0
2,000
4,000
6,000
FY14 FY15 FY16 FY19
Provide effective solutions for core companies in the region
Business matching and M&A, etc.
4
Rank Bank Number of Customers
in 2015
1 Chiba Bank 20,915
2 Nishi-Nippon City Bank 19,933
3 Fukuoka Bank 19,589
4 Shizuoka Bank 16,564
5 Joyo Bank 15,940
Loans for Corporate Customes
Regional Revitalization
Subcommittee
Regional Revitalization / Regional Vitalization Committee (2015.8)
Evaluation of Customers’
Business Potential Subcommittee
Target for the term
Progress 75%
Wider Chiba regional vitalization fund (2015.10)
Chibagin regional revitalization loan program (2015.11)
Balance of SME loans Number of new corporate loan customers(Excluding customers of wholesale branches outside Chiba)
(¥Bil.) (Cases)
(Target) (Reference)(Apr.-Dec.) (Target) (Reference)
Lending based on the Evaluation of Customers’ Business
Potential and Support for their Main Business Main Bank Survey (Regional Banks)
Source: Teikoku Databank

Discovering needs Product proposals Contract / Inspection
�Relocate nine subsidiaries to the same building (Scheduled 2016.5)
Group Subsidies
5
13 Group companies
Chibagin Makuhari Building
2,193
3,533 3,3664,007 3,787
5,7654,77959
7364
101
121140
121
0
50
100
150
0
2,000
4,000
6,000
8,000
1Q14 2Q14 3Q14 4Q14 1Q15 2Q15 3Q15
“Revitalize Chiba Pref.” strategic plan (2015.9)・Chibagin Research Institute takes on
consulting services for planning strategies
Securities, Credit Card and Leasing Research and Consulting
Chibagin Securities Co., Ltd.
◆Chibagin JCB Card Co., Ltd.
◆Chibagin DC Card Co., Ltd.
◆Chibagin Leasing Co., Ltd.
◆Chibagin Research Institute, Ltd.
◆Chibagin Capital Co., Ltd.
Chibagin Asset Management Co., Ltd.
◆Chibagin Computer Service Co., Ltd.
Personnel Services and Outsourcing Credit Guarantee and Credit Management
◆Chibagin Career Service Co., Ltd.
Chibagin Heartful Co., Ltd.
◆Sobu Co., Ltd.
Chibagin Guarantee Co., Ltd.
◆Chiba Servicer Co., Ltd.
Intermediation of lease transactions (2015.4)・Discovering needs and concrete lease proposals by Bank
Bank
Chibagin Leasing
Integrated Group Management Operating results of Chibagin Leasing
Number of new customers (right)
Amount of primary lease inspection (left)
(¥Mil.) (Customers)

Review of branch functions and renewals
6
Shinagawa Branch (Upgraded to branch in 2015.7)
Shinjuku Branch
Ebisu Corporate
Banking Office (2015.10)・SME Loans
・High-net-worth clients
Tokyo 23 wards “Strategic Operating Area”
Branch Network Strategy
0
200
400
600
800
1,000
1,200
05/3 07/3 09/3 11/3 13/3 15/3
Chiba
160 branches
Ibaraki 3 branchesSaitama 3 branches
Tokyo 13 branches
Osaka 1 branch
Chibagin Consulting Plaza
Chibagin Loan Plaza
Chibagin Himawari Lounge
Kashiwa-no-ha Campus Branch
(Renewal opening in 2016.6)・Extend opening hours on weekdays
・Starting operation on Saturdays and holidays
1st as our branch
0
10
20
30
15/10 11 12 16/1 2
Number of new loan customers
Ebisu Corporate Banking Office
(cumulative)
15/12
¥972.4 Bil.
05/3
¥232.8 Bil.
Domestic Branches (as of 2015.12) Balance of loans for retail branches
outside Chiba*
*Excluding wholesale branches outside Chiba
(Tokyo Head Office, Shinjuku Branch and Osaka Branch)(¥Bil.)

2.35
2.40
2.45
2.50
2.55
2.60
2.65
6.10
6.12
6.14
6.16
6.18
6.20
6.22
6.24
2008 2009 2010 2011 2012 2013 2014 2015
(Mil.)
7
Expanding the blocks
Collaboration Work in the Blocks
Population and households in Chiba pref.
Source: Monthly survey on permanent population
in Chiba pref. (as of Oct. 1 of each year)
Housing Loans
Urayasu
Tsudanuma
Matsudo
Ichikawa
Chuo
Kamagaya
2,958.9 3,093.8
3,200.0
3,600.0
2,300
2,800
3,300
3,800
14/12 15/12 17/3 20/3
Four cities from Chiba prefecture ranked in top 20 of net population inflow
(#14:Funabashi, #18:Chiba, #19:Nagareyama, #20:Kashiwa)
2015
Rank Pref.
2010
(Thou.)
2015
(Thou.)Change
1 Tokyo 13,159 13,514 2.7%
2 Kanagawa 9,048 9,127 0.9%
3 Osaka 8,865 8,839 ▲0.3%
4 Aichi 7,411 7,484 1.0%
5 Saitama 7,195 7,261 0.9%
6 Chiba 6,216 6,224 0.1%
9 Fukuoka 5,072 5,103 0.6%
25 Okinawa 1,393 1,434 3.0%
26 Shiga 1,411 1,413 0.2%
Japan 128,057 127,110 ▲0.7%
2015 Population Census
Households (right)
Population (left)(Mil.)
Balance of housing loans
(¥Bil.)
(Target) (Reference)
Funabashi

8
Framework Concentrate specialized staff
Improving Efficiency of Operations
Expanding the blocks
Area Consultant (AC) Teams
Sakura
Kashiwa
Yachiyo
Simplify administration work
Enhance functions of Contact Center
Long-term and stable
investmentsDiverse investments
Core fund proposals
Sales of Investment Type Financial Products
Urayasu
Matsudo
Ichikawa
Chuo
Tsudanuma
1,794
1,901
1,949
1,700
1,800
1,900
2,000
FY13 FY14 FY15
First-year Premium for Level-paying Life Insurance
(Apr.-Dec.)
Funabashi
(¥Mil.)

Inheritance-related Business
9
Inheritance-related Business

10
Number of notarized wills prepared in Japan
Number of Testamentary Trusts with Executions
kept by Trust Banks and others in Japan Elderly Population (over 65 years old) in Chiba Pref.
78,754
104,490
40,000
60,000
80,000
100,000
120,000
2006 2007 2008 2009 2010 2011 2012 2013 2014
Source: Japan National Notaries Association
70,155
91,832
40,000
60,000
80,000
100,000
2006 2007 2008 2009 2010 2011 2012 2013 2014Source: Trust Companies Association of Japan
FY2013 Tax revision
(Revision of the Inheritance Tax Act)
FY2013 Tax revision
(Revision of the Inheritance Tax Act)
Sharp increase in media reportsSharp increase in media reports
Prevailing attitude “Inheritance is troublesome”
“Take measures while one’s health is still good”
Prevailing attitude “Inheritance is troublesome”
“Take measures while one’s health is still good”
1,000
1,200
1,400
1,600
2006 2007 2008 2009 2010 2011 2012 2013 2014 2015
2011〜2014
+25,736件
2011〜2014
+21,677 cases
As of Apr. 1, 2015Total population in Chiba: 6,254 Thou.
Ratio of elderly population: 24.7%
(Cases)
(Thou.)
Factors for Rapid Increase
Business Environment
Source: Chiba Pref.
(Cases)

11
【Point】 【Keyword】 【Tangible Effects】
Strengthen
Relationship
“Grand sum of one’s life”
“Talking about family”
Relationship between the bank and customers becomes close
Dare to entrust the will to the bank⇒⇒⇒⇒ Shifting loans to another bank will be prevented
Get the
picture of
Assets
“Transactions with other banks”
“Total real estate”
Proposal by getting the whole picture of assets⇒⇒⇒⇒ Features a high level of customer satisfaction
Opportunities to make lending and investing proposals ⇒⇒⇒⇒ Enhancing bank business
Continue
Business
“Approach to the next generation”
“Maturity of all assets”
Chance to communicate with the next generation
Ownership of assets changes ⇒⇒⇒⇒Chance for expanding business
Application Drawing will Death Completion
Support Service Testamentary trust (accept) Testamentary trust (execute)
Understand financial assets in other banks
Understand unused real estate
Understand the view towards assets
Understand the family
Understand change in asset
Concentrate deposits in our bank
Maturity of all assets
Relationship with the next generation
Chance for new business
Continue business
Safekeep testamentary trust
Asset management andloan business
Prevent businessbeing shifted
Purposes

Remuneration for execution of
safekeeping wills when inheritance
occurs in the future
Almost ¥620 Mil.
12
Number of contracts and income for inheritance-related services
0
30
60
90
120
150
180
0
100
200
300
400
500
600
2006 2007 2008 2009 2010 2011 2012 2013 2014 2015
2006.6 2012.4 2016.4
Number of staff for inheritance
and trust business 5 20 26
Sales 2 10 12
Administration - 7 11
Examination 3 3 3
(Bank staff) (5) (17) (18)
(Senior staff*) (-) (1) (3)
(Temporary staff) (-) (2) (5)
Trust Business Division (2015.10)
* ‘Senior staff’ refers to staff over 60 years old belonging to subsidiaries
Support Service
(Prepare will, Business
Successions)
Consulting for asset and business
successions
Testamentary Trust
Support for drawing wills by notarized
documents, safekeeping will documents and
executing wills, discussed during lifetime
Inheritance Rearranging
Representing inheritance procedures,
including other banks’, entrusted by
successors
As of 15/12
Support service (left)
Testamentary trust (left)
Inheritance rearranging (left)
Fees and commissions income (right)
(Cases)
Trust business products and inheritance related services
Achievements
Expected Income from contracted services
Expected income from
services in progress
Remuneration for execution
in the future
Income from contracted services
on completion of procedures
Almost ¥240 Mil.
(Apr.-Dec.)
(¥Mil.)

13
Spreading effect on sales of financial products
Tax Exemptions
Addressed Functions
Private Bank
Long-term Investments
Review portfolioLevel-premium
paying insurance
Insurance products113 cases/¥1,893 Mil.
Lombard’ Odier Danier Hentsch
(Agency)18 cases/¥2,024 Mil.
Shift financial assets
from other banks
Consultation for
succeeding assets
Safekeeping Wills【Effect on preventing loans being shifted】
Customers with testamentary trusts will keep on
dealing with Chiba Bank
New loans46 cases/¥7,003 Mil.
Establish holding
companies
Purchase income
generating properties
Provision for paying
tax
Achievements in FY15
21%
20%59%
富裕者法人オーナーその他
14%
47%
23%
16%
5億以上1〜5億円0.5〜1億円0.5億円未満
*Customer fulfills the following requirement:
over ¥0.5Bil. of total assets or ¥0.1Bil.of financial assets, etc.
Achievements
in FY15
*Assets received by each term-end, including executions that have been completed
Total assets
Financial assets
At Chiba Bank group
Spreading Effect
Attribution and asset size of customers for inheritance-related services
High net worth*
Corporate owner
Others
Over ¥0.5Bil.
¥0.3-0.5Bil.
¥0.1-0.3Bi
Below ¥0.1Bil.
Customers’ total assets for testamentary trusts with Chiba Bank
(¥Bil.)
Spreading effect on loans
Unsecured Consumer Loans
14
Unsecured Consumer Loans

7.3
13.2
22.3 26.0
20.4
0
10
20
30
FY11 FY12 FY13 FY14 FY15
15
64.6 67.3
77.0
89.5
102.7
130.0
170.0
60
80
100
120
140
160
180
12/3 13/3 14/3 15/3 15/12 17/3 20/3
4,136
11,389
0
5,000
10,000
15,000
FY14 FY15
Achievements
(Cases)
+ ¥13.2Bil. from
Apr.-Dec. of FY14
+7,253 cases
from FY14
(Apr.-Dec.)
Auto loans
Educational loans
Renovation loans
Free purpose loans
+ ¥2.7Bil.
+ ¥9.7Bil.
+ ¥12.5Bil.
+ ¥13.2Bil.
(Target) (Reference)
Balance of unsecured loans New unsecured consumer loans
(¥Bil.)
(¥Bil.)
Number of contracts for card loan “Quick Power”
(Apr.-Dec.)

16
60%
40%
インターネット
店頭ポスター・D
M・交通広告等
76%
24%
インターネット電話・郵送等
New Unsecured Consumer Loans by Area Application ratio of “Quick Power” by channel
Channels
Application ratio by channel
Recognition ratio of advertisements
(based on customer surveys)
Internet Branch
All Branches
Outside Chiba
Inside Chiba
Outside Chiba
Internet
Telephone and mail, etc.
Internet
Posters,
Direct mail and
Transportation
Advertising, etc.

17
Banner advertisements on internet homepage
Poster Lobby (Pamphlet Stand)
Advertisements for “Quick Power” Advertisements for unsecured consumer loans by purposes
Promotions
Banner advertisement on internet homepage

18
Video Advertisements for Quick Power
Management Policy
19
Management Policy

20
Chiba – Musashino Alliance (1)
Banks rooted in local business area
Cross shareholding
To raise effectiveness
of the alliance
Business Alliance
Common issues, located in metropolitan area
Very little duplication in branches
Unchanged commitment to
local business area
+
Rapid implementation of highly
effective collaboration
Enhance top-line profit
Cost reduction
Both banks will keep their own management
Capital Alliance
New business alliance model for local banks
Develop a new business alliance model for local banks
Deposits 11.2TrillionLoans 8.4Trillion
Deposits ¥3.9TrillionLoans ¥3.2Trillion
Administrative divisions of JapanPopulation
(Thousand)
Households
(Thousand)
GDP
(¥Trillion)
Corporates
(Thousand)
Chiba prefecture 6,224 2,607 19 190
Saitama prefecture 7,261 2,969 20 244
Sum of Chiba and Saitama 13,485 5,576 39 435
Tokyo metropolitan area 13,514 6,692 91 627
(Ref.)Percentage of whole Japan 10.6% 10.4% 7.9% 7.9%
Joint development
Personnel interchange
Utilize group companies
Favorable partner to proceed with the alliance
The Chiba Bank, Ltd. The Musashino Bank, Ltd.

21
Chiba – Musashino Alliance (1)
Project finance
Credit cards
Sub system
Streamline branch operation
Back office operation
Asset management
Securities, Leasing,
Research Institute Corporation
Send trainees
Consider comprehensive alliance in every business field to realize enhancement of top-line profit and cost reduction
Share know-how
Joint developmentPersonnel interchangeUtilize group companies
Enhancement of top-line profit Cost reduction
Expect ¥10bn in cumulative alliance benefits within five years by realizing the collaboration

22
Actively consider design of new FinTech-driven business model
Joined in March 2016
TSUBASA Alliance (1)
TSUBASA alliance for enhancing
financial system
Basic agreement with three banks (2015.10)
Considering phaseFormulation
phase
Start of
operation
Case study / Workshop
October - December
Classify the needs
January-February
Plan / Verification
March -
Corporate Planning Division FinTech Business Promotion Office
Smartphone to be the starting point for banking transactions, shopping and settlements
BankingTransactions
Chiba Bank Daishi Bank Chugoku Bank Iyo Bank Toho Bank North Pacific Bank

23
TSUBASA Alliance (2)
Dispatching Staff
Operation Fees
Planning, Development and Sales of Financial Services
Content Partners(FinTech companies)
System Development Partner(Providing specialized technologies)
Watson Mobile Big Data New ServicesSystem vendors FinTech ventures
Domestic and
other banks’
movements
Investigations and Research Businesses
Establish a joint venture and consider the planning and development of financial services
Research, Investigations
Sales
Joint Venture
TSUBASA alliance for
enhancing financial system
(Scheduled 2016.7)
Business Contests
Developing business
support app
for regional banks
24
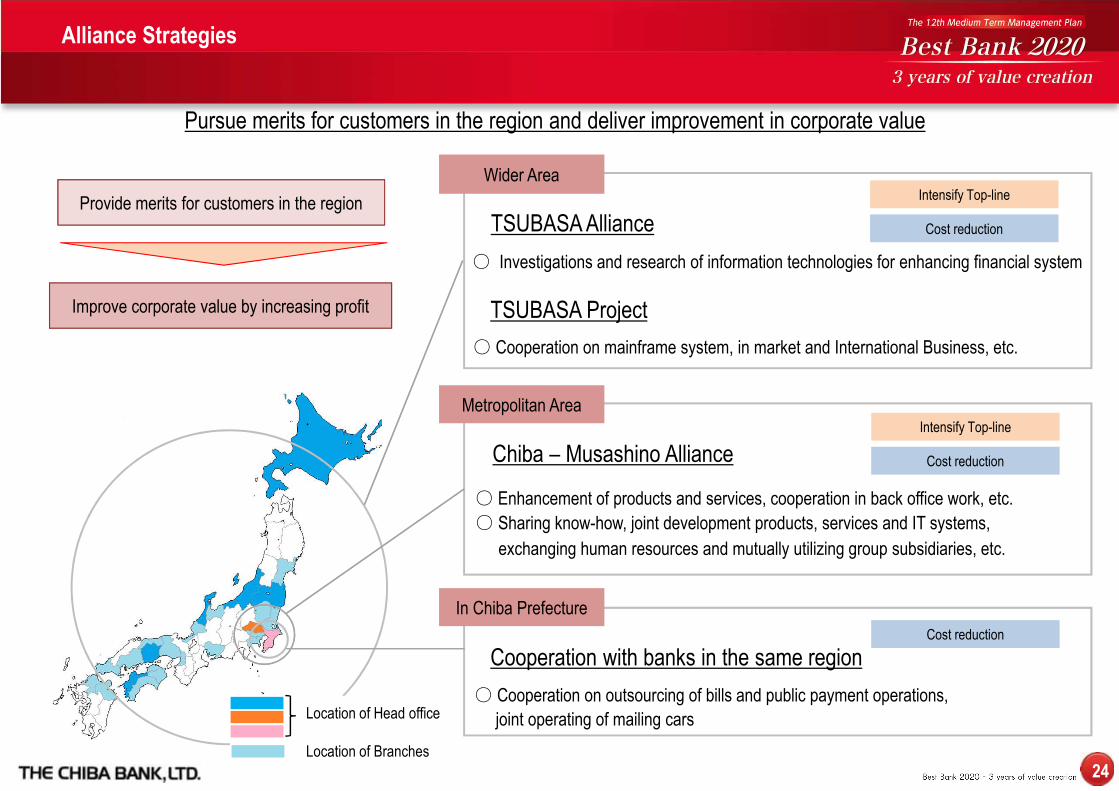
Alliance Strategies
Wider Area
Metropolitan Area
In Chiba Prefecture
Cooperation with banks in the same region
Chiba – Musashino Alliance
○ Investigations and research of information technologies for enhancing financial system
○ Enhancement of products and services, cooperation in back office work, etc.
Intensify Top-lineIntensify Top-line
Cost reductionCost reduction
Cost reductionCost reduction
TSUBASA Alliance
Pursue merits for customers in the region and deliver improvement in corporate value
Provide merits for customers in the region
Improve corporate value by increasing profit TSUBASA Project
○ Cooperation on mainframe system, in market and International Business, etc.
○ Cooperation on outsourcing of bills and public payment operations,
joint operating of mailing cars
○ Sharing know-how, joint development products, services and IT systems,
exchanging human resources and mutually utilizing group subsidiaries, etc.
Intensify Top-lineIntensify Top-line
Cost reductionCost reduction
Location of Head office
Location of Branches

(¥)
Annual cash dividend per share
Capital Policy
25
Increase in annual cash dividend
announced in May 2015
(Projection: ¥13 to ¥14)
(Projection)
Effective use of capital for our development, steady increase in dividend keeping a stable dividend policy
(¥Bil.) FY04 FY05 FY06 FY07 FY08 FY09 FY10 FY11 FY12 FY13 FY14 FY15(Projection)
Annual cash dividend (a) 5.0 6.1 8.0 9.8 9.8 9.8 9.7 9.6 10.3 10.2 10.8 11.5
Acquisition of own shares (b) - - - - - - 5.0 5.8 9.4 9.9 9.9 9.9
Shareholder returns (c)=(a)+(b) 5.0 6.1 8.0 9.8 9.8 9.8 14.8 15.4 19.8 20.2 20.8 21.5
Non-consolidated net income (d) 34.3 46.7 50.1 44.6 11.3 36.2 38.1 36.0 41.2 43.2 45.8 50.0
Payout ratio (a)/(d)*100 14.7% 13.0% 16.0% 22.0% 86.8% 27.1% 25.6% 26.7% 23.5% 23.6% 23.6% 23.0%
Shareholder return ratio
(c)/(d)*10014.7% 13.0% 16.0% 22.0% 86.8% 27.1% 38.9% 42.9% 48.0% 46.8% 45.4% 43.0%
1
Keep
proactive
approach
toward
shareholder
returns
Steady increase in dividend keeping a stable dividend policy
Flexible acquisition of own shares
1
2015.4〜Acquisition of
own shares
up to ¥5 Bil.

(\ Bil) Change
Net fees and commissions income 14.3 13.8 (0.4)
Fees and commissions income 28.4 28.8 0.3
Fees and commissions payments (14.1) (14.9) (0.8)
<Major items>Investment trusts and personal annuities 9.4 9.1 (0.3)
Investment trusts 5.8 4.7 (1.0)
Personal annuities 3.6 4.3 0.7
Solution-related fees from corporate customers 1.4 2.0 0.5
Guarantee charges and group insurance costs (8.9) (9.6) (0.7)
3Q
FY2014
3Q
FY2015
(Reference) Financial Results for the Third Quarter of FY2015
(\ Bil) Change
Ordinary Profit 65.4 68.2 2.7 84.5 80.7%
Net income attributable to equities of parent 48.3 45.7 (2.5) 54.0 84.7%
(\ Bil) Change
Gross business profit 116.2 113.6 (2.5)
Net interest income 96.6 96.2 (0.4)
Net fees and commissions income 14.3 13.8 (0.4)
Trading income 1.9 1.8 (0.1)
Profit from other business transactions 3.2 1.6 (1.5)
Gains (losses) related to bonds 1.9 0.8 (1.1)
Expenses(-) 62.9 60.6 (2.2)
Real net business income 53.3 52.9 (0.3)
Core net business income 51.3 52.1 0.8
Net transfer to general allowance for loan losses (-) - - -
Net business income 53.3 52.9 (0.3)
Non-recurrent income and losses 4.2 10.4 6.1
Disposal of non-performing loans (-) 0.4 (2.0) (2.5)
Gains (losses) related to stocks, etc. 1.3 2.7 1.4
Ordinary profit 57.6 63.4 5.7 77.0 82.3%
Extraordinary income (loss) (0.2) (0.2) 0.0
Net income 38.3 43.5 5.2 50.0 87.0%
Net credit costs(-) 0.4 (2.0) (2.5)
3Q
FY2014
3Q
FY2015
3Q
FY2014
3Q
FY2015
Consolidated
Non-consolidated
AnnualProjection
Progress
AnnualProjection
Progress
(\ Bil) Change
Net interest income 96.6 96.2 (0.4)
Domestic 92.1 91.4 (0.7)
Loans and deposits 79.3 76.2 (3.1)
Loans 82.2 79.1 (3.0)
Deposits (2.8) (2.9) (0.0)
Securities 13.2 15.6 2.3
Bonds 5.0 4.4 (0.5)
Stocks 5.0 6.2 1.2
Investment trusts 3.2 4.9 1.6
International 4.4 4.8 0.3
3Q
FY2014
3Q
FY2015
Net fees and
commissions income
Net interest income
26

(\ Bil) Ratio
Deposits 10,359.3 10,963.1 603.7 5.8%
Domestic deposits 10,141.9 10,435.4 293.4 2.8%
Personal deposits 7,985.9 8,166.3 180.3 2.2%
(\ Bil) Ratio
Loans 8,383.3 8,746.2 362.8 4.3%
Domestic loans 8,235.9 8,573.0 337.0 4.0%
ex. Public sector 8,011.8 8,293.0 281.2 3.5%
Corporate loans 4,949.8 5,081.1 131.2 2.6%
Large corporates 1,415.6 1,358.9 (56.6) (4.0%)
SMEs 3,534.2 3,722.1 187.9 5.3%
Consumer loans 3,062.0 3,211.9 149.9 4.8%
Housing loans 2,958.9 3,093.8 134.8 4.5%
Unsecured consumer loans 85.2 102.7 17.5 20.5%
Public sector 224.0 279.9 55.8 24.9%
Domestic loans 8,235.9 8,573.0 337.0 4.0%
Branches in Chiba 6,036.5 6,238.2 201.6 3.3%
Branches outside Chiba 2,199.4 2,334.8 135.3 6.1%
1,343.9 1,362.3 18.3 1.3%
855.4 972.4 116.9 13.6%
*Toky o Head Office, Shinjuku Branch and Osaka Branch
3Q
FY2014
3Q
FY2015 Change
ex. Special Branches
Special Branches*
3Q
FY2014
3Q
FY2015 Change
(Reference) Deposit and Loan Portfolios as of December 2015
65.6
73.3
85.2
102.7
60
80
100
120
12/12 13/12 14/12 15/12
2,737.6
2,832.6
2,958.9
3,093.8
2,500
2,700
2,900
3,100
12/12 13/12 14/12 15/12
Housing loans
27
3,297.4 3,352.8
3,534.2
3,722.1
3,000
3,200
3,400
3,600
3,800
12/12 13/12 14/12 15/12
SME loans
(¥Bil)
+1.6%
+5.4%
+4.4%+3.4%
+5.3%
+4.5%
+11.6%+16.3%
+20.5%
Unsecured consumer loans
(¥Bil)
(¥Bil)