Process Design of Heat Exchanger: Types of Heat exchanger ...
.
FINAL REPORTh.
I T Period.--'"June 8, 1904 - M a r c h 14, 1907 6
? C H E M O S Y N T H E T I C G A S EXCHANGER^
by
D r Leona rd Bongers , P r i n c i p a l Inves t iga tor , and D r . John C. Medic i 9
6
,
R e s e a r c h Inst i t fo$%Ydvanced S tud ie i Z Z I A S / I ' + 4 3
I M a r t i n hk&&+a C0Gr-n A 5 0 s c u t k Roll ing Road
G a l t i m o r e , Marylan 21227 9& GPO PRICE $
CFSTI PRICE(S1 $ Y A p r i l 1967 10
Hard copy (HC)
Microfiche (MF)
ff 653 July 65 P r e p a r e d for
Office of Space Sc iences and Applicat ions Nat ional Aeronau t i c s a n d Space Admin i s t r a t ion
Washington, D. C . 20546
Con t rac t yo. hASw-971 f l
4-11 kh) a5 .&I ' 1 fl-
" s (ACCESSION NUMBER) (THRU)
/ , C (&ODE)
(CATEQORY)
https://ntrs.nasa.gov/search.jsp?R=19670027263 2019-01-23T00:12:19+00:00Z

FINAL REPORT
P e r i o d : June 8, 1964 - M a r c h 14, 1967
CHEMOSYNTHETIC GAS EXCHANGER
D r . Leona rd Bongers , P r i n c i p a l Inves t iga tor , and D r . John C . Medici
R e s e a r c h Institute f o r Advanced Studies
M a r t i n Mar i e t t a Corpora t ion 1450 South Rolling Road
B a l t i m o r e , Maryland 2 1227
(RIAS)
Apr i l 1967
P r e p a r e d f o r
Off ice of Space Sc iences and Applicat ions Nat ional Aeronau t i c s and Space Admin i s t r a t ion
Washington, D. C . 20546
C o n t r a c t N o . NASw-971 ER - 13634-11

- TABLE OF CONTENTS
I.
11.
111.
I V .
v.
V I .
V I I .
INTRODUCTION
CULTIVATION PROCEWRES
1. Batch Operation
2. Continuous Operat i on
THE CHEMICAL AND PmSICAL ENVIRONMENT
1. Temperature .
2. pH Effects
3. Inorganic Nutr i t ion
4. G a s Supply
5. Mzterial Balance i n a Closed Environment
EX2RGETICS
1. Eff ic iency of ATP Formation
2. Eff ic iency of CO Conversion
3. Effect of Oxygen on Cytochromes
2
TURN-OVER CHARACTERISTICS
FIGURES
REFERENCES
3
8
9
9
13
14
15
15
18
23
28

ACKNOWLEDGMENTS
This report was prepared for the National Aeronautics and Space
Administration by the RIAS Divison, Martin Marietta Corporation, under
Contract NASw-971, "Chemosynthetic Gas Exchanger". The work was
administered under the technical direction of Dr. Dale W. Jenkins and
Dr. Joseph F. Saunders of the Bioscience Programs, Office of Space
Sciences and Applications, NASA Headquarters, Washington, D. C.
The authors wish to acknowledge the technical assistance of
Elizabeth Huang and Gilbert Fair.

-1-
I. INTRODUCTION
One so lu t ion t o par t ic i -pat ion by man i n long-term space explora t ion i s
c losure of the food-waste loop by b io log ica l means. I n view of t h e weight
and pawer l imi t a t ions a t r a n s i t i o n from simple s torage of commodities t o
regenerat ion and reuse of metabolic wastes seems inevi tab le . The character-
i s t i c s of a promising b io logica l approach, u t i l i z i n g t h e autotrophic
metabolism of hydrogen oxidizing bac te r i a f o r t h e regenerat ive process w i l l
be discussed.
The ( chemosynthetic) bioregenerative system i s a func t iona l coupling
of e l e c t r o l y s i s of water with biosynthesis by hydrogen b a c t e r i a ( 1 7 2 )
Figure 1 rapresents a hypothet ical flow diagram of chemosynthetically closed
ecology; t he reac t ions involved i n t h e ove ra l l process are summarized by
t h e chemical equations under the diagram of f i g . 1. Elec t ro lys i s of water
produces oxygen for man and hydrogen f o r t he bac te r i a . The carbon dioxide
produced by man i s assimilated by the bac ter ia , which i n t u r n fu rn i sh t h e
proteins , fats, and carbohydrates required f o r human n u t r i t i o n . Thus a
considerable por t ion of man's metabolic wastes would be processed and r e -
cycled i n t h i s ecosystem.
The generation of hydrogen and oxygen by e l e c t r o l y s i s i s a r e l a t i v e l y
e f f i c i e n t process; information present ly ava i lab le ind ica t e s an e f f i c i ency
i n t h e order of 80% i n t h e conversion of e l e c t r i c a l energy i n t o b io log ica l
energy (hydrogen and oxygen).
degree, of power requirements for regenerative l i f e support systems must
involve a f a i r l y rough approximation because of a rap id technological advance
Any appra i sa l of weight and, t o a lesser

-2-
i n t h e e f f ic iency of power generat ion and minia tur iza t ion of instrumentat ion.
It i s therefore not possible , at t h e present time, t o pred ic t wi th some
degree of accuracy t h e weight penal ty Of an e l e c t r o l y t i c system.
a weight estimate of 20-40 pounds t o support 3 men seems reasonable.
However,
An estimate of t h e energy which would be required f o r t h e regenera t ion
of man's carbon dioxide output are indicated by t h e chemicalequations pre-
sented i n f i g . 1. Elec t ro ly t i c cleavage of 6 moles of water would s u f f i c e
t o provide the energy f o r t he conversion of one mole of carbon dioxide.
Thus, the end r e s u l t of e l e c t r o l y s i s and biosynthesis i s t h e formation of
one mole (CH20) represent ing 120 kcal, and one mole (or 22 l i t e r s ) of oxygen.
The products of biosynthesis provide thus, t h e approximate hourly c a l o r i c
intake and oxygen requirement of one man.
Because t h e cleavage of 6 moles of water requi res approximately
600 kcals energy input (75% e f f i c i ency) , the ove ra l l e f f i c i ency of t h e
energy conversion i s of t h e order of 20%.
Measurements of autotrophic growth r a t e s i n batch and i n continuous
cu l tu re s ind ica te t h a t s p e c i f i c r a t e s of CO conversion of approximately
1 l i t e r can be a t t a ined . A suspension volume requirement i n the order of
2
20-30 l i t e r s per man seems thus a reasonable es t imate .
On the basis of t h e performance r ecen t ly obtained with growth i n
s teady-state cu l tures , it appears t h a t t h i s approach t o l i f e support i s we l l
on i t s way t o maturity. Therefore, t h i s r epor t w i l l review the present
s t a t e of the a r t and discuss i n some d e t a i l : t h e techniques employed f o r
cu l t iva t ion , t h e demand upon and t h e response of t h i s organism t o i t s chemical
and physical environment, as w e l l as some of t h e bas i c aspects of t h e conver- *
s i o n process.
* Details w i l l be published elsewhere.

-3-
11. CULTIVATION PROCEDURES
1. Batch Operation.
Abundant evidence ind ica t e s t h a t H2, 0 and CO are consumed by 2 \ 2
hydrogenomonads i n a r a t i o of 6:2:1.
of 70% hydrogen, 20% oxygen and approximately 10% C02.
most convenient fo r use when growth i s obtained by the "passive" gas
d i f fus ion , a method described by R e p a ~ k e ' ~ ) .
and i s a s a t i s f a c t o r y
This corresponds t o a gas composition
This gas mixture i s
It permits s ter i le operat ion
method for most experiments.
Briefly, t h e system cons is t s of a gyrotory water-bath-shaker (New
Brunswick Model ~76) with a capacity f o r s i x 500 m l Eklenmeyer cu l tu re
f l a s k s . The cu l tu re flasks a re connected t o a manifold, which i n t u r n i s
connected e i t h e r t o a water a sp i r a to r o r t o a r e se rvo i r containing the gas
mixture. The pressure of t h e gas r e se rvo i r i s maintained constant v i a a
water bridge connected t o a water r e se rvo i r which i s open t o t h e atmosphere.
The r a t e of c e l l reproduction i n t h i s system is l imi ted by t h e d i f fus ion
rate of oxygen i n t o t h e suspension. The m a x i m u m rate of oxygen d i f fus ion
can be determined manometrically, u t i l i z i n g s u l f i t e (0.2N) dissolved i n t he
medium u t i l i z e d f o r cu l t i va t ion . Measurements i nd ica t e an oxygen t r a n s f e r
r a t e of approximately 100 m l per hour with ba f f l ed f l a s k s (condi t ions:
1 a t m . 30 C, 0.2N s u l f i t e i n 120 ml cu l tu re medium). The r a t e of oxygen
t r a n s f e r i s 5 t o 10 fo ld lower i n an unbaffled f l a s k . The r a t e of hydrogen
d i f fus ion i s assumed t o be three t i m e s t h e rate of oxygen d i f fus ion , under
s i m i l a r conditions.
air, 0
The maximum r a t e of gas consumption and growth can thus, for a given
s e t of conditions, be estimated. If one assumes a gas mixture containing a

-4-
hydrogen concentration t h r e e t imes t h a t O f oxygen, and a hydrogen t o oxygen
consumption r a t i o of t h r e e t o one, it i s evident t h a t with a progressively
increasing r a t e of gas consumption, oxygen d i f fus ion w i l l u l t ima te ly become
the growth l imi t ing f a c t o r .
A disadvantage of t h i s method is t h a t r e l a t i v e l y l a rge q u a n t i t i e s of
t h e explosive gas mixture must be ava i l ab le t o s u s t a i n a suspension over
n ight .
range 4-5 cm Hg) and an oxygen electrode-arnplifier, we a r e ab le t o mix t h e
gasses autar!atically. Oxygen (100%) i s fed v i a solenoid valve, actuated by
the oxygen cont ro l le r , i n t o a gas-mixing chamber (approximately 2 l i t e r s )
containing The oxygen sensor.
same mixing chamber t h e f l o d being regulated by a solenoid valve actuated
by t h e pressure switch connected t o t h e mixing chamber. A s m a l l pump
(Dyna Pmp Model 4K) c i r c u l a t e s t he gas mixture t o t h e c d t u r e s and back t o
t h e mixing chamber.
By using a simple pressure actuated switch ( a c t i v a t i n g pressure
A mixture of 86% H2 + 14% C02 i s fed t o t h e
Tne sane design w a s used t o provide l a rge batches (volumes of 10-12
The gas mixture w a s c i r cu la t ed through l i t e r s ) 05 c z l l s with gas mixture.
t h e susper i s l r by two pumps v i a fou r gas d ispers ion tubes ( f r i t t e d cy l inders )
mounted near t h e bottom of t h e suspension container .
returned t o the mixing chamber v i a an o u t l e t f i t t e d i n t o t h e t o p of t h e
container. B e s t r e s u l t s were obtained with t h e oxygen e lec t rode mounted i n
t h e suspension instead of i n t h e mixing chamber. This procedure allows f o r
an automatic adjustment of oxygen t r a n s f e r (by increas ing t h e gas phase
Oxygen concentration) proport ional t o t h e rate Of oxygen consumption by t h e
suspension. This system permits c u l t i v a t i o n of r e l a t i v e l y l a rge volumes of
The gas mixture w a s

-5-
suspension of medium population density. Routinely, a dry weight production
of approximately 20 grams was obtained i n 24 hours wi th heavy inoculum.
2. Continuous Operat ion.
To achieve continu0;ls cu l ture seve ra l s teady-s ta te parameters such as
pH, concentration of nut r ien ts , oxygen, hydrogen and carbon dioxide must be
continuously balanced. These parameters a re subject t o considerable change
i n batch cu l tures . A s teady-state cu l tu re i n which t h e r a t e of growth i s
cont ro l led by a s ing le f a c t o r (e .g . t h e carbon source) i s defined as a
chemostat; i n such cul tures , t h e concentration of nu t r i en t s o ther t han t h e
l i m i t i n g ones, t he concentration of products excreted i n t o t h e medium i n
t h e course of c e l l reproduction and t h e pH a r e more or l e s s independent of
d i l u t i o n r a t e .
developed by the t h e o r e t i c a l work of & ~ o n o d ( ~ ) , Novick and S ~ i l a r d ' ~ ) and
The background of t h i s type of cu l tu re has been w e l l
t he experimental approach of Herbert e t a1 (6) .
A continuous cu l ture i n which t h e d i l u t i o n rate i s s e t by t h e growth
r a t e i s ca l led a tu rb idos t a t or product-limited cu l ture . I n order t o allow
t h e most e f f i c i e n t u t i l i z a t i o n of both power and weight a system of t h i s
type i s required, i n which t h e growth of the c e l l is e n t i r e l y cont ro l led by
i t s i n t e r n a l cha rac t e r i s t i c s , r a the r t han by an environmental f a c t o r (as
would be i n t h e case of a chemostat).
L i t t l e t h e o r e t i c a l background on t u r b i d o s t a t s has ye t been accumulated,
bu t c l e a r l y t h e chemical and physical environments are influenced by t h e
d i l u t i o n rate.
t r a t i o n of t h e e s s e n t i a l cons t i tuents of t h e feed medium f o r each c e l l
dens i ty at which the cu l ture is operated. O n progress i n e s t ab l i sh ing and
It i s therefore necessary t o determine t h e optimal concen-

-6-
maintaining these optimal concentrations i s discussed i n Sec t ion 111, 3
and Section V.
Our t u r b i d o s t a t i c a l l y cont ro l led apparatus i s an adapta t ion of a u n i t
fabr ica ted by B a t t e l l e Memorial I n s t i t u t e ( 7 ) .
conforms t o a design described by F i n J 8 ) .
closed chamber (3-4 l i t e r s of working suspension i n t o t a l volume of 5 l i t e r s )
provided with a b a f f l e and impeller arrangement. Rapid gas t r a n s f e r i s
accomplished by vigorous a g i t a t i o n and r e c i r c u l a t i o n of t h e gas phase
through the liqu-id phase.
and a dens i ty con t ro l system ( s e e f i g . 4 ) .
b r i e f l y described.
The conf igura t ion ( s e e f i g . 2)
Cu l t iva t ion takes place i n a
Recent addi t ions include a compact pH ( s e e f i g . 3)
The c o n t r o l systems used w i l l be
I n an e a r l i e r arrangement ( s e e f i g . 2 ) t h e i n f l u x of CO t o t h e sus- 2
pension was controlled by a CO
suspension. When t h e dissolved CO concentration dropped below a p rese t
l eve l , t h e sensor actuated solenoid valve ( S k ) , thus admitt ing a carbon
dioxide - hydrogen mixture (86%/14%) t o t h e r eac t ion chamber v i a a pre-cal-
ibrated meter valve.
elapsed time meter (C2).
used t o o f f se t t h e slow response of t h e CO sensor. A s w i l l be discussed
l a t e r , t h i s method of carbon dioxide con t ro l w a s inadequate at higher pop-
u l a t i o n dens i t i e s . Presently, a gas phase carbon dioxide - c o n t r o l l e r i s i n
use and has r e su l t ed i n improved system performance.
e lec t rode (converted pH electrode, Beckman) i n t h e 2
2
The t o t a l H / C O flow w a s monitored by a d i g i t a l 2 2
A gas mixture of hydrogen and carbon dioxide w a s
2
Oxygen supply i s cont ro l led by a dissolved-oxygen sensor (go ld - s i lve r
Clark-type e lec t rode) and measured i n a similar fash ion as described above.
This sensor has a Cast response and has performed s a t i s f a c t o r i l y i n t h e l i q u i d
phase.

-7-
The pressure i s maintained at 3 ps ig with hydrogen. The hydrogen
i n f l u x is cont ro l led by pressure switch - solenoid valve arrangement and
metered i n a s i m i l a r f ash ion as the oxygen and carbon dioxide consumption.
The pH of t h e suspension could be cont ro l led by the pH sensor, mounted
i n an ex te rna l sampling loop ( see f ig . 2 ) .
chamber i s shown i n f i g . 3. The combined pH e lec t rode was inse r t ed through
t h e t o p of t h e l u c i t e block. A t i g h t s e a l w a s provided wi th a rubber "0"
r i n g and nut arrangement. This arrangement permitted easy removal of t h e
pH e lec t rode f o r t h e purpose of cleaning and t e s t i n g .
w a s connected t o a recorder -cont ro l le r which permits automatic add i t ion O f
e i t h e r acid or base. Presently, t h i s equipment i s used only as a pH
ind ica to r .
A cut-away diagram of t h e pH
The pH e l ec t rode
The dens i ty of t h e suspension i s cont ro l led by t h e flo-d-through
chamber mounted i n t h e ex te rna l sampling loop ( s e e f i g . 4 ) .
s t e e l sample chamber used interchangeable t e f l o n gaske ts f o r monitoring
various c e l l d e n s i t i e s . Not shown is t h e reference chamber, attached t o
t h e sampling chamber. A needle i n t h e l i g h t pa th of t h e re ference chamber
could be used t o balance t h e l i g h t i n t e n s i t i e s t ransmi t ted t o t h e two photo-
cells.
bridge (assoc ia ted c i r c u i t r y i n f i g . 4A). Opt ica l dens i ty of t h e suspension
w a s checked pe r iod ica l ly against a ca l ib ra t ed instrument. It w a s found t h a t
t h e population dens i ty remained constant (w i th in a few percent) during periods
of constant meter s e t t i n g .
c e l l build-up occurs on t h e w a l l s of t h e con t ro l chamber. Figure 5 i l l u s -
trates t h a t t h e r a t i o of o p t i c a l density over dry weight of c e l l s i s
The s t a i n l e s s
I n addition, an e l e c t r i c balance w a s provided i n t h e wheatstone
One can the re fo re assume t h a t e s s e n t i a l l y no

-8 -
e s s e n t i a l l y constant throughout t he t e s t run, i nd ica t ing t h a t con t ro l of
o p t i c a l density i s an adequate means f o r con t ro l l i ng t h e c e l l concentrat ion
of suspens ion.
The c e l l dens i ty of t h e r eac to r i s maintained through automatic
addi t ions of f r e s h medium. The excess suspension leaves t h e r eac to r v i a a
stand pipe, a gas- l iquid separa tor and l e v e l c o n t r o l l e r . The l e v e l - c o n t r o l l e r
i s connected t o a harvest meter v i a a solenoid valve (S-6 f i g . 2 ) which i s
actuated by t h e l e v e l con t ro l l e r . The harvest i s measured and t h e output
monitored by a d i g i t a l counter ( C 4 ) . The d i g i t a l i z e d outputs of gas con-
sumption and harvest a r e r eg i s t e red by a camera, set t o t ake a frame at pre-
se lec ted time i n t e r v a l s .
Production r a t e s of 50 t o 90 grams (D.W.) per 24 hours were obtained
with a working suspension of 3 l i t e r s at a population dens i ty of 5 t o 6
grams ( D . W . ) per l i t e r .
of 5 (day-') o r 0 .2 ( h r - l ) . The bes t r a t e s observed thus far ind ica t e K-values
111. THE CHEMICAL AND PHYSICAL ENVIRONMENT
1. Temperature
The maximum r a t e of c e l l reproduction (growth) occurred(') at 34' t o
0 35OC.
time but growth w a s negl ig ib le .
one-fourth t h e r a t e observed at 35 C.
A t 40 C an enhanced r a t e of gas consumption w a s observed f o r a shor t
At 2OoC t h e rate of growth w a s approximately
0
0 0 Within a temperature range of 25 t o 35 C conversion e f f i c i ency w a s
e s s e n t i a l l y constant (Table 1); Qlo- values for growth w e r e of t h e order of
1 . 5 t o 2.0.

# of Ekps.
13
10
-9 -
TABLE 1
Effect of Temperature on Conversion
Temperature ( O C )
35
25
* ET f ic iency
02/ co2
2.4 - + 0 . 1
2.8 - + 0.2
* Conversion e f f i c i ency i s expressed as t h e number of oxygens u t i l i z e d ( i n
t h e combustion of hydrogen) f o r the conversion of each carbon dioxide.
2 . pH Effec ts .
A neu t r a l pH produced t h e optimal growth r a t e .
3. Inorganic Nut r i t ion .
The n u t r i t i o n a l requirements f o r Hydrogenomonas eutropha were
Bartha (lo) found a requirement f o r N i and described by Repaske") . m e r h a r d t observed stirnillation of hydrogenase a c t i v i t y by Mn and Co.
A s impl i f ied medium w a s described by Bongers(12).
w i th H. eutropha and H-20 i n media containing e i t h e r urea or ammonia n i t rogen
i n t h e presence of Mg, P, and ferrous i ron . Contaminants i n t h e major salts
made supplementation wi th t r a c e elements unnecessary.
inorganic n u t r i t i o n f o r ba tch cu l tures i s summarized i n Table 2.
He found rap id growth
- - -
This information on
I n t h e tu rb idos t a t t h e s teady-s ta te nu t r i en t concentrations, c e l l
mu l t ip l i ca t ion r a t e and a l l o ther proper t ies of t h e c e l l suspension must be
kept at a constant l e v e l . TO maintain t h e optimal s teady-s ta te nu t r i en t

-10-
TABLE 2
- GROWTH REQUIREMENTS OF HYDROGENOMONAS EUTROPHA AND H-20
Temperature
Hydrogen
Oxygen
Carbon dioxide
co( m2 12
&SO4. 7H20
Fe (M4l2 (s04)2.6H20
Phosphate ( N a , K)
PH
33c - 35c
50-560 mm
120-150
70-80 mm
0 .5 g / l i t e r
0.1 g / l i t e r
0.008 g / l i t e r
0.03M
6.5-7.5

-11-
concentrations, t h e concentration of t h e n u t r i e n t s i n t h e feed medium must
be higher than Lnose i n t h e suspznding mediurn, s ince t h e inflowing medium
i s d i lu t ed by t h e suspending medium t o an ex ten t which is a func t ion of t h e
consumption of t h e medium cons t i tuents by t h e c e l l s .
f o r n i t rogen i s i l l u s t r a t e d i n t h e following equation:
The t o t a l m a s s balance
N = N s + N m P
where N i s t h e nitrogen concentration of t h e feed medium, N t h e concen-
t r a t i o n of t h e subs t r a t e n i t rogen and, N t h e concentration of t h e p r o t e i n
( expressed as nitrogen) i n t h e suspension.
of t h e feed medium depends upon the p ro te in concentration of t h e suspension
(which determines t h e nitrogen consumption r a t e ) and upon t h e l e v e l of
s u b s t r a t e nitrogen maintained. With suspensions of r e l a t i v e l y low popu-
l a t i o n density (low p ro te in concentration) and wi th a r e l a t i v e l y low
s u b s t r a t e nitrogen concentration, the n i t rogen concentration i n t h e feed
medium can be r e l a t i v e l y low.
concentration) a r e l a t i v e l y high nitrogen feed rate is necessary.
mismatched n i t rogen feeding rate, and consequently, a t r a n s i t i o n t o a new
s teady-s ta te occurs i f t h e a c t u a l nitrogen consumption rate devia tes from
t h e expected value. Deviations i n t h e n i t rogen consumption r a t e may occur
i f t h e pop:ilation c h a r a c t e r i s t i c s of suspension change wi th time; example
given, i f t h e r a t i o of ac t ive metabolizing c e l l s (working suspension) over
r e s t i n g c e l l s ( i n a c t i v e population) change i n t h e course of an experiment.
The v a l i d i t y of t h i s formulation f o r N feed rate w a s t e s t e d f o r d i f f e r e n t
l e v e l s of c e l l concentrations and the r e s u l t s w i l l be discussed l a t e r .
m S
P Thus, t h e nitrogen concentration
W i t h a high c e l l dens i ty (h igh p ro te in
A

-12-
A problem assoc ia ted with n i t rogen i s t h e extremely r ap id decomposition
of urea, t h e primary nitrogen source i n a closed environment. According t o
K8nig(13) a rap id conversion of urea i n t o ammonia and carbon dioxide i s t o
be expected i n a suspension cu l t i va t ed i n t h e presence of r e l a t i v e l y low
concentrations of ammonia. Apparently under these conditions t h e formation
of c e l l s with a high urease a c t i v i t y r e s u l t ( s e e f i g . 6 ) .
t hese observations.
We confirmed
It would thus appear t h a t t h e presence of a given concentration of
ammonia i n a suspending medium nay be necessary t o prevent t h e buildup of
r e l a t i v e l y high urease a c t i v i t y . We were, however, unable t o de t ec t any
urea i n rap id ly growing s teady-s ta te cu l tu re s i n which a constant l e v e l of
ammonia nitrogen w a s maintained and urea n i t rogen cons t i t u t ed t h e main
n i t rogen source. Apparently, a l s o i n t h e presence of amon ia a rap id urea
decomposition ozcurs.
A r a t iona le similar t o t h a t f o r n i t rogen app l i e s t o o the r elements
(such as P, Mg, Fe and t r a c e elements) requi red f o r c e l l reproduction.
However, s ince these elements a r e t o l e r a t e d a t r e l a t i v e l y high concentrations
and because t h e i r u t i l i z a t i o n i s l imi ted , one would presume t h a t a s u b s t r a t e
concentration approaching t h e concentration of t h e feed medium would lead t o
a s teady-s ta te concentration conducive t o r ap id c e l l reproduction.
While t h e requirements f o r N, P, and Mg f o r s teady-s ta te c u l t u r e s (up
t o 5-6 grams (D.W.) of c e l l s per l i t e r ) are resolved, those f o r t r a c e elements
s t i l l present a problem. W e have found a s i g n i f i c a n t i nc rease i n t h e rate of
c e l l production by add i t ion of t a p water t o a medium which contained a l l t r a c e
elements known t o be necessary. No such e f f e c t w a s observed wi th ba tch
cu l tu re s .
progress . A study concerning t h e t r a c e element requirement i s p resen t ly i n
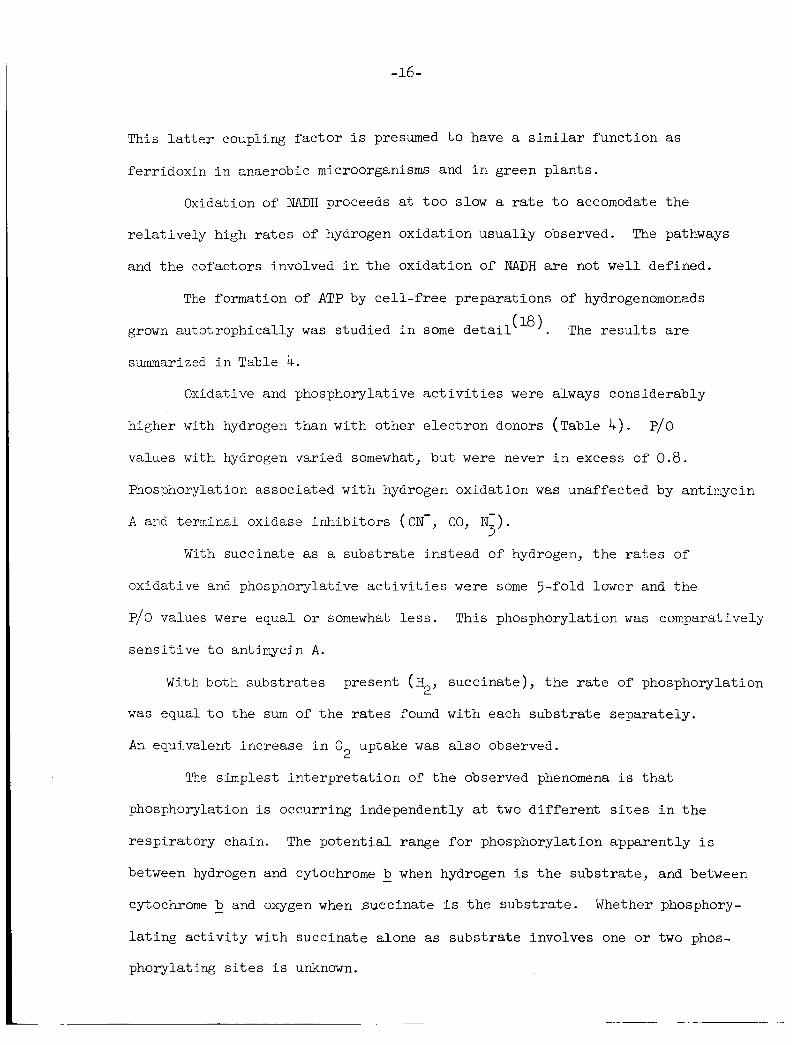
4. Gas Supply.
With regards t o the gaseous substrate, which provides t h e suspension
wi th energy and carbon dioxide, it was found t h a t t h e hydrogen concentration
could be varied widely (40 mm - 600 mm) wi th l i t t l e e f f e c t upon y ie ld .
t h e o ther hand, t h e r egu la t ion of carbon dioxide and oxygen proved more
c r i t i c a l .
t r a t i o n s i n excess of t h i s value growth w a s progressively impeded.
On
Carbon dioxide pressures up t o 90 mm were to l e ra t ed ; wi th concen-
Tne oxygen p a r t i a l pressure of t h e growing suspension had a r e l a t i v e l y
s t rong e f f e c t on t h e r a t e of growth, t h e e f f i c i ency of energy conversion and
t h e metabolic a c t i v i t y with regard t o product formation.
A t r e l a t i v e l y low oxygen concentrations (35 mm - 60 mm), t h e r a t e of
carbon dioxide conversion w a s up t o 50% higher than w a s observed with 150 mm
oxygen. However, t h i s r e l a t i v e l y high conversion r a t e w a s not s t a b l e . Upon
prolonged incubation under these conditions, t he rate of carbon dioxide
f i x a t i o n declined and formation of i n t r a c e l l u l a r l i p i d inc lus ions occurred.
Sibsequently, t h e r a t e of c e l l d iv is ion diminished.
A t r e l a t i v e l y high oxygen concentrations (110 mm - 160 mm) no l i p i d
inc lus ions were formed, and t h e r a t e s of c e l l d iv i s ion and carbon dioxide
f i x a t i o n remained constant ( f i g . 7).
were somewhat less than t h e values observed with lod oxygen concentrations
( s e e Table 3 ) .
The e f f i c i e n c i e s of energy conversion

-14-
TABLE 3
Oxygen supply and energy conversion. G a s phase: 70% H2, 10% C02 0
and 0 as ind i <ated. Urea medium; temperature 35 C. 2
02i co2 1.9 _+ 0.2 2.1 - + 0.1 2.9 _+ 0.2 3.0 3 0 . 2
5 . Material Balance i n a Closed Environment.
I n t he aSove d iscuss ion t h e assumption i s made t h a t carbon dioxide
w a s t h e only component of t he closed environment which had t o be d e a l t wi th
and t h a t t h e o ther ingredien ts necessary f o r c e l l synthes is would be a v a i l -
able i n t h e proper r a t i o t o carbon dioxide. This assumption i s more or less
cor rec t , with the exception of urea.
required t o provide optimal condi t ions f o r t h e biosynthesis , while t h e ratio
a t which carbon dioxide and urea are supplied approaches 4/.25 i f metabolic
wastes are t h e so l e cont r ibu tors .
can thus not be expected, i . e . optimal condi t ions f o r t h e conversion of a l l
carbon dioxide on hand cannot be maintained. Conditions must t he re fo re be
applied t o t h e b a c t e r i a l suspension which lead t o the production of a c e l l
mass which i s r e l a t i v e l y poor i n protein-ni t rogen. Nitrogen s t a r v a t i o n
a l ters the d i s t r i b u t i o n of products of carbon dioxide f i x a t i o n and changes
c e l l cha rac t e r i s t i c s i n a r a t h e r similar fash ion as those observed if
suspensions are incubated at r e l a t i v e l y low oxygen concentrations. It i s
A C/N r a t i o of approximately 4,'1 i s
A material balance wi th regard t o ni t rogen

-15-
obvious t h a t t h i s behavior i s not compatible wi th c u l t i v a t i o n under steady-
state conditions. I n order t o cope wi th t h i s problem, cu l tu re s s tag ing i s
proposed. This technique would involve c u l t i v a t i o n i n two phases , occurring
i n two separa te chambers: one culture chamber containing a l l ava i l ab le
nitrogen, while i n a second chamber growth would occur i n t h e absence of
s u b s t r a t e nitrogen. No information on t h e adequacy of t h i s approach i s
p resen t ly ava i lab le . It i s expected, however, t h a t t h i s technique w i l l
produce t h e bes t nitrogen economy i n a closed environment, but preliminary
inves t iga t ions concerning the s u i t a b i l i t y of nitrogen-starved mater ia l as a
food source a r e not encouraging.
IV ENERGLTICS
1. Efficiency of ATP Formation
Hydrogen i s u t i l i z e d by hydrogen b a c t e r i a for reductive and energy
y i e ld ing purposes. Hydrogenase, an enzyme which mediates t h e u t i l i z a t i o n
of hydrogen, ca ta lyzes t h e reduction of a ye t un iden t i f i ed primary acceptor
which subsequently t r a n s f e r s e lec t rons t o oxygen v i a mediators such as
pyr id ine nucleotide, f l a v i n s and cytochromes. I n t h i s process, t h e two
r eac t an t s e s s e n t i a l f o r CO ass imi la t ion a r e generated: reduced pyridine
nucleotide (NADH ) and adenosine tr iphosphate (ATP).
2
2
The hydrogenase-mediated generation of NADH has been demonstrated 2 i n hydrogenomonads (14’ 15) and o the r hydrogenase containing b a c t e r i a (16) .
However, r e l a t i v e l y l i t t l e is known about t h e e l e c t r o n t r anspor t sequence
a t t h e reducing s i t e of t h e r e sp i r a to ry chain. Repaske (15’ assumes a requi re -
ment f o r FMN as a cofac tor i n t h e reduction of NAD, and has evidence t h a t
another coupling f a c t o r between hydrogenase and NAD may be opera t ive (17) .
-16-
This l a t t e r coupling f a c t o r i s presumed t o have a similar func t ion as
fe r r idoxin i n anaerobic microorganisms and i n green p l a n t s .
Oxidation of NADH proceeds a t t o o Slow a r a t e t o accomodate t h e
r e l a t i v e l y high r a t e s of hydrogen oxida t ion usua l ly observed. The pathways
and t h e cofactors involved i n t h e oxida t ion of NADH are not we l l defined.
The formation of ATP by c e l l - f r e e prepara t ions of hydrogenomonads
grown alrtotrophically w a s studied i n some detail(18).
summarized i n Table 4.
The r e s u l t s are
Oxidative and phosphorylative a c t i v i t i e s were always considerably
higher with hydrogen than with o ther e l e c t r o n donors (Table 4 ) .
values with hydrogen varied somewhat, bu t were never i n excess of 0 .8 .
Phosphorylation associated wi th hydrogen oxidation w a s unaffected by antimycin
A and terminal oxidase i n h i b i t o r s (CN-, CO, N j ) .
P/O
With succinate as a subs t r a t e ins tead of hydrogen, t h e r a t e s of
oxidative and phosphorylative a c t i v i t i e s were some 5-fold lower and t h e
P/O values were equal or somewhat l e s s .
s e n s i t i v e t o antimycin A .
This phosphorylation w a s comparatively
W i t h both subs t r a t e s present ( H succ ina te) , t h e r a t e of phosphorylation 2’
w a s equal t o t h e sum of t h e rates found with each s u b s t r a t e separa te ly .
An equivalent increase i n 0 uptake w a s a l s o observed. 2
The simplest i n t e r p r e t a t i o n of t h e observed phenomena i s t h a t
phosphorylation i s occurring independently a t two d i f f e r e n t s i t e s i n t h e
r e sp i r a to ry chain. The p o t e n t i a l range f o r phosphorylation apparently i s
between hydrogen and cytochrome - b when hydrogen i s t h e subs t r a t e , and between
cytochrome - b and oxygen when succ ina te i s t h e subs t r a t e .
l a t i n g a c t i v i t y with succinate alone as s u b s t r a t e involves one or two phos-
phorylating s i t e s i s unknown.
Whether phosphory-

TABLE 4
The Effect of Various Subs t ra tes and - I n h i b i t o r s on Phosphorylation
SJb st rat e
H2
S ~ c c i nat e
H -k Succinate
p-OH-Butyrate
2
mH2
H2
S x c i n a t e
i n h i b i t o r A p o l e s Pi
h r
6.47
1.23
7-51
0.38
0.11
N- 3 20% co 2.5 y Antimycin 1
10 antimycin A
~
38
100
93
97
97
A patom 0
hr
12.4
6.8
16.9
1.1
3.4
% of Control a >
37
98
100
95
62
% of Control b ) 1 1
84
69
2.5 y Antimycin
5 y Antimycin
47
0
52
.18
.44
* 35
.02
.48
.45
* 49
.45
* 30
.19
0
a )
b )
Values i n absence of i n h i b i t o r s were 9.2 patoms of oxygen and 4.26 p o l e s of P . Values i n absence of i n h i b i t o r s were 4.65 patoms of oxygen and 1.56 pmoles of P .
i
i
-18 -
Our r e s u l t s suggest an oxidat ion O f reduced cytochrome - b by oxygen.
This could be demonstrated spectrophotometrically ( s e e f i g . 8) ; d i s t i n c t
absorption by cytochrome - b obtained from a c e l l - f r e e prepara t ion incubated
with hydrogen, rap id ly disappeared upon in t roduct ion of 0
cyanide concentrations s u f f i c i e n t t o prevent oxidat ion of cytochrome - e .
Whether t h i s r eac t ion between oxygen and cytochrome - b occurs t o t h e same
extent i n t h e absence of CN- i s unclear .
r e l a t i v e l y l o w P/O r a t i o s observed with succinate and from t h e i n a b i l i t y of
antimycin A t o s i g n i f i c a n t l y i n h i b i t oxidat ive a c t i v i t y with t h i s s u b s t r a t e
one would assume t h a t even i n t h e absence of CN- some autooxidation occurs
a t t h e cytochrome - b l e v e l . A s w i l l be discussed l a t e r , spectroscopic
observations on c e l l suspensions subs t an t i a t e t h i s assumption.
i n the presence of 2
Hovever, judging from t h e
2 . Efficiency of CO Conversion. 2
Hydrogen bac te r i a grow by a combination of energy-yielding (eq. 2 )
and energy-consuming (eq. 1) processes, summarized i n t h e following
equations :
2H2 3- C02 --f (CH20) -t- H20
4~~ + 202 -+ 4 ~ ~ 0 ( + ~ T P ) ( 2 )
(1)
The ef f ic iency of C02 conversion can be expressed as an 0 2 2 / C O quot ient :
t h e molal r a t i o of molecules of oxygen u t i l i z e d (eq. 2 ) f o r t h e conversion
of one molecule of C02. Observed quot ien ts are usua l ly of t h e order of 2.
If ATP generation i n i n t a c t c e l l s i s as e f f i c i e n t as t h a t observed i n mito-
chondrial systems, then approximately 12 moles of ATP should be made a v a i l -
able i n t h e combustion r eac t ion (eq . 2 ) , and u t i l i z e d i n t h e energy-consuming

-19-
processes (eq. 1).
required f o r an e f f i c i e n t system. However, s ince our experiments on c e l l -
f r e e preparat ions suggested t h a t cytochrome - b has a high a f f i n i t y for oxygen,
one would assume t h a t an "abbreviated" r e sp i r a to ry chain might be operat ive
i n t h e i n t a c t c e l l . The e f f e c t of a number of terminal oxidase i n h i b i t o r s
on t h e eff ic iency of C02-conversionwas tested i n order t o evaluate t h e
s ign i f i cance of t h e au tooxid izabi l i ty of cytochrome - b.
Such an energy expenditure would be twice t h e amount
The e luc ida t ion of t h e a c t u a l mechanism cons t i t u t e s not only an a rea
of much i n t e r e s t , but has a l s o i t s p r a c t i c a l implicat ions. If, e.g. 3 ATP
ins tead of 1 ATP could be generated f o r each oxygen atom u t i l i z e d , t he r a t e
of e l e c t r o l y s i s required f o r waste regenerat ion could be considerably lower
than present ly an t ic ipa ted . This study w a s undertaken t o obta in evidence on
t h i s po in t .
0 The experiments were conducted at 30 C i n a regular growth medium and
an atmosphere of H 0 and C02. The number of i nh ib i to r s which can be used
wi th i n t a c t c e l l s i s l i m i t e d ; only S i t e I11 (between cytochrome c and 0 )
can e f f e c t i v e l y be inh ib i ted by cyanide, azide or carbon monoxide. No
ef fec t ive inh ib i to r s a r e known which block t h e e l ec t ron t r a n s f e r at s i t e I1
(between cytochrome - b and cytochrome c) i n i n t a c t c e l l s .
cytochrome - c i s not autooxidizable (for spectroscopic evidence see f i g . 8
and f i g . g ) , it i s unl ike ly t h a t i n t h e presence of terminal oxidase i n h i b i t o r s
S i t e I1 w i l l contr ibute subs t an t i a l ly i n o v e r a l l ATP generation.
2? 2
2 -
However, s ince

-20-
TABLE 5 THE EFFECTS OF INHIBITORS ON CONVERSION EFFICIENCY*
Se r i e s Incubation Condition of Incubat i o n CO, F ixa t ion 0, Consumption Eff ic ienc)
(min. ) Gas phase (%) I n h i b i t or ( p o l e s / h r ) ( p o l e s / h r ) 02/ co2 H2 O 2 co2 N2
80 60 15 5 20 Control 32 63 1 -95
80 60 15 5 20% co 17 I
90 60 15 5 20 Control 41
43 2.50
95 2.30
90 60 15 5 20% co 22 45 2.05
0 70 20 i o Control 3.8 8 .O 2 . 1
10 70 20 i o NaN 4.3 8 .7 2.0 3
3
I1 35 70 20 i o NaN 3.7 8.8 2.4
60 70 20 i o Control 4.3 8 .2 1.9
CO Fixat i o n Counts/ p1 2 Se r i e s Incubation Conditions of Incubation G a s Uptake
(min. ) Gas phase (%) I n h i b i t o r ( @/flask) ( CPM)
10
10
10
10
10
IIi 14
14
10
10
H2 32 N2
55 5 40
55 5
80 20
80 20
80 20
80 20
80 23
80 20
80 20
Cont r ol
40% CO
Co nt r ol
3
3
NaN
N a N
Control
CN-
Control
54,000
23,400
16,100
15,700
9,700
23,000
9,900
16,400
146
184
106
104
78
102
115
100
5 10-5, CCCP 130 2,500 19
-21-
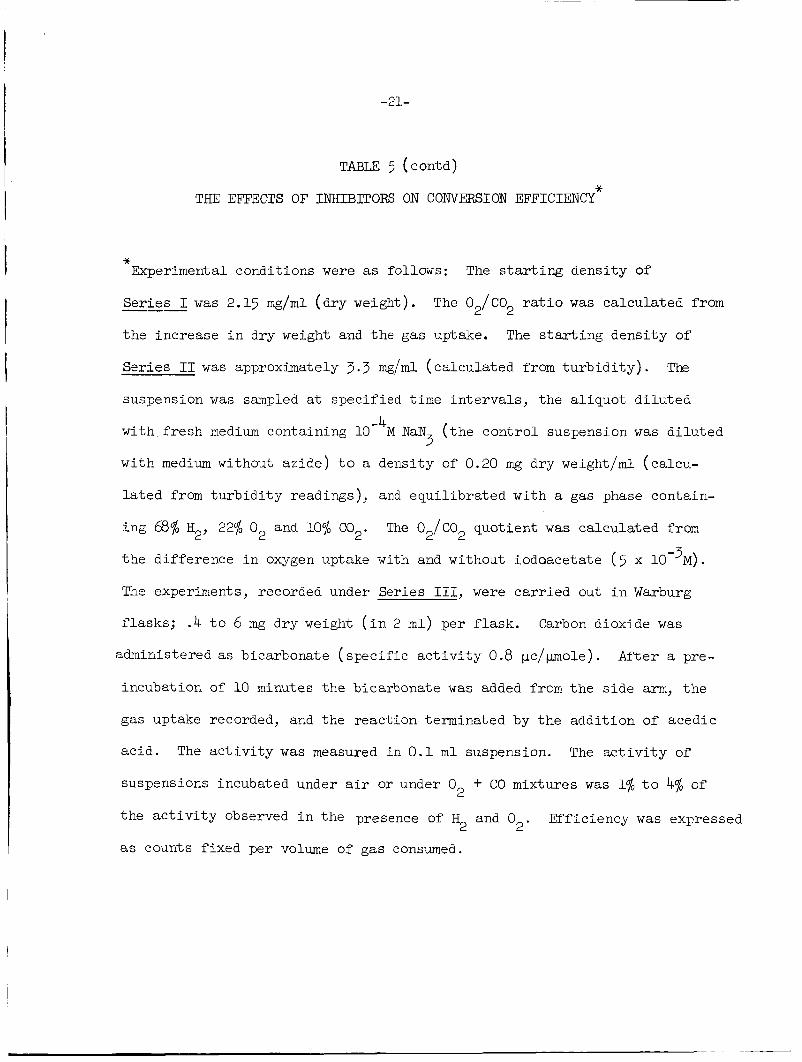
TABLE 5 (contd)
THE EFFECTS OF INHIBITORS ON C O N V ~ S I O N EFFICIENCY*
* Experimental conditions were as follows: The s t a r t i n g dens i ty of
Se r i e s I w a s 2.15 m g / m l (dry weight).
t h e increase i n dry weight and t h e gas uptake. The s t a r t i n g dens i ty of
The 0 /CO r a t i o w a s ca lcu la ted from 2 2 -_--
Ser i e s I1 w a s approximately 3.3 mg/ml ( ca l cu la t ed from t u r b i d i t y ) . T k
suspension w a s sampled a t spec i f ied time in t e rva l s , t h e a l iquo t d i l u t e d
with f r e s h medium containing 10 M N a N
w i t h medium without a z i d e ) t o a density of 0.20 mg dry weight/ml (calcu-
-4 ( t h e con t ro l suspension w a s d i l u t e d 3
l a t e d from t u r b i d i t y readings), and equ i l ib ra t ed wi th a gas phase contain-
i n g 68% H2, 22% O2 and 10% C02. The 0 /CO quot ien t w a s ca lcu la ted from 2 2 t h e d i f fe rence i n oxygen uptake with and withoilt iodoacetate ( 5 x 10 -3 M ) .
The experiments, recorded under Series 111, were ca r r i ed out i n Warburg
f lasks ; .4 t o 6 mg dry weight ( i n 2 m l ) per f l a s k . Carbon dioxide w a s
administered as bicarbonate ( s p e c i f i c a c t i v i t y 0.8 pc/pmole). Af te r a pre-
incubation of 10 minutes t h e blcarbonate w a s added from t h e s i d e arm, t h e
gas uptake recorded, and t h e reac t ion terminated by t h e add i t ion of acedic
ac id . The a c t i v i t y w a s measured i n 0 .1 m l suspension. The a c t i v i t y of
suspensions incubated under air or under 0 2
t h e a c t i v i t y observed i n t h e presence of H 2
as counts f ixed per volume of gas consumed.
+ CO mixtures w a s 1% t o 4% of
and 02. Eff ic iency w a s expressed

-22-
The th ree i n h i b i t o r s cyanide, a z i d e and carbon monoxide not only
i n h i b i t e l ec t ron t r a n s f e r v i a cytochrome 5 t o oxygen, but a l s o r e a c t with
o ther metalloenzymes ( e . g. hydrogenase, ca ta lase , a ldo la se ) .
"side" e f f ec t s a considerable decrease i n t h e r a t e of growth can be expected;
however, of i n t e r e s t i s t h e i r e f f e c t on conversion e f f i c i ency .
Due t o these
In TaSle 5 a number of observations of conversion e f f i c i ency i n t h e
presence and i n t h e absence of terminal oxidase i n h i b i t o r s a r e l i s t e d . The
conversion e f f i c i e n c i e s are expressed as the 0 /CO
14 C as the number of counts over t o t a l gas uptake.
r a t i o or, i n case of 2 2
Under normal cord i t ions of c u l t i v a t i o n t h e 0 / C O r a t i o i s 2. The
data i n Table 5 i nd ica t e t h a t t he r a t i o i s not s u b s t a n t i a l l y changed i n
the presence of cyanide, azide o r carbon monoxide. Consequently, one must
conclude t h a t S i t e I a l s o s a t i s f i e d t h e necessary ATP requirement i n t h e
uninhibited system.
2 2
CO, a ss imi la t ion observed i n the presence of H and O2 i s dependent < 2
upon t h e formation of ATP, which is generated by oxidat ive phosphorylation.
14 This i s evident from the r e l a t i v e l y s m a l l amounts of C assimilated i n
c e l l s incubated i n the presence of an uncoupler (CCCP) of oxidat ive phos-
phorylation. The CO a s s imi l a t ion observed i s thus a net synthes is which
does not depend upon subs t r a t e l e v e l phosphorylation.
Spectrophotometric observations on t h e behavior of cytochrome b i n
2
- i n t a c t ce l l s , i l l u s t r a t e d i n f i g . 9 gave r e s u l t s similar t o those with
ce l l - f r ee e x t r a c t s ( s e e f i g . 8 ) .
absorption due t o cytochrome - c ( f i g . 9, curve 2) i s observed, while cyto-
chrome - b i s completely oxidized. The observations support t h e conclusion
t h a t an ac t ive cytochrome b-oxidase is operat ive i n t h e i n t a c t c e l l s .
I n t h e presence of a i r and CN- only
-
-23-
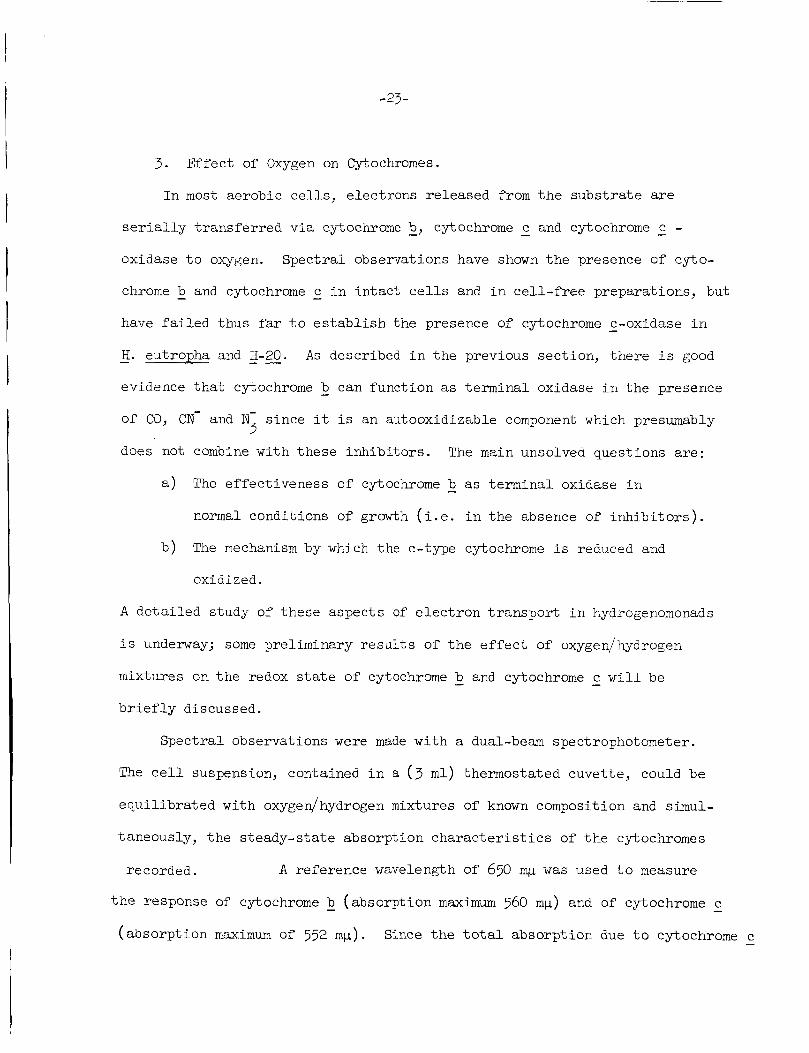
3. Effect of Oxygen on Cytochromes.
I n most aerobic c e l l s , e lec t rons released from t h e subs t r a t e are
s e r i a l l y t r ans fe r r ed v i a cytochrome 2, cytochrome - c and cytochrome - c - oxidase t o oxygen. Spec t ra l observations have shown t h e presence of cyto-
chrome - b and cytochrome - c i n in t ac t c e l l s and i n c e l l - f r e e preparat ions, but
have f a i l e d thus far t o e s t a b l i s h the presence of cytochrome - e-oxidase i n
- H. eutropha and - - H-20. A s described i n the previous sect ion, t he re i s good
evidence t h a t cytochrome b - can funct ion as terminal oxidase i n t h e presence
Of CO, CN- and N- s ince it is an autooxidizable component which presumably 3 does not combine with these inh ib i to r s . The main unsolved questions a re :
a ) The ef fec t iveness o f cytochrome b as te rmina l oxidase i n
normal conditions of growth ( i . e . i n t h e absence of i n h i b i t o r s ) .
The mechanism by which the C-type cytochrome i s reduced and
oxidized.
-
b )
A de t a i l ed study of these aspects of e l ec t ron t r anspor t i n hydrogenomonads
i s underway; some preliminary r e s u l t s of t h e e f f e c t of oxygen/hydrogen
mixtures on t h e redox s t a t e of cytochrome b and cytochrome c w i l l be
b r i e f l y discussed.
- -
Spect ra l observations were made with a dual-beam spectrophotometer.
The c e l l suspension, contained i n a ( 3 m l ) thermostated cuvette, could be
equ i l ib ra t ed with oxygen/hydrogen mixtures of known composition and simul-
taneously, t h e s teady-state absorption c h a r a c t e r i s t i c s of t h e cytochromes
recorded. A reference wavelength of 650 mp w a s used t o measure
t h e response of cytochrome - b (absorpt ion m a x i m u m 560 mp) and of cytochrome c (absorp t ion m a x i m u m of 552 mp). Since t h e t o t a l absorpt ion due t o cytochrorne c -

-24-
i s approximately twice t h a t Of cytochrome 2, changes a t t h e cytochrome - c
l e v e l were measured at 548 t o 549 mp. I n t h i s fash ion equal absorpt ion of
both cytochromes is obtained.
I n f i g . 10 the redox s t a t e s of cytochrome (closed symbols) and
cytochrome c (open symbols) as a func t ion of 0 /H
Complete reduct ion of t h e cytochromes is assumed i f t h e suspension i s
flushed w i t h hydrogen.
mixtures a r e i l l u s t r a t e d . 2 2 -
This i s indeed so i n case of cytochrome - c. The
absorption difference between t h e hydrogen reduced and a i r oxidized sus-
pension (H,-0
d i th ion i t e reduced and fe r r icyanide oxidized suspensions (D-F d i f f e rence ) .
d i f fe rence) usua l ly equaled t h e d i f fe rence obtained wi th r 2
However, complete r educ t ion of cytochrome - b w a s never observed i n t h e
presence of hydrogen.
absorption increased with decreasirig temperatures.
difference w a s approximately 75% t o 90% of t h e (D-F) d i f fe rence , while at
1 C hydrogen w a s capable of reducing only some 60% of cytochrome b. - This
The discrepancy between t h e (D-F) and ( H -0 ) 2 2
A t 30°C, t h e ( H2-02)
0
temperature response of cytochrome - b corroborates t h e oxidat ion k i n e t i c s
i l l u s t r a t e d i n f i g . 10. Apparently, t h e t r a c e amounts of oxygen present
i n hydrogen a r e s u f f i c i e n t t o p a r t i a l l y oxidize cytochrome - b.
Equi l ibra t ion with increasing amounts of oxygen ( up t o approximately
5% i n H2) r e s u l t s i n f u r t h e r oxidat ion of cytochrome b. -
containing 5% t o 25% oxygen, t h e redox state of cytochrome - b i s l i t t l e
a f fec ted . Apparently, a t these 0 /H r a t i o s , reduct ion and oxidat ion are 2 2
i n balance.
With mixture

-25-
L i t t l e change i n t h e redox state of cytochrome - c is observed with
If 02/H2 mixtures containing up t o 5% O2 ( s e e f i g . 10, open symbols).
t h e proportion of 0 i n t h e mixtures i s f l i r ther increased, a gradual
ox ida t ion of cytochrome - c i s observed.
2
Complete oxidation of cytochrome
c usua l ly occurs at lower 0 /H r a t i o s than does cytochrome - b . 2 2 -
The observations of t h e redox s t a t e of cytochrome c as a func t ion of - 02/H2 concentrat ions i s provis iona l ly in t e rp re t ed on t h e b a s i s of t h e
assumption t h a t oxidation of cytochrome - c i s mediated by a r e l a t i v e l y
"poor" oxidase. This would account f o r t h e rap id oxidation of cytochrome c - wi th mixtures containing 15% t o 25% 02.
A t low oxygen concentrations (up t o 5% i n H2), cytochrome c i s - v i r t u a l l y i n a reduced s t a t e , and thus i s an i n e f f i c i e n t e l e c t r o n acceptor.
Presumably, under these conditions cytochrome b-oxidase i s predominant, -
and t h e e l e c t r o n t r anspor t t o oxygen occurs (a t a reduced r a t e ) v i a t h i s
pathway.
It i s not c l e a r whether a t the higher oxygen concentrations f e r ro -
cytochrome b i s a l s o oxidized by ferri-cytochrome c. However, some - -
i n s i g h t t o t h e sequence of reduction and oxidation of t h e two cytochromes
w a s gained, suggesting t h a t under c e r t a i n conditions such a t r a n s f e r i s
poss ib le . The curves of f i g . 11, obtained b j measuring t h e t r a n s i t i o n from
oxidized t o t h e reduced state, show t h a t upon t h e in t roduct ion of hydrogen
i n t o a i r - equ i l ib ra t ed suspension, cytochrome b i s i n i t i a l l y reduced more
r ap id ly than cytochrome c, although a s teady-s ta te i s subsequently
-
es tab l i shed . A rapid t r a n s i t i o n then occurs, i nd ica t ing t h a t cytochrome c -

-26-
i s being reduced f u r t h e r than cytochrome - b .
oxygen with hydrogen, cytochrome - b becomes gradual ly reduced.
Upon f u r t h e r s u b s t i t u t i o n of
Introduction of a i r ( f i g . 11, s o l i d l i n e ) i n t h e hydrogen-reduced
sample r e s u l t s i n a r e l a t i v e l y fast oxida t ion of cytochrome 2, and a
r e l a t i v e l y s lov oxidation of cytochrome - c as indica ted by an absorption
change i n t h e d i r e c t i o n of (reduced) cytochrome - e .
(2 and - c oxidize at t h e same r a t e ) cytochrome - c becomes completely oxidized.
If the oxidation i s ca r r i ed out at a lower temperature ( f i g . 11, dashed
curve) an "overshoot" i n t h e d i r e c t i o n of reduced cytochrome b - i s observed.
This ind ica tes t h a t complete oxida t ion of cytochrome b occurs after complete
oxidation o f cytochrome e .
After a s teady-s ta te
-
-
The r e s u l t s i l l u s t r a t e d here give only an ind ica t ion with respec t t o
the sequence of reduction and oxidation, but do not represent q u a n t i t a t i v e l y
t h e redox s t a t e of t he cytochromes. The oxidation k i n e t i c s , however, a r e
i n complete agreement wi th t h e r e s u l t s i l l u s t r a t e d i n f i g . 10.
D 3 ; t a presented ind ica t e t h a t t h e oxida t ive energy-generat ing system of
hydrogenomonads can, under c e r t a i n conditions, u t i l i z e an abbreviated
e lec t ron t r anspor t chain, t e rmina t ing a t cytochrome - b. Evidence supporting
t h i s view was obtained from ATP formation and e f f i c i ency of CO f i x a t i o n
i n t h e presence and i n t h e absence of c e r t a i n i n h i b i t o r s , as well as from
observations concerning t h e redox s t a t e s of cytochrome b and c as a func t ion
of oxygen concentration. Possibly t h e b e s t i n t e r p r e t a t i o n of t hese d a t a is
t h a t at r e l a t i v e l y low oxygen concentrations, t h e usua l growth conditions of
t he ce l l s , t h e abbreviated chain provides t h e bulk of energy for syn thes i s .
2
- -

-27-
But t h i s assumption does not provide a so lu t ion for t he puzzling behavior
of cytochrome - e .
NAD - cytochrome - c - reductase, a pathway a l s o known t o be present i n
hydrogen~monads(~'), t hen one could conclude t h a t t h e oxida t ion of cyto-
chrome - c r e s u l t s i n expenditure of NADH. Because conversion e f f i c i e n c i e s
are cons i s t en t ly lower a t r e l a t i v e l y high oxygen concentrations ( see
Table 3 ) , t h i s patbway must be defined as uneconomical f o r t h e c e l l .
If one assumes t h a t cytochrome - c i s mainly reduced by
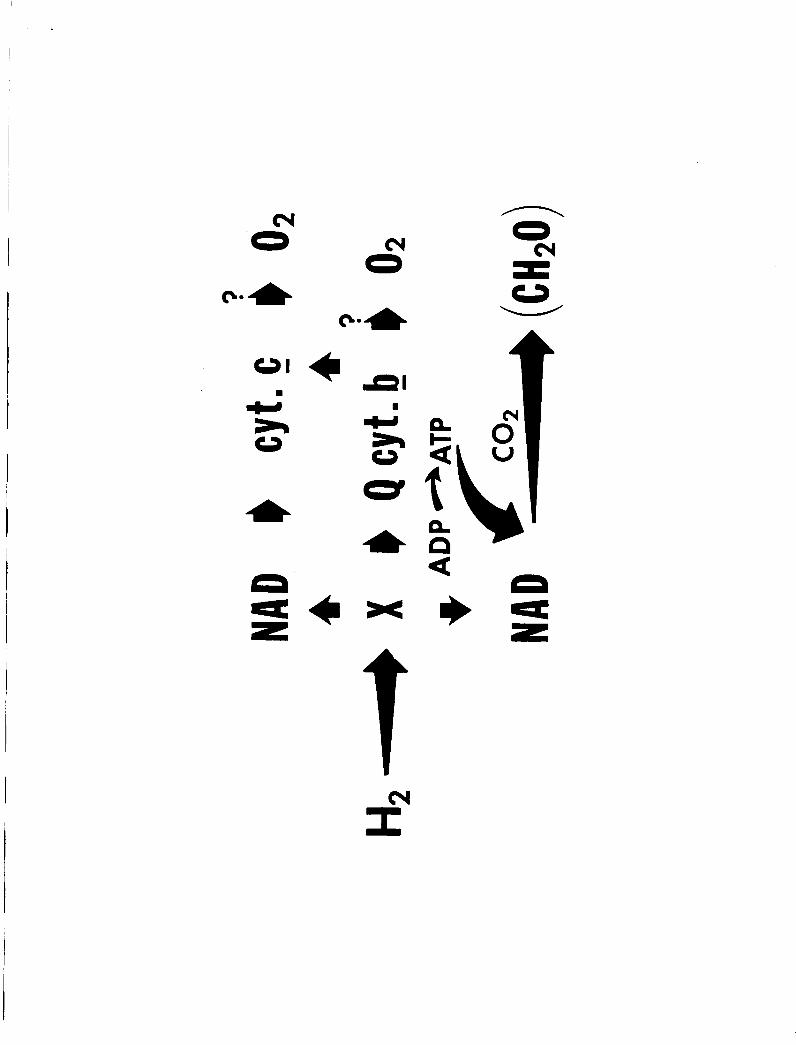
A t e n t a t i v e e l ec t ron t ranspor t system which i n pa r t accounts f o r t h e
above i s i l l u s t r a t e d i n f i g . 12. This scheme includes "X", a primary,
ye t un ident i f ied acceptor, presumably having a redox p o t e n t i a l of t h e
o rde r of fe r r idoxin , and an unident i f ied quinone "Q" (18). NAD i s not
included i n t h e abbreviated e lec t ron t r anspor t sequence f o r reasons
discussed e a r l i e r (I8).
of .NADH i s t o provide t h e c e l l w i t h reducing equivalent f o r CO
r a t h e r than t o provide energy v i a oxidative phosphorylation. The scheme i s
a t e n t a t i v e one, because determinations of t h e turn-over r a t e s of cytochrome
- b and cytochrome - c oxidase and cha rac t e r i za t ion of t h e oxidases w i l l be
necessary t o define t h e i r cont r ibu t ion i n e l e c t r o n t r a n s p o r t .
Briefly, it i s considered t h a t t h e main func t ion
reduction, 2
-2a -
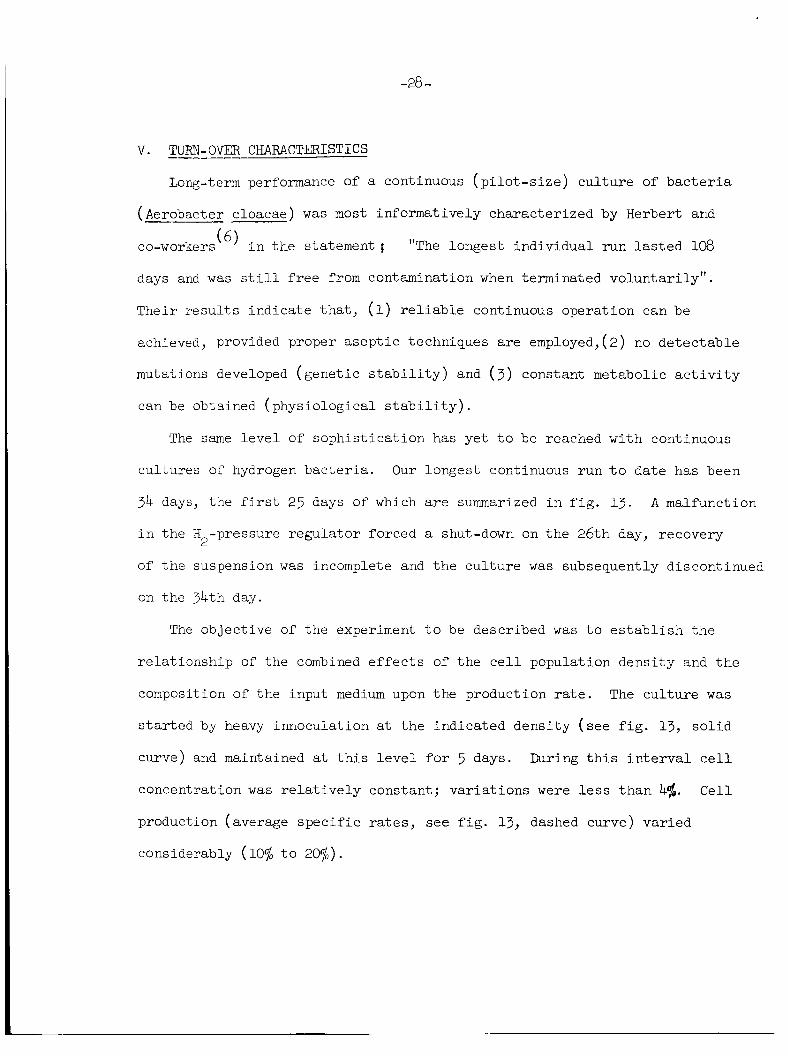
V. TURN-OVER CHARACTERISTICS -----
Long-term performance of a continuous ( p i l o t - s i z e ) cu l tu re of b a c t e r i a
(Aerobacter cloacae) w a s most informatively character ized by Herbert and
co-workers(6) i n the statement ; "The longest ind iv idua l run l a s t e d 108
days and w a s s t i l l f r e e from contamination when terminated voluntar i ly" .
Their r e s u l t s ind ica te t h a t , (1) r e l i a b l e continuous operat ion can be
achieved, provided proper a sep t i c techniques are employed, ( 2) no de tec tab le
mutations developed (genet ic s t a b i l i t y ) and (3) constant metabolic a c t i v i t y
can be obtained (physiological s t a b i l i t y ) .
The s m e l e v e l of soph i s t i ca t ion has ye t t o be reached with continuous
cul tures of hydrogen bac te r i a . Our longest continuous run t o da te has been
34 days, t he f i r s t 25 days of which a r e summarized i n f i g . 13. A malfunction
i n the H -pressure regula tor forced a shut-down on t h e 26th day, recovery
of t h e suspension w a s incomplete and t h e cu l tu re w a s subsequently discontinued
on the 34th day.
2
The object ive of the experiment t o be described w a s t o e s t a b l i s h the
re la t ionship of t he combined e f f e c t s of t h e c e l l population dens i ty and t h e
composition of the input medium upon t h e production r a t e . The cu l tu re w a s
s t a r t e d by heavy innoculation a t t h e indicated dens i ty ( s e e f i g . 13, s o l i d
curve) and maintained at t h i s l e v e l f o r 5 days. During t h i s i n t e r v a l c e l l
concentration w a s r e l a t i v e l y constant; va r i a t ions were l e s s t han 4$. Cel l
production (average s p e c i f i c r a t e s , see f i g . 13, dashed curve) var ied
considerably (10% t o 20%).

-29-
0 cu
WI
f l
01
cu r-
cu t-
m a3
\D "9
" r-
cu r-
r- In
0
r- In
0
cu Ln
0
t- -3
0 n d \ Z Z ho U
cd
3
9
09
W M
W M
W M
W M
53 0
53 0
rr\ CU
0
M cu 0 n rl \ z M
W
07 m n "
W
8 0
co 0 0
8 0
8 0
co 0 0
8 0
8 0
W 0 0 0
W 0 0 0
W 0 0 0
n
W
In I 0 rl x 3
Ln I 0 rl X f
In 1 0 d X 3
In I 0 rl X 3
Ln l a x f
In I
$1 X -3
Ln I 0 rl X f
In I 0 rl X -3
In I 0 rl x 7
In I 0 d X -3
x v
0
\o
n
0)
X"
O*
(u
n 0 O M
0 0
M 0 O M
M 0 O M
M 0 O M
M 0
0 - 4
M 0
M 0 o r l
M 0 o r l
n 0 o r l
r i -
f
n rl
-h II
rn c, d a, E al rl w Q)
i
A .
C U M u 3 L n
ri
0 " P
Ln f
0
f X"
Of
1
cu f
0
u3
rl u 0 u
X"
"
-30-
The population w a s allowed t o increase (e .g . on t h e 5 th day) i n small
increments (of approximately nne OD) by i n a c t i v a t i n g t h e dens i ty cont ro l .
Af te r t h e s m a l l increment w a s a t ta ined , t h e cu l tu re w a s operated automatical ly
f o r approximately ha l f an hour. During t h i s i n t e rva l , c e l l concentrat ion
w a s maintained constant by the add i t ion of t h e more concentrated medium
( f o r composition see Table 6).
t h e desired population dens i ty w a s achieved.
The incremental s t eps were repeated u n t i l
The s p e c i f i c output r a t e w a s f a i r l y constant during the f irst nine
days.
presumably caused by malfunctioning oxygen sensor. However, a f te r adjustment
of t h e sensor recovery w a s incomplete, u n t i l t he t r a c e element concentrat ion
w a s t r i p l e d on the 15th day. No d i r e c t r e l a t i o n s h i p between cause and cure
i s evident, however. Supplementation with t r a c e elements w a s accompanied by
a voluntary increase i n population dens i ty . Good production w a s subsequently
obtained ind ica t ing t h a t a l l nu t r i en t demands were s a t i s f i e d . On f u r t h e r
increasing the dens i ty (19th day) t h e harvest output declined sharply.
dec l ine i n production w a s probably due t o l ack of CO
but other n u t r i t i o n a l de f i c i enc ie s may have a l s o contr ibuted. The operat ion
a t these r e l a t i v e l y high d e n s i t i e s i s cu r ren t ly being inves t iga ted .
Then (10th t o 15th day) a s ign i f i can t decrease w a s observed,
This
( s e e sec t ion 11, 2 ) , 2
Phosphate and ni t rogen concentrations i n t h e suspending medium were
determined da i ly .
proved adequate. The phosphate concentrat ion of t h e suspending medium
sta’oilized a t a s l i g h t l y lower l e v e l (.029 t o .O27), depending on populat ion
densi ty .
The phosphate concentration (.03M) of t h e input medium

-51-
During t h e f irst 17 days of operation, t h e n i t rogen concentration i n
t h e suspending medium w a s balanced a t - .3O grams per l i t e r : t h e expected
leve l f o r t h e coIribiriittioii of c e l l population arid n i t rogen input employed.
The r e s u l t s s a t i s f y t h e mass balance r e l a t ionsh ip (see 111, 3).
spec i f i c rate of c e l l production observed during t h e last 5 days of operat ion
i s accompanied by an increase i n the l e v e l of suspension nitrogen; one would
expect t h a t t h i s increase i s caused by decomposition of ce l l s .
The low
Nitrogen w a s supplied as a urea-ammonia mixture (see Table 6); it w a s
found e a r l i e r t h a t t h e suspension-pH could thus be maintained by r e l a t i v e l y
low phosphate buf fer concentration. While t h e feed medium contained twice
as much a r e a as ammonia, l i t t l e o r no urea w a s detected i n the suspending
medium.
obviously not operat ive under t h e conditions employed ( e . f . f i g . 6 ) .
Since a l l urea i s r a p i d l y decomposed, urease cont ro l by ammonia i s
The bes t s p e c i f i c output rates ( f i g . 13, 15th t o 19th day) were of t h e
-1 order of .80 grams (D.W.) ind ica t ing a K-value of .16 t o .20 ( h r
t h i s ra te i s expressed as volume of CO
suspension, t he hourly spec i f i c r a t e i s 150 ml . A value of t h e same order
i s observed a t t h e r e l a t i v e l y l o w c e l l dens i t i e s (0 t o 10 days, f i g . 13).
Presumably such r a t e s can be maintained at s t i l l higher c e l l concentrat ions
(8 t o 10 grams), but it i s not expected t h a t a s u b s t a n t i a l increase i n t h e
s p e c i f i c r a t e can be r ea l i zed .
). If
converted per gram (D.W.) of working 2 *
The ear l ier ca lcu la t ions (”‘) i nd ica t ing
-__-_-- * Values of t h e same order of magnitude obtained wi th ba tch cu l tu re s were
reported e a r l i e r (L2)

-32-
t h a t a suspension volume of some 20 l i t e r s would provide s u f f i c i e n t re-
generative capacity for t h e carbon dioxide output (- 22 l i t e rs ) of one man
seem t o be borne out by t h e r e s u l t s described here .
No attempts were made t o reso lve simultaneously t h e e f f i c i e n c y of energy
conversion i n continuous cu l tu re s . However, t h e measured s p e c i f i c rates
warrant t h e expectat ion t h a t energy u t i l i z a t i o n , which i s f a i r l y constant
under average conditions, w i l l not g r e a t l y exceed t h e values s t a t e d i n
f i g . 1.

VI. FIGURES

Figure 1 - Flow diagram of a l i f e support system based on t h e coupling
e l e c t r o l y s i s of w a t e r and biosynthesis by hydrogen bac te r i a .

n c
0
I
v, W I- v, a 3
7-
9- v, c
v,x < ON
c3 z v, v, W
-
n o 0 0 orr k h
ON I + 0 0
N
T N
0 + ON I 0
.. h v, W E
z 2 3 I
ON I v\
+ ON I 0
T N
0 0 + 0 N
N
+ I \o
N
.. v, v, W
- E z > v, 0 m -
v, SI- C
W
N < 0 0
(-0
+ E Z N
I dE5 \o
T * ON I \o

Figure 2 - Continuous cu l ture apparatus, t u r b i d i t y control led.

0
ggpw--- -1
I I I
I
1 I I I I

Figure 3 - p H chamber ( l u c i t e ) , actual s ize .

Corn bina tion ,/ Electrode
P Luci te

Figure 4 - Density cont ro l (sample) chamber, ac tua l size.

Tef Ion Gasket
REX CL607
indow
mm mm
mm
'indow

Figure 4A - Density control c i r c u i t r y

e e
0
0 m = 0 I
e / I I I I I I I I I I ,\ 0 (D cv 0
e
n
13 Figure 6 - Effect of ammonia on urease a c t i v i t y of H-16 ( K b i g ) .

C 5 10 15
TIME (HRS.)
w
W U 3
100 g
TIME (HRS.)

Fjgure 7 - Rate of CO consumption ( t o p ) and formation of i n t r a c e l l u l a r 2
( l i p i d ) inc lus ion as a func t ion of oxygen concentration a t
constant H and CO supply. 2 2

Lamps GE253X
loa 1w --
115V ON AC
SARKES TARZIAN
AC .
SE N S ITlVlTY = 100pf =
2 5 V
CONTACTS ON METER RELAY
I NO

Figure 5 - OD/DW Relationship. Inse t : OD/DW r a t i o at constant dens i ty .

1.8
1.6
14
1.2
1 .o .8
14
12
10
8
6
4
2
F m M 0 2 n f / 0.19 mM02
L - 008mM02 mM02
0 1 2 3 4 5 6 Time (hr)
P 0.05 mMo2
bp 0.08 m MO2
0.13 mMO2
0.19 mM02
1 2 3 4 5 6 Time (hr)
Figure 8 - Oxidation of reduced cytochrome - b by oxygen. Sample (Thunberg)
cuvette containing 2 m l ex t r ac t (10mg p ro te in per m l ) w a s
gassed with hydrogen, reference cuvette with air . A f t e r an
incubation of 5 minutes at room temperature, spectrum 1 w a s
obtained. Subsequently, cyanide w a s added from t h e side-arm
( f i n a l conc. 10 M), t h e hydrogen i n t h e sample cuvette
replaced by air and spectrum 2 w a s obtained.
-4 were obtained with 10
cuvette. Spectrum 3 w a s measured after f lush ing t h e sample
with hydrogen and t h e reference with a i r .
obtained subsequently after f lush ing t h e sample cuvette with air .
Measurements were made at room temperature i n Cary model 15.
-4
Spectra 3 and 4
M CN- i n both reference and sample
Spectrum 4 w a s

.01 OD I ‘ 1 I I
I I
I I I
\ \ \
I I
,*
/3
4
/ / / / /
WAVELENGTH ( m p ) 0

Figure 9 - Absorption spectrum of i n t a c t _H-20. -
Curve 1: Sample hydrogen reduced and reference a i r oxidized; absorpt ion
maxima 552 mp, (cytochrome - c ) and 560 mp, (cytochrome - b ) .
Sample oxidized i n air i n t h e presence of CN-, reference i n a i r
i n t h e absence of CN-.
Curve 2:

cu r
0 II

Figure 10 - Redox state of cytochrome 3 and cytochrome - c as a funct ion
of oxygen (hydrogen as balance).
reduced by hydrogen w a s subsequently flushed with oxygen/hydrogen
mixtures of known composition, and redox s t a t e of cytochrome - b
and - c ( s teady-s ta te values) p lo t t ed as a funct ion of oxygen.
Measurements were made sequent ia l ly i n a dual beam spectro-
photometer; reference wavelength 650 mp.
The suspension ( i n t a c t c e l l s )

(D (D
L
0 b -
I 0 N 0 0 0
00 (D Tt 0 0 c
(D (D
L
0 b -
I I 0 N 0 0 0
00 (D Tt 0 0 c
In N
0 N
In - 0 F
10
0 0
Figure 11 - Trans i t ion changes of cytochrome 2 and of cytochrome - c i n
a suspension of Hydrogenomonas SJ. Suspension i s reduced
by f lushing with hydrogen, and oxidized by f lushing t h e sample
with a i r . A wavelength of approximately 548 mp (cytochrome c, pos i t ive def lec t ion) w a s used as sample beam, and a wavelength
of approximately 562 mp (cytochrome > absorption, negative
def lec t ion) as reference beam.
lengths w a s such t h a t t h e absorpt ion due t o cytochrome - c w a s
balanced (zero def lec t ion) by t h e absorption of cytochrome b,
both i n oxidized ( A ) and reduced states (B) .
The se l ec t ion of t h e two wave-

AOD cyto
t
AOD \ 1 cyto
C transition at IOOC b
---- - transition at 3 " ~ b
I I I I I I
I I I I 1 \ \ \
I
I I
'd
Hydrogen Air ~
0 2 4 6 8 10 12 14 TIME (minutes)

Figure 12 - Tentat ive e l ec t ron t ranspor t scheme of Hydrogenomonas 9.
( see t e x t ) .
cy 0 (Y
n
n n

Figure 13 - Production rate of - - H-20 i n a t u r b i d o s t a t i c a l l y cont ro l led
continuous cu l ture . For condi t ions see Table 6.

OPTICAL DENSITY ( 1.0 cm LIGHT PATH)
I I u, G 01
I I
A 0 0
N 01
I
r- I I I I I 1 ----I L,
L
r I I
- J
I I I I 0 p 0 *
01 k 0 0 0 0 HARVEST (g dry w t / h r / I susp)
d
N 01 N
01

v I1
REFERENCES
1. Bongers, L., Aerospace Medicine, z, 139, 1964. 2. Bongers, L., B. Kok, Dev. i n Industr . Microbiol., 2, 183, 1964.
3. Repaske, R. , J. Bacter’iol., 83, - 418, 1962
4.
5. Novick, A. and L. Sz i l l a rd , R o c . Nat. Acad. Sc i . , - 36, 708, 1950.
6. Herbert, D., R. Elsworth and R. T e l l i n g . , J. Gen. Microbiol., - 14, 601, 1956. 7. Foster, J. and J. Li tchf ie ld , Biotech. and Bioeng., - 6, 441, 1964.
8. Finn, R., Bac ter io l . Rev., - 18, 254, 1954.
9.
Monod, J., Ann. I n s t . Pas teur . , 2, 390, 1950.
Bongers, L. , Final Report ER 13270-4 ( NASw-713) Ju ly , 1964. 10. Bartha, R. and E. Ordal, J. Bacteriol . , 89, - 1015, 1965.
11. Eberhardt, U., Arch. Mikrobiol., z,.288, 1966.
12. Bongers, L. and J. Medici, Paper presented a t AIBS/NASA Meeting on
Regenerative Systems, Washington, 1966.
13.
14.
15. Repaske, R., J. Biol. Chem., 237, 1357, 1962.
16. Peck, H. and H. Gest, Biochem. B iopbs . Acta, 9, 587, 1954. 17. Repaske, R., Biochem. Biophys. R e s . Corn. ( I n Prep.)
18.
19. Repaske, R., C. Lizotte, J. Biol. Chem., 240, 4774, 1965.
K b i g , C., H. Kaltwasser and H. Schlegel, Arch. Mikrobiol., 53, 231, 1966. Packer, L. and W. Vishniac, Biochem. Biophys. Acta, x, 153, 1955.
Bongers, I,., J. Bact., - 93, (May) 1967.