Chemical Interactions between Potassium, Nitrogen, Sulfur...
83
THESIS FOR THE DEGREE OF DOCTOR OF PHILOSOPHY Chemical Interactions between Potassium, Nitrogen, Sulfur and Carbon Monoxide in Suspension-Fired Systems THOMAS ALLGURÉN Energy Technology Department of Space, Earth and Environment CHALMERS UNIVERSITY OF TECHNOLOGY Göteborg, Sweden 2017
Transcript of Chemical Interactions between Potassium, Nitrogen, Sulfur...
THESIS FOR THE DEGREE OF DOCTOR OF PHILOSOPHY
Chemical Interactions between Potassium, Nitrogen, Sulfur and Carbon Monoxide in Suspension-Fired Systems
THOMAS ALLGURÉN
Energy Technology
Department of Space, Earth and Environment
CHALMERS UNIVERSITY OF TECHNOLOGY
Göteborg, Sweden 2017
Chemical Interactions between Potassium, Nitrogen, Sulfur and Carbon Monoxide in
Suspension-Fired Systems
THOMAS ALLGURÉN
ISBN-978-91-7597-601-3
© THOMAS ALLGURÉN, 2017
Doktorsavhandlingar vid Chalmers tekniska högskola
Ny serie nr 4282
ISSN0346-718X
Energy Technology
Department of Space, Earth and Environment
CHALMERS UNIVERSITY OF TECHNOLOGY
SE-412 96 Göteborg
Sweden
Phone: +46 (0)31-772 10 00
Printed by Chalmers Reproservice
CHALMERS UNIVERSITY OF TECHNOLOGY
Göteborg, Sweden 2017
I
Chemical Interactions between Potassium, Nitrogen, Sulfur and Carbon Monoxide in
Suspension-Fired Systems
THOMAS ALLGURÉN
Energy Technology
Department of Space, Earth and Environment
Chalmers University of Technology
Abstract
Drastic cuts in global CO2 emissions are needed to mitigate global warming and limit the
average temperature increase to well below 2ºC. The power generation sector is largely
based on fossil fuels and generates a significant share of the global CO2 emissions. Thus,
new power generation processes with substantially reduced CO2 emissions need to be
employed to mitigate global warming. Two alternatives that may be part of the solution is
the replacement of coal with biomass or to apply the concept of carbon capture and storage
(CCS). In CCS processes the CO2 is captured and processed on the plant site and thereafter
transported to a storage location. Oxy-fuel combustion, which has been studied in this
thesis, has been demonstrated in large-scale pilot plants (30-60 MW). This work
investigates the possibilities to co-combust biomass and coal in oxy-fuel combustion with
CO2 capture. Biomass combined with CO2 capture has the potential to contribute to
negative CO2 emissions. However, the high temperature corrosion (HTC) and the related
K-Cl-S chemistry need to be studied in detail to determine the potential consequences for
corrosion on heat transfer surfaces. This, since the use of biomass in power generation is
problematic due to the relative high content of alkali (mainly potassium) and chlorine.
Together these compounds form KCl, a salt that causes corrosive deposits and subsequent
issues with so called high temperature corrosion (HTC). When sulfur is present, alkali
sulfates may form instead of alkali chlorides. Sulfates have a higher melting point and
causes less problems with corrosion and sulfates are therefore preferred instead of
chlorides.
The work in this thesis is based on experiments performed in a 100 kW combustion unit
and modelling of chemical kinetics. Both the experimental and modelling results show that
a high SOX concentration is preferable to achieve a high degree of sulfation of the alkali
chlorides. In oxy-fuel combustion, the SOX concentration is typically high due to flue gas
recycling that enables almost complete potassium sulfation in some of the studied oxy-
combustion atmospheres. This makes oxy-fuel combustion an attractive process for co-
combustion of coal and biomass, since alkali chloride formation can be suppressed. In
addition, the effect of KCl and SO2 on the CO oxidation and NO formation has been studied
in both experimental and modelling work. The results show that KCl can promote CO-
oxidation in a CO2 rich environment. However, no change was observed for the total
burnout time even though the CO concentration was decreased locally. Regarding the
nitrogen chemistry, KCl was found to inhibit the formation of NO whereas SO2 promotes
the oxidation of already formed NO to NO2.
Keywords: alkali, CO-oxidation, NO-formation, combustion, experiments, modelling, oxy-fuel, sulfation

II

III
List of Publications
This thesis include the work presented in the following papers;
I. Modeling the Alkali Sulfation Chemistry of Biomass and Coal Co-firing in
Oxy-fuel Atmospheres
Ekvall, T.; Normann, F.; Andersson, K.; Johnsson, F., Energy and Fuels 2014,
28 (5), 3486-3494
II. K-Cl-S chemistry in air and oxy-combustion atmospheres
Ekvall, T.; Andersson, K.; Leffler, T.; Berg, M., Proceedings of the
Combustion Institute 36 (2017) 4011-4018.
III. The influences of carbon monoxide oxidation on alkali sulfation in nitrogen
and carbon dioxide atmospheres
Allgurén, T.; Andersson, K., submitted to Energy & Fuels
IV. Experimentally Observed Influences of KCl and SO2 on CO Oxidation in an
80 kW Oxy-Propane Flame
Ekvall, T.; Andersson, K., The Proceedings of Pittsburgh Coal Conference,
2017, Pittsburgh, USA
V. The influence of KCl and SO2 on NO formation in C3H8 flames
Allgurén, T.; Andersson, K., accepted for publication in Energy & Fuels
Thomas Allgurén (previously Thomas Ekvall) is the main author and responsible for the
modelling and experimental work presented in all five papers. Associate Professor Fredirk
Normann has contributed with guidance in the modelling work together with discussions
and editing of the first paper. Professor Filip Johnsson took also part in discussions and the
editing work of Paper I. Tomas Leffler and Magnus Berg contributed with their expertise
regarding the IACM™ and contributed also to the editing work of Paper II. Professor Klas
Andersson has contributed with guidance and discussion regarding both modelling and
experiments as well as editing of all five papers.

IV

V
Acknowledgement
I would like to start to show my appreciation to the Swedish Research Council (621-2011-
4699) for supporting this project financially. I am also thankful for all the help I have
received from my examiner Prof. Filip Johnson. My supervisors Prof. Klas Andersson and
Assoc. Prof Fredrik Normann are greatly acknowledged for all their support. You always
have time for discussions and together we have found a solution no matter the problem.
I have spent many hours in Kraftcentralen where Johannes Öhlin, Rustan Marberg and
Jessica Bohwalli have supported me when I needed it. Tomas Leffler is acknowledged for
his contribution with both equipment and expertise regarding alkali measurements. The
experiments carried out in this work would not have been possible without the help of
Adrian Gunnarsson, Daniel Bäckström and Rickard Edland. You have not only made it
possible but also much more enjoyable to spend all these hours in Kraftcentralen. A special
thanks to Daniel Bäckström with whom I spend most of my time in Kraftcentralen. Daniel
has not only helped with experiments but also the development of new experimental
systems.
It is easy to forget, but there are a lot of things behind the scenes that must be done. A big
thanks to the “A-team” for all the help with a little bit of everything. I appreciate the
working environment at the division and would like to thank everyone at Energy
Technology for their contribution. Some extra appreciation is directed to Verena Heinisch
for all the board game events she has arranged. When you share office with a person it
means that you spend a lot of time together. If that person happens to be Stefanía “Stebba”
Ósk Garðarsdóttir it is nothing but a pleasure. I do not think I have spent a single day with
you without at least one laugh. Thankful for having you as a friend, I am.
I would like to thank my friends and family, with a special thanks to my parents, for all the
support. It is a natural part of life to question yourself and what you are doing, but some
times are tougher than others. There was a time when also the teachers had doubts regarding
my choices. If it would not have been for the unquestionable support from my parents I
would most likely not have been where I am today.
My, you said “It is dangerous to go alone. Take this!” and gave me your hand. A hand
which I took and that has supported me every day since. Your encouragement has meant
the world to me. There are, however, things where a child is superior to an adult. I do not
think there is a better way of gaining perspective and motivation than spending time with
my son. Finally, work is not everything and I am truly grateful to have my family to share
my life with.
To everyone – May the force be with you!
Thomas Allgurén
August 2017, Lövsveden – Dalarna - Sweden

VI
VII
Table of content
1 Introduction ......................................................................................................................... 1
1.1 Objective ...................................................................................................................... 3
1.2 Outline of the thesis ..................................................................................................... 3
2 Background ......................................................................................................................... 5
2.1 Fuel characteristics ...................................................................................................... 5
2.2 Oxy-fuel combustion ................................................................................................... 6
2.3 Co-combustion ............................................................................................................. 7
2.4 High temperature corrosion ......................................................................................... 8
2.5 Co-combustion and flue gas recirculation ................................................................... 8
3 N, S and alkali chemistry related to combustion ............................................................... 11
3.1 The release of inorganic species during combustion ................................................. 11
3.2 Formation of alkali-containing aerosols .................................................................... 12
3.3 Alkali sulfation .......................................................................................................... 13
3.4 Effects of interactions between S, K and Cl species on CO oxidation ...................... 16
3.5 NO formation ............................................................................................................. 18
4 Experimental setup ............................................................................................................ 21
4.1 Combustion experiments ........................................................................................... 21
4.2 Measurement techniques ........................................................................................... 23
4.3 Evaluation of sulfation measurement methods .......................................................... 32
5 Modelling .......................................................................................................................... 39
5.1 Reaction mechanisms ................................................................................................ 39
5.2 Sulfation simulations ................................................................................................. 42
5.3 NO simulations .......................................................................................................... 44
6 Results ............................................................................................................................... 47
7 Discussion ......................................................................................................................... 57
8 Summary & outlook .......................................................................................................... 61
Nomenclature ........................................................................................................................... 63
References ................................................................................................................................ 65

1
1 Introduction
Today, it is generally accepted that the global temperature increase is largely a result of
anthropogenic use of fossil fuels [1]. As a consequence, interest in alternative energy sources
such as biomass and waste-based fuels, has increased drastically in recent years. The global
total primary energy supply has increased by an average annual rate of 1.9% since 1990, while
at the same time, the primary energy supply from renewable sources has grown at a rate of
2.2%. In 2014, 13.8% of the global total primary energy supply was generated from renewable
energy sources [2]. Despite this increase in renewable energy supply there has been an increase
in fossil CO2 emissions of almost 40% between 1990 and 2014. The largest share of global CO2
emissions, 42%, is attributed to heat and power generation [3]. According to the IEA, in Year
2014 more than 65% of the global electricity generation was based on the combustion of fossil
fuels and more than 40 % was from coal alone. Hydro represents the largest source of renewable
electricity production (16%), whereas only 2% of the worldwide electricity generation is from
the combustion of biofuels and waste. In addition, solar and wind, which are believed to play
an important role in the future electricity production mix, are together with geothermal
generation responsible for 4% of the total electricity production [4]. Thus, there is a long way
to go towards replacing the present use of fossil fuels.
An alternative pathway towards the replacement of fossil fuels is to lower the emissions of CO2
from the use of fossil fuels in stationary combustion facilities by adopting the concept of carbon
capture and storage (CCS). CCS allows for the continued use of fossil fuels without emissions
to the atmosphere of carbon dioxide; CCS is often referred to as a bridging technology that will
allow for fast and drastic cuts in emissions while more sustainable energy sources are being
developed that can be adopted in a cost-effective and secure manner in the future. Four of the
capture concepts discussed are: 1) pre-combustion, in which the carbon is removed through
gasification before combustion; 2) post-combustion, in which the CO2 is separated from the
flue gases using, for example, absorption [5]; 3) oxy-fuel combustion [6], where the fuel is
combusted in an oxygen-flue gas mixture instead of air; and 4) chemical-looping combustion,
in which the fuel is oxidized by a metal oxide rather than air [7]. A schematic of the concepts
is shown in Figure 1. The CCS concept entails that the captured or separated CO2 is stored
underground at a suitable location, such as an aquifer or a depleted oil well, preventing the CO2

2
from reaching the atmosphere [8]. Before transportation from the source to the storage point,
the CO2 stream is cleaned from impurities, such as water, particulates, NOx and SOx.
Employment of CCS typically reduces the emissions by 90%–95% from combustion of any
fossil fuel. However, all of these approaches are associated with a considerable additional cost
that is specific for each concept. It is therefore important to seek understanding of these
processes so that they – in the future – may become as cost-effective as todays’ conventional
combustion processes.
An interesting possibility to reduce global warming is to combine the combustion of biofuels
and CCS; this is commonly referred to as “bioenergy with carbon capture and storage”
(BECCS). BECCS not only can help to reach a zero-emission target for power or industrial
plants, but also to achieve negative emissions locally. BECCS could be used to compensate for
fossil CO2 emissions from sources for which a reduction might be more difficult to achieve.
BECCS has also been proposed for the actual removal of CO2 from the atmosphere. Azar et al.
[9] have shown that it possible to reach the 2°C target even if we, for a while, reaches an
atmospheric concentration of greenhouse gases otherwise considered too high, provided that
BECCS is deployed.
Figure 1. Schematic of the four main concepts for CO2 separation for heat and power generation. Only the
main components (on a dry basis) of each stream are indicated; the CO2 streams might also contain, for
example, NOX and SOX, which need to be removed before transportation and storage.
3
1.1 Objective
This thesis investigates the combustion chemistry relevant to fuel or fuel mixes with high
concentrations of alkali, chlorine and sulfur that are used in suspension-fired systems in both
air-fuel and oxy-fuel combustion systems. Compared to coal, biomass contains high levels of
alkali metals and chlorine and low levels of sulfur. Given the fuel composition, significant
amounts of alkali chlorides may be formed during the combustion of biomass, which increases
the risk of HTC. However, during co-combustion of coal and biomass, the fuel-bound sulfur in
the coal may promote the sulfation rather than the chlorination of the alkali metals. The
formation of HTC-related alkali species is investigated in the present work under both in-flame
and post-flame conditions. These compounds may, however, also influence other aspects of the
combustion chemistry, such as fuel oxidation and NO formation. The focus of this investigation
is on the homogenous gas-phase chemistry and includes both experimental work and detailed
kinetic modeling. The work includes the development and evaluation of a new experimental
setup that is designed to investigate the chemistry of the alkalis in technical-scale combustion
test units. The results obtained are discussed in the contexts of the following questions:
• Which key parameters control the sulfation of alkali chlorides?
• Are there any differences in the alkali-sulfur interactions between air-fuel and oxy-fuel
combustion?
• How is the combustion process influenced by the presence of alkali and sulfur?
1.2 Outline of the thesis This thesis is based on the following five papers, as shortly described below.
Paper I includes modeling work that focuses on the homogenous sulfation of potassium
chloride. The modeling includes a comparison of co-combustion with air-fuel and oxy-fuel
systems, together with an evaluation of the related chemistry and the most important
parameters.
Paper II presents both experimental results and the results from the kinetic modeling to
investigate the homogenous gas-phase sulfation of potassium chloride. The work includes a
sensitivity analyses with respect to the concentration of sulfur and the flue gas recirculation
mode applied, the latter when comparing air-fuel and oxy-fuel atmospheres.
Paper III is a continuation of the work presented in Paper II. In this work, chemical kinetic
modelling is used to study the changes that may occur when replacing nitrogen with carbon
dioxide in the combustion atmosphere, i.e. in further detail compared to Paper II.
Paper IV focuses on the influences of potassium, chlorine, and sulfur on CO oxidation in the
flame zone. The work includes both experiments and kinetic modeling for conditions relevant
to both air-fuel and oxy-fuel combustion.
Paper V examines how potassium chloride and sulfur dioxide affect the formation of NO
during the combustion of propane in air. This involves measurements of the NO concentration
in the flue gas when an 80 kW flame is doped with KCl and SO2. Reaction simulations are also
performed in addition to the experiments.

4
5
2 Background
In this chapter the concept of oxy-fuel combustion is presented and describes how it differs
from conventional air-fuel combustion. In addition, the characteristics of biomass (or types of
biomasses) will be presented together with the effects of introducing biomass into an air-fuel
or oxy-fuel combustion system.
2.1 Fuel characteristics Coal is the main fuel used for heat and power generation, whereas only a few percent of the
global electricity production originates from biomass combustion [4]. Two subcategories of
biomass, forest-derived and agriculture-derived biomass, are commonly used as fuel for heat
and power generation purposes. The properties of these biomass types differ considerably from
those of coal. For example, the moisture content of biomass is typically higher, which is also
the case for alkali metals (sodium and potassium) and chlorine [10-13]. The composition of the
fuel not only differs between the various types of biomass, but it is also related to the
pretreatment of the biomass before it is fed into the combustion process, e.g., wood chips, saw
dust or torrefied wood, whereby the latter process tends to alter the sulfur and chlorine
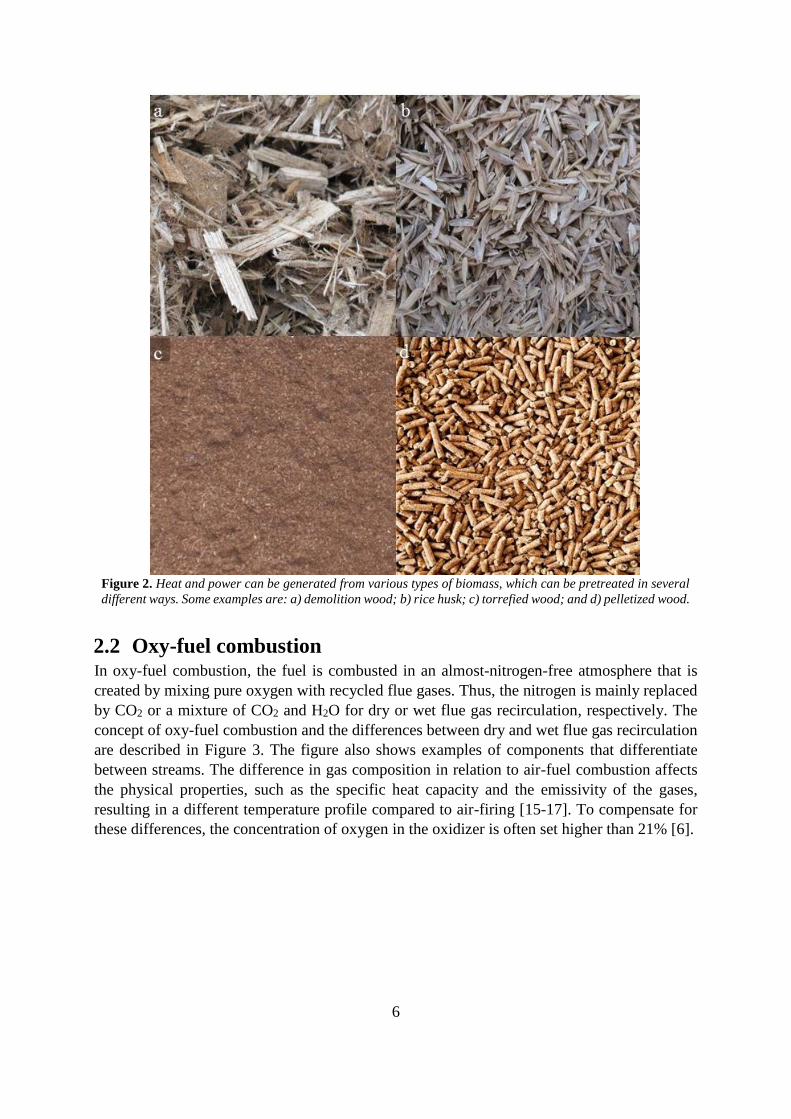
contents [14]. Some examples of the different types of biomasses are shown in Figure 2. In the
present work, the most common types of biomass are considered, i.e., forest or agricultural
biomass that has not been pretreated with thermal or similar processes. The simulated contents
of alkali and chlorine, in both the experiments and the modeling of this work, are therefore
significant. This is also typically the case when biomass is used in the current heat and power
generation plants.
6
Figure 2. Heat and power can be generated from various types of biomass, which can be pretreated in several
different ways. Some examples are: a) demolition wood; b) rice husk; c) torrefied wood; and d) pelletized wood.
2.2 Oxy-fuel combustion In oxy-fuel combustion, the fuel is combusted in an almost-nitrogen-free atmosphere that is
created by mixing pure oxygen with recycled flue gases. Thus, the nitrogen is mainly replaced
by CO2 or a mixture of CO2 and H2O for dry or wet flue gas recirculation, respectively. The
concept of oxy-fuel combustion and the differences between dry and wet flue gas recirculation
are described in Figure 3. The figure also shows examples of components that differentiate
between streams. The difference in gas composition in relation to air-fuel combustion affects
the physical properties, such as the specific heat capacity and the emissivity of the gases,
resulting in a different temperature profile compared to air-firing [15-17]. To compensate for
these differences, the concentration of oxygen in the oxidizer is often set higher than 21% [6].
7
The amount of recirculated flue gas is directly related to the feed gas oxygen concentration; a
higher concentration of oxygen requires less recirculated flue gas. Furthermore, the minor
species, in addition to CO2 and H2O, in the flue gases will also be recirculated (if they are not
separated before recirculation). Therefore, recirculation will influence the concentrations of
these species; the concentration of SO2 is typically more than 3 or 4-fold higher in oxy-fuel
combustion than in air-fuel combustion [18, 19]. The level of NO is, however, reduced due to
reburning effects that result from the flue gas recirculation [20, 21]. Although the
concentrations of substances such as SOX and NOX are low, the differences between the levels
of SOX and NOX can be of importance for the chemical reactions.
The recirculation itself is not the only factor that affects the gas composition in the furnace. The
composition of the gases will also be changed if flue gas cleaning equipment is placed in the
recirculation loop of the system, thereby separating solids before recirculation and removing,
for example, condensed alkali species (the species indicated in red in Figure 3). Another item
of equipment that can be used is a flue gas condenser, which will remove water (referred to as
‘dry recirculation’) and soluble compounds, such as HCl and SO3/H2SO4 (the species indicated
in blue in Figure 3). In this way, flue gas cleaning equipment can be used as a means to achieve
a favorable combustion atmosphere. However, if the cleaning apparatus is placed before the
recirculation, the cost for that specific component will increase due to the larger gas flow, as
compared to the cost associated with positioning the cleaning apparatus outside the loop [6].
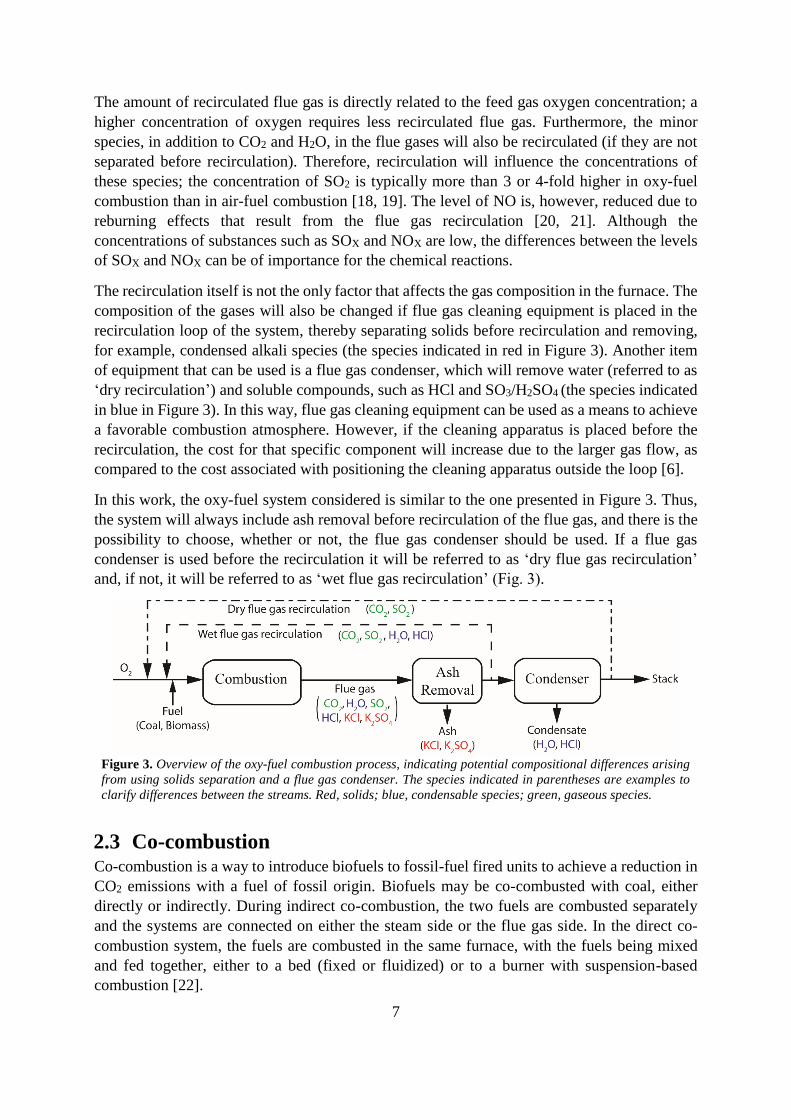
In this work, the oxy-fuel system considered is similar to the one presented in Figure 3. Thus,
the system will always include ash removal before recirculation of the flue gas, and there is the
possibility to choose, whether or not, the flue gas condenser should be used. If a flue gas
condenser is used before the recirculation it will be referred to as ‘dry flue gas recirculation’
and, if not, it will be referred to as ‘wet flue gas recirculation’ (Fig. 3).
Figure 3. Overview of the oxy-fuel combustion process, indicating potential compositional differences arising
from using solids separation and a flue gas condenser. The species indicated in parentheses are examples to
clarify differences between the streams. Red, solids; blue, condensable species; green, gaseous species.
2.3 Co-combustion Co-combustion is a way to introduce biofuels to fossil-fuel fired units to achieve a reduction in
CO2 emissions with a fuel of fossil origin. Biofuels may be co-combusted with coal, either
directly or indirectly. During indirect co-combustion, the two fuels are combusted separately
and the systems are connected on either the steam side or the flue gas side. In the direct co-
combustion system, the fuels are combusted in the same furnace, with the fuels being mixed
and fed together, either to a bed (fixed or fluidized) or to a burner with suspension-based
combustion [22].
8
For the existing suspension-fired units in which biomass could be introduced for co-firing
purposes, the fuel mills typically set the technical limitation for the share of biomass that may
be blended into the fuel mix, as discussed by Savolainen [23]. Savolainen attempted to mix coal
and saw dust (in a 315-MWfuel boiler) and found that for large fractions of saw dust (>30%vol),
the drying capacity of the mills was insufficient. When the share on a volume basis was >50%
the boiler capacity was reduced by 25%. However, not only the drying capacity was affected.
The fraction of coarse coal particles increased with the share of biomass in the mills [23]. The
energy required (both thermal and mechanical) to prepare the biomass varied with both size and
the concept chosen, as well as with moisture content, in that a higher moisture content required
more energy [24]. A second option for introducing biomass into a pulverized coal boiler is to
treat the biomass separately. This option requires an extra biomass mill/crusher and a
specialized biomass burner. The new burner can be constructed either so it can be fired with
pure biomass or a blend of coal and biomass [23]. Co-firing biomass with coal may affect
emissions, such as NOx and SOX, as well as other properties, such as ignition delay [23, 24].
The size and share of biomass particles may also have a positive or negative effect on the outlet
CO concentration, i.e., the burnout conditions [24].
2.4 High temperature corrosion Hight temperature corrosion (HTC) is a problem that affects the heat transfer surfaces in a
boiler. HTC is caused mainly by alkali-based salts that possess a high melting point and that
easily are deposited on heat transfer surfaces. Compounds that contain alkali metals and
chlorine are among the most aggressive agents, which is why HTC is primarily a problem for
power plants that are fired with biomass rather than coal [25-27]. To counteract HTC in
biomass-fired power plants, the steam temperature in the boiler is often lowered, which leads
to a decreased electrical efficiency [10]. The risk for alkali-related HTC can be reduced by the
co-combustion of coal and biomass (relative to the combustion of biomass alone) owing to the
relatively high levels of fuel-bound sulfur in coal, which favors the formation of the less-
corrosive sulfates over chlorides [11, 28, 29]. Oxy-fuel derived flue gases have for example
been shown by Syed et al. [30] to be more corrosive than those derived from air-fuel
combustion. However, they assumed that the level of deposition and the composition of the
deposits were the same for both the air-fuel and oxy-fuel flue gases, which is not necessarily
the case, and this is a topic that will be discussed further in this work.
2.5 Co-combustion and flue gas recirculation As mentioned above, the flue gas recirculation applied in oxy-fuel combustion increases the
concentrations of SOX and NOX compared to air-fuel combustion [21, 31]. In this work, the
SOX components are studied in detail, components whose concentrations are typically 3–4-fold
higher in oxy-fuel flue gases than in air-fuel flue gases [19, 31]. An increased concentration of
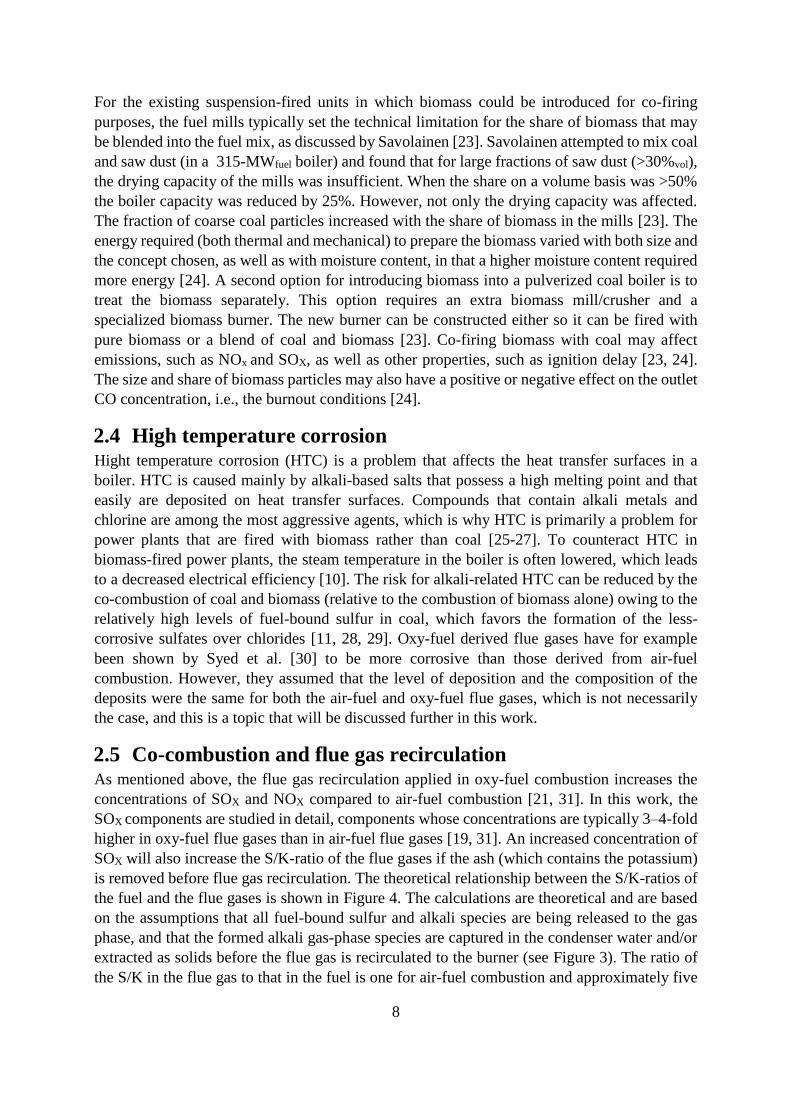
SOX will also increase the S/K-ratio of the flue gases if the ash (which contains the potassium)
is removed before flue gas recirculation. The theoretical relationship between the S/K-ratios of
the fuel and the flue gases is shown in Figure 4. The calculations are theoretical and are based
on the assumptions that all fuel-bound sulfur and alkali species are being released to the gas
phase, and that the formed alkali gas-phase species are captured in the condenser water and/or
extracted as solids before the flue gas is recirculated to the burner (see Figure 3). The ratio of
the S/K in the flue gas to that in the fuel is one for air-fuel combustion and approximately five
9
for the OF25 dry case (oxy-fuel operation with dry flue gas recycling and with 25 vol.% oxygen
in the feed gas). The amount of sulfur in the flue gases is then decreased for higher
concentrations of oxygen and for wet recirculation in relation to dry recirculation. To
summarize, the S/K-ratio of the flue gases will always be higher during oxy-fuel combustion if
the recirculated flue gas contains sulfuric species. If no sulfur is recirculated it will be a one-to-
one relationship similar to combustion in air. SO2 is shown to inhibit the oxidation of CO during
both air-fuel and oxy-fuel combustion, which means that it influenced the overall combustion
process [32, 33]. In addition, a high concentration of SO2 seems to favor the sulfation of alkali
metals [11, 34, 35]. The SO2 concentration is therefore important for both in-flame and post-
flame conditions. It also implies that there is a difference in performance between air-fuel and
oxy-fuel combustion systems, which is attributed to the increase in SO2 concentration for the
latter case.
Figure 4. Molar sulfur to potassium (S/K)-ratio in the flue gases and how this varies with respect to the S/K-
ratio of the fuel. The theoretical variations are shown for air-fuel combustion and oxy-fuel (OF) combustion.
There are three cases representing different oxygen concentrations (25 vol.% and 30 vol.%) and different
recirculation strategies (wet or dry). In air, the S/K-ratio of the flue gas is the same as that of the fuel. The
trends are based on the assumption that all the sulfur- and potassium-containing species are released to the
gas phase. Source: Paper I.

10
11
3 N, S and alkali chemistry
related to combustion
The combustion of solid fuels includes the following steps: heating of the fuel; release of
volatile matter; oxidation of gaseous species; and char combustion. Fuel oxidation, which is the
main part of the combustion, is not the only reaction taking place. Depending on the
composition of the fuel, a large variety of different compounds, both gaseous and solid, can be
formed at concentrations that are low (<1 vol.%) but still important from the boiler performance
or environmental perspective. Nitrogen, sulfur, chlorine, and alkali-metals are examples of such
compounds. In this chapter, we describe how these compounds are released and interact with
each other in the combustion process. Note that in the present work, K represents the overall
alkali-metal content of the flue gases. In a practical combustion system, sodium (Na) is also
typically present, even though potassium is usually the main alkali specie. In addition, sodium
has been reported to follow a reaction mechanism similar to that of potassium [11, 13, 36, 37].
3.1 The release of inorganic species during combustion Some of the main inorganic elements released during combustion and devolatilization are N, S,
Cl, and K. Their relative rates of release and in which form they are released are, however,
highly dependent upon the overall fuel composition and temperature. The inorganic species are
released to the gas phase as a result of increased temperature. Chlorine is released early in the
heating process, with up to 50 wt.% of the chlorine being released already at 500°C [38].
Chlorine is released mainly in the forms of HCl and KCl. A minor share of the chorine might,
however, be released as chlorinated hydrocarbons which often react soon after their release,
with subsequent formation of HCl during combustion [38-40]. Potassium is mainly released as
KCl, if Cl is present, otherwise it is released as atomic potassium (K) or as potassium hydroxide
(KOH) [38-41]. The release of K has been shown to be strongly coupled to the release of
chlorine [38]. Cl-species have a stronger tendency to react with char than K-species, which
indirectly affects the release of K, since less Cl is available for KCl formation to occur [40].
The release rates of Cl and K are also affected by the ash composition. Silicates, especially
aluminum silicate (during co-combustion of coal and biomass mainly derived from coal), are
the main component responsible for inhibiting the release of alkali chlorides [29, 41-45]. In
addition, the state in which the species is released depends on the combustion temperature, in
relation to the melting and evaporation temperatures for each specific compound, and also the
compositions of the fuel and the flue gas [38, 40, 41, 43-48].
12
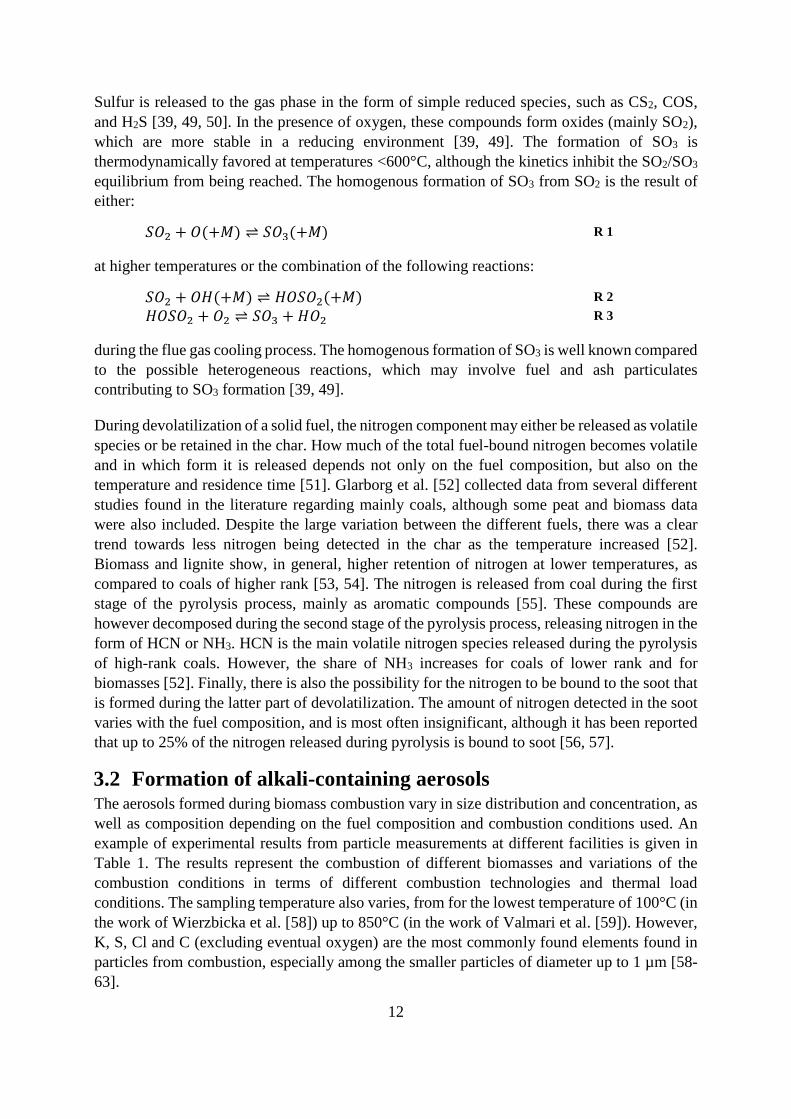
Sulfur is released to the gas phase in the form of simple reduced species, such as CS2, COS,
and H2S [39, 49, 50]. In the presence of oxygen, these compounds form oxides (mainly SO2),
which are more stable in a reducing environment [39, 49]. The formation of SO3 is
thermodynamically favored at temperatures <600°C, although the kinetics inhibit the SO2/SO3
equilibrium from being reached. The homogenous formation of SO3 from SO2 is the result of
either:
𝑆𝑂2 + 𝑂(+𝑀) ⇌ 𝑆𝑂3(+𝑀) R 1
at higher temperatures or the combination of the following reactions:
𝑆𝑂2 + 𝑂𝐻(+𝑀) ⇌ 𝐻𝑂𝑆𝑂2(+𝑀) R 2
𝐻𝑂𝑆𝑂2 + 𝑂2 ⇌ 𝑆𝑂3 + 𝐻𝑂2 R 3
during the flue gas cooling process. The homogenous formation of SO3 is well known compared
to the possible heterogeneous reactions, which may involve fuel and ash particulates
contributing to SO3 formation [39, 49].
During devolatilization of a solid fuel, the nitrogen component may either be released as volatile
species or be retained in the char. How much of the total fuel-bound nitrogen becomes volatile
and in which form it is released depends not only on the fuel composition, but also on the
temperature and residence time [51]. Glarborg et al. [52] collected data from several different
studies found in the literature regarding mainly coals, although some peat and biomass data
were also included. Despite the large variation between the different fuels, there was a clear
trend towards less nitrogen being detected in the char as the temperature increased [52].
Biomass and lignite show, in general, higher retention of nitrogen at lower temperatures, as
compared to coals of higher rank [53, 54]. The nitrogen is released from coal during the first
stage of the pyrolysis process, mainly as aromatic compounds [55]. These compounds are
however decomposed during the second stage of the pyrolysis process, releasing nitrogen in the
form of HCN or NH3. HCN is the main volatile nitrogen species released during the pyrolysis
of high-rank coals. However, the share of NH3 increases for coals of lower rank and for
biomasses [52]. Finally, there is also the possibility for the nitrogen to be bound to the soot that
is formed during the latter part of devolatilization. The amount of nitrogen detected in the soot
varies with the fuel composition, and is most often insignificant, although it has been reported
that up to 25% of the nitrogen released during pyrolysis is bound to soot [56, 57].
3.2 Formation of alkali-containing aerosols The aerosols formed during biomass combustion vary in size distribution and concentration, as
well as composition depending on the fuel composition and combustion conditions used. An
example of experimental results from particle measurements at different facilities is given in
Table 1. The results represent the combustion of different biomasses and variations of the
combustion conditions in terms of different combustion technologies and thermal load
conditions. The sampling temperature also varies, from for the lowest temperature of 100°C (in
the work of Wierzbicka et al. [58]) up to 850°C (in the work of Valmari et al. [59]). However,
K, S, Cl and C (excluding eventual oxygen) are the most commonly found elements found in
particles from combustion, especially among the smaller particles of diameter up to 1 µm [58-
63].

13
Table 1. Experimental results from the literature, showing the variations in composition, size, and concentration
of aerosols formed during the combustion of biofuels.
Reference Boiler
type
Thermal
effect
[kW]
Fuel Sampling
temperature
[°C]
Particle
load
[mg/Nm3]
Main size
(by mass)
[µm]
Main
components
(by mass)
Wierzbicka et al. [58] Grate 1000-1500 Sawdust pellets,
forest residues 100–175 51-120 5 K, S, Cl
Valmari et al. [59] CFB* 35000 Forest residues,
willow 810–850 600-1200 ~10
Ca, Si, P, K, S,
Cl
Pagles et al. [63] Grate 1000–6000 Forest residues 150–215 79-145 1–10 K, S, C
Johansson et al. [62] Pellets
burner 11–22
Wood pellets,
wood briquettes - 34-240 <1 K, S, Cl
Boman et al. [60] Pellets
burner 10–15 Pellets - - ~0.3 K, Cl, S, C
Christansen and
Livbjerg [61] - 15000 Straw 120 3-500 ~0.3 K, Cl ,S
*CFB = circulating fluidized bed.
When gaseous potassium chloride condenses in an inert atmosphere (via homogeneous
nucleation) the condensed phase consists of both monomers and dimers. Such a system will
always be in equilibrium [64]. Nucleation is a continuous process in which more and more
aerosols form until the particle concentration is sufficient to on-set coagulation. According to
Jensen et al. [65], the coagulation half-time for particle number concentrations is >10 s at a
particle concentration of 3×107cm-3. The system examined by Jensen and co-workers had a
residence time of <2 s, and for this reason the impact of coagulation was omitted in their model.
These assumptions, together with mathematical expressions describing, for example, size
distribution density functions, were used by Jensen et al. [65] to describe the homogenous
nucleation of potassium chlorides in a plug flow reactor. They showed that when SO2 was
introduced to their experimental set-up the number of particles dramatically increased, which
also followed from the model results. Potassium, which is homogenously sulfated, has a vapor
pressure that is several orders of magnitude lower than that of KCl, which means that the
sulfates are supersaturated and form aerosols through homogenous nucleation [65].
Alkali-metals may form carbonates rather than sulfates in the flue gas. The carbonization has
been suggested to follow a heterogeneous reaction pathway, due to the thermodynamic
instability of K2CO3(g). Potassium carbonate is suggested to be formed via a reaction between
KOH(s, l) and gaseous CO2 [66]. Carbonates may only form at temperatures lower than the
temperature at which homogenous sulfation can take place [36, 67, 68].
3.3 Alkali sulfation The chlorinated form of potassium, KCl, is the main potassium compound released to the gas
phase during biomass combustion. KCl may, however, be sulfated during combustion. This
sulfation is considered complete when all that potassium has formed potassium sulfate (K2SO4).
At temperatures <450°C, sulfated potassium may be found as pyrosulfate (K2S2O7) [69]. Such
low temperatures are, however, not relevant to the present work. The sulfation of potassium
chloride follows one of two possible paths: 1) homogenous sulfation, where the sulfates are
formed in the gas phase (and condense after their formation); or 2) heterogeneous sulfation,
which includes surface reactions of non-gaseous chloride particles. Below follows a short
summary of previous investigations of these two reaction pathways.
14
3.3.1 Heterogeneous alkali sulfation
The heterogeneous sulfation of KCl has been proposed by Steinberg and Schofield [70] as a
surface reaction phenomenon that is manifested under post-flame conditions. In their work with
hydrogen and propane flames, Steinberg and Schofield have concluded that sodium sulfate is
too unstable under flame conditions to be responsible for the observed sulfation [70-72].
Experimental results presented by others have, in contrast, suggested that the heterogeneous
pathway is too slow to describe the sulfation that typically occurs in industrial-scale boilers [67,
73].
Sengeløv et al. [68] have shown that the sulfation of condensed KCl increases with increases in
temperature and oxygen concentration. The amount of water in the surrounding gas does not
seem to influence the rate of sulfation. Sengeløv et al. [68] have suggested that only small KCl
particles (<1 µm) can achieve a significant level of sulfation at residence times of <1 s, even at
high temperatures. However, KCl aerosols of this size are unlikely to be found at temperatures
>800°C, and at lower temperatures, the rate of sulfation of condensed KCl is <20% [68, 74].
These modeling results are in agreement with the experimental results in the literature [67, 73,
74]. This work focuses on the homogenous alkali-sulfating route, which is more relevant to the
conditions studied here, as represented by flame temperatures up to about 1600°C. However, it
should be noted that the findings presented are valid for residence times in the order of a number
of seconds. Once deposited, the exposure time for sulfuric species will be order of magnitudes
longer; for such conditions, the sulfation of condensed potassium chloride is no longer
negligible [68].
3.3.2 Homogenous alkali sulfation
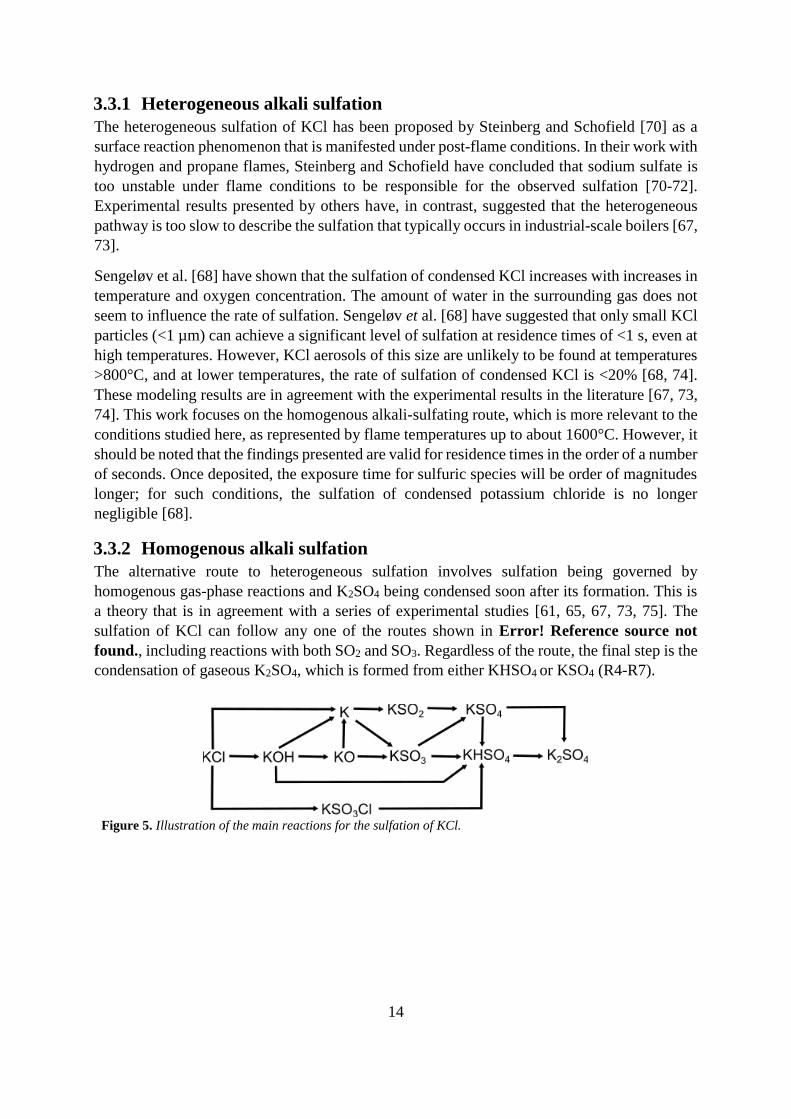
The alternative route to heterogeneous sulfation involves sulfation being governed by
homogenous gas-phase reactions and K2SO4 being condensed soon after its formation. This is
a theory that is in agreement with a series of experimental studies [61, 65, 67, 73, 75]. The
sulfation of KCl can follow any one of the routes shown in Error! Reference source not
found., including reactions with both SO2 and SO3. Regardless of the route, the final step is the
condensation of gaseous K2SO4, which is formed from either KHSO4 or KSO4 (R4-R7).
Figure 5. Illustration of the main reactions for the sulfation of KCl.
15
𝐾𝐻𝑆𝑂4 + 𝐾𝐶𝑙 ⇌ 𝐾2𝑆𝑂4 + 𝐻𝐶𝑙 R 4
𝐾𝐻𝑆𝑂4 + 𝐾𝑂𝐻 ⇌ 𝐾2𝑆𝑂4 + 𝐻2𝑂 R 5
𝐾𝑆𝑂4 + 𝐾𝐶𝑙 ⇌ 𝐾2𝑆𝑂4 + 𝐶𝑙 R 6
𝐾𝑆𝑂4 + 𝐾𝑂𝐻 ⇌ 𝐾2𝑆𝑂4 + 𝑂𝐻 R 7
There are four main routes to the formation of KHSO4, including either SO2 or SO3. SO3 may
react directly with KOH:
𝐾𝑂𝐻 + 𝑆𝑂3(+𝑀) ⇌ 𝐾𝐻𝑆𝑂4(+𝑀) R 8
or through a two-step reaction that starts with KCl:
𝐾𝐶𝑙 + 𝑆𝑂3(+𝑀) ⇌ 𝐾𝑆𝑂3𝐶𝑙(+𝑀) R 9
𝐾𝑆𝑂3𝐶𝑙 + 𝐻2𝑂 ⇌ 𝐾𝐻𝑆𝑂4 + 𝐻𝐶𝑙 R 10
KHSO4 may then be formed via SO2 in a three-step reaction that starts with K:
𝐾 + 𝑆𝑂2 ⇌ 𝐾𝑆𝑂2 R 11
𝐾𝑆𝑂2 + 𝑂2(+𝑀) ⇌ 𝐾𝑆𝑂4(+𝑀) R 12
𝐾𝑆𝑂4 + 𝐻2𝑂 ⇌ 𝐾𝐻𝑆𝑂4 + 𝑂𝐻 R 13
or starting with KSO3, which can be formed from either KO (involving SO2) or K (involving
SO3):
𝐾𝑆𝑂3 + 𝑂𝐻 ⇌ 𝐾𝐻𝑆𝑂4 R 14
𝐾𝑂 + 𝑆𝑂2 ⇌ 𝐾𝑆𝑂3 R 15
𝐾 + 𝑆𝑂3(+𝑀) ⇌ 𝐾𝑆𝑂3(+𝑀) R 16
KCl, KOH, KO, and K form the basis for the sulfating process. These compounds are linked
together via several reactions, the most important of which are listed below. KOH may form
from KCl via the following reaction with water:
𝐾𝐶𝑙 + 𝐻2𝑂 ⇌ 𝐾𝑂𝐻 + 𝐻𝐶𝑙 R 17
KOH may react further to KO:
𝐾𝑂𝐻 + 𝑂𝐻 ⇌ 𝐾𝑂 + 𝐻2𝑂 R 18
K is formed directly from KCl via one of the following reactions:
𝐾𝐶𝑙(+𝑀) ⇌ 𝐾 + 𝐶𝑙(+𝑀) R 19
𝐾𝐶𝑙 + 𝐻 ⇌ 𝐾 + 𝐻𝐶𝑙 R 20

16
or indirectly via KOH or KO:
𝐾𝑂𝐻 + 𝐻 ⇌ 𝐾 + 𝐻2𝑂 R 21
𝐾𝑂𝐻(+𝑀) ⇌ 𝐾 + 𝑂𝐻(+𝑀) R 22
𝐾𝑂 + 𝑂 ⇌ 𝐾 + 𝑂2 R 23
𝐾𝑂 + 𝐶𝑂 ⇌ 𝐾 + 𝐶𝑂2 R 24
𝐾𝑂 + 𝑆𝑂2 ⇌ 𝐾 + 𝑆𝑂3 R 25
The present work focuses entirely on this suggested route involving homogenous alkali
sulfation, as described by the reaction pathway schematic in Error! Reference source not
found.. Thus, this forms the basis for the modeling of the alkali sulfation chemistry covered in
Papers IIII.
3.4 Effects of interactions between S, K and Cl species on CO
oxidation The oxidation of CO, R 26, may be influenced by alkali- and chlorine-containing species, as
well by SO2. The inhibitory effect has been experimentally observed for both hydrogen [76-79]
and hydrocarbon-air flames [37, 80-87] (both in laboratory scale), and for HCl and SO2 it has
also been reported for pulverized coal combustion [88]. This phenomenon has also been
examined under various conditions in flow reactors [89-92]. The interactions may either be
direct or via the O/H radical pool, which is important for the chain branching that drives the
combustion. There follows a theoretical discussion as to how these compounds may affect the
oxidation of CO. The reactions discussed form the basis for the kinetic modeling carried out in
Paper IV.
𝐶𝑂 + 𝑂𝐻 ⇌ 𝐶𝑂2 + 𝐻 R 26
3.4.1 Sulfur-CO interactions
It is well known that SO2 can influence the combustion chemistry, and depending on the local
air-to-fuel ratio, the presence of SO2 either inhibits or enhances the oxidation of CO [33]. Under
fuel-lean conditions, a small fraction of the SO2 can be oxidized to SO3, the latter of which can
be reduced back to SO2 via a second reaction path that starts with 𝑆𝑂2 + 𝑂(+𝑀) ⇌ 𝑆𝑂3(+𝑀)
(R 1) followed by:
𝑆𝑂3 + 𝑂 ⇌ 𝑆𝑂2 + 𝑂2 R 27
SO2 has the most potent effect in a reducing environment, relative to an oxidizing environment
[39]. Rasmussen et al. [33] have presented a more complex SOx-cycle, which shows better
agreement for both rich and lean conditions, including HOSO:
𝑆𝑂2 + 𝐻(+𝑀) ⇌ 𝐻𝑂𝑆𝑂(+𝑀) R 28
𝐻𝑂𝑆𝑂 + 𝐻 ⇌ 𝑆𝑂 + 𝐻2𝑂 R 29
𝑆𝑂 + 𝑂2 ⇌ 𝑆𝑂2 + 𝑂 R 30

17
They also introduced a third loop that includes SO for better accuracy during flame combustion
(higher temperatures):
𝑆𝑂 + 𝐻 + 𝑀 ⇌ 𝐻𝑆𝑂 + 𝑀 R 31
𝐻𝑆𝑂 + 𝐻 ⇌ 𝑆 + 𝐻2𝑂 R 32
𝑆 + 𝑂𝐻 ⇌ 𝑆𝑂 + 𝐻 R 33
Despite this more complex SOx-cycle presented by Rasmussen et al. [33], there remain some
sulfur-fuel interactions that are not captured by the mechanism [39].
3.4.2 Alkali-CO interactions
KCl has been reported in literature to influence CO oxidation but only for conditions relevant
for fluidized bed (FB) combustion. Therefore, it remains unknown whether the reported effects
presented here are applicable to suspension fired systems or not. This topic will be examined in
this work. Alkali species in a combustion facility can be found both as solids and in the gas
phase. However, the inhibitory effect of these species on CO oxidation has been shown for both
physical states. The influences of alkali species are attributed to chemical interactions, whereas
more chemically inert solids, such as silica powders, instead exert thermal influences [82, 87].
Although the details of the chemical mechanism underlying this phenomenon are still being
discussed in the literature, it is often suggested to be based on reactions in the gas phase [39,
84, 86, 89, 93]. Based on gas-phase experiments conducted in previous studies [37, 78, 79, 84,
89, 94], a mechanism that includes R17 and R20-R22 has been suggested in which interactions
via the O/H radical pool connect CO oxidation, R 24, with the potassium available in the gas
phase. In order for these reactions to describe the observed inhibitory effect of alkali species on
CO oxidation, the reaction rate for R 22 has to be higher than that confirmed previously. Hynes
et al. [76] have proposed that an additional reaction involving KO2 enables the reaction rate to
be lower. although this reaction seems unlikely given the thermodynamic properties noted for
alkali dioxides [89]. Potassium-containing compounds have been reported to inhibit CO
oxidation in an oxygen-rich environment and to promote CO oxidation under certain conditions,
e.g. in the presence of high NOx concentrations [95, 96].
3.4.3 Chlorine-CO interactions
Chlorine-containing species are released already during pyrolysis, and are mainly found in the
gas phase as chlorinated hydrocarbons or HCl and KCl [38, 39]. In the same way as for the
alkali-metals, chlorine interacts with CO oxidation via the O/H radical pool in a cycle of
reactions [39, 90]:
𝐻𝐶𝑙 + 𝐻 ⇌ 𝐶𝑙 + 𝐻2 R 34
𝐻𝐶𝑙 + 𝑂𝐻 ⇌ 𝐶𝑙 + 𝐻2𝑂 R 35
𝐶𝑙 + 𝐻 + 𝑀 ⇌ 𝐻𝐶𝑙 + 𝑀 R 36
𝐶𝑙 + 𝐻𝑂2 ⇌ 𝐻𝐶𝑙 + 𝑂2 R 37
There is also a second cycle that includes CO directly [97]:
𝐶𝑙 + 𝐻𝑂2 ⇌ 𝐶𝑙𝑂 + 𝑂𝐻 R 38
𝐶𝑙𝑂 + 𝐶𝑂 ⇌ 𝐶𝑙 + 𝐶𝑂2 R 39
18
The relationship between these two cycles depends on whether the reaction between 𝐶𝑙 + 𝐻𝑂2
follows R 37 or R 38. This is especially important, as the first route will inhibit CO oxidation,
while the second will promote CO oxidation. The inhibitory effect of the first cycle may be
reduced or changed to change the conditions in areas with higher Cl concentrations (e.g., the
post-flame zone), thereby forcing R 34 and R 35 to reach equilibrium or even to reverse the
reaction direction [39].
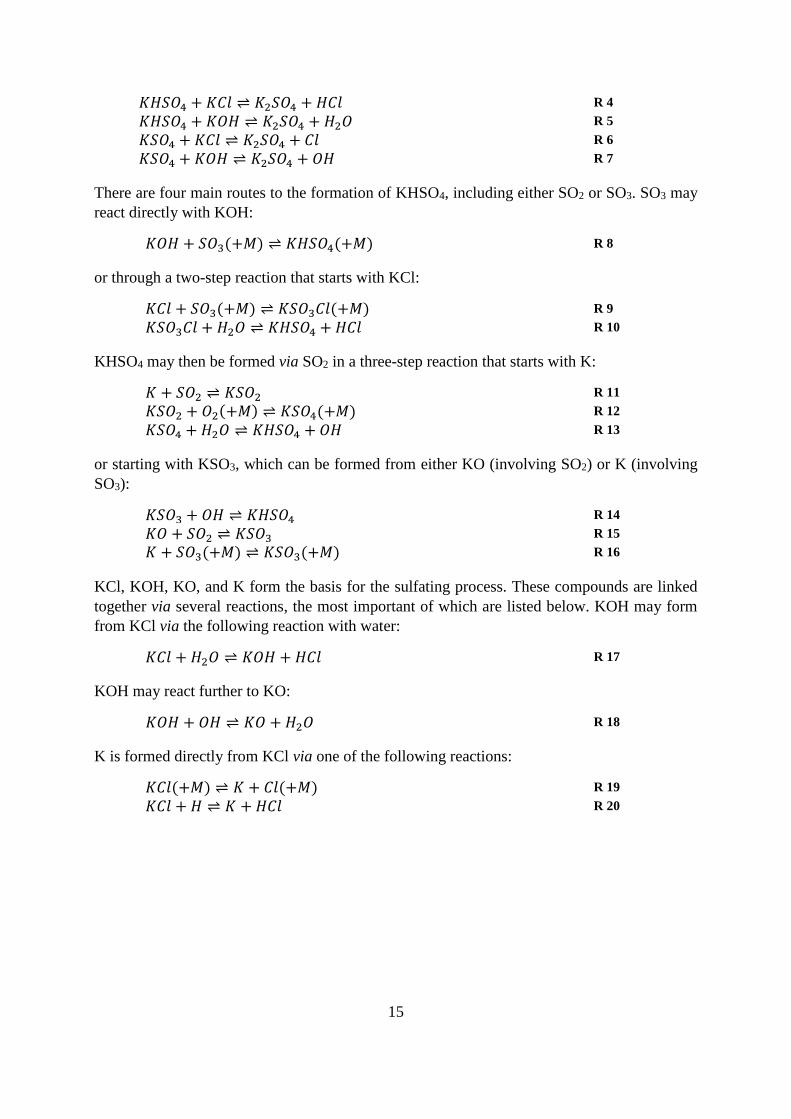
3.5 NO formation There are two possible sources of nitrogen in a combustion process: N2 from the air, and fuel-
bound nitrogen, and NO may be formed from both of these sources. A general reaction scheme
for NO formation from the two possible sources is shown in Figure 6. As discussed in
Section 3.1, the fuel-bound nitrogen can be divided into volatile nitrogen (volatile-N) and char-
bound nitrogen (char-N), reflecting the different ways in which nitrogen is bound to and
released from the fuel. As indicated in Figure 6, both types of fuel-bound nitrogen can form N2
or NO. These routes are, however, not considered in this work. Instead, the focus is on the
chemistry related to the formation of NO from molecular nitrogen derived from the air (i.e., the
routes within the gray-shaded area in Figure 6).
Figure 6. Reaction scheme for the general routes for NO formation. The area shaded gray indicates the aspects
of nitrogen chemistry covered in this work.
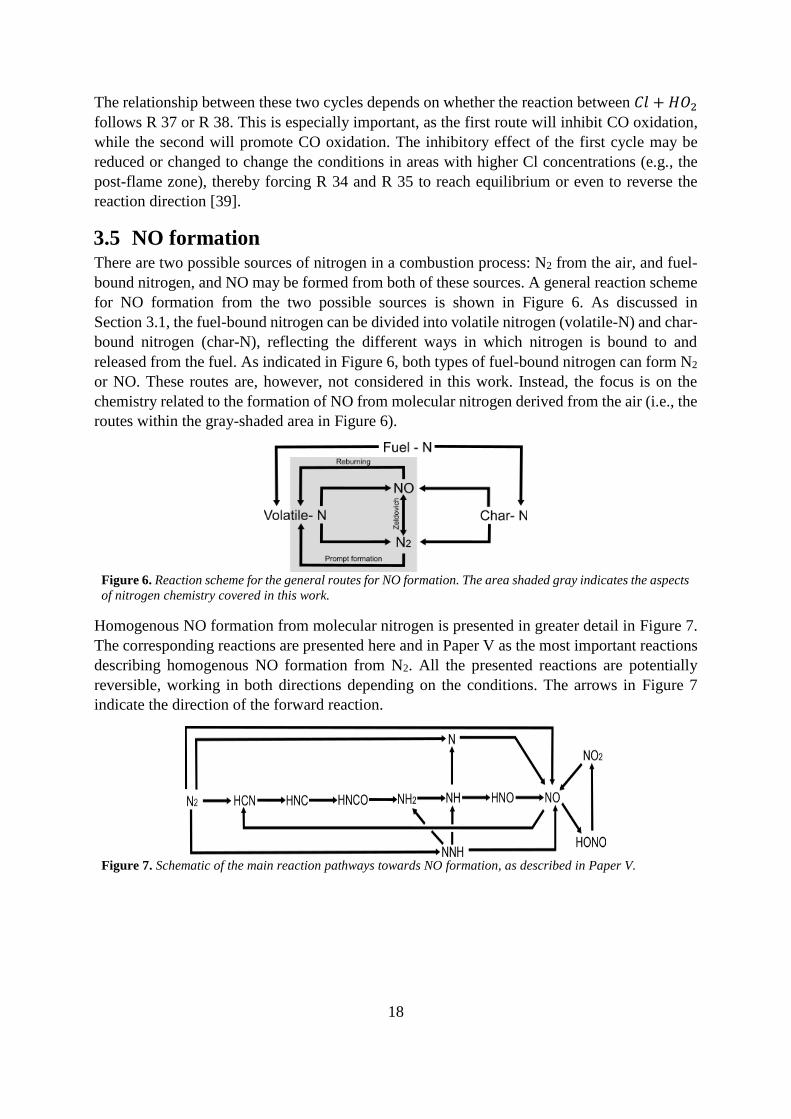
Homogenous NO formation from molecular nitrogen is presented in greater detail in Figure 7.
The corresponding reactions are presented here and in Paper V as the most important reactions
describing homogenous NO formation from N2. All the presented reactions are potentially
reversible, working in both directions depending on the conditions. The arrows in Figure 7
indicate the direction of the forward reaction.
Figure 7. Schematic of the main reaction pathways towards NO formation, as described in Paper V.

19
According to the extended Zeldóvich mechanism [98-100], NO can be formed from N2. As this
occurs at high temperatures, it is referred to as ‘thermal’ NO formation. Molecular nitrogen is
split into atomic nitrogen through the following reaction with atomic oxygen:
𝑁2 + 𝑂 ⇌ 𝑁𝑂 + 𝑁 R 40
The atomic nitrogen can thereafter react with either OH or O2 to form NO:
𝑁 + 𝑂𝐻 ⇌ 𝑁𝑂 + 𝐻 R 41
𝑁 + 𝑂2 ⇌ 𝑁𝑂 + 𝑂 R 42
Once formed, NO can react with hydrocarbon radicals to form HCN:
𝑁𝑂 + 𝐶𝑖𝐻𝑗 ⇌ 𝐻𝐶𝑁+. .. R 43
Moreover, HCN can be formed from N2, e.g., through reaction with CH, leading to the rapid
formation of NO:
𝑁2 + 𝐶𝐻 ⇌ 𝑁 + 𝐻𝐶𝑁 R 44
Kinetically-controlled NO formation is, in high-temperature systems, less important than
thermal NO formation [101]. Following a long series of reactions, NO can be reformed from
HCN. HCN may also cause NO to generate NH, with HNC and HNCO, as well as NH2 as
intermediates that react with H or OH:
𝐻𝐶𝑁 + 𝑀 ⇌ 𝐻𝑁𝐶 + 𝑀 R 45
𝐻𝐶𝑁 + 𝐻 ⇌ 𝐻𝑁𝐶 + 𝐻 R 46
𝐻𝑁𝐶 + 𝑂𝐻 ⇌ 𝐻𝑁𝐶𝑂 + 𝐻 R 47
𝐻𝑁𝐶𝑂 + 𝐻 ⇌ 𝑁𝐻2 + 𝐶𝑂 R 48
𝐻𝑁𝐶𝑂 + 𝑂𝐻 ⇌ 𝑁𝐻2 + 𝐶𝑂2 R 49
𝑁𝐻2 + 𝑂𝐻 ⇌ 𝑁𝐻 + 𝐻2𝑂 R 50
𝑁𝐻2 + 𝐻 ⇌ 𝑁𝐻 + 𝐻2 R 51
There are, however, also possibilities for HCN to form N2 in a process that is termed ‘reburning’
[102]. A second route from molecular nitrogen towards NH is that via NNH, together with
either O or OH. In both cases, NO is also formed:
𝑁2 + 𝐻 ⇌ 𝑁𝑁𝐻 R 52
𝑁𝑁𝐻 + 𝑂 ⇌ 𝑁𝐻 + 𝑁𝑂 R 53
𝑁𝑁𝐻 + 𝑂𝐻 ⇌ 𝑁𝐻2 + 𝑁𝑂 R 54
There are two possible ways to form NO from NH. First, atomic nitrogen can be formed via
reaction with H or OH:
𝑁𝐻 + 𝐻 ⇌ 𝑁 + 𝐻2 R 55
𝑁𝐻 + 𝑂𝐻 ⇌ 𝑁 + 𝐻2𝑂 R 56

20
Once N is formed, NO can be formed via R 41 and R 42. The second possibility is to form NO
with HNO as an intermediate:
𝑁𝐻 + 𝐶𝑂2 ⇌ 𝐻𝑁𝑂 + 𝐶𝑂 R 57
𝑁𝐻 + 𝑂𝐻 ⇌ 𝐻𝑁𝑂 + 𝐻 R 58
𝑁𝐻 + 𝑂2 ⇌ 𝐻𝑁𝑂 + 𝑂 R 59
𝐻𝑁𝑂 + 𝑁2 ⇌ 𝑁𝑂 + 𝐻 + 𝑁2 R 60
𝐻𝑁𝑂 + 𝑀 ⇌ 𝑁𝑂 + 𝐻 + 𝑀 R 61
𝐻𝑁𝑂 + 𝑂𝐻 ⇌ 𝑁𝑂 + 𝐻2𝑂 R 62
𝐻𝑁𝑂 + 𝑂 ⇌ 𝑁𝑂 + 𝑂𝐻 R 63
𝐻𝑁𝑂 + 𝑂2 ⇌ 𝑁𝑂 + 𝐻𝑂2 R 64
Finally, there exists a pathway in which NO reacts with OH to form HONO, which may react
back to NO via NO2:
𝑁𝑂 + 𝑂𝐻 + 𝑀 ⇌ 𝐻𝑂𝑁𝑂 + 𝑀 R 65
𝐻𝑂𝑁𝑂 + 𝐻 ⇌ 𝑁𝑂2 + 𝐻2 R 66
𝐻𝑂𝑁𝑂 + 𝑂𝐻 ⇌ 𝑁𝑂2 + 𝐻2𝑂 R 67
𝑁𝑂2 + 𝐻 ⇌ 𝑁𝑂 + 𝑂𝐻 R 68
𝑁𝑂2 + 𝑂 ⇌ 𝑁𝑂 + 𝑂2 R 69
𝑁𝑂2 + 𝑂𝐻 ⇌ 𝑁𝑂 + 𝐻𝑂2 R 70
𝑁𝑂2 + 𝑀 ⇌ 𝑁𝑂 + +𝑂 + 𝑀 R 71
3.5.1 The influences of S and K on NO formation
Glarborg [39] simulated the influence of sulfur on NO formation during the combustion of
methane in air and compared the results with the experimental results for hydrocarbon
combustion in air found in the literature [103-105]. Both the experiments and the model
indicated a decrease in the exit concentration of NO when sulfuric species were added. This
was found for both fuel-lean and fuel-rich flames and was attributed by the model to radical
recombination being catalyzed by the sulfur. This is achieved under reducing conditions
following reactions R 28, R 29 and R 31, whereby the reduction in level of radicals inhibits the
formation of N2 from HCN and NH3 [39]. Wendt et al. [103] also showed in their experiments
that the addition of SO2 increased the decay of NO in the post-flame zone. This was suggested
by Glarborg [39] to be due to direct interactions between N and S, where the direction of the
reactions varies depending on whether the conditions are reducing or oxidizing.
𝑁 + 𝑆𝑂 ⇌ 𝑁𝑂 + 𝑆 R 72
𝑁 + 𝑆𝑂2 ⇌ 𝑁𝑂 + 𝑆𝑂 R 73
Regarding alkali-nitrogen interactions, sodium has been reported to increase the transformation
of char-N to volatile-N, thereby altering the overall formation of NO [106]. Alkali-metals also
influence the formation of NO, albeit only indirectly through an effect on CO oxidation [107,
108]. All these previous studies have focused on solid fuels and the relatively low combustion
temperatures relevant to FB combustion. In contrast, the present work focuses on the formation
of NO from molecular nitrogen during combustion in suspension, which entails much higher
temperatures than fluidized bed combustion.
21
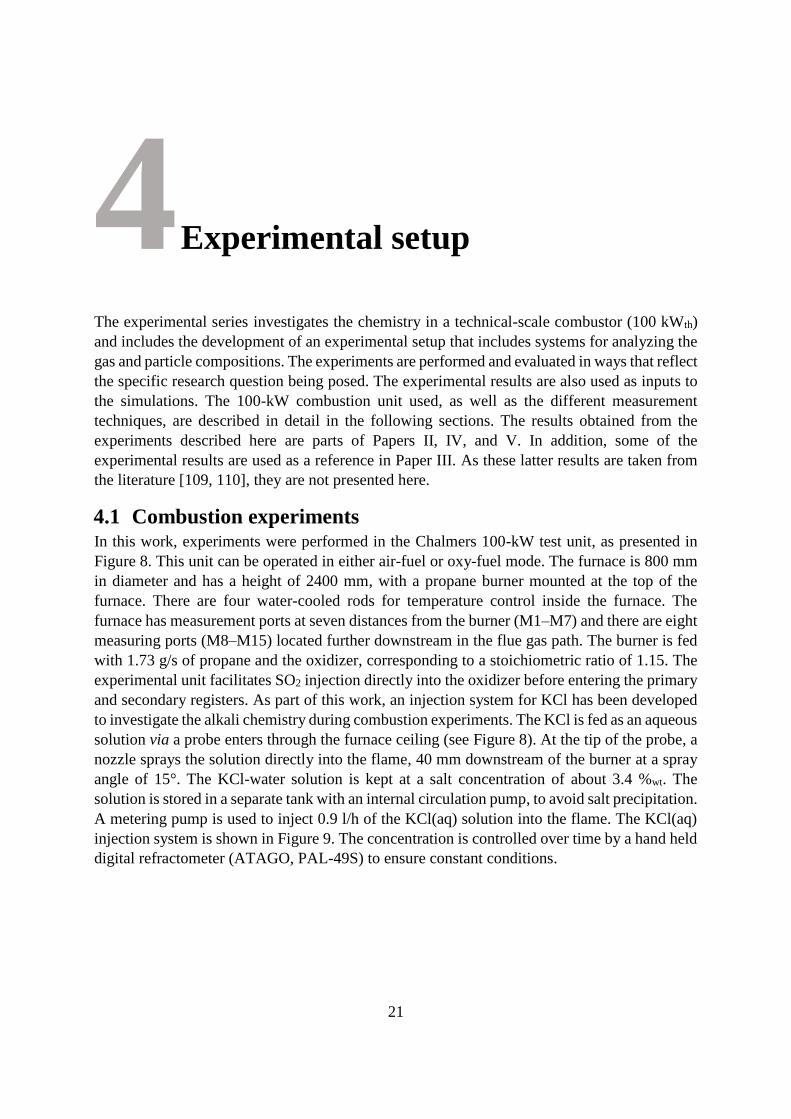
4 Experimental setup
The experimental series investigates the chemistry in a technical-scale combustor (100 kWth)
and includes the development of an experimental setup that includes systems for analyzing the
gas and particle compositions. The experiments are performed and evaluated in ways that reflect
the specific research question being posed. The experimental results are also used as inputs to
the simulations. The 100-kW combustion unit used, as well as the different measurement
techniques, are described in detail in the following sections. The results obtained from the
experiments described here are parts of Papers II, IV, and V. In addition, some of the
experimental results are used as a reference in Paper III. As these latter results are taken from
the literature [109, 110], they are not presented here.
4.1 Combustion experiments In this work, experiments were performed in the Chalmers 100-kW test unit, as presented in
Figure 8. This unit can be operated in either air-fuel or oxy-fuel mode. The furnace is 800 mm
in diameter and has a height of 2400 mm, with a propane burner mounted at the top of the
furnace. There are four water-cooled rods for temperature control inside the furnace. The
furnace has measurement ports at seven distances from the burner (M1–M7) and there are eight
measuring ports (M8–M15) located further downstream in the flue gas path. The burner is fed
with 1.73 g/s of propane and the oxidizer, corresponding to a stoichiometric ratio of 1.15. The
experimental unit facilitates SO2 injection directly into the oxidizer before entering the primary
and secondary registers. As part of this work, an injection system for KCl has been developed
to investigate the alkali chemistry during combustion experiments. The KCl is fed as an aqueous
solution via a probe enters through the furnace ceiling (see Figure 8). At the tip of the probe, a
nozzle sprays the solution directly into the flame, 40 mm downstream of the burner at a spray
angle of 15°. The KCl-water solution is kept at a salt concentration of about 3.4 %wt. The
solution is stored in a separate tank with an internal circulation pump, to avoid salt precipitation.
A metering pump is used to inject 0.9 l/h of the KCl(aq) solution into the flame. The KCl(aq)
injection system is shown in Figure 9. The concentration is controlled over time by a hand held
digital refractometer (ATAGO, PAL-49S) to ensure constant conditions.

22
Figure 8. Schematic of the 100-kW test unit at Chalmers University of Technology. The red arrows indicate the
positions for the injection of KCl and SO2. The locations of the 15 measuring ports are indicated as M1–M15.
Figure 9. Schematic of the salt injection setup, including the storage tank, metering pump, and injection probe.
The injection flow rate of KCl(aq) was kept constant in all the experiments. In contrast, the
concentration of KCl was varied for the CO experiments presented in Papers IV and V,
respectively. In these studies, the injection of pure water (0.0 %wt KCl) was also done, to
establish a reference effect caused by the water itself. In the CO experiments (Paper IV), the
KCl content was also doubled in one case (6.68 %wt KCl). In those cases in which the S/K-ratio
was altered (Paper II), this was achieved by adjusting the amount of SO2 injected. The amount
of SO2 injected was set by a mass flow controller, as well as by adjusting the concentration in
the oxidizer. The reason for this is that during operation with flue gas recycling, SO2 is recycled
to the burner inlet. Inevitably, some sulfur is lost in the flue gas system due to absorption by
the condensing water and reactions with deposits in the filters. The SO2 concentration was
found to decrease by 11% between measuring ports M8 and M13. The concentration of sulfur
in each oxy-fuel case was based on a decrease in SO2 concentration of around 14% in the
recirculation loop. This loss of sulfur in the loop varied with time, although the SO2
concentration in the oxy-fuel oxidizer was kept constant for each case by adjusting the set-point
in the mass flow controller.
23
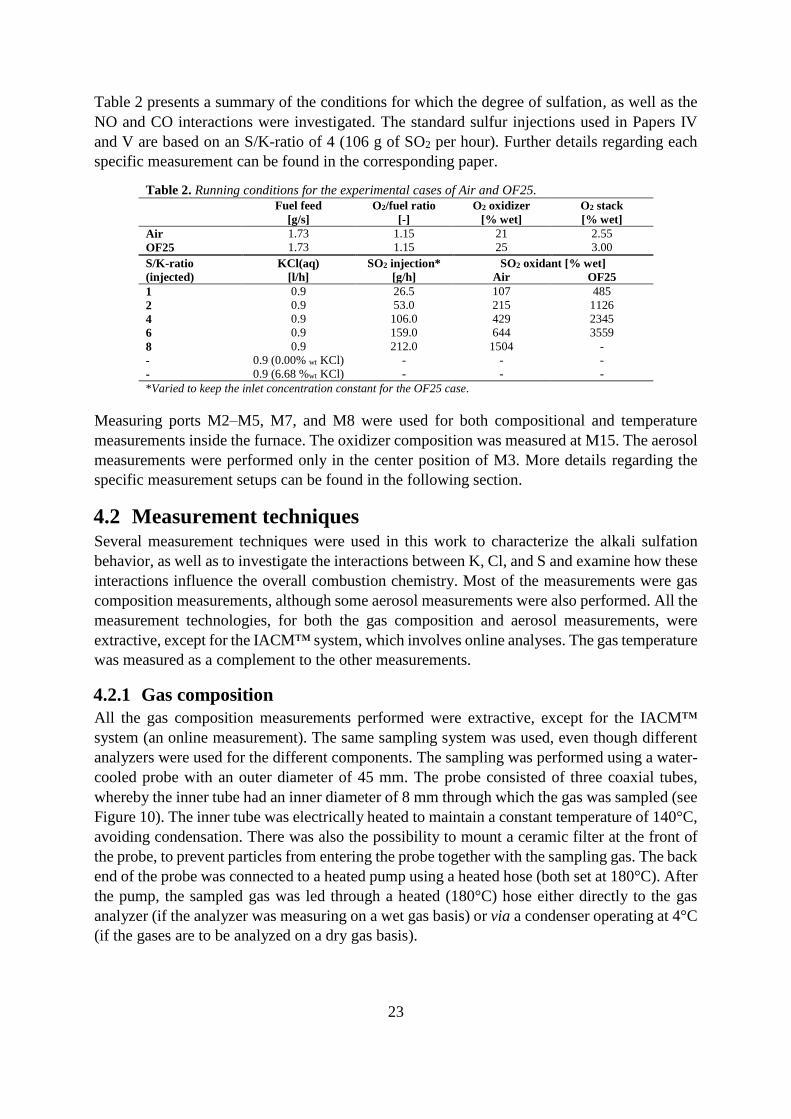
Table 2 presents a summary of the conditions for which the degree of sulfation, as well as the
NO and CO interactions were investigated. The standard sulfur injections used in Papers IV
and V are based on an S/K-ratio of 4 (106 g of SO2 per hour). Further details regarding each
specific measurement can be found in the corresponding paper.
Table 2. Running conditions for the experimental cases of Air and OF25.
Fuel feed
[g/s]
O2/fuel ratio
[-]
O2 oxidizer
[% wet]
O2 stack
[% wet]
Air 1.73 1.15 21 2.55
OF25 1.73 1.15 25 3.00
S/K-ratio
(injected)
KCl(aq)
[l/h]
SO2 injection*
[g/h]
SO2 oxidant [% wet]
Air OF25
1 0.9 26.5 107 485
2 0.9 53.0 215 1126
4 0.9 106.0 429 2345
6 0.9 159.0 644 3559
8 0.9 212.0 1504 -
- 0.9 (0.00% wt KCl) - - -
- 0.9 (6.68 %wt KCl) - - -
*Varied to keep the inlet concentration constant for the OF25 case.
Measuring ports M2–M5, M7, and M8 were used for both compositional and temperature
measurements inside the furnace. The oxidizer composition was measured at M15. The aerosol
measurements were performed only in the center position of M3. More details regarding the
specific measurement setups can be found in the following section.
4.2 Measurement techniques Several measurement techniques were used in this work to characterize the alkali sulfation
behavior, as well as to investigate the interactions between K, Cl, and S and examine how these
interactions influence the overall combustion chemistry. Most of the measurements were gas
composition measurements, although some aerosol measurements were also performed. All the
measurement technologies, for both the gas composition and aerosol measurements, were
extractive, except for the IACM™ system, which involves online analyses. The gas temperature
was measured as a complement to the other measurements.
4.2.1 Gas composition
All the gas composition measurements performed were extractive, except for the IACM™
system (an online measurement). The same sampling system was used, even though different
analyzers were used for the different components. The sampling was performed using a water-
cooled probe with an outer diameter of 45 mm. The probe consisted of three coaxial tubes,
whereby the inner tube had an inner diameter of 8 mm through which the gas was sampled (see
Figure 10). The inner tube was electrically heated to maintain a constant temperature of 140°C,
avoiding condensation. There was also the possibility to mount a ceramic filter at the front of
the probe, to prevent particles from entering the probe together with the sampling gas. The back
end of the probe was connected to a heated pump using a heated hose (both set at 180°C). After
the pump, the sampled gas was led through a heated (180°C) hose either directly to the gas
analyzer (if the analyzer was measuring on a wet gas basis) or via a condenser operating at 4°C
(if the gases are to be analyzed on a dry gas basis).
24
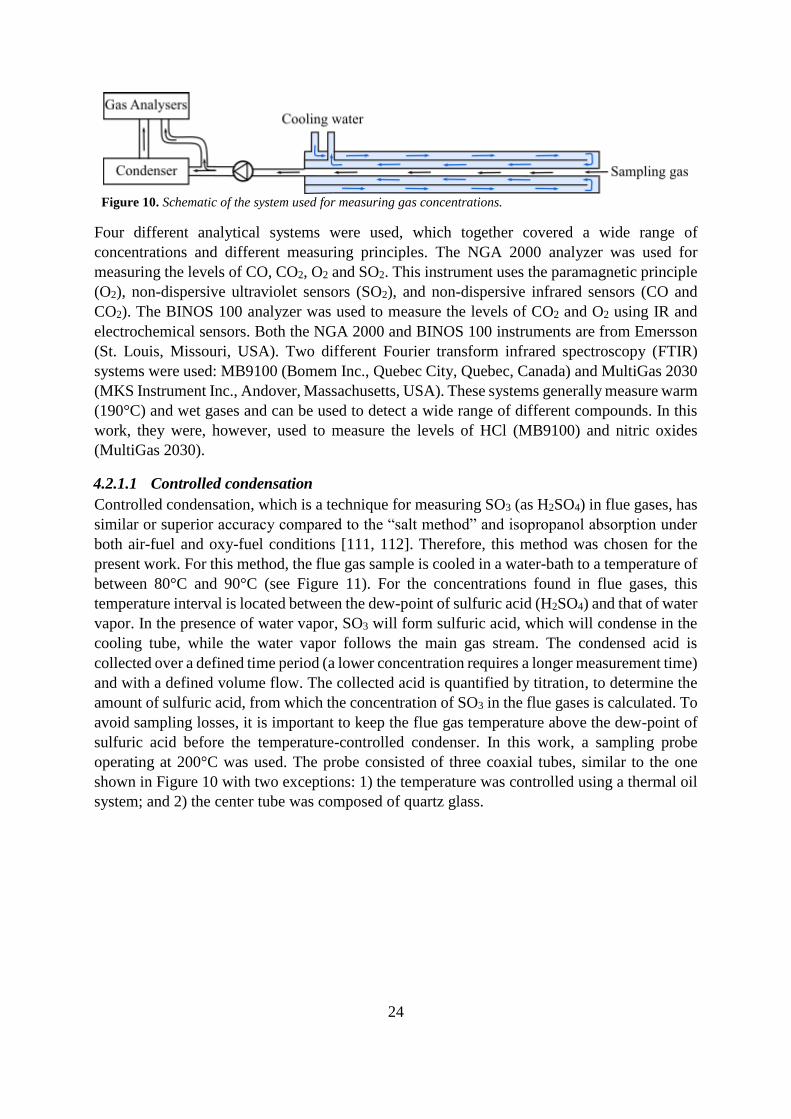
Figure 10. Schematic of the system used for measuring gas concentrations.
Four different analytical systems were used, which together covered a wide range of
concentrations and different measuring principles. The NGA 2000 analyzer was used for
measuring the levels of CO, CO2, O2 and SO2. This instrument uses the paramagnetic principle
(O2), non-dispersive ultraviolet sensors (SO2), and non-dispersive infrared sensors (CO and
CO2). The BINOS 100 analyzer was used to measure the levels of CO2 and O2 using IR and
electrochemical sensors. Both the NGA 2000 and BINOS 100 instruments are from Emersson
(St. Louis, Missouri, USA). Two different Fourier transform infrared spectroscopy (FTIR)
systems were used: MB9100 (Bomem Inc., Quebec City, Quebec, Canada) and MultiGas 2030
(MKS Instrument Inc., Andover, Massachusetts, USA). These systems generally measure warm
(190°C) and wet gases and can be used to detect a wide range of different compounds. In this
work, they were, however, used to measure the levels of HCl (MB9100) and nitric oxides
(MultiGas 2030).
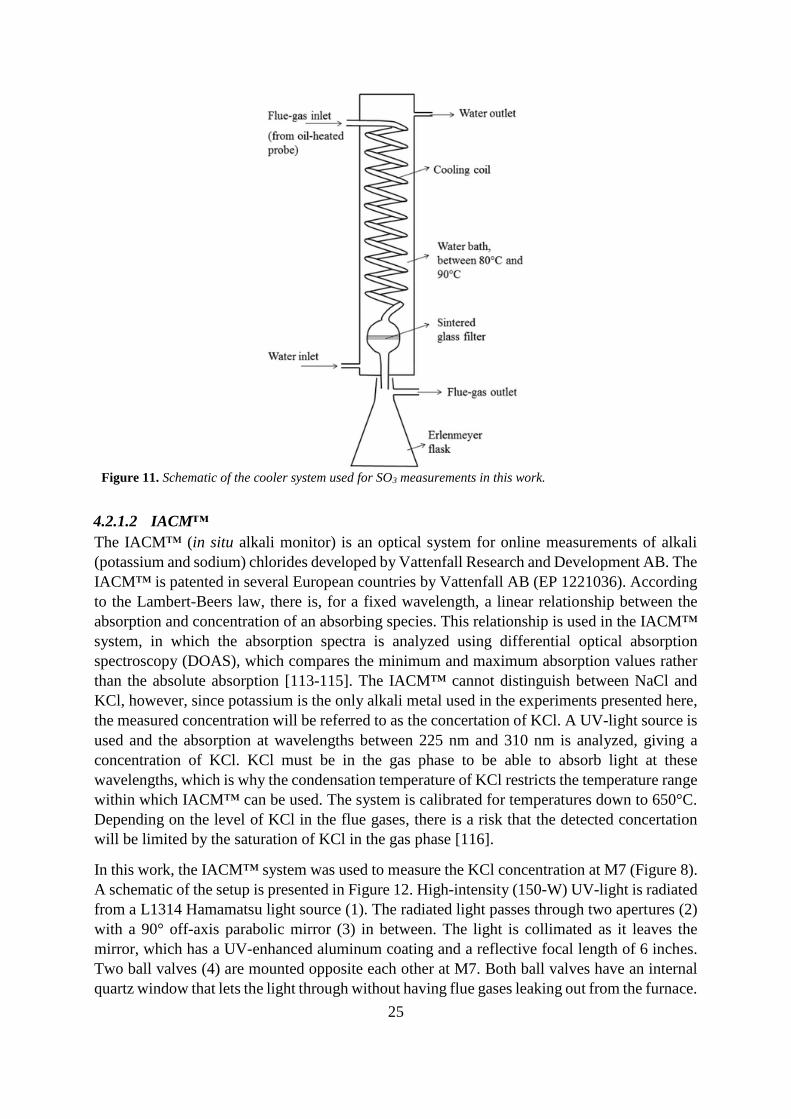
4.2.1.1 Controlled condensation
Controlled condensation, which is a technique for measuring SO3 (as H2SO4) in flue gases, has
similar or superior accuracy compared to the “salt method” and isopropanol absorption under
both air-fuel and oxy-fuel conditions [111, 112]. Therefore, this method was chosen for the
present work. For this method, the flue gas sample is cooled in a water-bath to a temperature of
between 80°C and 90°C (see Figure 11). For the concentrations found in flue gases, this
temperature interval is located between the dew-point of sulfuric acid (H2SO4) and that of water
vapor. In the presence of water vapor, SO3 will form sulfuric acid, which will condense in the
cooling tube, while the water vapor follows the main gas stream. The condensed acid is
collected over a defined time period (a lower concentration requires a longer measurement time)
and with a defined volume flow. The collected acid is quantified by titration, to determine the
amount of sulfuric acid, from which the concentration of SO3 in the flue gases is calculated. To
avoid sampling losses, it is important to keep the flue gas temperature above the dew-point of
sulfuric acid before the temperature-controlled condenser. In this work, a sampling probe
operating at 200°C was used. The probe consisted of three coaxial tubes, similar to the one
shown in Figure 10 with two exceptions: 1) the temperature was controlled using a thermal oil
system; and 2) the center tube was composed of quartz glass.
25
Figure 11. Schematic of the cooler system used for SO3 measurements in this work.
4.2.1.2 IACM™
The IACM™ (in situ alkali monitor) is an optical system for online measurements of alkali
(potassium and sodium) chlorides developed by Vattenfall Research and Development AB. The
IACM™ is patented in several European countries by Vattenfall AB (EP 1221036). According
to the Lambert-Beers law, there is, for a fixed wavelength, a linear relationship between the
absorption and concentration of an absorbing species. This relationship is used in the IACM™
system, in which the absorption spectra is analyzed using differential optical absorption
spectroscopy (DOAS), which compares the minimum and maximum absorption values rather
than the absolute absorption [113-115]. The IACM™ cannot distinguish between NaCl and
KCl, however, since potassium is the only alkali metal used in the experiments presented here,
the measured concentration will be referred to as the concertation of KCl. A UV-light source is
used and the absorption at wavelengths between 225 nm and 310 nm is analyzed, giving a
concentration of KCl. KCl must be in the gas phase to be able to absorb light at these
wavelengths, which is why the condensation temperature of KCl restricts the temperature range
within which IACM™ can be used. The system is calibrated for temperatures down to 650°C.
Depending on the level of KCl in the flue gases, there is a risk that the detected concertation
will be limited by the saturation of KCl in the gas phase [116].
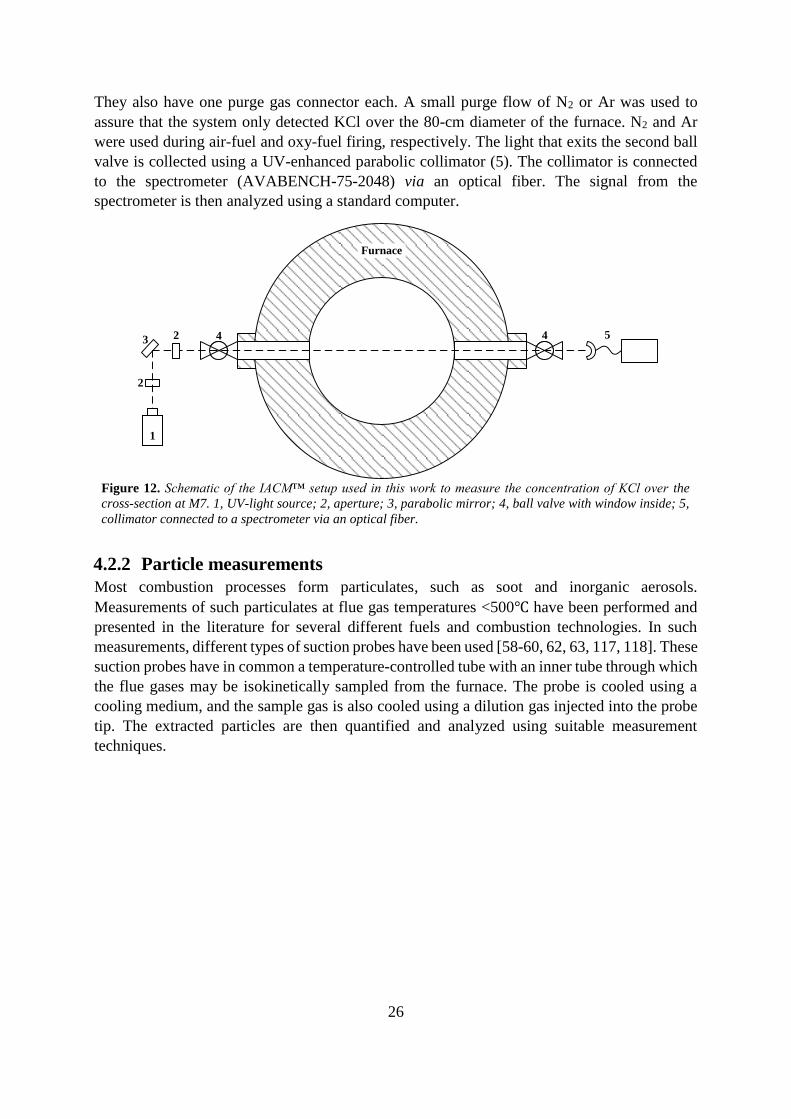
In this work, the IACM™ system was used to measure the KCl concentration at M7 (Figure 8).
A schematic of the setup is presented in Figure 12. High-intensity (150-W) UV-light is radiated
from a L1314 Hamamatsu light source (1). The radiated light passes through two apertures (2)
with a 90° off-axis parabolic mirror (3) in between. The light is collimated as it leaves the
mirror, which has a UV-enhanced aluminum coating and a reflective focal length of 6 inches.
Two ball valves (4) are mounted opposite each other at M7. Both ball valves have an internal
quartz window that lets the light through without having flue gases leaking out from the furnace.
26
They also have one purge gas connector each. A small purge flow of N2 or Ar was used to
assure that the system only detected KCl over the 80-cm diameter of the furnace. N2 and Ar
were used during air-fuel and oxy-fuel firing, respectively. The light that exits the second ball
valve is collected using a UV-enhanced parabolic collimator (5). The collimator is connected
to the spectrometer (AVABENCH-75-2048) via an optical fiber. The signal from the
spectrometer is then analyzed using a standard computer.
Figure 12. Schematic of the IACM™ setup used in this work to measure the concentration of KCl over the
cross-section at M7. 1, UV-light source; 2, aperture; 3, parabolic mirror; 4, ball valve with window inside; 5,
collimator connected to a spectrometer via an optical fiber.
4.2.2 Particle measurements
Most combustion processes form particulates, such as soot and inorganic aerosols.
Measurements of such particulates at flue gas temperatures <500℃ have been performed and
presented in the literature for several different fuels and combustion technologies. In such
measurements, different types of suction probes have been used [58-60, 62, 63, 117, 118]. These
suction probes have in common a temperature-controlled tube with an inner tube through which
the flue gases may be isokinetically sampled from the furnace. The probe is cooled using a
cooling medium, and the sample gas is also cooled using a dilution gas injected into the probe
tip. The extracted particles are then quantified and analyzed using suitable measurement
techniques.
1
2
3 2 4
Furnace
4 5

27
4.2.2.1 Extraction of particles
Extracting particles at high temperatures (>600℃) is difficult, especially during biomass
combustion in which the concentrations of inorganic species (which typically condense at such
temperatures) are relatively high. Condensation may affect the result by changing both the
composition and the size of the particles during the extraction. Valmari et al. [119] avoided
condensation by inserting the equipment into the flue gas path (convection path, about 650℃).
Strand et al. [120] and Lind et al. [121] have performed high-temperature (750℃ and 830℃,
respectively) particle extractions using a suction probe that was designed to meet the criteria
for cooling rate, dilution, and residence time, in order to avoid problems with agglomeration
and/or the condensation of gaseous compounds. Wiinikka et al. [122] have presented results
from particle extractions from a 8-kW wood pellet combustor for even higher temperatures, up
to 1450℃, which corresponds to the in-flame temperature condition. Similar experimental
setups have been used more recently, e.g., by Fernandes et al, [123], even though they measured
at a lower temperature of around 900°C.
The extracted sample should be adjusted to a high dilution ratio (1:100), so that the vapor
condensates on the probe walls instead of on the already existing particles, thereby minimizing
the risk of an altered particle size distribution [120]. It is also important to have a cooling rate
of >600℃/s so as favor homogenous nucleation over heterogeneous nucleation. This will
produce many nano-sized particles, but keeps the sampled particles less affected [124, 125].
Coagulation of particles can take place spontaneously due to relative motion and is strongly
dependent upon the particle concentration and residence time. A residence time of 0.2 s is
sufficient for a particle concentration of 1018 to decrease by as much as a factor 1000. This will
increase the mean particle diameter correspondingly [126]. A high dilution rate and a short
residence time between the probe tip and the measurement equipment are therefore preferable.
4.2.2.2 Our setup
In this work, the particle measurements were performed by sampling at the center position of
M3 using a suction probe. The probe, which was maintained at a temperature of 120°C using a
thermal oil system, was connected to a vacuum pump that was used to extract the sample
volume from the furnace. The sample was taken via the opening at the tip of the probe (indicated
with a green arrow in Figure 13). Soon after the sample flow entered the probe, it was diluted
with nitrogen (indicated with blue arrows in Figure 13), and the diluted sample exited the probe
at the back end. The gas temperature at the probe inlet was <250°C, which enabled a sufficient
cooling rate. The dilution rate of approximately five in the probe resulted in a residence time in
the probe of about 0.5 s, which was too short for any significant wall condensation to occur.

28
Figure 13. Cross-sectional drawing showing the tip of the particle-sampling probe used in this work. The green
arrow indicates the hole through which the sample is taken. The blue arrows represent the dilution gas, and the
orange arrows represent the flow of thermal oil.
The sample flow extracted using the suction probe was split after the probe, as indicated in
Figure 14. The main part of the sample stream passed through the DLPI as well as the vacuum
pump used to create the low pressure level needed for the DLPI. The system can be run also
without the DLPI, in which case the pump is only used to create a suction flow through the
probe. A slipstream can be used for analysis in a SMPS and VT-DMA. This slipstream was
further diluted in two steps. After each dilution step, the main part of the flow was ejected so
as to reduce the total flow downstream in the system. The flow going in to the SMPS and VT-
DMA had a dilution rate of around 375 (including the dilution factor in the probe).
Figure 14. Schematic of the particle aerosol sampling and analysis system used in this work.
4.2.2.3 DLPI
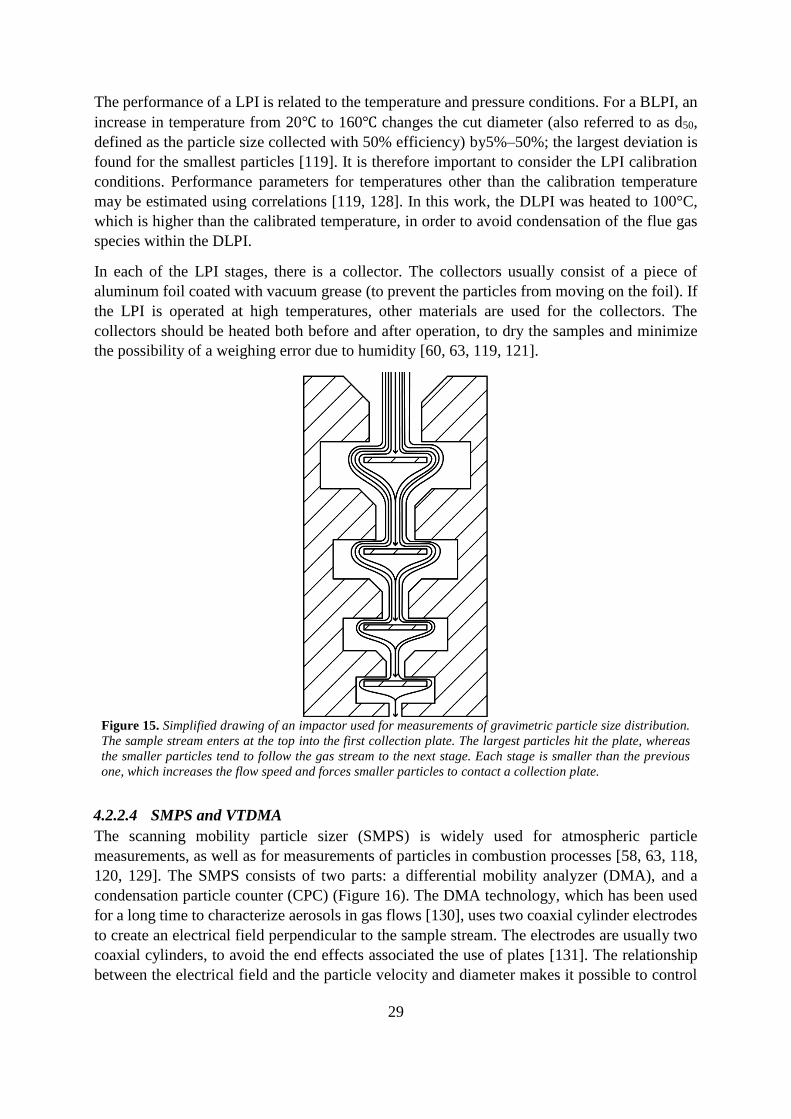
The mass size classification of particles is usually accomplished using a low-pressure impactor
(LPI), which separates particles in the range of 30 nm to 10 𝜇m. A cascade impactor has a lower
limit at 300 nm (see Figure 15 for a depiction of the impactor principle). Cyclones are used for
collecting larger particles and for preventing large particles form filling the top stage of the LPI
[58-60, 62, 63, 117, 118, 124, 125, 127]. Currently, the most commonly used LPI is the Dekati
low-pressure impactor (DLPI). The DLPI has a slightly different design and has two additional
stages (13 in total), giving better performance than the older-generation Berner low-pressure
impactor (BLPI) [127].
29
The performance of a LPI is related to the temperature and pressure conditions. For a BLPI, an
increase in temperature from 20℃ to 160℃ changes the cut diameter (also referred to as d50,
defined as the particle size collected with 50% efficiency) by5%–50%; the largest deviation is
found for the smallest particles [119]. It is therefore important to consider the LPI calibration
conditions. Performance parameters for temperatures other than the calibration temperature
may be estimated using correlations [119, 128]. In this work, the DLPI was heated to 100°C,
which is higher than the calibrated temperature, in order to avoid condensation of the flue gas
species within the DLPI.
In each of the LPI stages, there is a collector. The collectors usually consist of a piece of
aluminum foil coated with vacuum grease (to prevent the particles from moving on the foil). If
the LPI is operated at high temperatures, other materials are used for the collectors. The
collectors should be heated both before and after operation, to dry the samples and minimize
the possibility of a weighing error due to humidity [60, 63, 119, 121].
Figure 15. Simplified drawing of an impactor used for measurements of gravimetric particle size distribution.
The sample stream enters at the top into the first collection plate. The largest particles hit the plate, whereas
the smaller particles tend to follow the gas stream to the next stage. Each stage is smaller than the previous
one, which increases the flow speed and forces smaller particles to contact a collection plate.
4.2.2.4 SMPS and VTDMA
The scanning mobility particle sizer (SMPS) is widely used for atmospheric particle
measurements, as well as for measurements of particles in combustion processes [58, 63, 118,
120, 129]. The SMPS consists of two parts: a differential mobility analyzer (DMA), and a
condensation particle counter (CPC) (Figure 16). The DMA technology, which has been used
for a long time to characterize aerosols in gas flows [130], uses two coaxial cylinder electrodes
to create an electrical field perpendicular to the sample stream. The electrodes are usually two
coaxial cylinders, to avoid the end effects associated the use of plates [131]. The relationship
between the electrical field and the particle velocity and diameter makes it possible to control
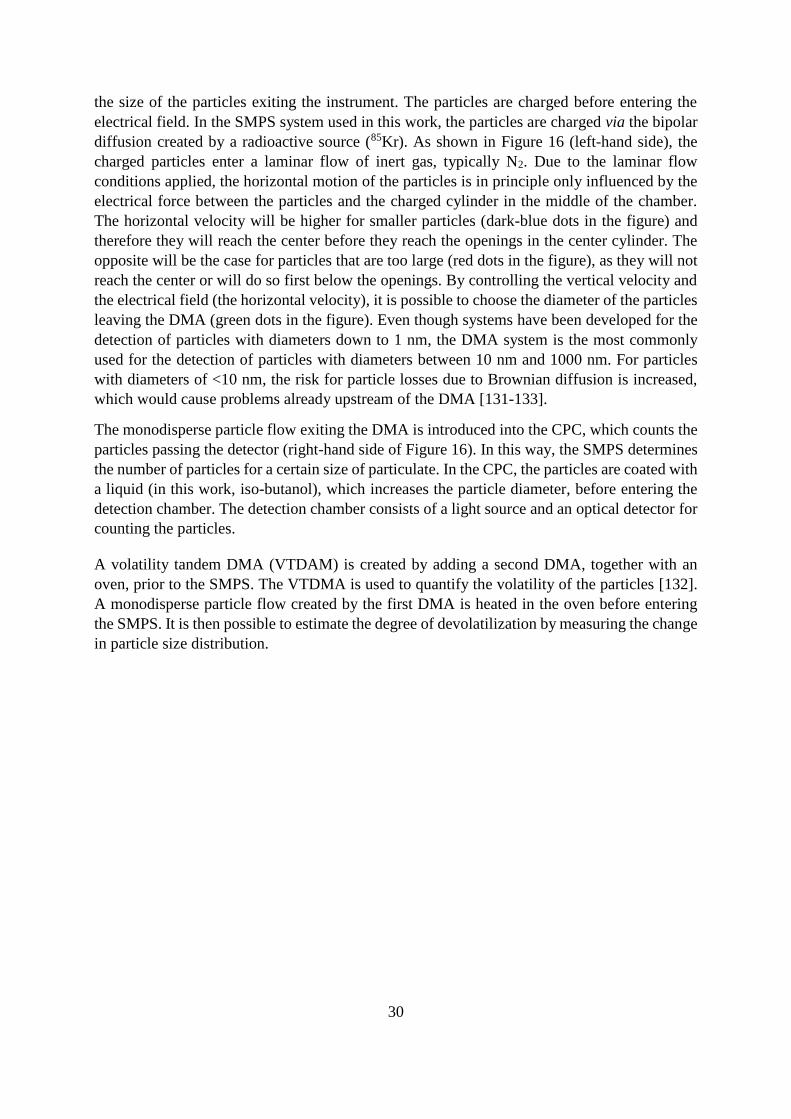
30
the size of the particles exiting the instrument. The particles are charged before entering the
electrical field. In the SMPS system used in this work, the particles are charged via the bipolar
diffusion created by a radioactive source (85Kr). As shown in Figure 16 (left-hand side), the
charged particles enter a laminar flow of inert gas, typically N2. Due to the laminar flow
conditions applied, the horizontal motion of the particles is in principle only influenced by the
electrical force between the particles and the charged cylinder in the middle of the chamber.
The horizontal velocity will be higher for smaller particles (dark-blue dots in the figure) and
therefore they will reach the center before they reach the openings in the center cylinder. The
opposite will be the case for particles that are too large (red dots in the figure), as they will not
reach the center or will do so first below the openings. By controlling the vertical velocity and
the electrical field (the horizontal velocity), it is possible to choose the diameter of the particles
leaving the DMA (green dots in the figure). Even though systems have been developed for the
detection of particles with diameters down to 1 nm, the DMA system is the most commonly
used for the detection of particles with diameters between 10 nm and 1000 nm. For particles
with diameters of <10 nm, the risk for particle losses due to Brownian diffusion is increased,
which would cause problems already upstream of the DMA [131-133].
The monodisperse particle flow exiting the DMA is introduced into the CPC, which counts the
particles passing the detector (right-hand side of Figure 16). In this way, the SMPS determines
the number of particles for a certain size of particulate. In the CPC, the particles are coated with
a liquid (in this work, iso-butanol), which increases the particle diameter, before entering the
detection chamber. The detection chamber consists of a light source and an optical detector for
counting the particles.
A volatility tandem DMA (VTDAM) is created by adding a second DMA, together with an
oven, prior to the SMPS. The VTDMA is used to quantify the volatility of the particles [132].
A monodisperse particle flow created by the first DMA is heated in the oven before entering
the SMPS. It is then possible to estimate the degree of devolatilization by measuring the change
in particle size distribution.
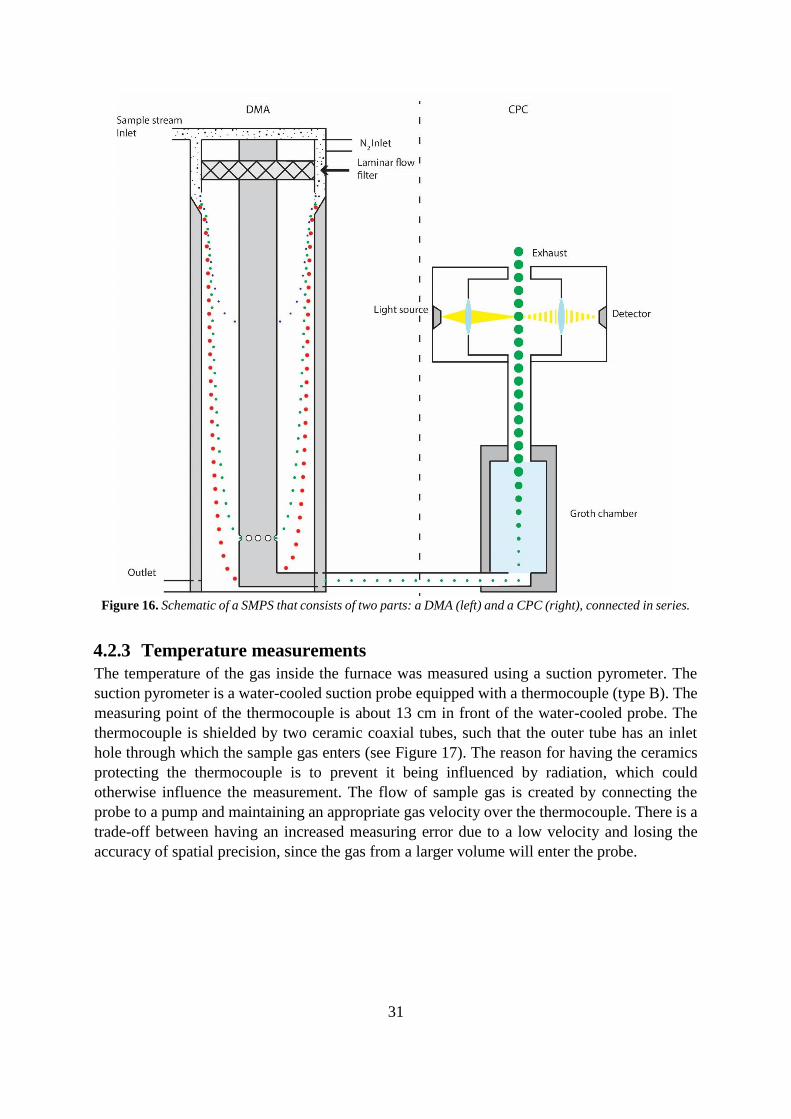
31
Figure 16. Schematic of a SMPS that consists of two parts: a DMA (left) and a CPC (right), connected in series.
4.2.3 Temperature measurements
The temperature of the gas inside the furnace was measured using a suction pyrometer. The
suction pyrometer is a water-cooled suction probe equipped with a thermocouple (type B). The
measuring point of the thermocouple is about 13 cm in front of the water-cooled probe. The
thermocouple is shielded by two ceramic coaxial tubes, such that the outer tube has an inlet
hole through which the sample gas enters (see Figure 17). The reason for having the ceramics
protecting the thermocouple is to prevent it being influenced by radiation, which could
otherwise influence the measurement. The flow of sample gas is created by connecting the
probe to a pump and maintaining an appropriate gas velocity over the thermocouple. There is a
trade-off between having an increased measuring error due to a low velocity and losing the
accuracy of spatial precision, since the gas from a larger volume will enter the probe.

32
Figure 17. The thermocouple (blue line) is shielded by a ceramic tube with only the thermocouple junction
being exposed to the flue gas flow. This point is about 13 cm in front of the water-cooled probe and is protected
by a second ceramic tube with a hole through which the hot gases (red arrows) enter.
4.3 Evaluation of sulfation measurement methods The development of an experimental setup suitable for investigating the alkali- and sulfur-
related chemistries was also part of this work. This includes the injection system for aqueous
solutions with KCl (see Section 4.1) and the evaluation of different methods for measuring the
degree of sulfation under conditions relevant to this work. The degree of sulfation is defined as
the ratio between the amount of potassium bound as sulfates and the total amount of potassium
(Equation 1). Two methods based on gas composition measurements using FTIR (HCl) and the
IACM™ (KCl) were tested, together with aerosol measurements using DLPI and SMPS in
combination with a VT-DMA, giving a total of four different techniques. A short evaluation of
each method is presented in this section.
2𝑛𝐾2𝑆𝑂4
𝑛𝐾𝑡𝑜𝑡
= 𝑑𝑒𝑔𝑟𝑒𝑒 𝑜𝑓 𝑠𝑢𝑙𝑓𝑎𝑡𝑖𝑜𝑛 Equation 1
4.3.1 HCl measurements (FTIR)
Using an FTIR system to determine the degree of sulfation by measuring the HCl concentration
is an indirect method, since it does not involve any potassium-containing species. However, in
the system used in the present work, the injected KCl was the only source of Cl, which meant
that any chlorine found in the form of HCl had to have originated from the injected KCl. The
potassium releases the chlorine not only when the final K2SO4 is formed, but also when K, KO
or KOH is formed. The HCl measurements were performed at M8, where the temperature was
<600°C, which is why it is assumed that KCl and K2SO4 are the only potassium-containing
species detected. This assumption is also supported by simulations. When using this method,
the degree of sulfation is estimated using Equation 2:
𝑛𝐻𝐶𝑙
𝑛𝐾𝑡𝑜𝑡
≈ 𝑑𝑒𝑔𝑟𝑒𝑒 𝑜𝑓 𝑠𝑢𝑙𝑓𝑎𝑡𝑖𝑜𝑛 Equation 2
Figure 18 presents a continuous measurement of HCl for the OF25 case, in which the SO2
concentration exceeded 2000 ppm. After 200 s, the injection of KCl was started and a clear
increase in HCl concentration was observed. The opposite was observed at 600 s when the
injection of KCl was terminated. The HCl concentration obtained when the KCl injection had
stopped was slightly higher than that before the injection was started. When HCl was measured
in a system that was completely free of HCl the instrument indicated a level of 0–3 ppm.
Achieving this level again, after KCl had been injected, required several hours of operation and
a slight increase in the “background” signal was therefore accepted. However, it should be noted
that after a full day of experiments, the background level was never above 15 ppm. It is also
noteworthy that the time required to reach a concentration of HCl lower than 3 ppm was
drastically shortened when the SO2 injection was stopped. When the injection was restarted, the

33
HCl level increased, which suggests that over time some KCl forms deposits that are slowly
sulfated, resulting in a detectable amount of HCl. In the experimental work, only those
measurements that showed a significant increase in HCl concentration, as a result of KCl
injection, were considered to be accurate.
Figure 18. Continuous measurement of the HCl concentration using an FTIR during oxy-fuel operation with
>2000 ppm of SO2 in the flue gas. The injection KCl was started at 200 s and turned off again at 600 s.
The clear response profile of the HCl concentration obtained as a result of KCl injection
indicates that the system works. As mentioned above, the method has value only under certain
conditions, such as KCl being the only source of Cl and KCl and K2SO4 being the only
potassium-containing species present. Based on this, the method is considered suitable for
determination of the degree of sulfation at the flue gas exit (M8) for a combustion system such
as that used in this work. It is, however, not suitable for flame measurements or for
measurements that include solid fuels.
4.3.2 KCl measurements (IACM™)
The IACM™ system was used to determine the degree of sulfation by measuring the KCl
concentration. Assuming that the only forms that potassium can take in the measuring location
are KCl and K2SO4, it is possible to calculate the degree of sulfation based on the reduction in
KCl concentration (Equation 3).
𝑛𝐾𝐶𝑙𝑖𝑛𝑙𝑒𝑡 − 𝑛𝐾𝐶𝑙
𝑛𝐾𝑡𝑜𝑡
≈ 𝑑𝑒𝑔𝑟𝑒𝑒 𝑜𝑓 𝑠𝑢𝑙𝑓𝑎𝑡𝑖𝑜𝑛 Equation 3
Since the IACM™ measures the absorption of light, it is important to have a well-defined
volume across which one can measure, in this case the diameter of the combustion unit (80 cm).
A purge gas was used to prevent the flue gas from diffusing into the measuring ports. The
temperature at the measuring position is also important, since it affects the density of the gas.
The temperature was therefore measured along the diameter of M7, for both the air-fuel and
oxy-fuel (OF25) combustion. This information was then implemented in the analysis software
used to calculate the KCl concentration. One of the obtained KCl profiles is shown in Figure
19. The measurement was performed during air-fuel combustion and at time zero, neither KCl
nor SO2 was injected. The KCl injection was initiated after 3 minutes, and continued for 30
minutes before being turned off. There was a rapid increase in the KCl concentration as soon
as the injection started. The measured KCl concertation varied between around 85 ppm and 105
ppm, with an average level of 96 ppm, which is close to the theoretical target of 100 ppm.
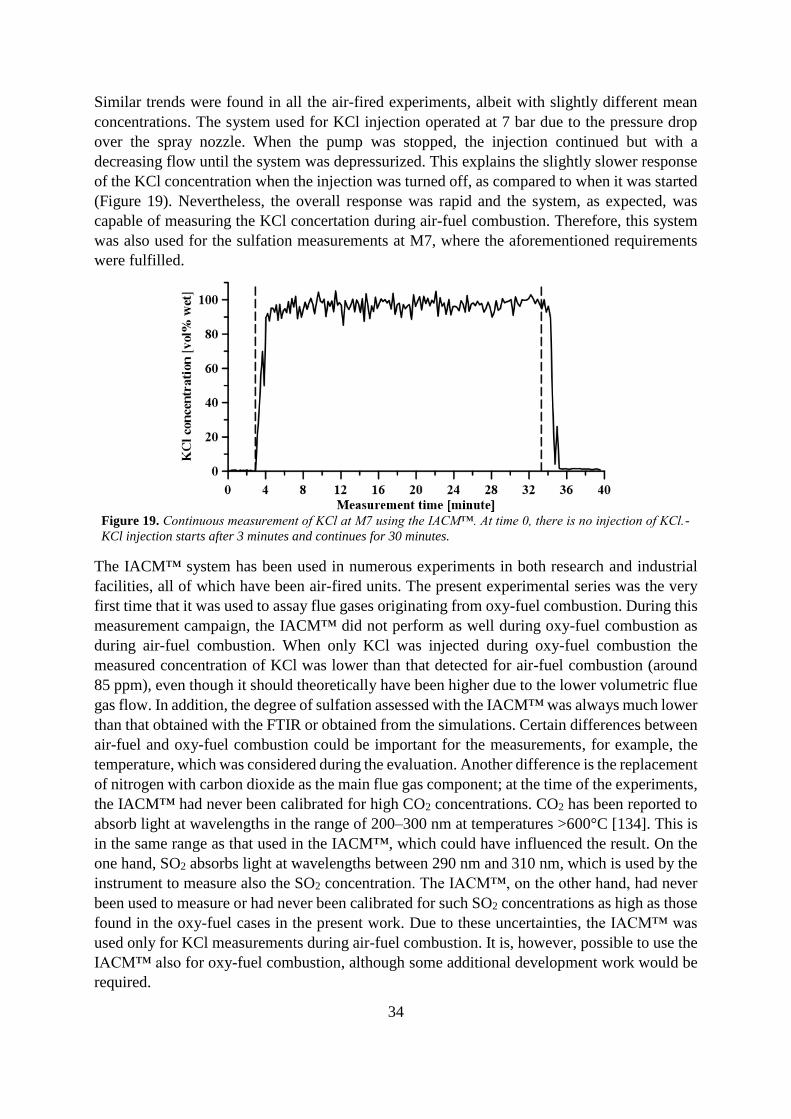
34
Similar trends were found in all the air-fired experiments, albeit with slightly different mean
concentrations. The system used for KCl injection operated at 7 bar due to the pressure drop
over the spray nozzle. When the pump was stopped, the injection continued but with a
decreasing flow until the system was depressurized. This explains the slightly slower response
of the KCl concentration when the injection was turned off, as compared to when it was started
(Figure 19). Nevertheless, the overall response was rapid and the system, as expected, was
capable of measuring the KCl concertation during air-fuel combustion. Therefore, this system
was also used for the sulfation measurements at M7, where the aforementioned requirements
were fulfilled.
Figure 19. Continuous measurement of KCl at M7 using the IACM™. At time 0, there is no injection of KCl.-
KCl injection starts after 3 minutes and continues for 30 minutes.
The IACM™ system has been used in numerous experiments in both research and industrial
facilities, all of which have been air-fired units. The present experimental series was the very
first time that it was used to assay flue gases originating from oxy-fuel combustion. During this
measurement campaign, the IACM™ did not perform as well during oxy-fuel combustion as
during air-fuel combustion. When only KCl was injected during oxy-fuel combustion the
measured concentration of KCl was lower than that detected for air-fuel combustion (around
85 ppm), even though it should theoretically have been higher due to the lower volumetric flue
gas flow. In addition, the degree of sulfation assessed with the IACM™ was always much lower
than that obtained with the FTIR or obtained from the simulations. Certain differences between
air-fuel and oxy-fuel combustion could be important for the measurements, for example, the
temperature, which was considered during the evaluation. Another difference is the replacement
of nitrogen with carbon dioxide as the main flue gas component; at the time of the experiments,
the IACM™ had never been calibrated for high CO2 concentrations. CO2 has been reported to
absorb light at wavelengths in the range of 200–300 nm at temperatures >600°C [134]. This is
in the same range as that used in the IACM™, which could have influenced the result. On the
one hand, SO2 absorbs light at wavelengths between 290 nm and 310 nm, which is used by the
instrument to measure also the SO2 concentration. The IACM™, on the other hand, had never
been used to measure or had never been calibrated for such SO2 concentrations as high as those
found in the oxy-fuel cases in the present work. Due to these uncertainties, the IACM™ was
used only for KCl measurements during air-fuel combustion. It is, however, possible to use the
IACM™ also for oxy-fuel combustion, although some additional development work would be
required.
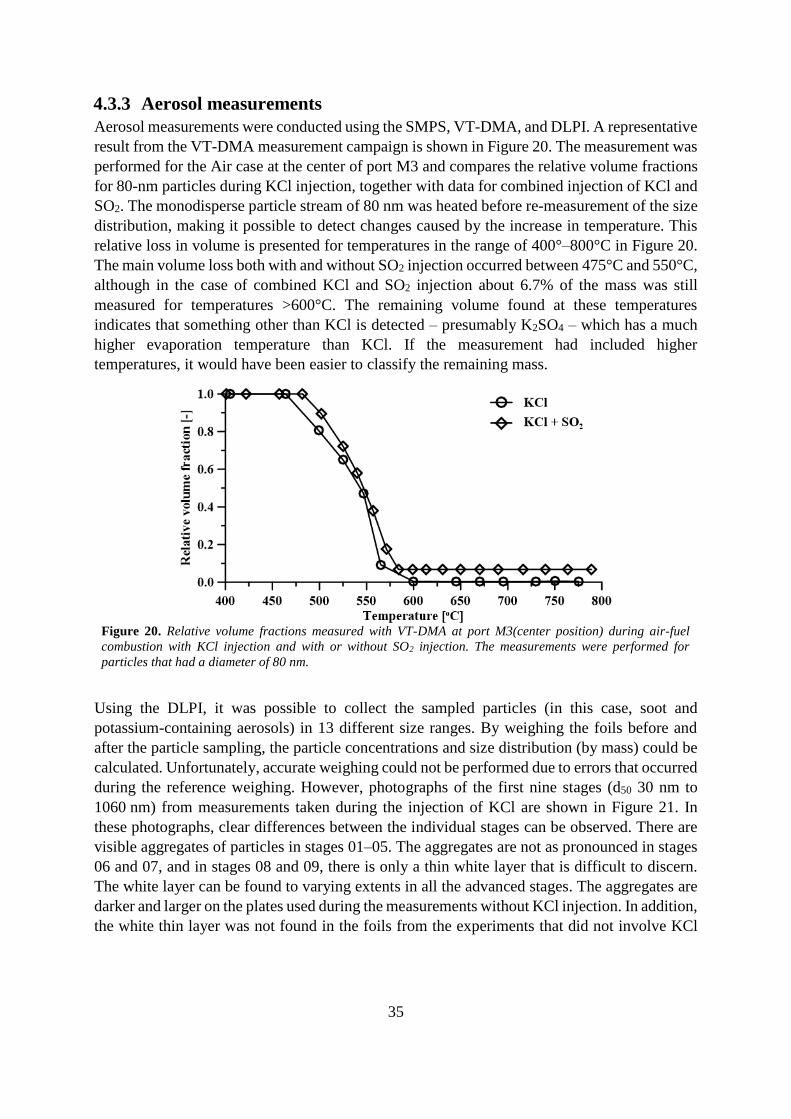
35
4.3.3 Aerosol measurements
Aerosol measurements were conducted using the SMPS, VT-DMA, and DLPI. A representative
result from the VT-DMA measurement campaign is shown in Figure 20. The measurement was
performed for the Air case at the center of port M3 and compares the relative volume fractions
for 80-nm particles during KCl injection, together with data for combined injection of KCl and
SO2. The monodisperse particle stream of 80 nm was heated before re-measurement of the size
distribution, making it possible to detect changes caused by the increase in temperature. This
relative loss in volume is presented for temperatures in the range of 400°–800°C in Figure 20.
The main volume loss both with and without SO2 injection occurred between 475°C and 550°C,
although in the case of combined KCl and SO2 injection about 6.7% of the mass was still
measured for temperatures >600°C. The remaining volume found at these temperatures
indicates that something other than KCl is detected – presumably K2SO4 – which has a much
higher evaporation temperature than KCl. If the measurement had included higher
temperatures, it would have been easier to classify the remaining mass.
Figure 20. Relative volume fractions measured with VT-DMA at port M3(center position) during air-fuel
combustion with KCl injection and with or without SO2 injection. The measurements were performed for
particles that had a diameter of 80 nm.
Using the DLPI, it was possible to collect the sampled particles (in this case, soot and
potassium-containing aerosols) in 13 different size ranges. By weighing the foils before and
after the particle sampling, the particle concentrations and size distribution (by mass) could be
calculated. Unfortunately, accurate weighing could not be performed due to errors that occurred
during the reference weighing. However, photographs of the first nine stages (d50 30 nm to
1060 nm) from measurements taken during the injection of KCl are shown in Figure 21. In
these photographs, clear differences between the individual stages can be observed. There are
visible aggregates of particles in stages 01–05. The aggregates are not as pronounced in stages
06 and 07, and in stages 08 and 09, there is only a thin white layer that is difficult to discern.
The white layer can be found to varying extents in all the advanced stages. The aggregates are
darker and larger on the plates used during the measurements without KCl injection. In addition,
the white thin layer was not found in the foils from the experiments that did not involve KCl
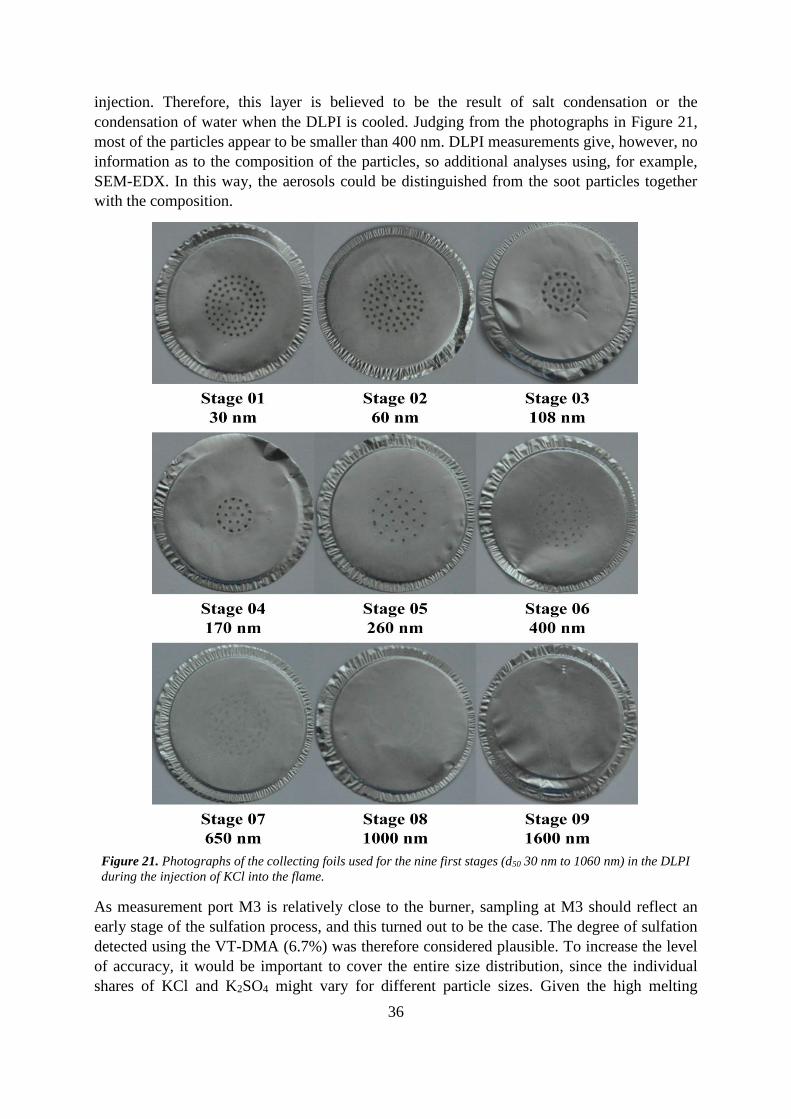
36
injection. Therefore, this layer is believed to be the result of salt condensation or the
condensation of water when the DLPI is cooled. Judging from the photographs in Figure 21,
most of the particles appear to be smaller than 400 nm. DLPI measurements give, however, no
information as to the composition of the particles, so additional analyses using, for example,
SEM-EDX. In this way, the aerosols could be distinguished from the soot particles together
with the composition.
Figure 21. Photographs of the collecting foils used for the nine first stages (d50 30 nm to 1060 nm) in the DLPI
during the injection of KCl into the flame.
As measurement port M3 is relatively close to the burner, sampling at M3 should reflect an
early stage of the sulfation process, and this turned out to be the case. The degree of sulfation
detected using the VT-DMA (6.7%) was therefore considered plausible. To increase the level
of accuracy, it would be important to cover the entire size distribution, since the individual
shares of KCl and K2SO4 might vary for different particle sizes. Given the high melting

37
temperature of sulfated potassium, it would be expected to condensate almost immediately after
formation. In contrast, one would expect the KCl to be found in the gas phase within the
combustion unit. Aerosols are formed first during the sampling, where homogenous nucleation
is favored, resulting in smaller particles. While tests were performed to include the whole size
distribution, no useful data were obtained from these measurements. Two parts of the setup
were considered to be problematic. First, the heating and cooling times of the oven used to heat-
treat the particles were long, making this a very time-consuming measurement, especially when
several size ranges were to be investigated separately. Second, instabilities in the sampling
system, including the dilution steps, resulted in too-large fluctuations over time, making it
impossible to draw any valid conclusions.
Due to the problems identified with our aerosol setup and the need for additional analysis using
the DLPI, this setup was abandoned in the present work. Furthermore, the FTIR and IACM™
system was found to be suitable for this work. We believe that it is not only possible to improve
the setup using these techniques (SMPS, VT-DMA and DLPI) to measure the degree of
sulfation, but it is also a requirement if measurements are to be performed for which the use of
FTIR and IACM™ is no longer considered valid, e.g., experiments involving the combustion
of solid fuels or when performing flame measurements for gaseous fuels, as in this work.

38
39
5 Modelling
Simulations have been performed in all the papers included in this thesis. Each paper has an
individual simulation set-up adapted for that specific investigation. The simulations can be
divided into two types: 1) combustion simulations, in which fuel oxidation is included; and 2)
flue gas simulations in which the oxidation of CO is included but there are no hydrocarbons
present. All the simulations were performed using a PFR model in the Chemkin software, into
which one of the three different mechanisms (Mechanisms A, B and C) used was implemented.
More information about the mechanism can be found in Section 5.1.
5.1 Reaction mechanisms As mentioned above, three different mechanisms are used in this work. The mechanisms
contain all the reactions and reaction properties that are used in the simulations. A mechanism
is divided into different subsets (groups of reactions). The development of these subsets is not
part of this work, as all of them have been taken from the literature. It is important to point out
that these subsets from the literature are used in combinations and with conditions for which
they may not have been validated. The mechanisms are used to capture trends and general
differences compared to the experimental data, and for this purpose, the mechanisms are
assumed to be sufficient. A short description of the different mechanisms used is presented here
and includes the different subsets used. The complete mechanisms with all their respective
reactions can be found in the Appendix.
5.1.1 Mechanism A
Mechanism A, which is used in Papers I, III and IV, is taken from the work of Hindiyarti et al.
[36], and it includes K, Cl, and S subsets, as well as a subset for CO/O/H reactions.
Mechanism A also includes the estimation of K2SO4 condensation listed by Li et al. [74]. The
mechanism presented by Hindiyarti et al. [36] uses a mechanism, earlier presented by Glarborg
and Marshall [94], as its basis. The earlier mechanism included both potassium and sodium,
while the latter was removed in this new mechanism for simplicity, based on the argument that
potassium and sodium are very similar in their reactions (as has been discussed also earlier in
this work). This is why it is possible to allow potassium to represent both alkali species.
However, Hindiyarti and coworkers added a number of elementary reactions, together with two
new potassium species, KHSO3 and KSO4. Previously presented thermodynamic data were
used when possible, otherwise they were estimated using the Gaussian 3 ab initio methods
described elsewhere [94, 135, 136]. The sulfur subset used in this mechanism was taken from
40
the literature [33, 137, 138], and it covers the relationship between SO2 and SO3, which is
important for the sulfation of alkali-metals. For validation of their complete mechanism,
Hindiyarti et al. used the results from the experimental studies of Iisa et al. [67], Jensen et al.
[65], and Jimenez and Balester [139, 140]. The mechanism was developed to describe the
sulfation of potassium in flue gases derived from combustion in air in the temperature range of
900°C–1300°C.
5.1.2 Mechanism B
This mechanism, which was employed in Paper II, was used to study the sulfation process,
including also the combustion of propane. All the subsets used in Mechanism A were also used
in Mechanism B, with the addition of three subsets that describe the oxidation of C1-, C2-, and
C3-hydrocarbons, respectively. The hydrocarbon oxidation subsets are based on the studies of
Glarborg et al. [141, 142], Alzueta et al. [143] and Abián et al. [144]. This combination of
subsets used in Mechanism B has not been validated, although the included subsets have been
validated individually in a previous work. Therefore, the present work evaluates the influences
of the C1–C3 subsets on the sulfation chemistry. An example from the evaluation is presented
in Figure 22. Figure 22a shows the mole fraction of K2SO4 at the outlet of an isothermal PFR,
calculated with and without the C1–C3 subsets. There is a noticeable difference at temperatures
<700°C, where sulfation is initiated at slightly lower temperatures. These temperatures are
lower than those that Ilisa et al. [67] applied in their work, a study which was used by Hindiyarti
et al. [36] for validation purposes. Figure 22, b and c show the formation of K2SO4 at 660°C
and 1000°C, respectively. For the lower temperature, the sulfation process is faster when the
hydrocarbon chemistry is included (although no hydrocarbons are present). At higher
temperatures, no difference is observed. The degree of sulfation and the equilibrium are not
affected by including the C1–C3 subsets. In summary, a small but noticeable effect can be
caused at temperatures <700°C by merging the two mechanisms, which is a phenomenon that
deserves closer attention. In this work, the merged mechanism is used to evaluate the
experimental study based on an 80-kW propane flame, which is obviously not an ideal setup
for validating the mechanism. However, the combination of modeling and experimental results
strongly indicates that the employed mechanism is appropriate for the purpose of this work.

41
Figure 22. Results from an isothermal PFR model that includes only the sulfation mechanism and the sulfation
mechanism together with the C1–C3 subsets. The PFR is fed with a gas flow with the following composition:
20% CO2, 20% CO, 12.5% O2, 400 ppm SO2, 100 ppm KCl, and N2 set by difference. a) Molar fractions of
K2SO4 at the outlet for temperatures in the range of 600°–1800°C, together with the relative differences between
the two mechanisms. b) and c) Molar fractions of K2SO4 throughout the reactor at temperatures of 660°C and
1000°C, respectively.
5.1.3 Mechanism C
Similar to Mechanism B, Mechanism C covers the oxidation of hydrocarbons (C1–C3), for
which the same subsets were used. In Mechanism B, these subsets were added to Mechanism A,
which was not the case here. Instead, a mechanism that included the oxidation of hydrocarbons,
as well as nitrogen and sulfur chemistry, was used. This mechanism has been used previously
to compare the results of bench-scale experiments and experiments performed in the same
combustion unit as that used in the present work [31, 109]. As mentioned, this mechanism has
the same subsets that describe the oxidation of C1–C3, although in this mechanism, the
CO/H/OH reactions are also taken from the studies of Glarborg et al. [141, 142] and Alzueta et
al. [143]. The subsets that describe the nitrogen chemistry and its interactions with
hydrocarbons are based on the works of Glarborg et al. [142, 145] and Dagaut et al. [146], and
the sulfur chemistry is based on the studies of Giménez-López et al. [32] and Alzueta et al.
[147]. The K and Cl subsets from Mechanism A were then added to the other subsets to create
Mechanism C.

42
Mechanism C was used in Paper V, in which the influences of KCl and SO2 on the NO
chemistry were investigated. Therefore, it was important to maintain the nitrogen chemistry as
accurately as possible when creating Mechanism C, which was the reason for adding the K and
Cl subsets to the mechanism previously used by Fleig et al. [31, 109], instead of adding the
nitrogen chemistry to Mechanism B. When comparing the different combinations of subsets it
emerged that the nitrogen was affected by the differences in the CO/OH/H reactions. This is
apparent in Figure 23, which shows the NO concentration profiles resulting from simulations
similar to FR-Ref (see Table 5), where KCl is not present but still the different mechanisms
behave differently. The concentration of NO is less than half that using Mechanism B+N
compared to the other two mechanisms. Mechanism C was therefore assumed to be the most
suitable mechanism for the purposes of Paper V.
Figure 23. NO concentration profiles of the simulated PFR. The simulation settings are the same in all three
cases and are also similar to the FR-Ref case (see Table 5), although the following three different mechanisms
have been used: 1) the mechanism previously used by Fleig et al. [31, 109] (Fleig); 2) the mechanism where
the nitrogen chemistry has been added to Mechanism B used in this work (Mechanism B+ N); and 3) Mechanism
C, as it is used in this work.
5.2 Sulfation simulations The sulfation of potassium chlorine is simulated in Paper I, II and III using two different
mechanisms (Mechanism A and B) with three different approaches. The flue gas simulations
are performed using Mechanism A. The work presented in Paper I includes an air-fired case
and two oxy-fuel cases both with 25 % oxygen, but applying wet and dry flue gas recirculation
denoted AirFG, OF25FG wet and OF25FG dry, respectively. For these cases the temperature
profile is linearly decreasing from 1600°C down to 500°C. In all three cases the same reactor
geometry is used causing differences in residence time, see Table 3. The inlet composition,
presented in Table 3, is based on complete combustion (stoichiometric-ratio equal to 1.2) of a
fuel mix with 90% coal and 10% biomass. It is assumed that all S, K and Cl are released to the
gas phase. For more details on how the inputs are derived, see Paper I.
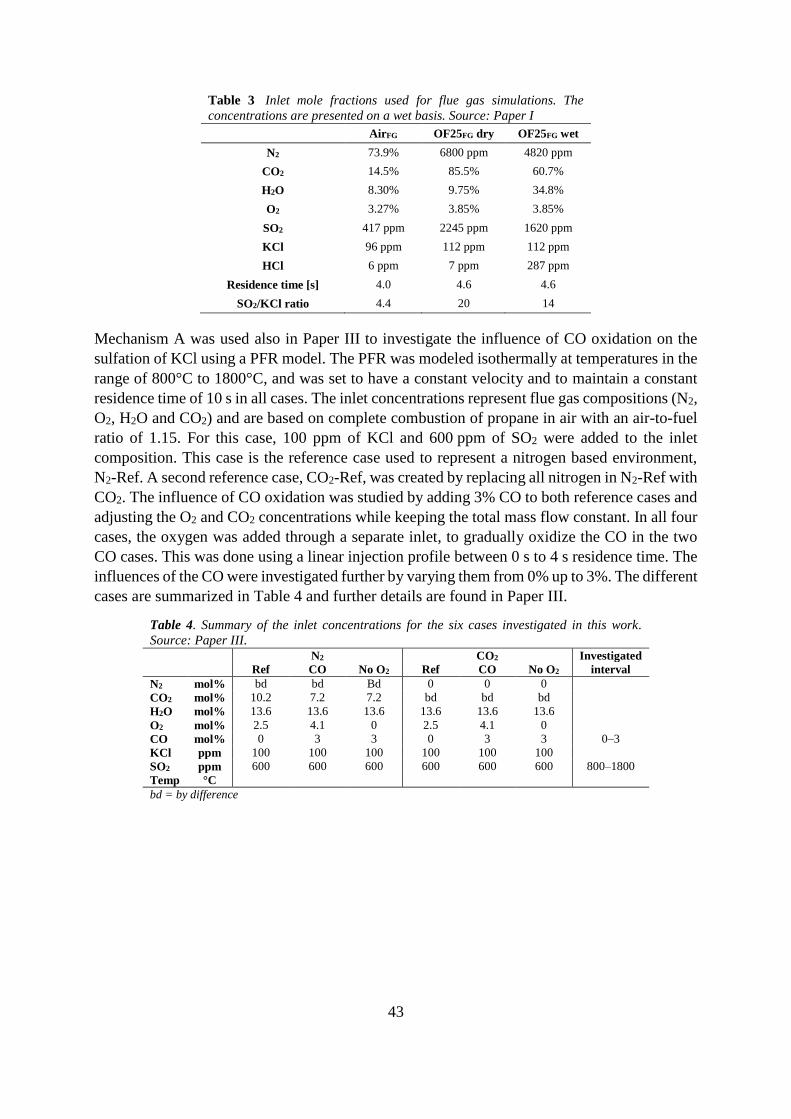
43
Table 3. Inlet mole fractions used for flue gas simulations. The
concentrations are presented on a wet basis. Source: Paper I
AirFG OF25FG dry OF25FG wet
N2 73.9% 6800 ppm 4820 ppm
CO2 14.5% 85.5% 60.7%
H2O 8.30% 9.75% 34.8%
O2 3.27% 3.85% 3.85%
SO2 417 ppm 2245 ppm 1620 ppm
KCl 96 ppm 112 ppm 112 ppm
HCl 6 ppm 7 ppm 287 ppm
Residence time [s] 4.0 4.6 4.6
SO2/KCl ratio 4.4 20 14
Mechanism A was used also in Paper III to investigate the influence of CO oxidation on the
sulfation of KCl using a PFR model. The PFR was modeled isothermally at temperatures in the
range of 800°C to 1800°C, and was set to have a constant velocity and to maintain a constant
residence time of 10 s in all cases. The inlet concentrations represent flue gas compositions (N2,
O2, H2O and CO2) and are based on complete combustion of propane in air with an air-to-fuel
ratio of 1.15. For this case, 100 ppm of KCl and 600 ppm of SO2 were added to the inlet
composition. This case is the reference case used to represent a nitrogen based environment,
N2-Ref. A second reference case, CO2-Ref, was created by replacing all nitrogen in N2-Ref with
CO2. The influence of CO oxidation was studied by adding 3% CO to both reference cases and
adjusting the O2 and CO2 concentrations while keeping the total mass flow constant. In all four
cases, the oxygen was added through a separate inlet, to gradually oxidize the CO in the two
CO cases. This was done using a linear injection profile between 0 s to 4 s residence time. The
influences of the CO were investigated further by varying them from 0% up to 3%. The different
cases are summarized in Table 4 and further details are found in Paper III.
Table 4. Summary of the inlet concentrations for the six cases investigated in this work.
Source: Paper III. N2 CO2 Investigated
Ref CO No O2 Ref CO No O2 interval
N2 mol% bd bd Bd 0 0 0
CO2 mol% 10.2 7.2 7.2 bd bd bd
H2O mol% 13.6 13.6 13.6 13.6 13.6 13.6
O2 mol% 2.5 4.1 0 2.5 4.1 0
CO mol% 0 3 3 0 3 3 0–3
KCl ppm 100 100 100 100 100 100
SO2 ppm 600 600 600 600 600 600 800–1800
Temp °C
bd = by difference
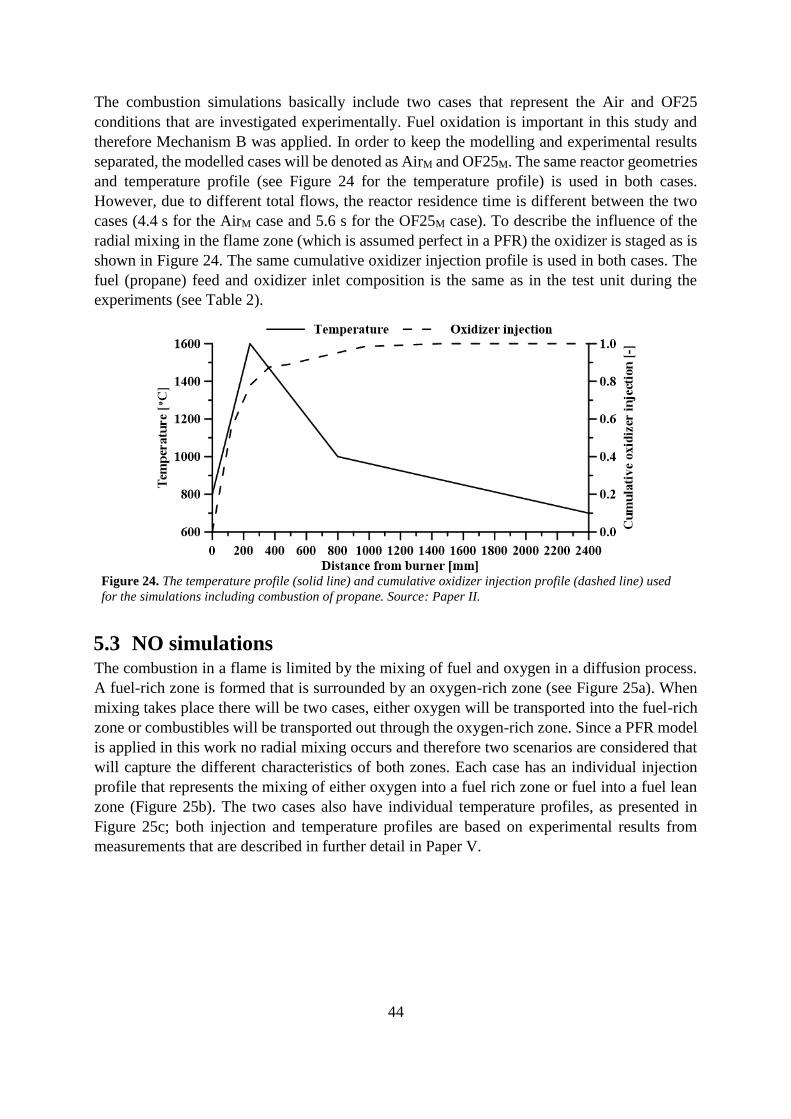
44
The combustion simulations basically include two cases that represent the Air and OF25
conditions that are investigated experimentally. Fuel oxidation is important in this study and
therefore Mechanism B was applied. In order to keep the modelling and experimental results
separated, the modelled cases will be denoted as AirM and OF25M. The same reactor geometries
and temperature profile (see Figure 24 for the temperature profile) is used in both cases.
However, due to different total flows, the reactor residence time is different between the two
cases (4.4 s for the AirM case and 5.6 s for the OF25M case). To describe the influence of the
radial mixing in the flame zone (which is assumed perfect in a PFR) the oxidizer is staged as is
shown in Figure 24. The same cumulative oxidizer injection profile is used in both cases. The
fuel (propane) feed and oxidizer inlet composition is the same as in the test unit during the
experiments (see Table 2).
Figure 24. The temperature profile (solid line) and cumulative oxidizer injection profile (dashed line) used
for the simulations including combustion of propane. Source: Paper II.
5.3 NO simulations The combustion in a flame is limited by the mixing of fuel and oxygen in a diffusion process.
A fuel-rich zone is formed that is surrounded by an oxygen-rich zone (see Figure 25a). When
mixing takes place there will be two cases, either oxygen will be transported into the fuel-rich
zone or combustibles will be transported out through the oxygen-rich zone. Since a PFR model
is applied in this work no radial mixing occurs and therefore two scenarios are considered that
will capture the different characteristics of both zones. Each case has an individual injection
profile that represents the mixing of either oxygen into a fuel rich zone or fuel into a fuel lean
zone (Figure 25b). The two cases also have individual temperature profiles, as presented in
Figure 25c; both injection and temperature profiles are based on experimental results from
measurements that are described in further detail in Paper V.
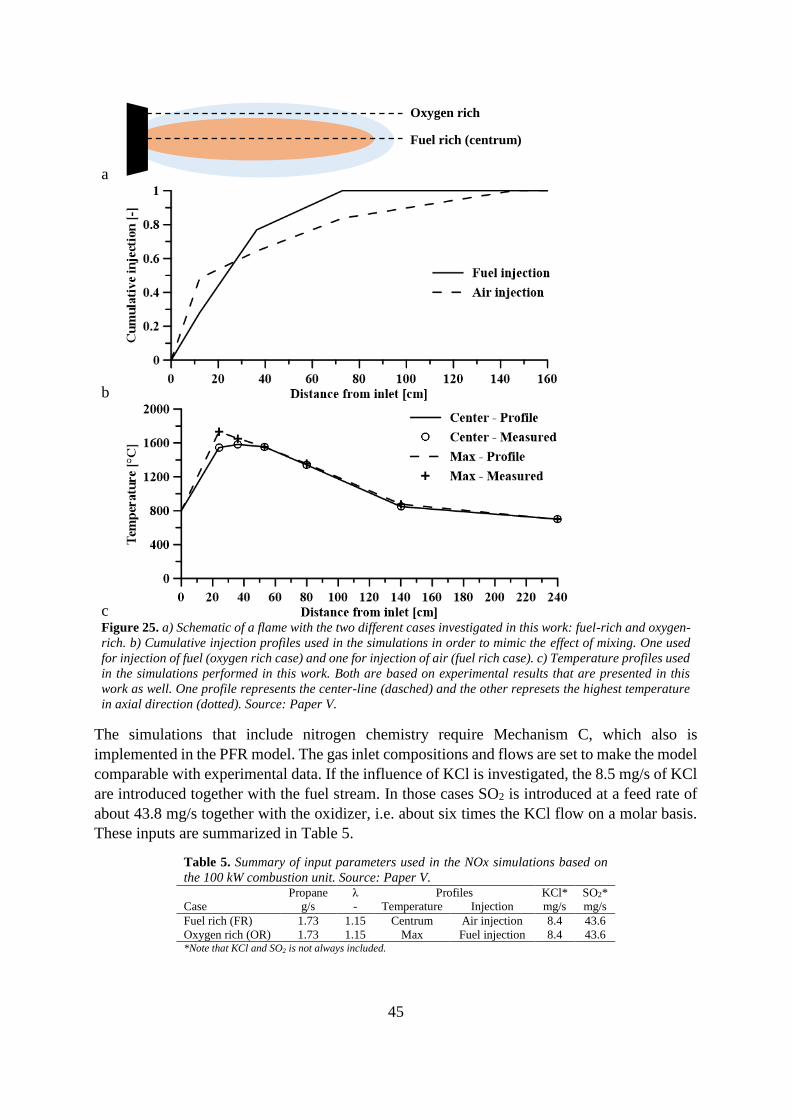
45
a
b
c Figure 25. a) Schematic of a flame with the two different cases investigated in this work: fuel-rich and oxygen-
rich. b) Cumulative injection profiles used in the simulations in order to mimic the effect of mixing. One used
for injection of fuel (oxygen rich case) and one for injection of air (fuel rich case). c) Temperature profiles used
in the simulations performed in this work. Both are based on experimental results that are presented in this
work as well. One profile represents the center-line (dasched) and the other represets the highest temperature
in axial direction (dotted). Source: Paper V.
The simulations that include nitrogen chemistry require Mechanism C, which also is
implemented in the PFR model. The gas inlet compositions and flows are set to make the model
comparable with experimental data. If the influence of KCl is investigated, the 8.5 mg/s of KCl
are introduced together with the fuel stream. In those cases SO2 is introduced at a feed rate of
about 43.8 mg/s together with the oxidizer, i.e. about six times the KCl flow on a molar basis.
These inputs are summarized in Table 5.
Table 5. Summary of input parameters used in the NOx simulations based on
the 100 kW combustion unit. Source: Paper V. Propane λ Profiles KCl* SO2*
Case g/s - Temperature Injection mg/s mg/s
Fuel rich (FR) 1.73 1.15 Centrum Air injection 8.4 43.6
Oxygen rich (OR) 1.73 1.15 Max Fuel injection 8.4 43.6 *Note that KCl and SO2 is not always included.
Oxygen rich
Fuel rich (centrum)
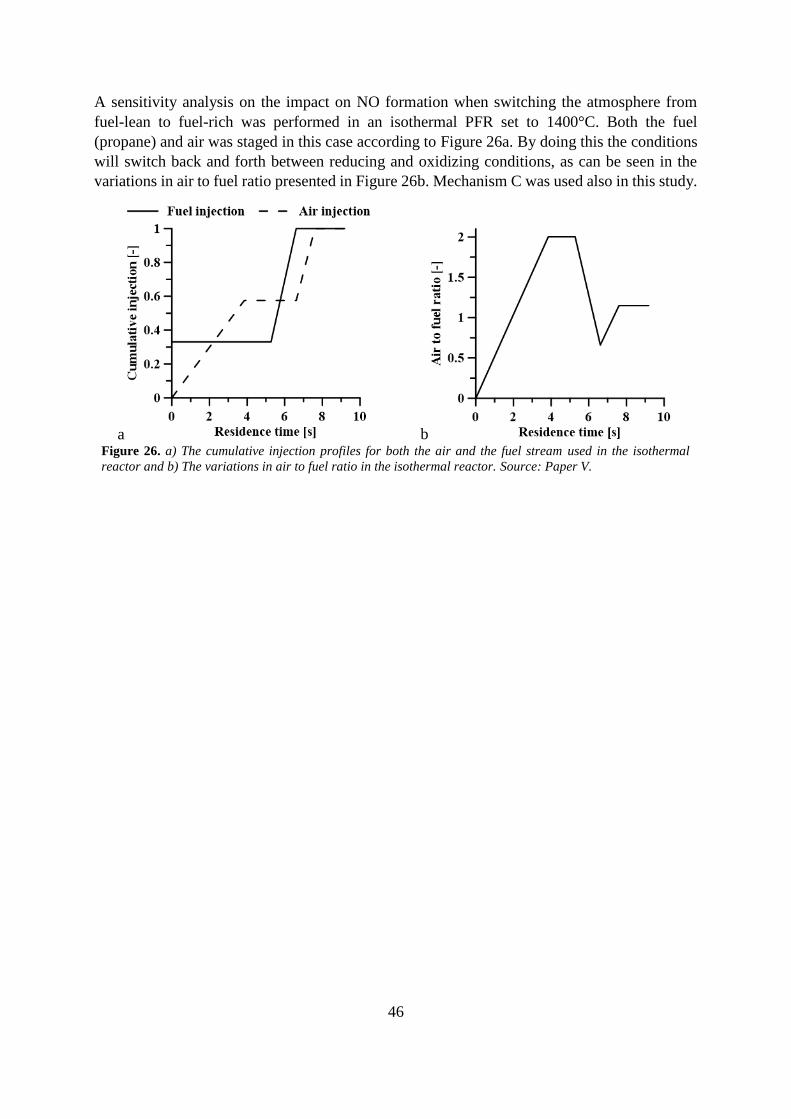
46
A sensitivity analysis on the impact on NO formation when switching the atmosphere from
fuel-lean to fuel-rich was performed in an isothermal PFR set to 1400°C. Both the fuel
(propane) and air was staged in this case according to Figure 26a. By doing this the conditions
will switch back and forth between reducing and oxidizing conditions, as can be seen in the
variations in air to fuel ratio presented in Figure 26b. Mechanism C was used also in this study.
a b Figure 26. a) The cumulative injection profiles for both the air and the fuel stream used in the isothermal
reactor and b) The variations in air to fuel ratio in the isothermal reactor. Source: Paper V.
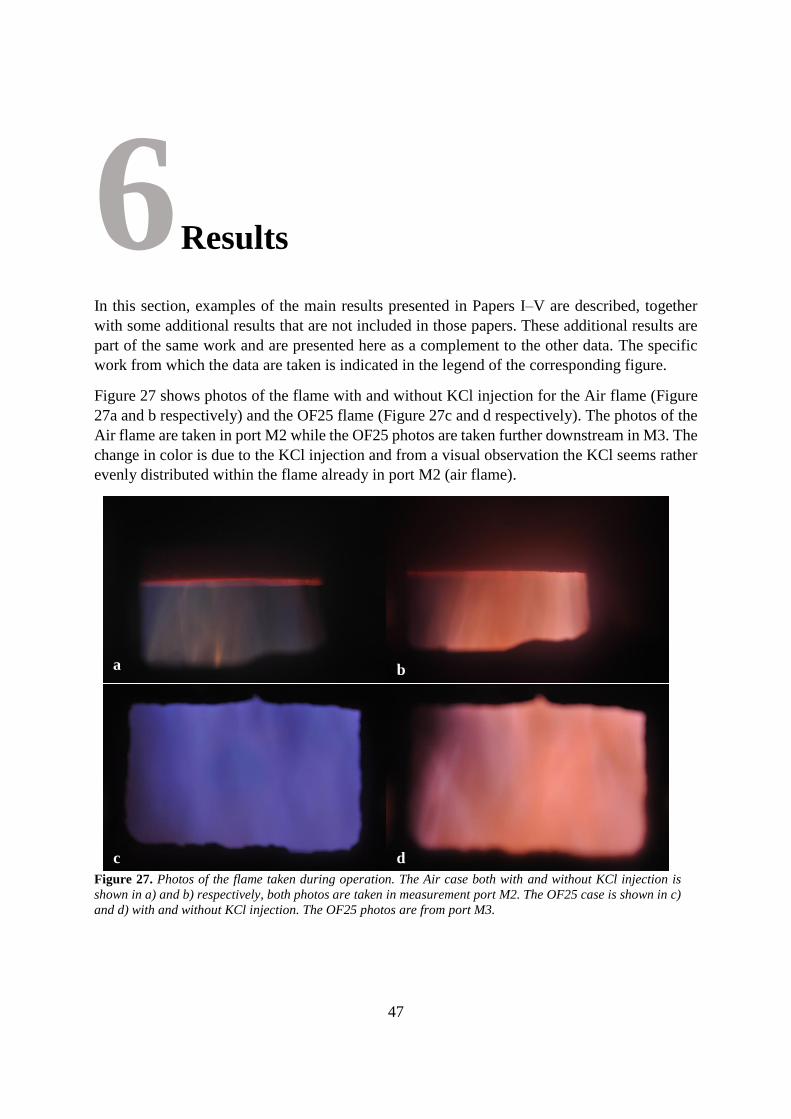
47
6 Results
In this section, examples of the main results presented in Papers I–V are described, together
with some additional results that are not included in those papers. These additional results are
part of the same work and are presented here as a complement to the other data. The specific
work from which the data are taken is indicated in the legend of the corresponding figure.
Figure 27 shows photos of the flame with and without KCl injection for the Air flame (Figure
27a and b respectively) and the OF25 flame (Figure 27c and d respectively). The photos of the
Air flame are taken in port M2 while the OF25 photos are taken further downstream in M3. The
change in color is due to the KCl injection and from a visual observation the KCl seems rather
evenly distributed within the flame already in port M2 (air flame).
Figure 27. Photos of the flame taken during operation. The Air case both with and without KCl injection is
shown in a) and b) respectively, both photos are taken in measurement port M2. The OF25 case is shown in c)
and d) with and without KCl injection. The OF25 photos are from port M3.
a b
c d
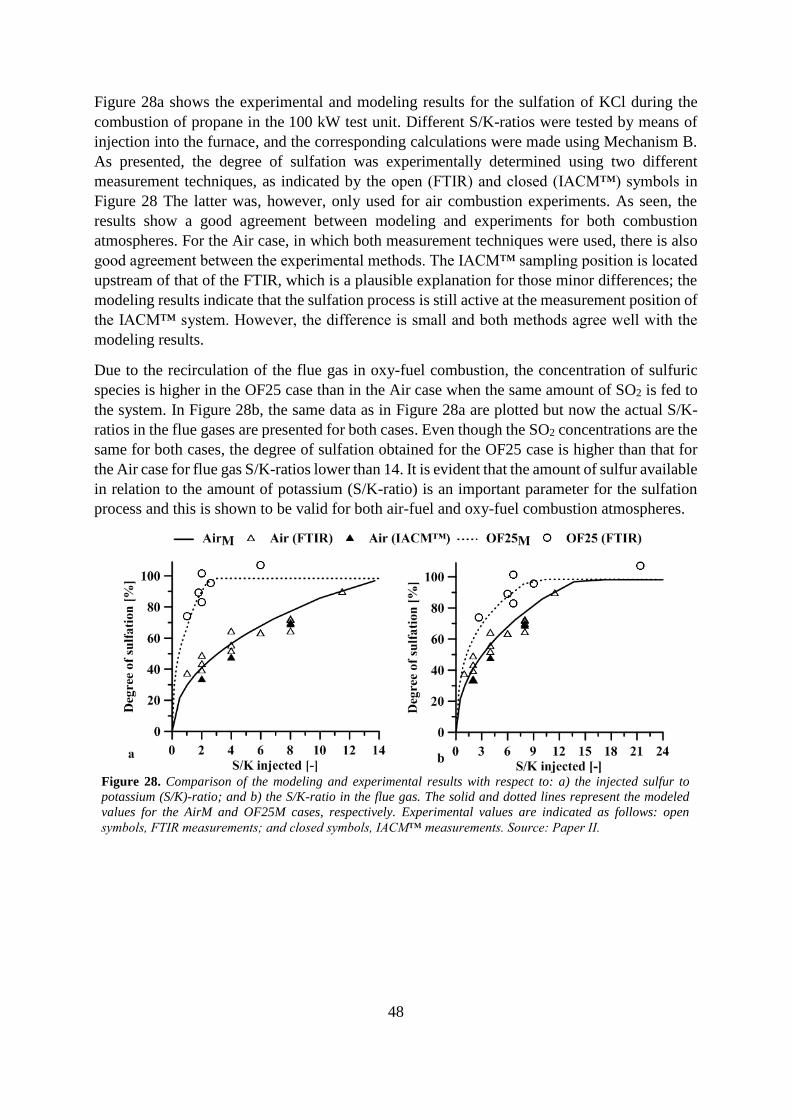
48
Figure 28a shows the experimental and modeling results for the sulfation of KCl during the
combustion of propane in the 100 kW test unit. Different S/K-ratios were tested by means of
injection into the furnace, and the corresponding calculations were made using Mechanism B.
As presented, the degree of sulfation was experimentally determined using two different
measurement techniques, as indicated by the open (FTIR) and closed (IACM™) symbols in
Figure 28 The latter was, however, only used for air combustion experiments. As seen, the
results show a good agreement between modeling and experiments for both combustion
atmospheres. For the Air case, in which both measurement techniques were used, there is also
good agreement between the experimental methods. The IACM™ sampling position is located
upstream of that of the FTIR, which is a plausible explanation for those minor differences; the
modeling results indicate that the sulfation process is still active at the measurement position of
the IACM™ system. However, the difference is small and both methods agree well with the
modeling results.
Due to the recirculation of the flue gas in oxy-fuel combustion, the concentration of sulfuric
species is higher in the OF25 case than in the Air case when the same amount of SO2 is fed to
the system. In Figure 28b, the same data as in Figure 28a are plotted but now the actual S/K-
ratios in the flue gases are presented for both cases. Even though the SO2 concentrations are the
same for both cases, the degree of sulfation obtained for the OF25 case is higher than that for
the Air case for flue gas S/K-ratios lower than 14. It is evident that the amount of sulfur available
in relation to the amount of potassium (S/K-ratio) is an important parameter for the sulfation
process and this is shown to be valid for both air-fuel and oxy-fuel combustion atmospheres.
Figure 28. Comparison of the modeling and experimental results with respect to: a) the injected sulfur to
potassium (S/K)-ratio; and b) the S/K-ratio in the flue gas. The solid and dotted lines represent the modeled
values for the AirM and OF25M cases, respectively. Experimental values are indicated as follows: open
symbols, FTIR measurements; and closed symbols, IACM™ measurements. Source: Paper II.
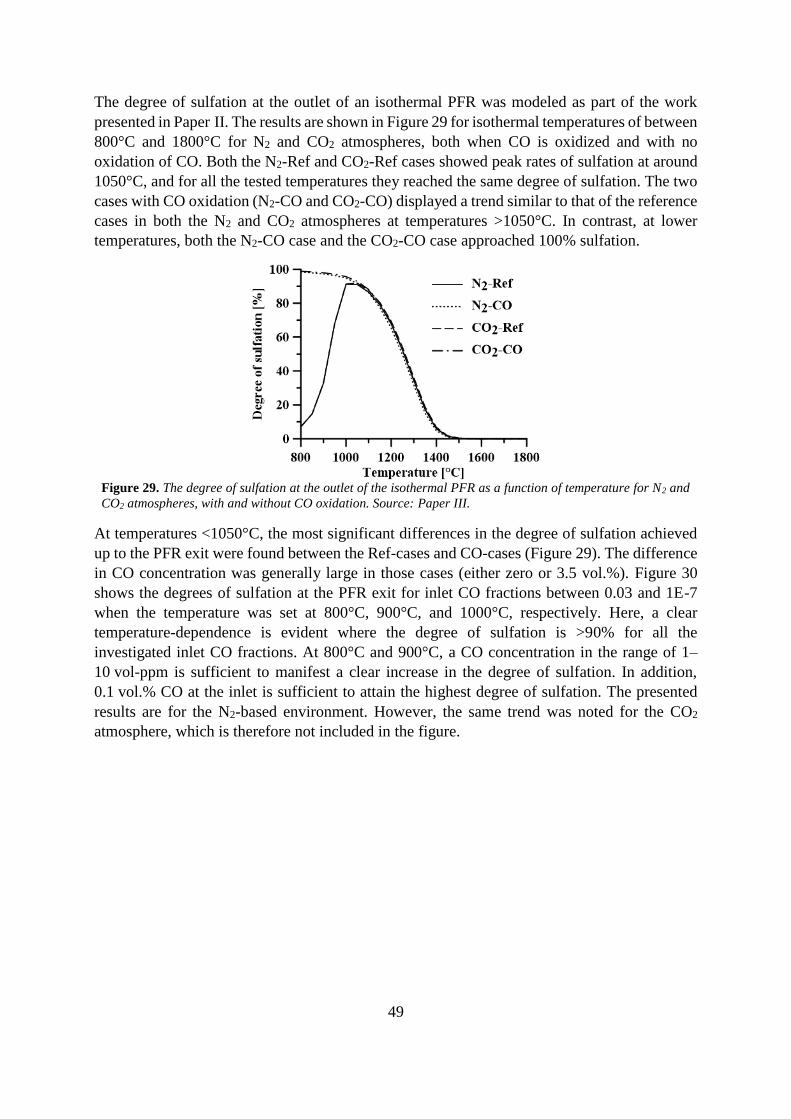
49
The degree of sulfation at the outlet of an isothermal PFR was modeled as part of the work
presented in Paper II. The results are shown in Figure 29 for isothermal temperatures of between
800°C and 1800°C for N2 and CO2 atmospheres, both when CO is oxidized and with no
oxidation of CO. Both the N2-Ref and CO2-Ref cases showed peak rates of sulfation at around
1050°C, and for all the tested temperatures they reached the same degree of sulfation. The two
cases with CO oxidation (N2-CO and CO2-CO) displayed a trend similar to that of the reference
cases in both the N2 and CO2 atmospheres at temperatures >1050°C. In contrast, at lower
temperatures, both the N2-CO case and the CO2-CO case approached 100% sulfation.
Figure 29. The degree of sulfation at the outlet of the isothermal PFR as a function of temperature for N2 and
CO2 atmospheres, with and without CO oxidation. Source: Paper III.
At temperatures <1050°C, the most significant differences in the degree of sulfation achieved
up to the PFR exit were found between the Ref-cases and CO-cases (Figure 29). The difference
in CO concentration was generally large in those cases (either zero or 3.5 vol.%). Figure 30
shows the degrees of sulfation at the PFR exit for inlet CO fractions between 0.03 and 1E-7
when the temperature was set at 800°C, 900°C, and 1000°C, respectively. Here, a clear
temperature-dependence is evident where the degree of sulfation is >90% for all the
investigated inlet CO fractions. At 800°C and 900°C, a CO concentration in the range of 1–
10 vol-ppm is sufficient to manifest a clear increase in the degree of sulfation. In addition,
0.1 vol.% CO at the inlet is sufficient to attain the highest degree of sulfation. The presented
results are for the N2-based environment. However, the same trend was noted for the CO2
atmosphere, which is therefore not included in the figure.
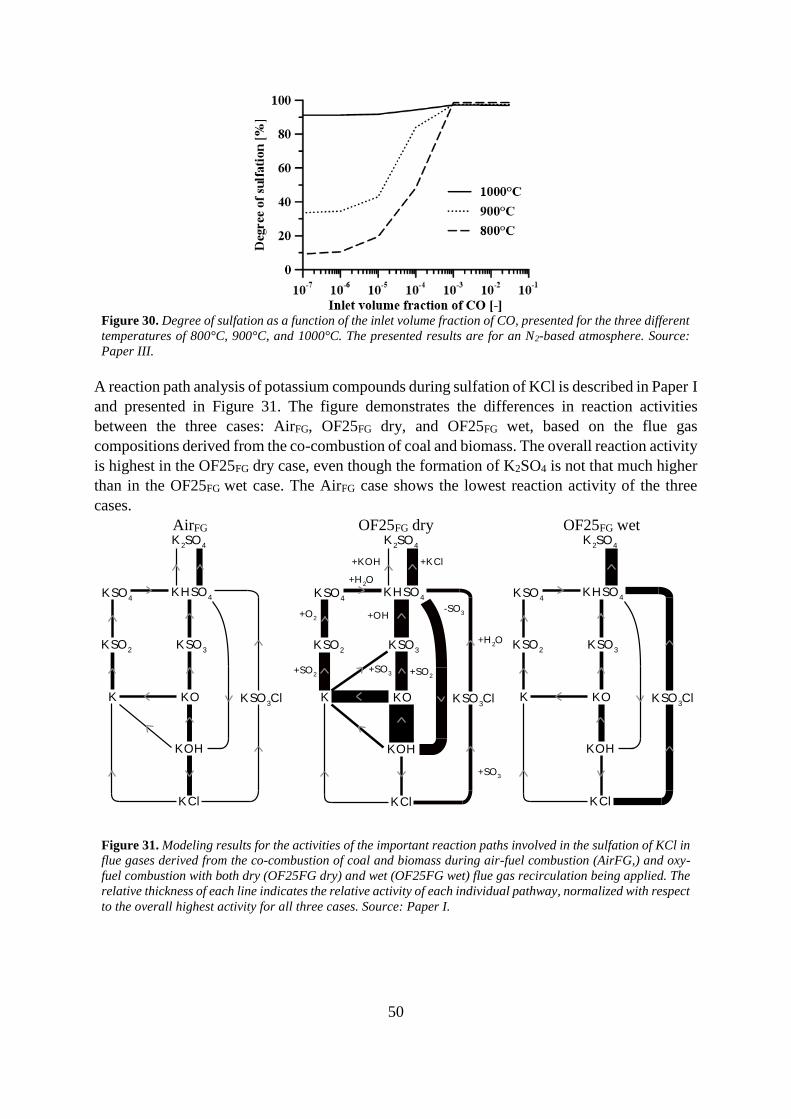
50
Figure 30. Degree of sulfation as a function of the inlet volume fraction of CO, presented for the three different
temperatures of 800°C, 900°C, and 1000°C. The presented results are for an N2-based atmosphere. Source:
Paper III.
A reaction path analysis of potassium compounds during sulfation of KCl is described in Paper I
and presented in Figure 31. The figure demonstrates the differences in reaction activities
between the three cases: AirFG, OF25FG dry, and OF25FG wet, based on the flue gas
compositions derived from the co-combustion of coal and biomass. The overall reaction activity
is highest in the OF25FG dry case, even though the formation of K2SO4 is not that much higher
than in the OF25FG wet case. The AirFG case shows the lowest reaction activity of the three
cases.
AirFG OF25FG dry OF25FG wet
Figure 31. Modeling results for the activities of the important reaction paths involved in the sulfation of KCl in
flue gases derived from the co-combustion of coal and biomass during air-fuel combustion (AirFG,) and oxy-
fuel combustion with both dry (OF25FG dry) and wet (OF25FG wet) flue gas recirculation being applied. The
relative thickness of each line indicates the relative activity of each individual pathway, normalized with respect
to the overall highest activity for all three cases. Source: Paper I.
K2SO
4
KSO4
KHSO4
KSO2
KSO3
K KO KSO3Cl
KOH
KCl
K2SO
4
KSO4
KHSO4
KSO2
KSO3
K KO KSO3Cl
KOH
KCl
+KCl+KOH
+OH
+H2O
-SO3+O
2
+SO2 +SO
2
+SO3
+H2O
+SO3
K2SO
4
KSO4
KHSO4
KSO2
KSO3
K KO KSO3Cl
KOH
KCl

51
As indicated in the reaction path analysis (Figure 31), some of the reactions in the sulfation
process involve SO2, while others are based on SO3. The relative importance of these two
components varies depending on the flue gas composition, as shown in Figure 32. More than
50% of the K2SO4 formed in the OF25FG wet case can be attributed to reactions that involve
SO3. This is almost three-times the amount formed via SO3 in the AirFG and OF25FG dry cases.
However, the fraction of SO3 is largest throughout the entire reactor in the OF25FG dry case, as
compared to both the AirFG and OF25FG wet cases (Figure 33). The peak fractions for both oxy-
fuel cases are larger than the fraction found in the air-derived flue gases, almost 10-fold and 6-
fold larger, respectively. In contrast, all the SO3 is consumed in both the AirFG and OF25FG wet
cases, whereas the exit fraction is almost 20 ppm in the OF25FG dry case.
Figure 32. Percentages of the total amount of
K2SO4 formed via reactions that included SO3 for all
cases. Source: Paper I.
Figure 33. Variations in the SO3 concentration
throughout the reactor for all three flue gas cases
investigated. Source: Paper I.
The SO3 concentration was measured at M8 as part of the same measurement campaign as that
in Paper II. The concentration was measured for different S/K-ratios when both KCl and SO2
were injected (Figure 34). For an S/K ratio <7, the SO3 concentration is around 10 ppm, and for
higher S/K ratios, the SO3 is clearly increasing; the same pattern is seen for both the Air and
OF25 cases. According to the model, a noticeable SO3 concentration is first detected after the
S/K ratio exceeds 8 and 14 for the OF25M and AirM cases, respectively.
Figure 34. Measured SO3 concentrations at M8 for the Air and OF25 cases (symbols). All the concentrations
were measured when both SO2 and KCl were injected. The exit concentrations of SO3 from the modeled Air (M)
and OF25 (M) cases are also included (lines).

52
We compared the degrees of sulfation when equilibrium was reached at various temperatures
in a CO2-rich atmosphere (Figure 35a) and in a modified CO2-rich case with higher sulfur and
HCl contents (Figure 35b). The N2 and CO2/H2O cases were also investigated but are not
shown, since the results were similar to those of the CO2-rich case. The equilibrium favors
complete sulfation at temperatures lower than 900°C, where the reaction instead is kinetically
limited. The reaction rate is sufficiently high for sulfation to take place with a residence time
of 4 s; the sulfation activity is initiated within a temperature window of 800°–1300°C (the case
in Figure 35a). When the sulfur and chlorine concentrations increase, the sulfation rate
decreases and the maximum reaction rate is shifted towards lower temperatures, with a
temperature reduction of about 200°C. The equilibrium-driven sulfation is also shifted towards
lower temperatures, as is clear from a comparison of the data in Figure 35a and Figure 35b.
Figure 35. a) Degree of sulfation when equilibrium is reached for temperatures between 200°C and 1800°C in
a CO2 atmosphere. The reaction rate is shown for the same temperature interval. b) The same as in a) but for
a CO2 case with an S/K-ratio and Cl/K-ratio of 10. The reaction rates shown are normalized with respect to the
maximum reaction rate in the case without HCl (Figure 35a).
Figure 36 gives the measured CO concentrations along the furnace centerline at different levels
in the furnace, as measured in the work of Paper IV. Figure 36a shows the results from air-fuel
combustion with different additives injected via the burner or via the oxidant, as described
previously. No significant changes in the CO concentration are seen for any of the injected
additives. The CO concentration declines with increasing distance from the burner until the
oxidation is almost complete at a burner distance of 800 mm. The concentrations measured
close to the burner (215 mm) suggest the presence of a slightly lower concentration of CO when
the KCl is injected.
Figure 36b shows that the measured CO concentration in general is higher in oxy-fuel
combustion than in air-fuel combustion. The figure also indicates that CO oxidation is
completed more rapidly. In addition, during oxy-fuel operation, the effect on CO oxidation
when KCl is injected is more significant. As shown, all the cases without KCl injection exhibit
a higher concentration than those cases that include KCl, at every position from the burner inlet
up to a distance of 800 mm when oxidation is complete. The effect on the measured CO
concentration is substantial in the case in which the amount of injected KCl is doubled.
However, despite this demonstrated effect of KCl injection on the in-flame CO concentration,
the total time for CO oxidation remains in principle the same with and without KCl injection.

53
a b Figure 36. CO concentrations for five Air cases (a) and six OF25 cases (b) with and without injection of KCl,
SO2 and water. The cases are defined as follows; Ref, reference case (no injection), W – injection of pure water,
K – injection of KCl, S – injection of SO2, KS- injection of both KCl and SO2 and 2K – double amount of KCl
injected. Source: Paper IV.
The influences of KCl and SO2 on the formation of NO during the combustion of propane in
air was investigated in Paper V using two different mixing approaches. One approach
represented the fuel-rich part of a flame (FR-cases) and the other represented the oxygen-rich
(fuel-lean) region (OR-cases). The results of both approaches are presented in Figure 37, where
the OR-cases show much higher NO formation than the FR-cases, as anticipated. Four variants
of the FR-cases and OR-cases were modeled, in which KCl and SO2 were included in the
simulations, either separately or together. The results (Figure 37) show that while there are
individual variations among the FR-cases and OR-cases, the OR-cases always have a
concentration of NO >200 ppm at the outlet, as compared to the highest outlet concentration of
10 ppm among the FR-cases. Figure 37 includes the NO concentrations (70–110 ppm)
measured at the exit of the 100-kW unit for the same four cases with and without KCl and SO2.
These are the average values taken from the continuous measurement made at the flue gas exit.
Figure 37. Simulated NO concentration profiles using the two different mixing approaches (FR and OR). Shown
are the results from all eight cases, as well as the experimentally measured concentrations at the outlet of the
100-kW unit. Source: Paper V.
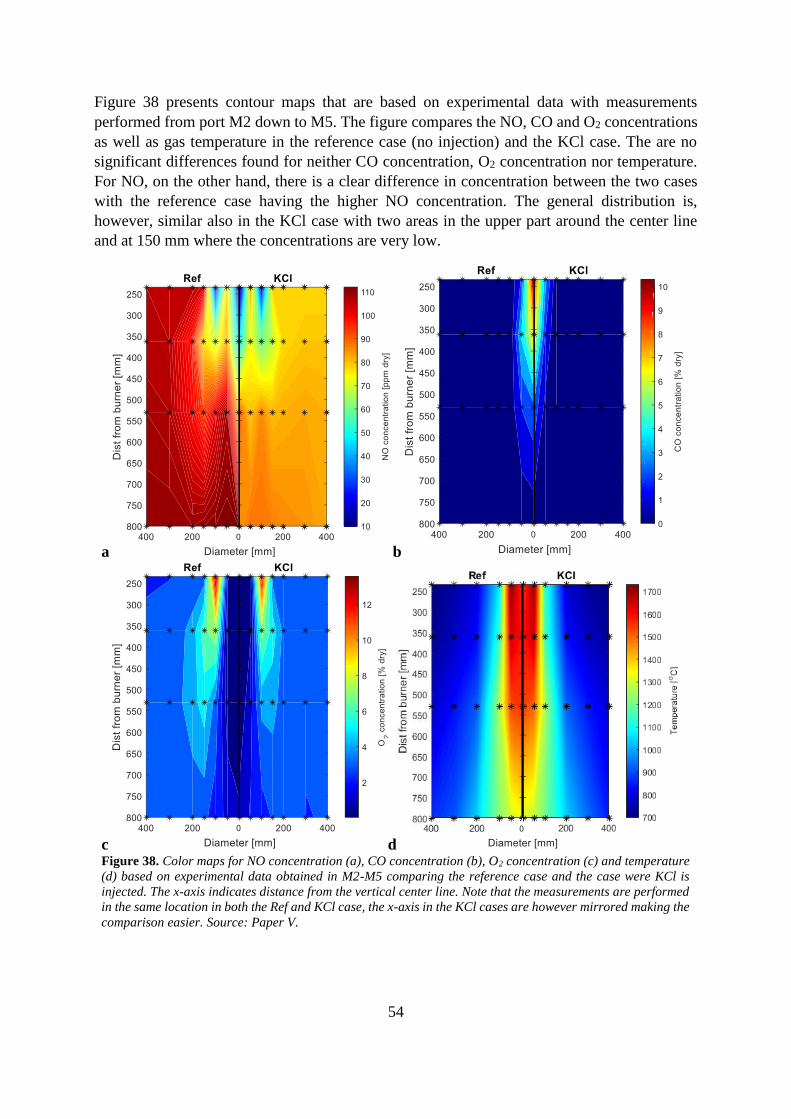
54
Figure 38 presents contour maps that are based on experimental data with measurements
performed from port M2 down to M5. The figure compares the NO, CO and O2 concentrations
as well as gas temperature in the reference case (no injection) and the KCl case. The are no
significant differences found for neither CO concentration, O2 concentration nor temperature.
For NO, on the other hand, there is a clear difference in concentration between the two cases
with the reference case having the higher NO concentration. The general distribution is,
however, similar also in the KCl case with two areas in the upper part around the center line
and at 150 mm where the concentrations are very low.
a b
c d Figure 38. Color maps for NO concentration (a), CO concentration (b), O2 concentration (c) and temperature
(d) based on experimental data obtained in M2-M5 comparing the reference case and the case were KCl is
injected. The x-axis indicates distance from the vertical center line. Note that the measurements are performed
in the same location in both the Ref and KCl case, the x-axis in the KCl cases are however mirrored making the
comparison easier. Source: Paper V.
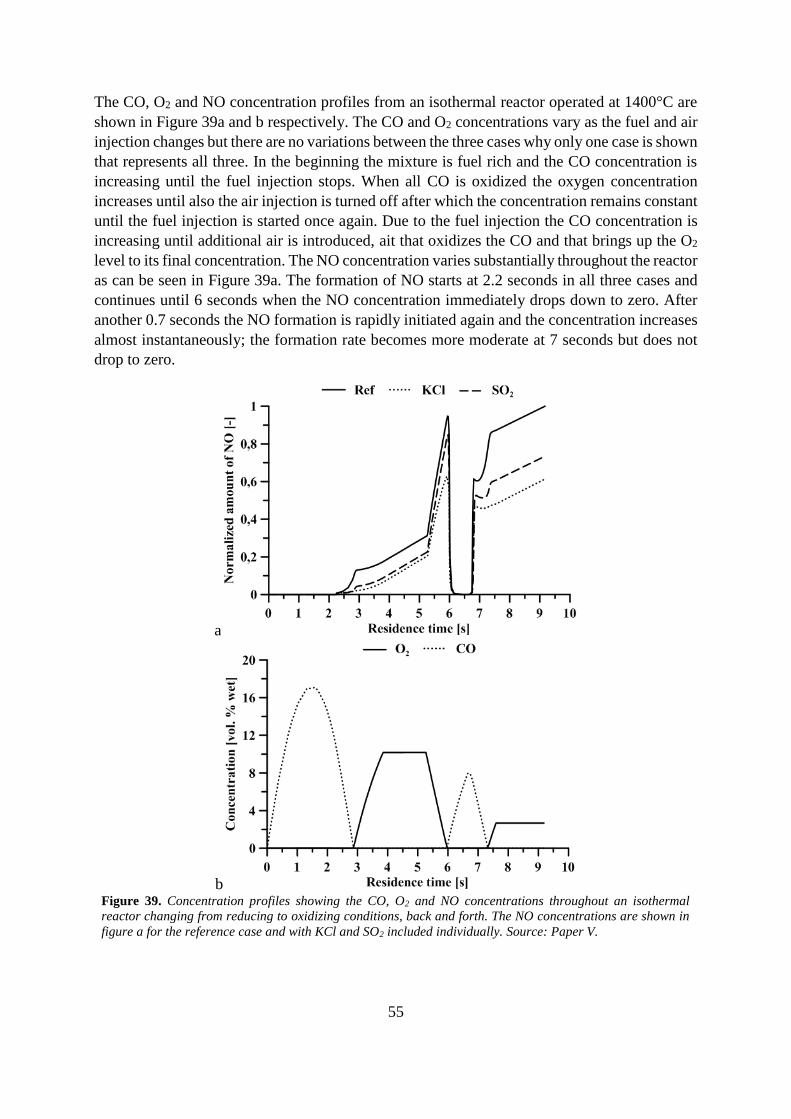
55
The CO, O2 and NO concentration profiles from an isothermal reactor operated at 1400°C are
shown in Figure 39a and b respectively. The CO and O2 concentrations vary as the fuel and air
injection changes but there are no variations between the three cases why only one case is shown
that represents all three. In the beginning the mixture is fuel rich and the CO concentration is
increasing until the fuel injection stops. When all CO is oxidized the oxygen concentration
increases until also the air injection is turned off after which the concentration remains constant
until the fuel injection is started once again. Due to the fuel injection the CO concentration is
increasing until additional air is introduced, ait that oxidizes the CO and that brings up the O2
level to its final concentration. The NO concentration varies substantially throughout the reactor
as can be seen in Figure 39a. The formation of NO starts at 2.2 seconds in all three cases and
continues until 6 seconds when the NO concentration immediately drops down to zero. After
another 0.7 seconds the NO formation is rapidly initiated again and the concentration increases
almost instantaneously; the formation rate becomes more moderate at 7 seconds but does not
drop to zero.
a
b Figure 39. Concentration profiles showing the CO, O2 and NO concentrations throughout an isothermal
reactor changing from reducing to oxidizing conditions, back and forth. The NO concentrations are shown in
figure a for the reference case and with KCl and SO2 included individually. Source: Paper V.

56
57
7 Discussion
The sulfur content is important for the efficiency of the sulfation process which is clearly shown
in this work; it was found that the S/K ratio in the flue gases needs to be significantly higher
than one to reach complete sulfation (i.e. when all K has reacted with S). In an actual process
this could be a limiting factor independent of practical conditions. That is, whether or not the
KCl problems are to be mitigated by means of introducing a second fuel or a sulfur-based
additive. In the example presented in Paper I, a 55 % degree of sulfation is reached during co-
combustion of coal and biomass (90/10) and this results in a S/K ratio of 4.4. Now, 55 % is of
course a noticeable level of sulfation but a higher degree of sulfation and/or a higher share of
biomass can certainly be beneficial from both an economical and environmental perspective.
The results from Paper I and Paper II, the latter also presented in Figure 28, show that this can
be achieved if oxy-fuel combustion is applied. According to Figure 28a only one fifth of the
sulfur is required in the OF 25 case compared to Air-fired conditions to reach complete
sulfation. It is important to note that only homogenous gas phase reactions are considered in
this work. In a commercial process, where solid fuels are combusted, the sulfation will be
affected also by the overall fuel composition which will affect the availability of K and S in the
gas phase. Solid fuel experiments need to be performed in order to examine if these effects will
increase or reduce the benefit of applying flue gas recirculation, as found in this work.
As already mentioned, sulfur has a major influence on the sulfation of KCl. There are, however,
other parameters that cause the higher degree of sulfation found in the OF25 case compared to
the Air case as can be seen in Figure 28b. In the sensitivity analysis performed in Paper II both
residence time and oxygen concentration was found to influence the sulfation even though
neither of them could explain the difference found between OF25 and Air, i.e. effects not
already caused by an increased sulfur concentration. The increased CO2 concentration was, on
the other hand, found to be capable to cause the difference. The increase in CO2 concentration
in oxy-combustion will influence the CO chemistry which could have an important influence
on the sulfation of KCl. If the CO is oxidized at temperatures lower than 1100°C, the degree of
sulfation could approach 100 % instead of zero as the temperature is descending (Figure 29).
Oxidation of a few ppm of CO is sufficient for temperatures below 900°C to see an increase in
the degree of sulfation and the most pronounced effect observed is reached just before 0.1 vol.%
of CO (Figure 30). In the work presented in Paper III it was also shown that for temperatures
higher than 1050°C, for which no effect of CO oxidation was found after 10 seconds in
residence time, the oxidation of CO still made the sulfation faster. This could be important in a
real process where the residence time at certain temperatures can be a limiting factor. It would
be desirable to perform lab scale experiments to verify this effect that, so far, only is based on
the simulation work presented in Paper III.
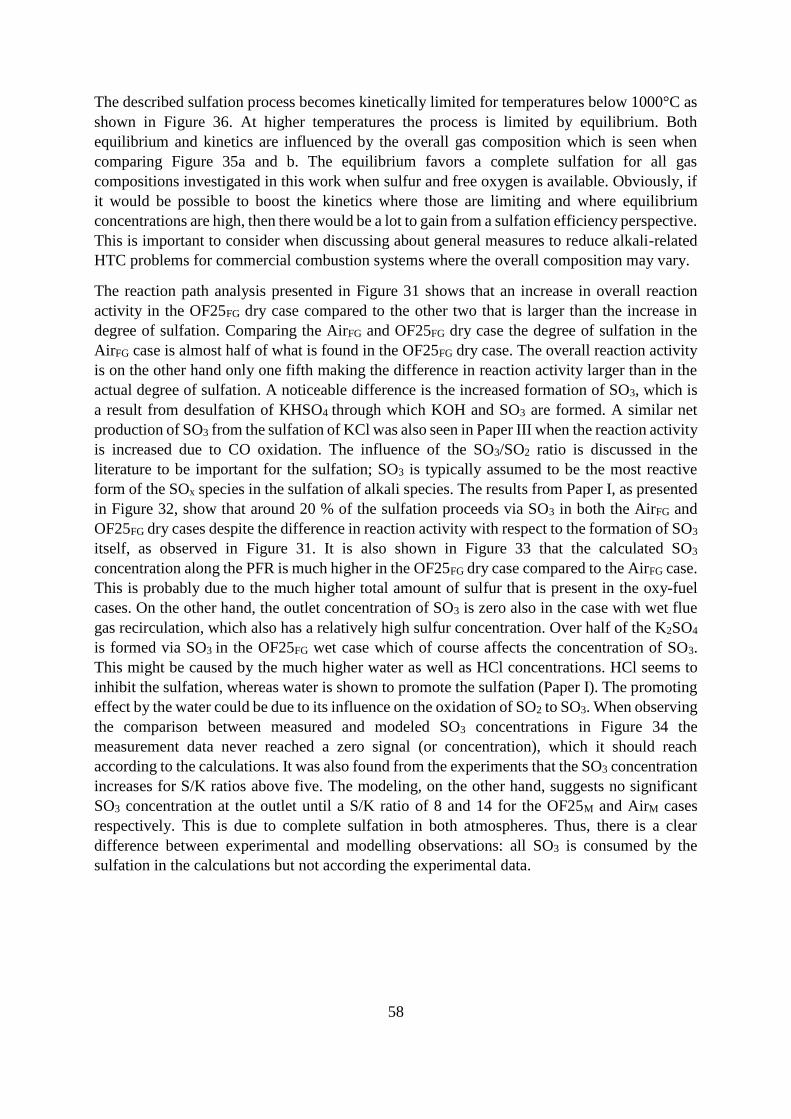
58
The described sulfation process becomes kinetically limited for temperatures below 1000°C as
shown in Figure 36. At higher temperatures the process is limited by equilibrium. Both
equilibrium and kinetics are influenced by the overall gas composition which is seen when
comparing Figure 35a and b. The equilibrium favors a complete sulfation for all gas
compositions investigated in this work when sulfur and free oxygen is available. Obviously, if
it would be possible to boost the kinetics where those are limiting and where equilibrium
concentrations are high, then there would be a lot to gain from a sulfation efficiency perspective.
This is important to consider when discussing about general measures to reduce alkali-related
HTC problems for commercial combustion systems where the overall composition may vary.
The reaction path analysis presented in Figure 31 shows that an increase in overall reaction
activity in the OF25FG dry case compared to the other two that is larger than the increase in
degree of sulfation. Comparing the AirFG and OF25FG dry case the degree of sulfation in the
AirFG case is almost half of what is found in the OF25FG dry case. The overall reaction activity
is on the other hand only one fifth making the difference in reaction activity larger than in the
actual degree of sulfation. A noticeable difference is the increased formation of SO3, which is
a result from desulfation of KHSO4 through which KOH and SO3 are formed. A similar net
production of SO3 from the sulfation of KCl was also seen in Paper III when the reaction activity
is increased due to CO oxidation. The influence of the SO3/SO2 ratio is discussed in the
literature to be important for the sulfation; SO3 is typically assumed to be the most reactive
form of the SOx species in the sulfation of alkali species. The results from Paper I, as presented
in Figure 32, show that around 20 % of the sulfation proceeds via SO3 in both the AirFG and
OF25FG dry cases despite the difference in reaction activity with respect to the formation of SO3
itself, as observed in Figure 31. It is also shown in Figure 33 that the calculated SO3
concentration along the PFR is much higher in the OF25FG dry case compared to the AirFG case.
This is probably due to the much higher total amount of sulfur that is present in the oxy-fuel
cases. On the other hand, the outlet concentration of SO3 is zero also in the case with wet flue
gas recirculation, which also has a relatively high sulfur concentration. Over half of the K2SO4
is formed via SO3 in the OF25FG wet case which of course affects the concentration of SO3.
This might be caused by the much higher water as well as HCl concentrations. HCl seems to
inhibit the sulfation, whereas water is shown to promote the sulfation (Paper I). The promoting
effect by the water could be due to its influence on the oxidation of SO2 to SO3. When observing
the comparison between measured and modeled SO3 concentrations in Figure 34 the
measurement data never reached a zero signal (or concentration), which it should reach
according to the calculations. It was also found from the experiments that the SO3 concentration
increases for S/K ratios above five. The modeling, on the other hand, suggests no significant
SO3 concentration at the outlet until a S/K ratio of 8 and 14 for the OF25M and AirM cases
respectively. This is due to complete sulfation in both atmospheres. Thus, there is a clear
difference between experimental and modelling observations: all SO3 is consumed by the
sulfation in the calculations but not according the experimental data.
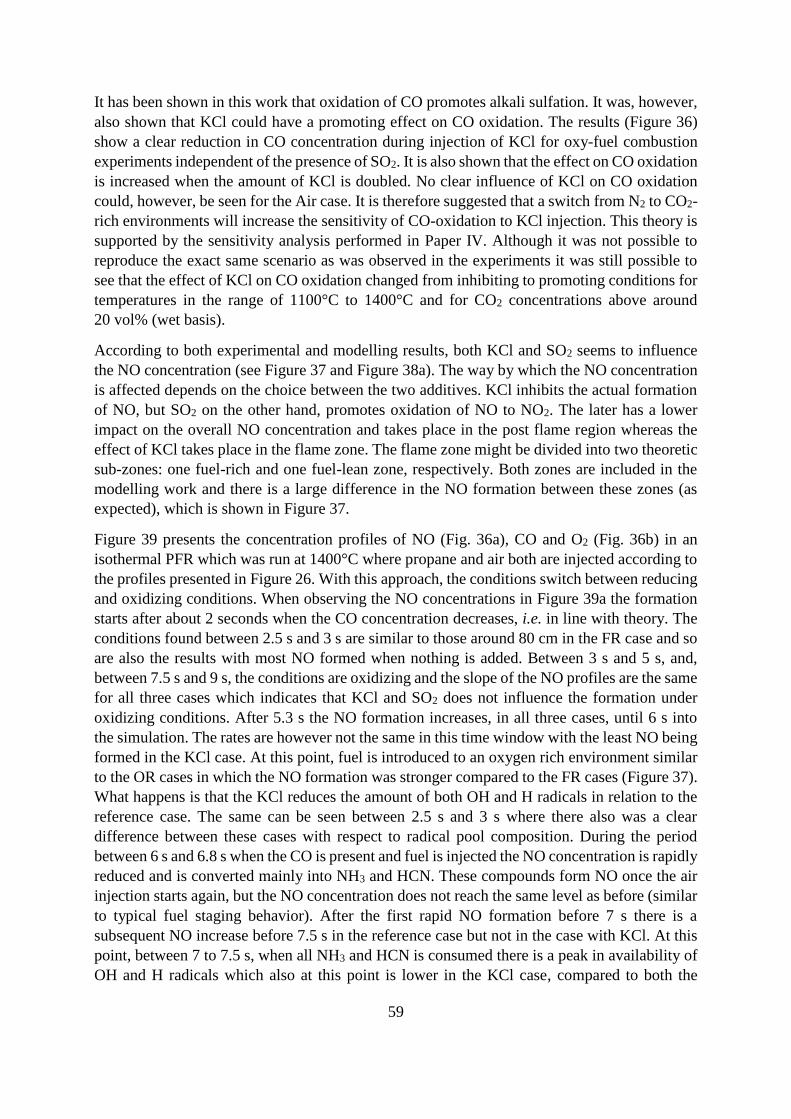
59
It has been shown in this work that oxidation of CO promotes alkali sulfation. It was, however,
also shown that KCl could have a promoting effect on CO oxidation. The results (Figure 36)
show a clear reduction in CO concentration during injection of KCl for oxy-fuel combustion
experiments independent of the presence of SO2. It is also shown that the effect on CO oxidation
is increased when the amount of KCl is doubled. No clear influence of KCl on CO oxidation
could, however, be seen for the Air case. It is therefore suggested that a switch from N2 to CO2-
rich environments will increase the sensitivity of CO-oxidation to KCl injection. This theory is
supported by the sensitivity analysis performed in Paper IV. Although it was not possible to
reproduce the exact same scenario as was observed in the experiments it was still possible to
see that the effect of KCl on CO oxidation changed from inhibiting to promoting conditions for
temperatures in the range of 1100°C to 1400°C and for CO2 concentrations above around
20 vol% (wet basis).
According to both experimental and modelling results, both KCl and SO2 seems to influence
the NO concentration (see Figure 37 and Figure 38a). The way by which the NO concentration
is affected depends on the choice between the two additives. KCl inhibits the actual formation
of NO, but SO2 on the other hand, promotes oxidation of NO to NO2. The later has a lower
impact on the overall NO concentration and takes place in the post flame region whereas the
effect of KCl takes place in the flame zone. The flame zone might be divided into two theoretic
sub-zones: one fuel-rich and one fuel-lean zone, respectively. Both zones are included in the
modelling work and there is a large difference in the NO formation between these zones (as
expected), which is shown in Figure 37.
Figure 39 presents the concentration profiles of NO (Fig. 36a), CO and O2 (Fig. 36b) in an
isothermal PFR which was run at 1400°C where propane and air both are injected according to
the profiles presented in Figure 26. With this approach, the conditions switch between reducing
and oxidizing conditions. When observing the NO concentrations in Figure 39a the formation
starts after about 2 seconds when the CO concentration decreases, i.e. in line with theory. The
conditions found between 2.5 s and 3 s are similar to those around 80 cm in the FR case and so
are also the results with most NO formed when nothing is added. Between 3 s and 5 s, and,
between 7.5 s and 9 s, the conditions are oxidizing and the slope of the NO profiles are the same
for all three cases which indicates that KCl and SO2 does not influence the formation under
oxidizing conditions. After 5.3 s the NO formation increases, in all three cases, until 6 s into
the simulation. The rates are however not the same in this time window with the least NO being
formed in the KCl case. At this point, fuel is introduced to an oxygen rich environment similar
to the OR cases in which the NO formation was stronger compared to the FR cases (Figure 37).
What happens is that the KCl reduces the amount of both OH and H radicals in relation to the
reference case. The same can be seen between 2.5 s and 3 s where there also was a clear
difference between these cases with respect to radical pool composition. During the period
between 6 s and 6.8 s when the CO is present and fuel is injected the NO concentration is rapidly
reduced and is converted mainly into NH3 and HCN. These compounds form NO once the air
injection starts again, but the NO concentration does not reach the same level as before (similar
to typical fuel staging behavior). After the first rapid NO formation before 7 s there is a
subsequent NO increase before 7.5 s in the reference case but not in the case with KCl. At this
point, between 7 to 7.5 s, when all NH3 and HCN is consumed there is a peak in availability of
OH and H radicals which also at this point is lower in the KCl case, compared to both the
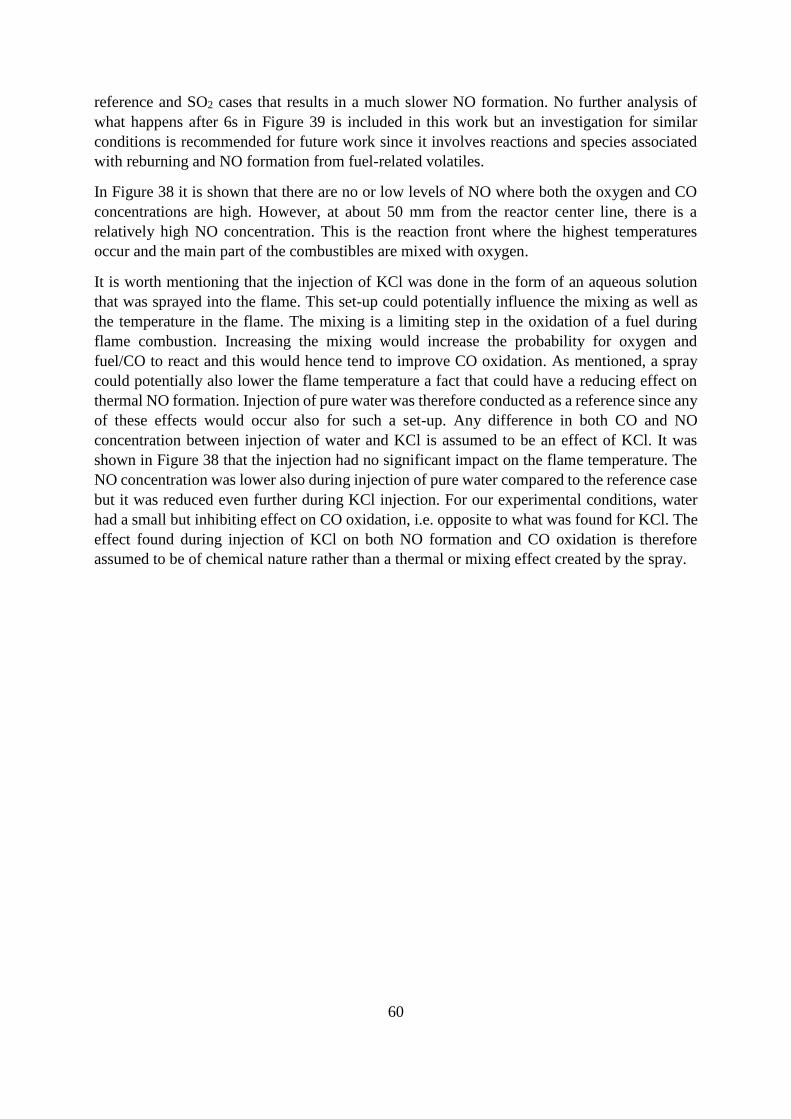
60
reference and SO2 cases that results in a much slower NO formation. No further analysis of
what happens after 6s in Figure 39 is included in this work but an investigation for similar
conditions is recommended for future work since it involves reactions and species associated
with reburning and NO formation from fuel-related volatiles.
In Figure 38 it is shown that there are no or low levels of NO where both the oxygen and CO
concentrations are high. However, at about 50 mm from the reactor center line, there is a
relatively high NO concentration. This is the reaction front where the highest temperatures
occur and the main part of the combustibles are mixed with oxygen.
It is worth mentioning that the injection of KCl was done in the form of an aqueous solution
that was sprayed into the flame. This set-up could potentially influence the mixing as well as
the temperature in the flame. The mixing is a limiting step in the oxidation of a fuel during
flame combustion. Increasing the mixing would increase the probability for oxygen and
fuel/CO to react and this would hence tend to improve CO oxidation. As mentioned, a spray
could potentially also lower the flame temperature a fact that could have a reducing effect on
thermal NO formation. Injection of pure water was therefore conducted as a reference since any
of these effects would occur also for such a set-up. Any difference in both CO and NO
concentration between injection of water and KCl is assumed to be an effect of KCl. It was
shown in Figure 38 that the injection had no significant impact on the flame temperature. The
NO concentration was lower also during injection of pure water compared to the reference case
but it was reduced even further during KCl injection. For our experimental conditions, water
had a small but inhibiting effect on CO oxidation, i.e. opposite to what was found for KCl. The
effect found during injection of KCl on both NO formation and CO oxidation is therefore
assumed to be of chemical nature rather than a thermal or mixing effect created by the spray.
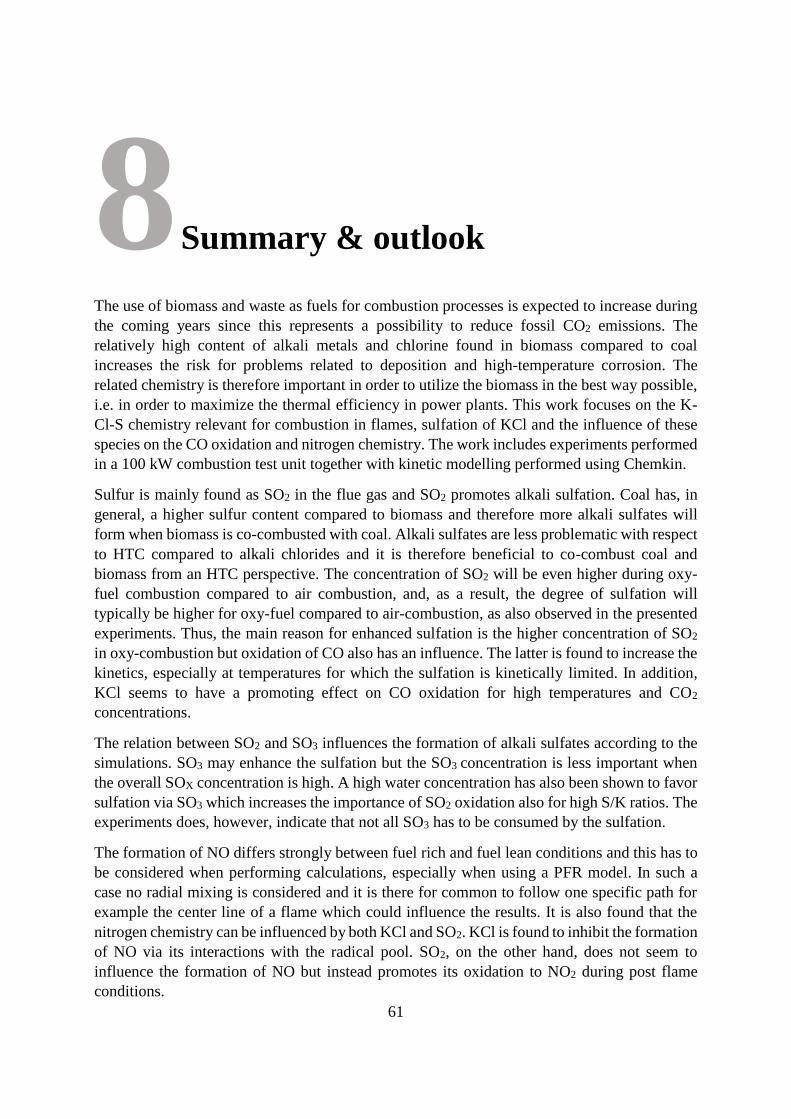
61
8 Summary & outlook
The use of biomass and waste as fuels for combustion processes is expected to increase during
the coming years since this represents a possibility to reduce fossil CO2 emissions. The
relatively high content of alkali metals and chlorine found in biomass compared to coal
increases the risk for problems related to deposition and high-temperature corrosion. The
related chemistry is therefore important in order to utilize the biomass in the best way possible,
i.e. in order to maximize the thermal efficiency in power plants. This work focuses on the K-
Cl-S chemistry relevant for combustion in flames, sulfation of KCl and the influence of these
species on the CO oxidation and nitrogen chemistry. The work includes experiments performed
in a 100 kW combustion test unit together with kinetic modelling performed using Chemkin.
Sulfur is mainly found as SO2 in the flue gas and SO2 promotes alkali sulfation. Coal has, in
general, a higher sulfur content compared to biomass and therefore more alkali sulfates will
form when biomass is co-combusted with coal. Alkali sulfates are less problematic with respect
to HTC compared to alkali chlorides and it is therefore beneficial to co-combust coal and
biomass from an HTC perspective. The concentration of SO2 will be even higher during oxy-
fuel combustion compared to air combustion, and, as a result, the degree of sulfation will
typically be higher for oxy-fuel compared to air-combustion, as also observed in the presented
experiments. Thus, the main reason for enhanced sulfation is the higher concentration of SO2
in oxy-combustion but oxidation of CO also has an influence. The latter is found to increase the
kinetics, especially at temperatures for which the sulfation is kinetically limited. In addition,
KCl seems to have a promoting effect on CO oxidation for high temperatures and CO2
concentrations.
The relation between SO2 and SO3 influences the formation of alkali sulfates according to the
simulations. SO3 may enhance the sulfation but the SO3 concentration is less important when
the overall SOX concentration is high. A high water concentration has also been shown to favor
sulfation via SO3 which increases the importance of SO2 oxidation also for high S/K ratios. The
experiments does, however, indicate that not all SO3 has to be consumed by the sulfation.
The formation of NO differs strongly between fuel rich and fuel lean conditions and this has to
be considered when performing calculations, especially when using a PFR model. In such a
case no radial mixing is considered and it is there for common to follow one specific path for
example the center line of a flame which could influence the results. It is also found that the
nitrogen chemistry can be influenced by both KCl and SO2. KCl is found to inhibit the formation
of NO via its interactions with the radical pool. SO2, on the other hand, does not seem to
influence the formation of NO but instead promotes its oxidation to NO2 during post flame
conditions.

62
The present work has shown that there is a potential to mitigate HTC related problems that are
connected to alkali species and chlorine during biomass combustion in oxy-fuel atmospheres.
HTC issues in oxy-fuel combustion are therefore expected to be easier to handle compared to
conventional air-fuel combustion systems. These findings are based on isolated gas phase
reactions. In a real solid fuel combustion system the sulfation will also be influenced by the
release of gaseous species together with ash-related reactions. How this chemistry is influenced
when switching from air-fuel to an oxy-fuel system will be important for the sulfation of alkali
metals in a real combustion system. Future work is therefore suggested to include experiments
that examine the behavior of biomass fuel particles during oxy-fuel combustion.
It is also suggested that future work should include bench scale reactor experiments. In such a
reactor, the fundamental chemistry can be controlled and investigated in more detail in order to
obtain an improved understanding of the CO-KCl and K-S-N interactions found in this work.
The interaction between alkali species, soot and aerosols is another important area that needs
further advancement.
63
Nomenclature
BECCS Bio energy with carbon capture and storage
BLPI Berner low-pressure impactor
CCS Carbon capture and storage
CFB Circulating fluidized bed
CPC Condensation particle counter
d50 Size of particles collected with 50% efficiency
DMA Differential mobility analyzer
DOAS Differential optical absorption spectroscopy
DLPI Dekati low-pressure impactor
FB Fluidized bed
FTIR Fourier transform infrared spectroscopy
HTC High temperature corrosion
IACM In situ alkali monitor
IEA International Energy Agency
IR Infrared
LPI Low-pressure impactor
NOX Generic term for nitrogen oxides; NO and NO2
PFR Plug flow reactor
SMPS Scanning mobility particle sizer
SOX Generic term for sulfuric oxides; SO, SO2 and SO3
UV Ultra violet
VT-DMA Volatility tandem differential mobility analyzer

64
65
References
1. IPCC, 2013: Climate Change 2013: The Physical Science Basis., in Contribution of
Working Group I to the Fifth Assessment Report of the Intergovernmental Panel on
Climate Change, T.F. Stocker, D. Qin, G.-K. Plattner, M. Tignor, S.K. Allen, J.
Boschung, A. Nauels, Y. Xia, V. Bex and P.M. Midgley, Editor. 2013: Cambridge
University Press, Cambridge, United Kingdom and New York, NY, USA, 2013. p.
1535.
2. IEA, Renewables Information 2016. 2016, International Energy Agency, ISBN 978-92-
64-25867-9.
3. IEA, CO2 Emissions from Fuel Combustion. 2016, International Energy Agency, ISBN
978-92-64-25856-3.
4. IEA, Electricity Information 2016. 2016, International Energy Agency, ISBN 978-92-
64-25865-5.
5. Wang, M., A. Lawal, P. Stephenson, J. Sidders, and C. Ramshaw, Post-combustion CO2
capture with chemical absorption: A state-of-the-art review. Chemical Engineering
Research and Design, 2011. 89(9): p. 1609-1624.
6. Toftegaard, M.B., J. Brix, P.A. Jensen, P. Glarborg, and A.D. Jensen, Oxy-fuel
combustion of solid fuels. Progress in Energy and Combustion Science, 2010. 36(5): p.
581-625.
7. Markström, P., C. Linderholm, and A. Lyngfelt, Chemical-looping combustion of solid
fuels - Design and operation of a 100kW unit with bituminous coal. International Journal
of Greenhouse Gas Control, 2013. 15: p. 150-162.
8. Bachu, S., CO 2 storage in geological media: Role, means, status and barriers to
deployment. Progress in Energy and Combustion Science, 2008. 34(2): p. 254-273.
9. Azar, C., D.J.A. Johansson, and N. Mattsson, Meeting global temperature targets - The
role of bioenergy with carbon capture and storage. Environmental Research Letters,
2013. 8(3).
10. Aho, M., T. Envall, and J. Kauppinen, Corrosivity of flue gases during co-firing Chinese
biomass with coal at fluidised bed conditions. Fuel Processing Technology, 2013. 105:
p. 82-88.
11. Kassman, H., J. Pettersson, B.M. Steenari, and L.E. Åmand, Two strategies to reduce
gaseous KCl and chlorine in deposits during biomass combustion - Injection of
ammonium sulphate and co-combustion with peat. Fuel Processing Technology, 2013.
105: p. 170-180.
12. Khan, A.A., W. de Jong, P.J. Jansens, and H. Spliethoff, Biomass combustion in
fluidized bed boilers: Potential problems and remedies. Fuel Processing Technology,
2009. 90(1): p. 21-50.
13. Olanders, B. and B.M. Steenari, Characterization of ashes from wood and straw.
Biomass and Bioenergy, 1995. 8(2): p. 105-115.
14. Saleh, S.B., J.P. Flensborg, T.K. Shoulaifar, Z. Sárossy, B.B. Hansen, H. Egsgaard, N.
Demartini, P.A. Jensen, P. Glarborg, and K. Dam-Johansen, Release of chlorine and
sulfur during biomass torrefaction and pyrolysis. Energy and Fuels, 2014. 28(6): p.
3738-3746.
15. Andersson, K., R. Johansson, S. Hjärtstam, F. Johnsson, and B. Leckner, Radiation
intensity of lignite-fired oxy-fuel flames. Experimental Thermal and Fluid Science,
2008. 33(1): p. 67-76.
66
16. Andersson, K., R. Johansson, F. Johnsson, and B. Leckner, Radiation intensity of
propane-fired oxy-fuel flames: Implications for soot formation. Energy and Fuels, 2008.
22(3): p. 1535-1541.
17. Andersson, K. and F. Johnsson, Flame and radiation characteristics of gas-fired O
2/CO 2 combustion. Fuel, 2007. 86(5-6): p. 656-668.
18. Fleig, D., K. Andersson, F. Normann, and F. Johnsson, SO 3 Formation under oxyfuel
combustion conditions. Industrial and Engineering Chemistry Research, 2011. 50(14):
p. 8505-8514.
19. Fleig, D., F. Normann, K. Andersson, F. Johnsson, and B. Leckner. The fate of sulphur
during oxy-fuel combustion of lignite. in International Conference on Greenhouse Gas
Control Technologies. 2008. Washington DC, USA: Elsevier.
20. Normann, F., K. Andersson, F. Johnsson, and B. Leckner, NO x reburning in oxy-fuel
combustion: A comparison between solid and gaseous fuels. International Journal of
Greenhouse Gas Control, 2011. 5(SUPPL. 1): p. S120-S126.
21. Normann, F., K. Andersson, B. Leckner, and F. Johnsson, Emission control of nitrogen
oxides in the oxy-fuel process. Progress in Energy and Combustion Science, 2009.
35(5): p. 385-397.
22. Leckner, B., Co-combustion - A summary of technology. Thermal Science, 2007. 11(4):
p. 5-40.
23. Savolainen, K., Co-firing of biomass in coal-fired utility boilers. Applied Energy, 2003.
74(3-4): p. 369-381.
24. Spliethoff, H. and K.R.G. Hein, Effect of co-combustion of biomass on emissions in
pulverized fuel furnaces. Fuel Processing Technology, 1998. 54(1-3): p. 189-205.
25. Harb, J.N. and E.E. Smith, Fireside corrosion in pc-fired boilers. Progress in Energy
and Combustion Science, 1990. 16(3): p. 169-190.
26. Åmand, L.E., B. Leckner, D. Eskilsson, and C. Tullin, Ash deposition on heat transfer
tubes during combustion of demolition wood. Energy and Fuels, 2006. 20(3): p. 1001-
1007.
27. Pisa, I. and G. Lazaroiu, Influence of co-combustion of coal/biomass on the corrosion.
Fuel Processing Technology, 2012. 104: p. 356-364.
28. Pettersson, J., J.E. Svensson, and L.G. Johansson, Alkali induced corrosion of 304-type
austenitic stainless steel at 600°C; comparison between KCl, K2CO3 and K 2so4.
Materials Science Forum, 2008. 595-598: p. 367-375.
29. Pettersson, A., A.L. Elled, A. Möller, B.M. Steenari, and L.E. Amand. The impact of
zeolites during co-combustion of municipal sewage sludge with alkali and chlorine rich
fuels. 2009.
30. Syed, A.U., N.J. Simms, and J.E. Oakey, Fireside corrosion of superheaters: Effects of
air and oxy-firing of coal and biomass. Fuel, 2012. 101: p. 62-73.
31. Fleig, D., K. Andersson, and F. Johnsson, Influence of operating conditions on SO3
formation during air and oxy-fuel combustion. Industrial and Engineering Chemistry
Research, 2012. 51(28): p. 9483-9491.
32. Giménez-López, J., M. Martínez, A. Millera, R. Bilbao, and M.U. Alzueta, SO2 effects
on CO oxidation in a CO2 atmosphere, characteristic of oxy-fuel conditions.
Combustion and Flame, 2011. 158(1): p. 48-56.
33. Rasmussen, C.L., P. Glarborg, and P. Marshall, Mechanisms of radical removal by SO2.
Proceedings of the Combustion Institute, 2007. 31 I: p. 339-347.
34. Kassman, H., M. Broström, M. Berg, and L.E. Åmand, Measures to reduce chlorine in
deposits: Application in a large-scale circulating fluidised bed boiler firing biomass.
Fuel, 2011. 90(4): p. 1325-1334.

67
35. Kassman, H., F. Normann, and L.-E. Åmand, The effect of oxygen and volatile
combustibles on the sulphation of gaseous KCl. Combustion and Flame, 2013. 160(10):
p. 2231-2241.
36. Hindiyarti, L., F. Frandsen, H. Livbjerg, P. Glarborg, and P. Marshall, An exploratory
study of alkali sulfate aerosol formation during biomass combustion. Fuel, 2008. 87(8-
9): p. 1591-1600.
37. Slack, M., J.W. Cox, A. Grillo, and R. Ryan, Potassium kinetics in heavily seeded
atmospheric pressure laminar methane flames. Combustion and Flame, 1989. 77(3-4):
p. 311-320.
38. Johansen, J.M., J.G. Jakobsen, F.J. Frandsen, and P. Glarborg, Release of K, Cl, and S
during pyrolysis and combustion of high-chlorine biomass. Energy and Fuels, 2011.
25(11): p. 4961-4971.
39. Glarborg, P., Hidden interactions-Trace species governing combustion and emissions.
Proceedings of the Combustion Institute, 2007. 31 I: p. 77-98.
40. Johansen, J.M., M. Aho, K. Paakkinen, R. Taipale, H. Egsgaard, J.G. Jakobsen, F.J.
Frandsen, and P. Glarborg, Release of K, Cl, and S during combustion and co-
combustion with wood of high-chlorine biomass in bench and pilot scale fuel beds.
Proceedings of the Combustion Institute, 2013. 34(2): p. 2363-2372.
41. Knudsen, J.N., P.A. Jensen, and K. Dam-Johansen, Transformation and release to the
gas phase of Cl, K, and S during combustion of annual biomass. Energy and Fuels,
2004. 18(5): p. 1385-1399.
42. Pommer, L., M. Öhman, D. Boström, J. Burvall, R. Backman, I. Olofsson, and A.
Nordin, Mechanisms behind the positive effects on bed agglomeration and deposit
formation combusting forest residue with peat additives in fluidized beds. Energy and
Fuels, 2009. 23(9): p. 4245-4253.
43. Ferrer, E., M. Aho, J. Silvennoinen, and R.V. Nurminen, Fluidized bed combustion of
refuse-derived fuel in presence of protective coal ash. Fuel Processing Technology,
2005. 87(1): p. 33-44.
44. Knudsen, J.N., P.A. Jensen, W. Lin, and K. Dam-Johansen, Secondary capture of
chlorine and sulfur during thermal conversion of biomass. Energy and Fuels, 2005.
19(2): p. 606-617.
45. Wei, X., C. Lopez, T. Von Puttkamer, U. Schnell, S. Unterberger, and K.R.G. Hein,
Assessment of chlorine-alkali-mineral interactions during co-combustion of coal and
straw. Energy and Fuels, 2002. 16(5): p. 1095-1108.
46. Müller, M., K.J. Wolf, A. Smeda, and K. Hilpert, Release of K, Cl, and S species during
co-combustion of coal and straw. Energy and Fuels, 2006. 20(4): p. 1444-1449.
47. Wu, H., M. Castro, P.A. Jensen, F.J. Frandsen, P. Glarborg, K. Dam-Johansen, M.
Røkke, and K. Lundtorp, Release and transformation of inorganic elements in
combustion of a high-phosphorus fuel. Energy and Fuels, 2011. 25(7): p. 2874-2886.
48. Yue, M., Y. Wang, and X. Li, Experimental study on the release characteristics of
chlorine and alkali metal during co-firing of wheat straw and lean coal. 2012. p. 3799-
3802.
49. Cullis, C.F. and M.F.R. Mulcahy, The kinetics of combustion of gaseous sulphur
compounds. Combustion and Flame, 1972. 18(2): p. 225-292.
50. Glarborg, P. and P. Marshall, Oxidation of reduced sulfur species: Carbonyl sulfide.
International Journal of Chemical Kinetics, 2013. 45(7): p. 429-439.
51. Bassilakis, R., Y. Zhao, P.R. Solomon, and M.A. Serio, Sulfur and nitrogen evolution
in the Argonne coals: Experiment and modeling. Energy & Fuels, 1993. 7(6): p. 710-
720.
68
52. Glarborg, P., A.D. Jensen, and J.E. Johnsson, Fuel nitrogen conversion in solid fuel
fired systems. Progress in Energy and Combustion Science, 2003. 29(2): p. 89-113.
53. Pohl, J.H. and A.F. Sarofim, Devolatilization and oxidation of coal nitrogen.
Symposium (International) on Combustion, 1977. 16(1): p. 491-501.
54. Baxter, L.L., R.E. Mitchell, T.H. Fletcher, and R.H. Hurt, Nitrogen Release during Coal
Combustion. Energy & Fuels, 1996. 10(1): p. 188-196.
55. Blair, D.W., J.O.L. Wendt, and W. Bartok, Evolution of nitrogen and other species
during controlled pyrolysis of coal. Symposium (International) on Combustion, 1977.
16(1): p. 475-489.
56. Rigby, J., J. Ma, B.W. Webb, and T.H. Fletcher, Transformations of coal-derived soot
at elevated temperature. Energy and Fuels, 2001. 15(1): p. 52-59.
57. Chen, J.C., C. Castagnoli, and S. Niksa, Coal devolatilization during rapid transient
heating. 2. Secondary pyrolysis. Energy & Fuels, 1992. 6(3): p. 264-271.
58. Wierzbicka, A., L. Lillieblad, J. Pagels, M. Strand, A. Gudmundsson, A. Gharibi, E.
Swietlicki, M. Sanati, and M. Bohgard, Particle emissions from district heating units
operating on three commonly used biofuels. Atmospheric Environment, 2005. 39(1): p.
139-150.
59. Valmari, T., T.M. Lind, E.I. Kauppinen, G. Sfiris, K. Nilsson, and W. Maenhaut, Field
study on ash behavior during circulating fluidized-bed combustion of biomass. 1. Ash
formation. Energy and Fuels, 1999. 13(2): p. 379-389.
60. Boman, C., A. Nordin, D. Boström, and M. Öhman, Characterization of inorganic
particulate matter from residential combustion of pelletized biomass fuels. Energy and
Fuels, 2004. 18(2): p. 338-348.
61. Christensen, K.A. and H. Livbjerg, A field study of submicron particles from the
combustion of straw. Aerosol Science and Technology, 1996. 25(2): p. 185-199.
62. Johansson, L.S., C. Tullin, B. Leckner, and P. Sjövall, Particle emissions from biomass
combustion in small combustors. Biomass and Bioenergy, 2003. 25(4): p. 435-446.
63. Pagels, J., M. Strand, J. Rissler, A. Szpila, A. Gudmundsson, M. Bohgard, L. Lillieblad,
M. Sanati, and E. Swietlicki, Characteristics of aerosol particles formed during grate
combustion of moist forest residue. Journal of Aerosol Science, 2003. 34(8): p. 1043-
1059.
64. Alkemade, U. and K.H. Homann, Gas-Phase Dimerization of Sodium Halides and
Formation of Mixed Sodium/Phenyl Iodides. Berichte der Bunsengesellschaft für
physikalische Chemie, 1989. 93(4): p. 434-439.
65. Jensen, J.R., L.B. Nielsen, C. Schultz-Møller, S. Wedel, and H. Livbjerg, The
Nucleation of Aerosols in Flue Gases with a High Content of Alkali - A Laboratory
Study. Aerosol Science and Technology, 2000. 33(6): p. 490-509.
66. Blomberg, T., A thermodynamic study of the gaseous potassium chemistry in the
convection sections of biomass fired boilers. Materials and Corrosion, 2011. 62(7): p.
635-641.
67. Iisa, K., Y. Lu, and K. Salmenoja, Sulfation of potassium chloride at combustion
conditions. Energy and Fuels, 1999. 13(6): p. 1184-1190.
68. Sengeløv, L.W., T.B. Hansen, C. Bartolomé, H. Wu, K.H. Pedersen, F.J. Frandsen, A.D.
Jensen, and P. Glarborg, Sulfation of condensed potassium chloride by SO2. Energy and
Fuels, 2013. 27(6): p. 3283-3289.
69. Lindberg, D., R. Backman, and P. Chartrand, Thermodynamic evaluation and
optimization of the (Na2SO4 + K2SO4 + Na2S2O7 + K2S2O7) system. Journal of
Chemical Thermodynamics, 2006. 38(12): p. 1568-1583.

69
70. Steinberg, M. and K. Schofield, The controlling chemistry of surface deposition from
sodium and potassium seeded flames free of sulfur or chlorine impurities. Combustion
and Flame, 2002. 129(4): p. 453-470.
71. Schofield, K. and M. Steinberg, Sodium/sulfur chemical behavior in fuel-rich and -lean
flames. The Journal of Physical Chemistry, 1992. 96(2): p. 715-726.
72. Steinberg, M. and K. Schofield, The chemistry of sodium with sulfur in flames. Progress
in Energy and Combustion Science, 1990. 16(4): p. 311-317.
73. Boonsongsup, L., K. Iisa, and W.J. Frederick Jr, Kinetics of the Sulfation of NaCl at
Combustion Conditions. Industrial and Engineering Chemistry Research, 1997. 36(10):
p. 4212-4216.
74. Li, B., Z. Sun, Z. Li, M. Aldén, J.G. Jakobsen, S. Hansen, and P. Glarborg, Post-flame
gas-phase sulfation of potassium chloride. Combustion and Flame, 2013. 160(5): p.
959-969.
75. Christensen, K.A. and H. Livbjerg, A plug flow model for chemical reactions and
aerosol nucleation and growth in an alkali-containing flue gas. Aerosol Science and
Technology, 2000. 33(6): p. 470-489.
76. Hynes, A.J., M. Steinberg, and K. Schofield, The chemical kinetics and thermodynamics
of sodium species in oxygen-rich hydrogen flames. The Journal of Chemical Physics,
1983. 80(6): p. 2585-2597.
77. Jensen, D.E., Alkali-metal compounds in oxygen-rich flames. A reinterpretation of
experimental results. Journal of the Chemical Society, Faraday Transactions 1: Physical
Chemistry in Condensed Phases, 1982. 78(9): p. 2835-2842.
78. Jensen, D.E. and G.A. Jones, Kinetics of flame inhibition by sodium. Journal of the
Chemical Society, Faraday Transactions 1: Physical Chemistry in Condensed Phases,
1982. 78(9): p. 2843-2850.
79. Jensen, D.E., G.A. Jones, and A.C.H. Mace, Flame inhibition by potassium. Journal of
the Chemical Society, Faraday Transactions 1: Physical Chemistry in Condensed
Phases, 1979. 75: p. 2377-2385.
80. Birchall, J.D., On the mechanism of flame inhibition by alkali metal salts. Combustion
and Flame, 1970. 14(1): p. 85-95.
81. Bulewicz, E.M. and B.J. Kucnerowicz-Polak, The action of sodium bicarbonate and of
silica powder on upward propagating flame in a vertical duct. Combustion and Flame,
1987. 70(2): p. 127-135.
82. Dewitte, M., J. Vrebosch, and A. van Tiggelen, Inhibition and extinction of premixed
flames by dust particles. Combustion and Flame, 1964. 8(4): p. 257-266.
83. Dodding, R.A., R.F. Simmons, and A. Stephens, The extinction of methane-air diffusion
flames by sodium bicarbonate powders. Combustion and Flame, 1970. 15(3): p. 313-
315.
84. Friedman, R. and J.B. Levy, Inhibition of opposed-jet methane-air diffusion flames. The
effects of alkali metal vapours and organic halides. Combustion and Flame, 1963. 7(1):
p. 195-201.
85. Kim, H.T. and J.J. Reuther, Temperature dependence of dry chemical premixed flame
inhibition effectiveness. Combustion and Flame, 1984. 57(3): p. 313-317.
86. Rosser Jr, W.A., S.H. Inami, and H. Wise, The effect of metal salts on premixed
hydrocarbon-air flames. Combustion and Flame, 1963. 7(1): p. 107-119.
87. Sridhar Iya, K., S. Wollowitz, and W.E. Kaskan, The mechanism of flame inhibition by
sodium salts. Symposium (International) on Combustion, 1975. 15(1): p. 329-336.
88. Wei, X., U. Schnell, X. Han, and K.R.G. Hein, Interactions of CO, HCl, and SOx in
pulverised coal flames. Fuel, 2004. 83(9): p. 1227-1233.
70
89. Hindiyarti, L., F. Frandsen, H. Livbjerg, and P. Glarborg, Influence of potassium
chloride on moist CO oxidation under reducing conditions: Experimental and kinetic
modeling study. Fuel, 2006. 85(7-8): p. 978-988.
90. Roesler, J.F., R.A. Yetter, and F.L. Dryer, Detailed kinetic modeling of moist CO
oxidation inhibited by trace quantities of HCl. Combustion science and technology,
1992. 85(1-6): p. 1-22.
91. Roesler, J.F., R.A. Yetter, and F.L. Dryer, Kinetic interactions of CO, NOx, and HCI
emissions in postcombustion gases. Combustion and Flame, 1995. 100(3): p. 495-504.
92. Roesler, J.F., R.A. Yetter, and F.L. Dryer, Inhibition and oxidation characteristics of
chloromethanes in reacting CO/H2O/O2 mixtures. Combustion science and technology,
1996. 120(1-6): p. 11-37.
93. Mueller, C., P. Kilpinen, and M. Hupa, Influence of HCl on the homogeneous reactions
of CO and NO in postcombustion conditions - A kinetic modeling study. Combustion
and Flame, 1998. 113(4): p. 579-588.
94. Glarborg, P. and P. Marshall, Mechanism and modeling of the formation of gaseous
alkali sulfates. Combustion and Flame, 2005. 141(1-2): p. 22-39.
95. Zamansky, V.M., V.V. Lissianski, P.M. Maly, L. Ho, D. Rusli, and W.C. Gardiner Jr,
Reactions of sodium species in the promoted SNCR process. Combustion and Flame,
1999. 117(4): p. 821-831.
96. Zamansky, V.M., P.M. Maly, L. Ho, V.V. Lissianski, D. Rusli, and W.C. Gardiner Jr,
Promotion of selective non-catalytic reduction of NO by sodium carbonate. Symposium
(International) on Combustion, 1998. 1: p. 1443-1449.
97. Wei, X., X. Han, U. Schnell, J. Maier, H. Wörner, and K.R.G. Hein, The effect of HCl
and SO2 on NOx formation in coal flames. Energy and Fuels, 2003. 17(5): p. 1392-
1398.
98. Campbell, I.M. and B.A. Thrush, Reactivity of hydrogen to atomic nitrogen and atomic
oxygen. Transactions of the Faraday Society, 1968. 64: p. 1265-1274.
99. Lavole, G.A., J.B. Heywood, and J.C. Keck, Experimental and theoretical study of nitric
oxide formation in internal combustion engines. Combustion Science and Technology,
1970. 1(4): p. 313-326.
100. Zeldovich, J., The oxidation of nitrogen in combustion and explosions. European
Physical Journal A - Hadrons and Nuclei, 1946. 21: p. 577-628.
101. Fenimore, C.P., Formation of nitric oxide in premixed hydrocarbon flames. Symposium
(International) on Combustion, 1971. 13(1): p. 373-380.
102. Wendt, J.O.L., C.V. Sternling, and M.A. Matovich, Reduction of sulfur trioxide and
nitrogen oxides by secondary fuel injection. Symposium (International) on Combustion,
1973. 14(1): p. 897-904.
103. Wendt, J.O.L., J.T. Morcomb, and T.L. Corley, Influence of fuel sulfur on fuel nitrogen
oxidation mechanisms. Symposium (International) on Combustion, 1979. 17(1): p. 671-
678.
104. Wendt, J.O.L. and J.M. Ekmann, Effect of fuel sulfur species on nitrogen oxide
emissions from premixed flames. Combustion and Flame, 1975. 25: p. 355-360.
105. Pfefferle, L.D. and S.W. Churchill, Effect of fuel sulfur on nitrogen oxide formation in
a thermally stabilized plug-flow burner. Industrials and Engineering Chemistry
Research®, 1989. 28(7): p. 1004-1010.
106. Zhao, Z., W. Li, J. Qiu, and B. Li, Effect of Na, Ca and Fe on the evolution of nitrogen
species during pyrolysis and combustion of model chars. Fuel, 2003. 82(15-17): p.
1839-1844.
71
107. Zhao, Z., W. Li, J. Qiu, and B. Li, Catalytic effect of Na-Fe on NO-char reaction and
NO emission during coal char combustion. Fuel, 2002. 81(18): p. 2343-2348.
108. Zhao, Z., J. Qiu, W. Li, H. Chen, and B. Li, Influence of mineral matter in coal on
decomposition of NO over coal chars and emission of NO during char combustion. Fuel,
2003. 82(8): p. 949-957.
109. Fleig, D., M.U. Alzueta, F. Normann, M. Abián, K. Andersson, and F. Johnsson,
Measurement and modeling of sulfur trioxide formation in a flow reactor under post-
flame conditions. Combustion and Flame, 2013. 160(6): p. 1142-1151.
110. Kühnemuth, D., F. Normann, K. Andersson, F. Johnsson, and B. Leckner, NOX
REBURNING IN OXY-FUEL COMBUSTION AN EXPERIMENTAL INVESTIGATION,
in International Pittsburgh Coal Conference. 2010: Istanbul, Turkey.
111. Fleig, D., E. Vainio, K. Andersson, A. Brink, F. Johnsson, and M. Hupa, Evaluation of
SO 3 measurement techniques in air and oxy-fuel combustion. Energy and Fuels, 2012.
26(9): p. 5537-5549.
112. Maddalone, R.F., S.F. Newton, R.G. Rhudy, and R.M. Statnick, Laboratory and field
evaluation of the Controlled Condensation System for SO3 measurements in flue gas
streams. Journal of the Air Pollution Control Association, 1979. 29(6): p. 626-631.
113. Forsberg, C., M. Broström, R. Backman, E. Edvardsson, S. Badiei, M. Berg, and H.
Kassman, Principle, calibration, and application of the in situ alkali chloride monitor.
Review of Scientific Instruments, 2009. 80(2).
114. Platt, U. and D. Perner, MEASUREMENTS OF ATMOSPHERIC TRACE GASES BY
LONG PATH DIFFERENTIAL UV/VISIBLE ABSORPTION SPECTROSCOPY.
Springer Series in Optical Sciences, 1983. 39: p. 97-105.
115. Mellqvist, J. and A. Rosén, DOAS for flue gas monitoring—II. Deviations from the
Beer-Lambert law for the U.V./visible absorption spectra of NO, NO2, SO2 and NH3.
Journal of Quantitative Spectroscopy and Radiative Transfer, 1996. 56(2): p. 209-224.
116. Leffler, T., C. Brackmann, M. Berg, M. Aldén, and Z.S. Li, Development of an alkali
chloride vapour-generating apparatus for calibration of ultraviolet absorption
measurements. Review of Scientific Instruments, 2017. 88(2).
117. Strand, M., J. Pagels, A. Szpila, A. Gudmundsson, E. Swietlicki, M. Bohgard, and M.
Sanati, Fly ash penetration through electrostatic precipitator and flue gas condenser in
a 6 MW biomass fired boiler. Energy and Fuels, 2002. 16(6): p. 1499-1506.
118. Wiinikka, H. and R. Gebart, Critical parameters for particle emissions in small-scale
fixed-bed combustion of wood pellets. Energy and Fuels, 2004. 18(4): p. 897-907.
119. Valmari, T., E.I. Kauppinen, J. Kurkela, J.K. Jokiniemi, G. Sfiris, and H. Revitzer, Fly
ash formation and deposition during fluidized bed combustion of willow. Journal of
Aerosol Science, 1998. 29(4): p. 445-459.
120. Strand, M., M. Bohgard, E. Swietlicki, A. Gharibi, and M. Sanati, Laboratory and field
test of a sampling method for characterization of combustion aerosols at high
temperatures. Aerosol Science and Technology, 2004. 38(8): p. 757-765.
121. Lind, T., T. Valmari, E. Kauppinen, K. Nilsson, G. Sfiris, and W. Maenhaut, Ash
formation mechanisms during combustion of wood in circulating fluidized beds.
Symposium (International) on Combustion, 2000. 28(2): p. 2287-2294.
122. Wiinikka, H., R. Gebart, C. Boman, D. Boström, A. Nordin, and M. Öhman, High-
temperature aerosol formation in wood pellets flames: Spatially resolved
measurements. Combustion and Flame, 2006. 147(4): p. 278-293.
123. Fernandes, U., M. Guerrero, Á. Millera, R. Bilbao, M.U. Alzueta, and M. Costa,
Oxidation behavior of particulate matter sampled from the combustion zone of a
domestic pellet-fired boiler. Fuel Processing Technology, 2013. 116: p. 201-208.
72
124. Davis, S.B., T.K. Gale, J.O.L. Wendt, and W.P. Linak, Multicomponent coagulation
and condensation of toxic metals in combustors. Symposium (International) on
Combustion, 1998. 2: p. 1785-1791.
125. McNallan, M.J., G.J. Yurek, and J.F. Elliott, The formation of inorganic particulates by
homogeneous nucleation in gases produced by the combustion of coal. Combustion and
Flame, 1981. 42(C): p. 45-60.
126. Wiinikka, H., High Temperature Aerosol Formation and Emission Minimisation during
Combustion of Wood Pellets, in Applied Physics and Mechanical Engineering. 2005,
Luleå University of Technology: Applied Physics and Mechanical Engineering. p. 57.
127. Wang, C., W.S. Seames, M. Gadgil, J. Hrdlicka, and G. Fix, Comparison of coal ash
particle size distributions from Berner and Dekati low pressure impactors. Aerosol
Science and Technology, 2007. 41(12): p. 1062-1075.
128. Biswas, P. and R.C. Flagan, High-velocity inertial impactors. Environmental Science
and Technology, 1984. 18(8): p. 611-616.
129. Jiménez, S. and J. Ballester, Formation and emission of submicron particles in
pulverized olive residue (orujillo) combustion. Aerosol Science and Technology, 2004.
38(7): p. 707-723.
130. Zeleny, J., The distribution of mobilities of ions in moist air. Physical Review, 1929.
34(2): p. 310-334.
131. De La Mora, J.F., L. De Juan, T. Eichler, and J. Rosell, Differential mobility analysis of
molecular ions and nanometer particles. TrAC - Trends in Analytical Chemistry, 1998.
17(6): p. 328-339.
132. Park, K., D. Dutcher, M. Emery, J. Pagels, H. Sakurai, J. Scheckman, S. Qian, M.R.
Stolzenburg, X. Wang, J. Yang, and P.H. McMurry, Tandem measurements of aerosol
properties - A review of mobility techniques with extensions. Aerosol Science and
Technology, 2008. 42(10): p. 801-816.
133. Knutson, E.O. and K.T. Whitby, Aerosol classification by electric mobility: apparatus,
theory, and applications. Journal of Aerosol Science, 1975. 6(6): p. 443-451.
134. Schulz, C., J.D. Koch, D.F. Davidson, J.B. Jeffries, and R.K. Hanson, Ultraviolet
absorption spectra of shock-heated carbon dioxide and water between 900 and 3050 K.
Chemical Physics Letters, 2002. 355(1-2): p. 82-88.
135. Curtiss, L.A., K. Raghavach Ari, P.C. Redfern, V. Rassolov, and J.A. Pople, Gaussian-
3 (G3) theory for molecules containing first and second-row atoms. Journal of Chemical
Physics, 1998. 109(18): p. 7764-7776.
136. Curtiss, L.A., P.C. Redfern, V. Rassolov, G. Kedziora, and J.A. Pople, Extension of
Gaussian-3 theory to molecules containing third-row atoms K, Ca, Ga-Kr. Journal of
Chemical Physics, 2001. 114(21): p. 9287-9295.
137. Yilmaz, A., L. Hindiyarti, A.D. Jensen, P. Glarborg, and P. Marshall, Thermal
dissociation of so 3 at 1000-1400 K. Journal of Physical Chemistry A, 2006. 110(21):
p. 6654-6659.
138. Hindiyarti, L., P. Glarborg, and P. Marshall, Reactions of so3 with the O/H radical pool
under combustion conditions. Journal of Physical Chemistry A, 2007. 111(19): p. 3984-
3991.
139. Jiménez, S. and J. Ballester, Influence of operating conditions and the role of sulfur in
the formation of aerosols from biomass combustion. Combustion and Flame, 2005.
140(4): p. 346-358.
140. Jiménez, S. and J. Ballester, Formation of alkali sulphate aerosols in biomass
combustion. Fuel, 2007. 86(4): p. 486-493.
73
141. Glarborg, P., M.U. Alzueta, K. Kjærgaard, and K. Dam-Johansen, Oxidation of
formaldehyde and its interaction with nitric oxide in a flow reactor. Combustion and
Flame, 2003. 132(4): p. 629-638.
142. Glarborg, P., M.U. Alzueta, K. Dam-Johansen, and J.A. Miller, Kinetic modeling of
hydrocarbon/nitric oxide interactions in a flow reactor. Combustion and Flame, 1998.
115(1-2): p. 1-27.
143. Alzueta, M.U., M. Borruey, A. Callejas, A. Millera, and R. Bilbao, An experimental and
modeling study of the oxidation of acetylene in a flow reactor. Combustion and Flame,
2008. 152(3): p. 377-386.
144. Abián, M., J. Giménez-López, R. Bilbao, and M.U. Alzueta, Effect of different
concentration levels of CO2 and H 2O on the oxidation of CO: Experiments and
modeling. Proceedings of the Combustion Institute, 2011. 33(1): p. 317-323.
145. Glarborg, P., M. Østberg, M.U. Alzueta, K. Dam-Johansen, and J.A. Miller, Twenty-
Seventh Sysposium (International) on Combustion Volume OneThe recombination of
hydrogen atoms with nitric oxide at high temperatures. Symposium (International) on
Combustion, 1998. 27(1): p. 219-226.
146. Dagaut, P., P. Glarborg, and M.U. Alzueta, The oxidation of hydrogen cyanide and
related chemistry. Progress in Energy and Combustion Science, 2008. 34(1): p. 1-46.
147. Alzueta, M.U., R. Bilbao, and P. Glarborg, Inhibition and sensitization of fuel oxidation
by SO2. Combustion and Flame, 2001. 127(4): p. 2234-2251.