
Chemical distribution - ANIQ QUINTA SESION PLENARIA/1...Chemical Distribution - ANIQ Oct 2012...
22
Chemical distribution Global picture, trends and opportunities Dr. Udo Jung The Boston Consulting Group, Frankfurt (Germany) México D.F., October 26, 2012
Transcript of Chemical distribution - ANIQ QUINTA SESION PLENARIA/1...Chemical Distribution - ANIQ Oct 2012...

Chemical distribution Global picture, trends and opportunities Dr. Udo Jung The Boston Consulting Group, Frankfurt (Germany)
México D.F., October 26, 2012

1 Chemical Distribution - ANIQ Oct 2012 -Final.pptx
Agenda
What is the state, globally, of the chemical distribution market?
In particular, what is happening in Mexico and Latin America?
What global trends can forecast a brighter future for the Mexican Chemical Distribution market?
2 Chemical Distribution - ANIQ Oct 2012 -Final.pptx
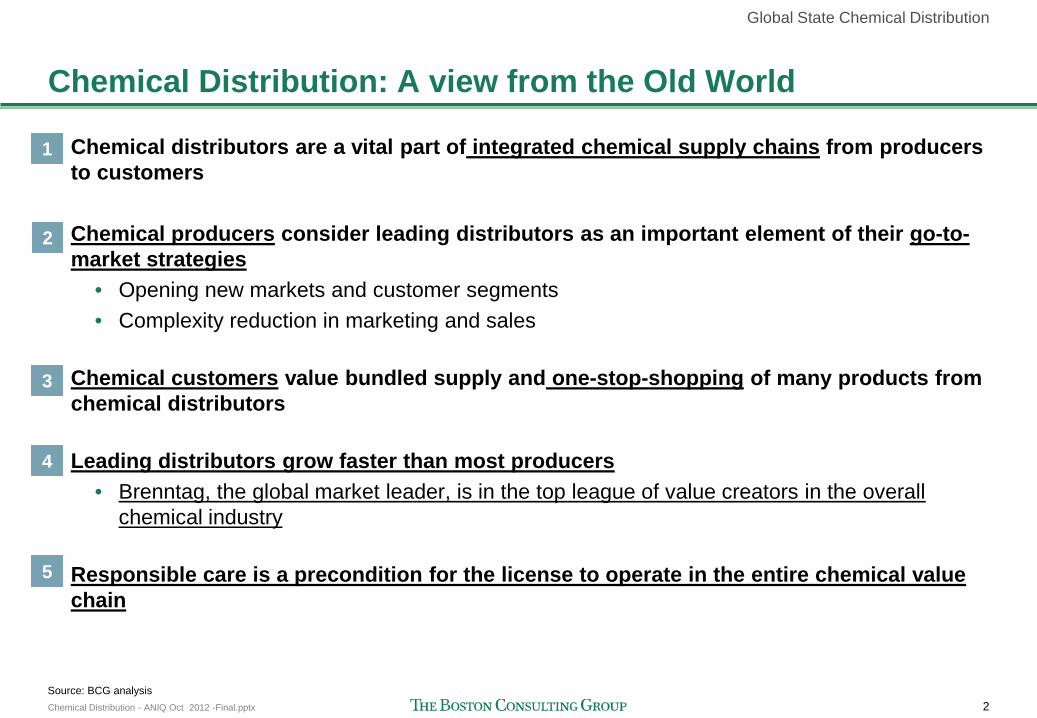
Chemical Distribution: A view from the Old World
Chemical distributors are a vital part of integrated chemical supply chains from producers to customers Chemical producers consider leading distributors as an important element of their go-to-market strategies
• Opening new markets and customer segments • Complexity reduction in marketing and sales
Chemical customers value bundled supply and one-stop-shopping of many products from chemical distributors
Leading distributors grow faster than most producers
• Brenntag, the global market leader, is in the top league of value creators in the overall chemical industry
Responsible care is a precondition for the license to operate in the entire chemical value chain
1
2
3
4
5
Source: BCG analysis
Global State Chemical Distribution

3 Chemical Distribution - ANIQ Oct 2012 -Final.pptx
Chemical distributors create value for producers: Realizing growth and managing complexity in marketing and sales
"Contract business—sales outsourcing"
• Usually formal contractual relationships with "principals" (often mutual exclusivity)
• Distributors often with high switching cost for
their suppliers (principals)
• High level of data integration
• "Window of opportunity" (i.e., consolidation of sales partners; complexity reduction of marketing and sales) when major chemical producers ("principals") are restructuring their distributor base
• Product-wise often—but not always—
specialties
Other smaller customers
. . .
Distributor
. . .
Source: The Boston Consulting Group
Global State Chemical Distribution

4 Chemical Distribution - ANIQ Oct 2012 -Final.pptx
Key criteria for producers to choose chemical distributors
Interview results of specialty chemicals suppliers
Important Not important
Not rated Average Less important
Very important
Importance of success factors Performance of major distributors
Product know-how
Quantity/ customer base
Complementary products
Transparency on end-customers
Pan-European-reach
Track record
Price
Own assets in stor-age, mixing, filling
Own vs. out-sourced logistics
Product know-how
Pan-European-reach
Quantity/ customer base
Complementary products
Price
Track record
Own vs. outsourced logistics
Transparency on end-customers
Own assets in storage, mixing and
filling
D 4
D 3
D 1
D 2
Not rated
Very good Good Average Insuffi-
cient
Very insuffi-cient
Source: Market expert interviews; BCG analysis
Global State Chemical Distribution

5 Chemical Distribution - ANIQ Oct 2012 -Final.pptx
Chemical distributors create value for customers: Single sourcing and technical serve
"Contract business—single sourcing"
• Quite often formal contractual relationships with customers
• Outsourcing of parts of the procurement function with high switching cost for customer
• "Window of opportunity" as more and more customers restructure their procurement
• Typical business model for smaller customers (with diverse chemicals supply base—however with rather low overall volumes)
Other smaller customers
. . .
Distributor
Source: The Boston Consulting Group
. . .
Global State Chemical Distribution

6 Chemical Distribution - ANIQ Oct 2012 -Final.pptx
Key criteria for customers to choose chemical distributors
Growth opportunity Current constraint
"Currently we purchase from 5-6 distributors – currently a single distributor doesn't offer all the products and the required support we need."
- paint company -
"Distributors have far better speed and flexibility of delivery than chemical suppliers—unfortunately they lack the technical expertise we need in some categories."
- specialty company -
"We would value distributors even more, if they had more application expertise to revise formulations with us."
- Asian specialty company -
"We are a coating company - REACH is mainly a topic for chemical suppliers"
- coating company -
Note: Quotes reflects statements from more than one individual Source: Customer survey; BCG analysis
50
% of answers 100 0
Customized mixing,
blending etc 13%
Regulatory support (REACH) 15%
Customer-tailored service 16%
Vendor managed inventory 31%
Application expertise 48%
Technical support 54%
Single sourcing 59%
"We would love to get rid of all the inventory management—unfortunately no one is offering something for medium-sized companies."
- specialty company -
Global State Chemical Distribution

7 Chemical Distribution - ANIQ Oct 2012 -Final.pptx
Chemical distributors create value for the whole value chain: Extending market reach and providing value added service
"Value Added Services"
• Very often local business with a need for high customer proximity
• Bundling of demand for several products into one customized delivery
• Drum exchange service and waste disposal material loop
• Addition of value adding steps -examples
– Material services , e.g. formulation/blending, licensed
production, filling/labeling – Immaterial services, e.g. VMI, certification, training
Other smaller customers
. . .
Distributor
Source: The Boston Consulting Group
. . .
Global State Chemical Distribution

8 Chemical Distribution - ANIQ Oct 2012 -Final.pptx
The business model of chemical distributors covers the whole value chain – Option space for distinct business models
Invoicing initiated on receipt of delivery note Printing/submitting Bundling of invoices on demand
Solution provider for customer specific problems Technical consulting (usage, handling) Product development Value-added services (research, analyses) Environmental and regulatory advice
Mixing, blending of customer specific chemicals • Get recipe/make recipe • Blending • Quality control
Filling of customer specific quantities • Determine quantity • Drum size and type • Filling • Weighting/measuring
Coordinated route planning with delivery of goods Release of transport documents Initiate recycling of
• Returned packages • Used drums
Initiate disposal of used goods Pledge charging Accounting for returned packages
Accounts payable Accounts receivable General ledger Invoice verification Financial statement Planning/Budgeting Asset management Currency/risk mgmt. Treasury Cost calculation schema
Budgeting Cost center accounting Profitability analysis Evaluation of stock levels Reporting/MIS Monthly and quarterly reporting Capex control
Inbound logistics
Stock- keeping
Marketing & Sales Advice/
technical service
Order processing
Mixing/ blending/
filling
Outbound logistics
Recycling/ drum return handling
Finance, Accoun-
ting Controlling
Spot bus.
Sales
Contr. bus.
Cust. acqu. + care
Supplier Mgmt.
Purchasing Contract
Supplier •Acqu. •Report.
Spot Target setting
Invoicing
Transport/route planning Release of Transport documents (input from order processing) Pick up of goods Loading of truck Transportation
Order entry Order check
• Regulatory aspects • Availability of products • (Export regulations)
Calculation Credit limit check Printing of delivery note, pick up list, dispatch note and other documents
Acquisition of new customers Customer care Selling/order taking
• Advice on product • Negotiations on price • Product specific information to
technical advice Price fixing, exchange hedging
Acquisition of new customers Customer care New (single) sourcing contracts
• Compare product list with product portfolio • Find supplier for products not in portfolio • Plan logistics, coordinate information collection process • Overall profit calculation • Develop profit sharing system
Development of marketing strategies • For introduction of new products • For sales increase of existing ones
Order taking
Stock planning • Demand planning • Stock targets • Replenishment orders
Warehouse management Goods receipt Quality assurance Handling (loading, pick up of goods) Security/environmental protection
Transport/ route planning Release of transport documents
Selection of supplier/producer Purchasing
• Determine volume • Negotiation on price • Purchase order processing
Two types of purchasing: • On stock • Point-to-point
Foreign exchange hedging
"Acquisition" of a new supplier • Select target supplier to optimize product
portfolio (green boxes) • Collect information about actual customer
base to show industry expertise and sales potential
• Contract negotiations (exclusivity, volumes, prices, logistics)
Reporting • Provide information about sales, profitability,
prices, market trends, customer needs, complaints
Set targets for volume per period
Development of price models (boni, fixed price, …)
Source: Interviews; BCG analysis
Global State Chemical Distribution

9 Chemical Distribution - ANIQ Oct 2012 -Final.pptx
z
Customer industries
Activities
Products
Feedstock Industrial gas Cracker products Secondary basic chem. incl. antifreeze Inorganic acids
Standard polymers
Engineering polymers High performance polym.
Elastomers
…
Textiles/clothes
Fibers
Catalysts
Packaging material
Paints
Polymer intermediates Solvents & other interm. Cust.-industry spec. chem. Function-specific chem. Adhesive components
Inks
Feed ingredients Food ingredients
Lubricants Fats, oils
Construction material
Other inorgan. (e.g. miner.)
Biofuels Fertilizers Pesticides
Active pharma. ingredients
Lab chemicals
Agriculture
Mining and quarrying
Coke, refined petroleum prod.
Gas distribution Electricity production
Chemicals excl. pharma.
Rubber and plastics products Textiles and footwear
...
Pulp & paper
Food products, bever., tobacco
Wood and wood products Iron & steel
Other non-metallic mineral prod. Fabricated metal products
Water treatment
Pharmaceuticals
Electrical machinery Medical & optical instruments
Motor vehicles
Communication equipment Office & computing machinery Other transport equipment Transport services Health and social work Research and development Hotels and restaurants Post and telecommunications Finance and insurance Real estate activities Computer and related activities Private households
Building & construction industry
• Extraction of oil & gas
• Cosm., pers. care, cleaning • Paints & coatings
Business models in Chemical Distribution: Value chain coverage – product portfolio – customer industries/application
"Full-line providers with acquisitive growth"
"Industry specialists"
Tran
spor
tatio
n
Dru
m re
turn
ha
ndlin
g D
ocum
ent
hand
ling
Stor
age
Was
te h
andl
ing
& tr
ansp
ort
Dilu
ting,
bl
endi
ng
Bun
dlin
g, fi
lling
, pa
ck.,
labe
l Sa
les
to b
road
cu
stom
ers
Mar
ketin
g
Sing
le s
ourc
ing
Ord
er &
invo
ice
mgm
t. D
ebt c
olle
ctio
n (fo
r sup
plie
rs)
Vend
or-m
anag
ed
inve
ntor
y Te
chni
cal
supp
ort
Reg
. ser
vice
s:
ESH
Q, R
EAC
H
Trai
ning
QM
& la
b an
alys
is
Prod
./ ap
p. d
evt.
Prod
. reg
./ pa
tent
re
s.
Term
inal
ing
Com
poun
ding
Form
ulat
ing
Bat
ch
proc
essi
ng
Che
mic
al
synt
hesi
s
Prod
uctio
n op
erat
ion
Des
ign
Was
te d
ispo
sal/
mgm
t.
Ons
ite lo
gist
ics
(cus
t./ s
upp.
) Lo
adin
g &
filli
ng
(cus
t./ s
upp.
) In
stal
latio
n &
re
pair
Physical handling of goods
Complexity management Financing Customer support Other activities
Prod
uctio
n
Pro- ducti
on
"Producers with distribution business"
"Producers with captive distribution /
trading"
Source: Market study; BCG
"Functional specialists"
"Product range specialists with vertical integration"
"Low cost /value opportunity seekers"
Global State Chemical Distribution
10 Chemical Distribution - ANIQ Oct 2012 -Final.pptx
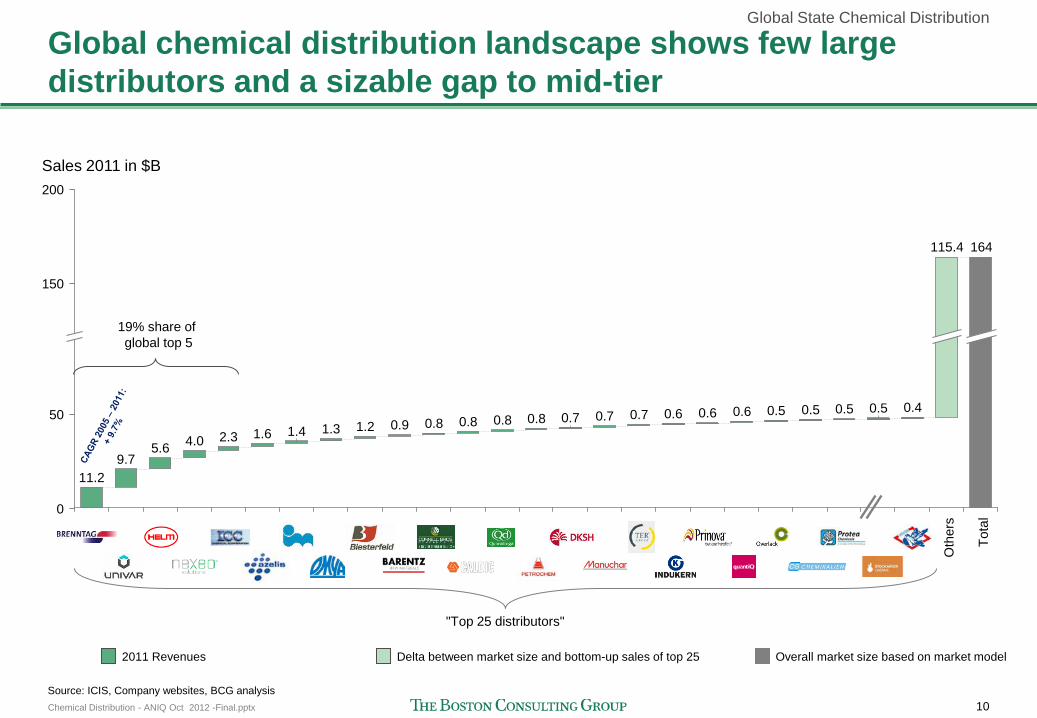
Global chemical distribution landscape shows few large distributors and a sizable gap to mid-tier
0
150
200
Sales 2011 in $B
50 0.4
115.4
0.5 0.5 0.5 0.5
164
0.6 0.6 0.7 0.7 0.7 0.8 0.8 0.8 0.8 0.6
1.2 1.3 1.4 1.6 2.3 4.0 5.6 9.7
11.2
0.9
Source: ICIS, Company websites, BCG analysis
Tota
l
Oth
ers
"Top 25 distributors"
2011 Revenues Overall market size based on market model Delta between market size and bottom-up sales of top 25
19% share of global top 5
Global State Chemical Distribution

11 Chemical Distribution - ANIQ Oct 2012 -Final.pptx
Brenntag is a top value creator in the overall chemical industry
Brenntag, a success history Stock performance
IPO´s media coverage Brenntag ´s stock performance vs. leading chemical manufacturers
Stock Brenntag BASF DuPont
Oct 1, 2012 BNR.DE 99.15 BAS.DE 55.96 DD 47.63
Source: ICIS Top 100 Chemical Distributors, Yahoo finance, Brenntag´s website & press releases
Percentage change since Brenntag´s IPO
Chemical Distribution Industry gaining more attention due to Brenntag´s IPO
• IPO in 2010 – beforehand owned by two sequential PE firms
• Complete exit of PE firm in several steps
Brenntag´s multiple levers of organics growth & acquisition strategy
• Example of acquisitions in 2012: – ISM/Salkat Group, Australia & New Zealand – The Treat-Em-Rite Corporation, Texas, USA
Brenntag Fulfils Investor´s Wishes, 17 Mar 2010
The Right Chemistry Between Brenntag and Investors – IPO a Success, 29 Mar 2010
Global State Chemical Distribution

12 Chemical Distribution - ANIQ Oct 2012 -Final.pptx
Agenda
What is the state, globally, of the chemical distribution market?
In particular, what is happening in Mexico and Latin America?
What global trends can forecast a brighter future for the Mexican Chemical Distribution market?

13 Chemical Distribution - ANIQ Oct 2012 -Final.pptx
80
60
40
20
0 2011
48
2010
43
2009
38
Asia and Latin America with high growth rates in chemical distribution
1. Incl. Western and Central & Eastern Europe 2. North America includes USA and Canada 3. Incl. Mexico Note: Small differences due to rounding Source: ICIS, chemagility, BCG analysis
World Europe1 North America2 Asia Pacific Latin America3 Middle East
80
60
40
20
0 2011
41
2010
39
2009
35
80
60
40
20
0 2011
14
2010
13
2009
12
80
60
40
20
0 2011
7
2010
6
2009
5
50
150
100
0 2011
164
200
2010
155
2009
138
20
0
80
60
40
2010
54
2011
54
2009
48
Market sizes in B$ Market sizes in B$ Market sizes in B$ Market sizes in B$ Market sizes in B$ Market sizes in B$
+6%
+8%
+9%
+18%
+12%
+10%
Mexican & LATAM markets

14 Chemical Distribution - ANIQ Oct 2012 -Final.pptx
Year Exports1 Imports2 Balance
2011 14.2 39.5 -25.4
2010 11.9 34.1 -22.2
2009 10.1 27.8 -17.7
Chemical trade between Latin America and other regions grew by more than 50 % since 2009 – significant net imports
1. Coverage: Includes processing zones 2. Coverage: Includes processing zones; Method of valuation: Imports are valued f.o.b. 3. Method of valuation: Imports are valued f.o.b. Source: World Trade Organization
Mexico Brazil LATAM
Year Exports Imports3 Balance
2011 15.1 41.8 -26.8
2010 12.2 32.3 -20.1
2009 10.5 25.3 -14.8
Year Exports Imports Balance
2011 55.6 154.2 -98.6
2010 44.7 124.4 -79.6
2009 39.2 99.9 -60.6
Billion USD, at current prices Billion USD, at current prices Billion USD, at current prices
Mexican & LATAM markets

15 Chemical Distribution - ANIQ Oct 2012 -Final.pptx
Market size 2011 USD B
Latin America with high fragmentation of the chemical distribution industry
Source: ICIS, chemagility, BCG analysis
Brenntag Univar Helm Nexeo Solutions Protea Chemicals Petrochem Middle East ICC Chemical REDA Chemicals Azelis M. Cassab Manuchar Grupo Pochteca IMCD Group Connell Brothers DKSH Prinova Other
8.6
17.3
3.5
8.3
1.1 61.2
54
10.3
4.4
5.5
2.9 2.0
74.8
92.0
14
7.5
Market share 2011 100%
40%
20%
0% 100% 80%
4.1
40% 20% 0%
7
7.1
6.2
5.3
2.7 4.3
74.5
60%
1.1 2.2
1.9 1.7 1.2
2.5 2.4 2.3
81.3
41 48
25.2% 38.8% 18.1% 8.0% Share of top 5 25.5%
Ranking Europe North America Latin America Asia – Pacific ME&A 1 Brenntag Brenntag Brenntag Brenntag Brenntag 2 Helm Helm quantiQ Helm ICC Chemical 3 Univar Univar M. Cassab ICC Chemical Protea Chemicals 4 Azelis Nexeo Solutions Manuchar Connell Brothers Petrochem Middle East 5 IMCD Group Prinova Grupo Pochteca DKSH REDA Chemicals
Mexican & LATAM markets

16 Chemical Distribution - ANIQ Oct 2012 -Final.pptx
Major regional differences in the market shares of the top 5 chemical distributors
Source: ICIS, Company press releases
Market shares and position
Market size (B$)
1
2
3
4
5
Top 5
Fragmented competitor land-scape with sizable gap between Brenntag and the top 2–5 Top 5 with lower market share than in North America
Gap between top 3 and followers Numerous national, medium-sized distributors Fragmented landscape
Very fragmented market landscape (not a homogeneous region, mostly local competitors)
Mexican & LATAM markets
Asia-Pacific
Helm
ICC Chemical Connell Brothers
DKSH
Brenntag
43.0
2010
2.5%
1.9%
1.7%
NA
0.7%
NA
48.0
2.2%
1.9%
1.7%
1.2%
1.1%
8.0%
2011
Europe
Brenntag
Helm
Univar
Azelis
IMCD Group
53.8
2010
9.7%
5.5%
3.5%
2.9%
2.1%
23.8%
54.0
10.3%
5.5%
4.4%
2.9%
2.0%
25.2%
2011
North America
Univar
Brenntag
Nexeo Solutions
Helm
Hydrite Chemical
39.0
2010
14.9%
8.3%
8.7%
3.7%
1.2%
36.7
41.0
17.3%
8.6%
8.3%
3.5%
1.1%
38.8%
2011
Latin America
Brenntag
quantiQ
M. Cassab
Manuchab
Grupo Pochteca
13.0
2010
7.4%
3.2%
2.8%
2.6%
1.9%
17.4%
14.0
7.5%
4.1%
2.5%
2.4%
2.3%
18.1%
2011

17 Chemical Distribution - ANIQ Oct 2012 -Final.pptx
High market fragmentation in chemical distribution in Latin America
1. Globally Harmonized System of Classification and Labeling Chemicals Sources: World Chemical Distributor Directory, www.chemagility.com, ICIS 2012 – Top 100 Chemical Distributors
Characteristics Latin America Market size US$ 14 Bn
Growth 2009-2011 (CAGR)
10%
Number of main Distributors
726
Top 10 Market Share 21%
Distribution Model(s) Chemical Distributors, Traders, Agents
Shipment Models Predominately Road
Suppliers / Principals Foreign / Domestic Producers
Regulatory Environment
Responsible Distribution – Brazil, Mexico. GHS1 implemented in most
major countries
Ranking Company Revenue2011 US$ M
1 Brenntag 1,046
2 quantiQ 572
3 M. Cassab 344
4 Manuchar 332
5 Grupo Pochteca 325
6 Bandeirante Brazmo 244
7 Indukern 144
8 Makeni 104
9 Univar 100
10 Quimisa 95
Mexican & LATAM markets

18 Chemical Distribution - ANIQ Oct 2012 -Final.pptx
Mexico still with a low share of chemical distribution vs. overall chemical market
1. Source: ICIS; BCG
Characteristics Mexico
Industry structure Highly fragmented • Few local & regional leaders with a large number of
smaller family businesses
Share of chemical distribution conducted via 3rd. party distributors, 2010
~ 8% 1
M&A activity, rationale: • Tier-1 (Global) distributors such as Brenntag and Univar looking for high growth rates outside developed nations, increasingly focusing on Asia-Pacific and Latin America
M&A activity, 2011 (case example): Purchasing company: Brenntag Purchased company: Amco International S.A.de C.V. Strategic rationale2: • Improve full-line portfolio and expand it into aroma
chemicals, essential oils and food ingredients
Market Outlook, 2013 – 2020: • Consolidation trend, improving margins • Opportunity for larger regional players seeking growth
through M&A • A push from suppliers and their customers for better
practices & raising standards • Streamlining and development of distribution channels
Mexican & LATAM markets
Share of chemical distribution in Europe is around 12% and 13-14% in the US

19 Chemical Distribution - ANIQ Oct 2012 -Final.pptx
Agenda
What is the state, globally, of the chemical distribution market?
In particular, what is happening in Mexico and Latin America?
What global trends can forecast a brighter future for the Mexican Chemical Distribution market?

20 Chemical Distribution - ANIQ Oct 2012 -Final.pptx
Key hypotheses for the market for chemical distribution in Latin America
Value chain perspective
Chemical distribution is a vital element of the overall chemical value chain – and needs to be recognized as such
HSEQ "Responsabilidad Integral" (Health, Safety, Environment, Quality) is essential for the "license to operate" for any chemical distributor
Consolidation Even higher fragmentation in Latin America than elsewhere – will lead to a significant consolidation
Institutionalization Strong drivers to institutionalize chemical distribution companies: The requirements of the producers, the overall value chain perspective, the consolidation
Growth ahead The share of third party distributors will present an over-proportional growth in Latin America
Industry Associations
Industry Associations in the chemical industry have a vital role in promoting HSEQ and institutionalization of business models from an overall value chain perspective
Mexican & LATAM markets
21 Chemical Distribution - ANIQ Oct 2012 -Final.pptx
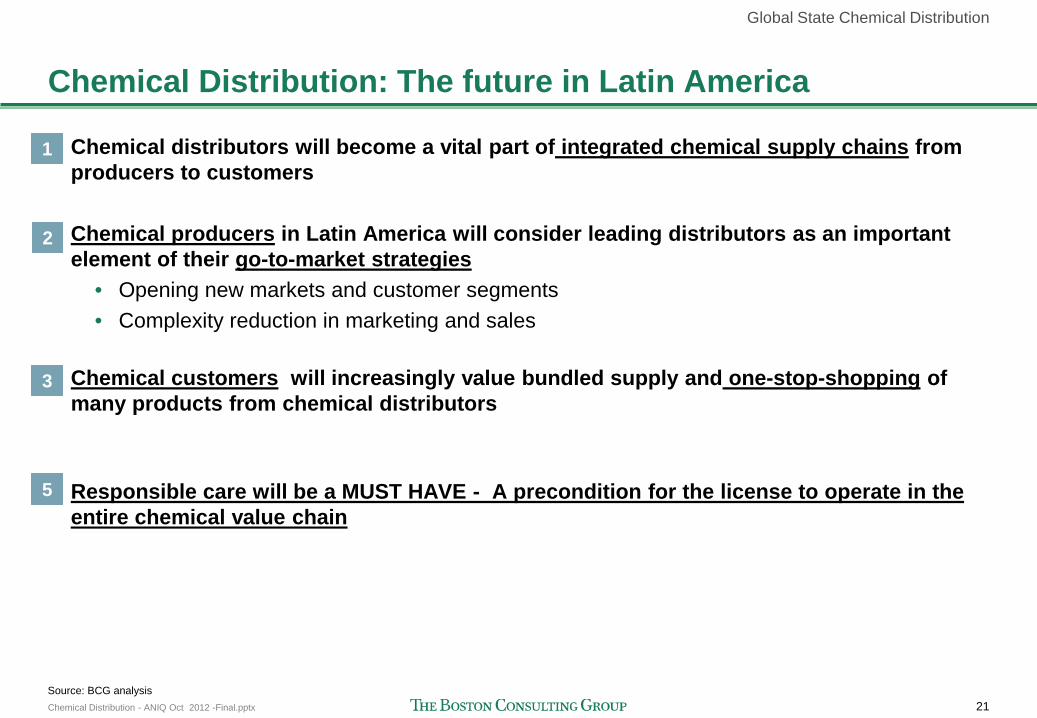
Chemical Distribution: The future in Latin America
Chemical distributors will become a vital part of integrated chemical supply chains from producers to customers Chemical producers in Latin America will consider leading distributors as an important element of their go-to-market strategies
• Opening new markets and customer segments • Complexity reduction in marketing and sales
Chemical customers will increasingly value bundled supply and one-stop-shopping of many products from chemical distributors
Responsible care will be a MUST HAVE - A precondition for the license to operate in the entire chemical value chain
1
2
3
5
Source: BCG analysis
Global State Chemical Distribution


