Check MK Roadmap40 17.10.15 How much would you like to see.... 17.10.15 A Check_MK rack1 with more...
41
1 17.10.15 17.10.15 Check_MK Roadmap
Transcript of Check MK Roadmap40 17.10.15 How much would you like to see.... 17.10.15 A Check_MK rack1 with more...

1
17.10.15
17.10.15
Check_MK Roadmap

2
17.10.15
17.10.15
Stuff we already work on

3
17.10.15
17.10.15
Check_MK Package Manager

4
17.10.15
17.10.15
Package Manager
Current way to work with MKPs:
OMD[mysite]:~ $ mkp install foo-1.2.mkp
Future way: all operations via WATO● install, remove, list, show details● create packages!● Maybe even:
access to Check_MK Exchange!

5
17.10.15
17.10.15
Automatic Agent Updates

6
17.10.15
17.10.15
Automatic Agent Updates
● Agent Bakery bakes agents● Admin signs und publishes them● Agents poll for updates...● ...check the signature....● ...and update themselves● Will be available for Linux and Windows

7
17.10.15
17.10.15
And finally...

8
17.10.15
17.10.15Hell...

9
17.10.15
17.10.15has frozen over!

10
17.10.15
17.10.15

11
17.10.15
17.10.15Check_MK supports

12
17.10.15
17.10.15
IPv6
● Hosts can have v4, v6 or both addresses● Real dual-stack monitoring● „Primary address“:
● is used for accessing the agent
● „Secondary address“:● is monitored by extra PING service
● Works with Check_MK-Agent, SNMP, PING and some active checks

13
17.10.15
17.10.15
One second resultion for metrics

14
17.10.15
17.10.15
One-second RRD updates
● Linux and Windows agent get new plugin● active updates of some crucial metrics:
● CPU load, utilization● Windows performance counters● etc.
● Updates are done by agent via UDP● New daemon on Check_MK receives these...● ...and updates RRDs of existing services

15
17.10.15
17.10.15
Plans and ideas for...

16
17.10.15
17.10.15 ...the future!

17
17.10.15
17.10.15
Configuration in MKPs

18
17.10.15
17.10.15
Configuration in MKPs
Imagine you could package:● Event Console rule packs● Collections of active checks● Tuned global settings● Predefined host tag groups
→ A monitoring template

19
17.10.15
17.10.15
Configuration in MKPs
Organized in layers:
Factory Settings
MKP Config package
local configuration
Ord
er o
f pre
cedence

20
17.10.15
17.10.15
→ Configuration MKPs could be updated without damage
in the local configuration

21
17.10.15
17.10.15● New style of central configuration● Without central Multisite!● Interesting for loosely connected
sites● or very large setups

22
17.10.15
17.10.15
Ultrafasttm config generation
23
17.10.15
17.10.15
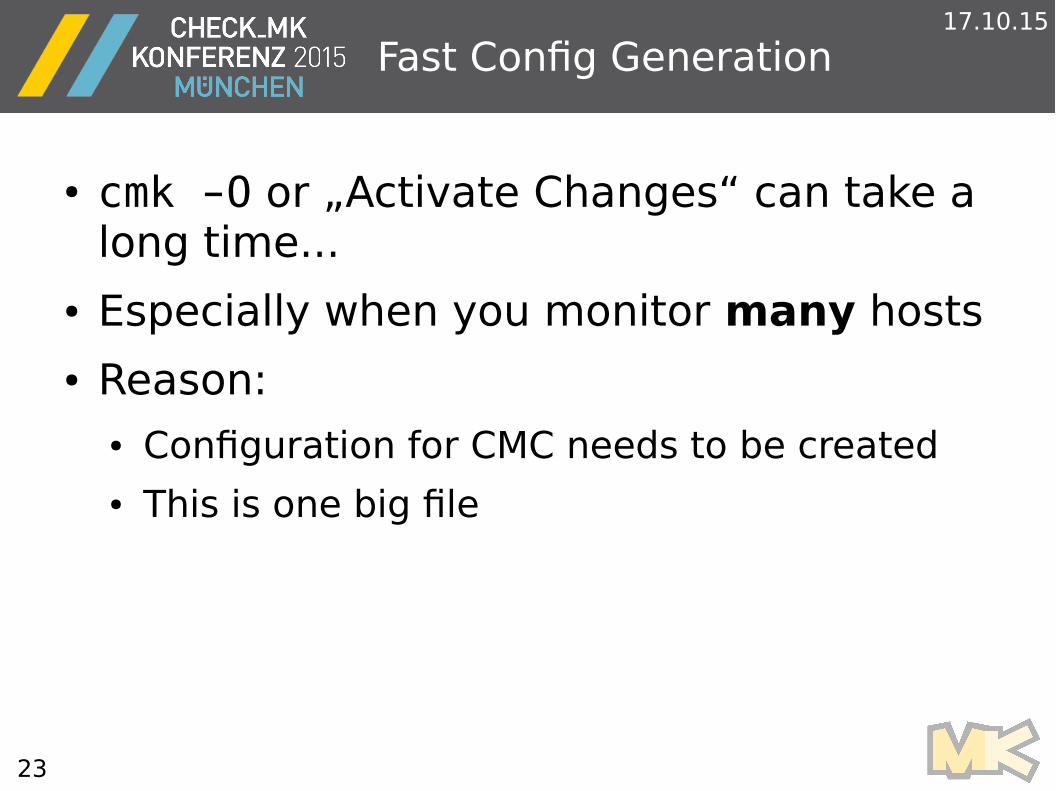
Fast Config Generation
● cmk -O or „Activate Changes“ can take a long time...
● Especially when you monitor many hosts● Reason:
● Configuration for CMC needs to be created● This is one big file

24
17.10.15
17.10.15Possible solution:● Split up into one file per folder● After changes to a host just update that
file● ... and do this immediately● shouldn't take too long● → „Activate Changes“ would take no time
25
17.10.15
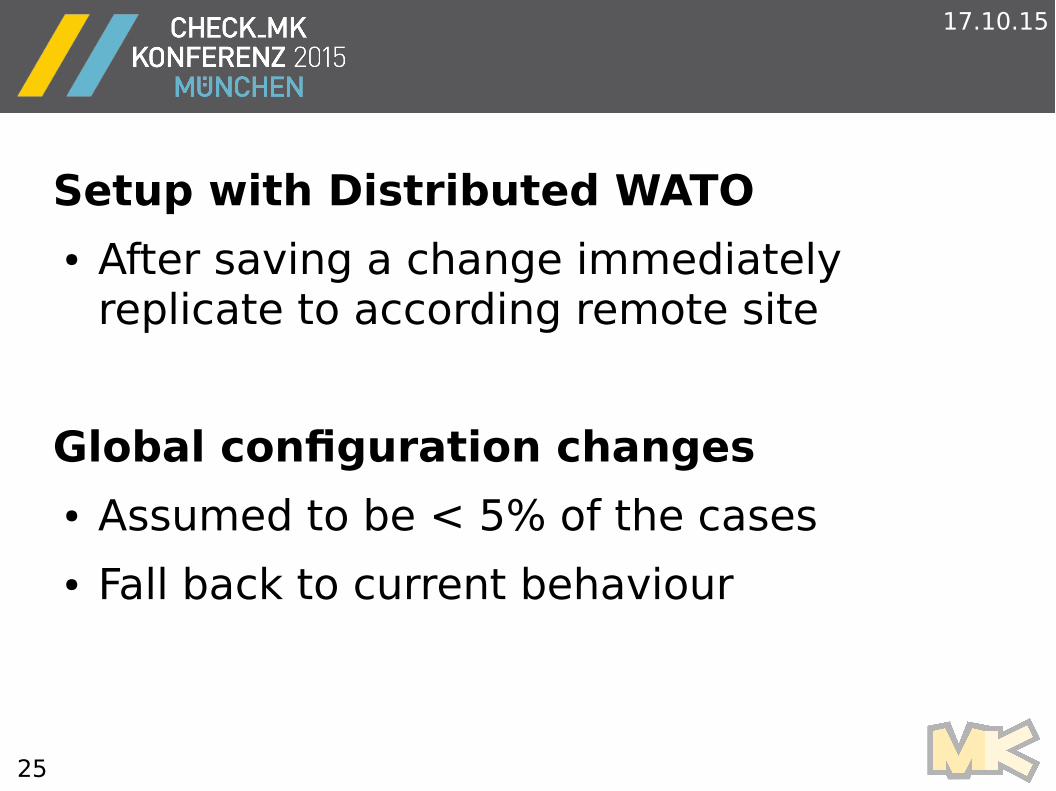
17.10.15Setup with Distributed WATO● After saving a change immediately
replicate to according remote site
Global configuration changes● Assumed to be < 5% of the cases● Fall back to current behaviour

26
17.10.15
17.10.15Managed Services EditionCME
27
17.10.15
17.10.15
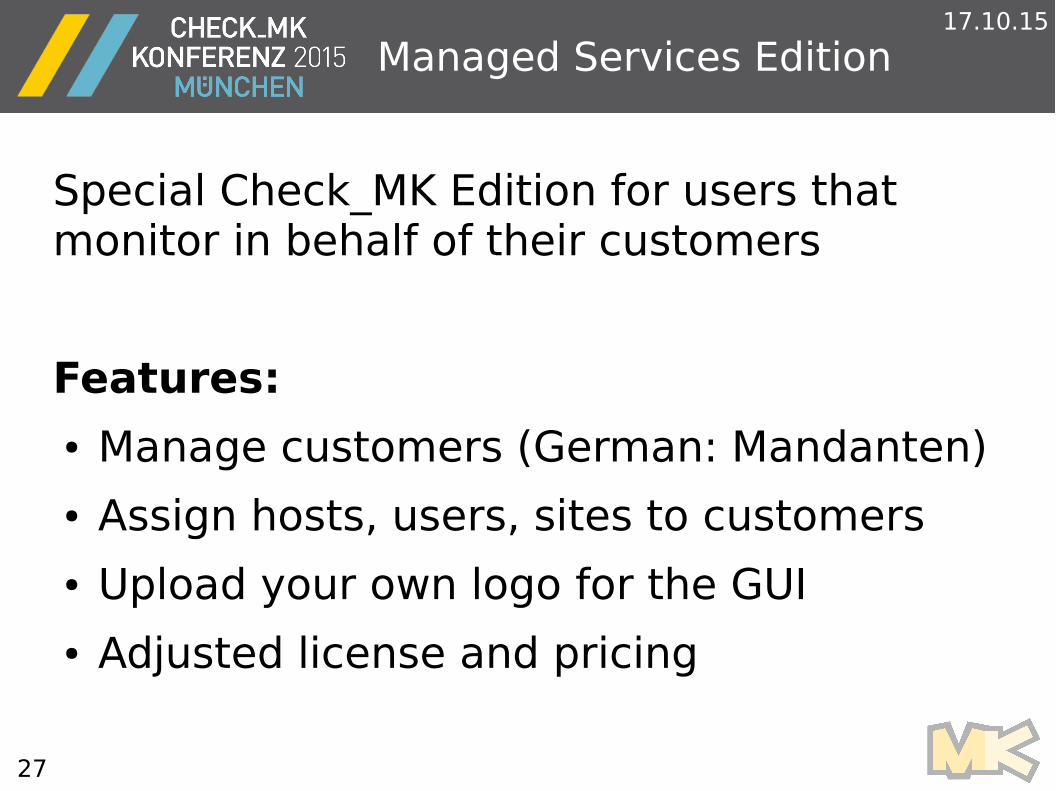
Managed Services Edition
Special Check_MK Edition for users that monitor in behalf of their customers
Features:● Manage customers (German: Mandanten)● Assign hosts, users, sites to customers● Upload your own logo for the GUI● Adjusted license and pricing

28
17.10.15
17.10.15More flexible graphs

29
17.10.15
17.10.15Current situation:● graph templates are hard coded● and can only show one service
Plan:● interactive graph editor● graphs spanning multiple services

30
17.10.15
17.10.15
More flexible graphs
Step 1
Interactive editing of graph templates ● Add/remove metrics from service● Select MAX / MIN / AVERAGE● Layout-style: LINE / AREA / STACK● Computations (used = total - free)● Derived scalars (90% percentile)

31
17.10.15
17.10.15Customization similar to views:● Each user can do own customizations● Admin users can publish their templates

32
17.10.15
17.10.15
Freeform Graphs
Step 2
Freeform graphs● Use metrics from any host or service● These are kind of global graphs● Can be put into reports or dashboards

33
17.10.15
17.10.15
Multi-Service-Graphs
Step 3
Multi-Service-Graphs
1. Select multiple similar services(e.g. HTTP checks of hosts from a pool)
2. Klick on Graphs
3. Get all curves in one graph

34
17.10.15
17.10.15
Multi-Service-Graphs
Possible operations:● Sum● Stack (using different colors)● Lines● Average
35
17.10.15
17.10.15
Multi-Service-Graphs
Usages:● Which of the servers has the worst
response time?● How grows the combined space of all
selected file systems?● Show switch port statistics for port 1+2
(in case of trunking)

36
17.10.15
17.10.15Numeric access to historic data

37
17.10.15
17.10.15Current situation:● metric data is stored for years● only access via time series graphs
Plan:● derive scalar numbers...● ... and show these in GUI tables● ... also available for export via CSV / JSON

38
17.10.15
17.10.15Example● I have 150 ESX hosts● Which of them are the least in use?
Solution● Use service „CPU utilization“ from ESX-
Monitoring● Create column „Average over last month“● Create view and sort by this column

39
17.10.15
17.10.15
Some Questions to the public

40
17.10.15
17.10.15How much would you like to see....● A Check_MK rack1 with more CPU, Mem, IO● A small/cheap Check_MK Appliance for setups
with many (hundreds or thousands) of sites● Check_MK virt1 in Amazon-Cloud or similar
clouds● IPv6 Support in the Appliance● Central Management of Check_MK Appliances● Netflow support

41
17.10.15
17.10.15The End
See you again next year!


![Erweiterungen schreiben für Check MK - CLT2018 · Linux höchstpersönlich. Erweiterungen für Check_MK [Chemnitzer Linux-Tage 2017] Robert Sander](https://static.fdocuments.net/doc/165x107/5d4d591a88c993a90e8bc4ee/erweiterungen-schreiben-fuer-check-mk-clt2018-linux-hoechstpersoenlich-erweiterungen.jpg)