a b c - media.nature.com · TIA1 were detected by immunofluorescence. (c) Ribosome-nonbinding...
8
SUPPLEMENTARY INFORMATION WWW.NATURE.COM/NATURECELLBIOLOGY 1 Figure S1 RACK1 binds to MTK1. (a) Proteins associated with MTK1. Cytoplasmic extracts were prepared from COS-7 cells transfected with a Flag- MTK1 expression vector, as well as from untransfected COS-7 cells (control). Extracts were immunoprecipitated using a Flag antibody. Polypeptides present in the precipitates were separated by 10.5% SDS-PAGE, and visualized by silver staining. The bands that are found only in the Flag-MTK1 transfected cells were excised from the gel, and identified by LC-MS-MS. In addition to RACK1 and actin, the ribosomal proteins S2, S3, and S6 were detected. Flag-MTK1 (ca 180 kDa) is above the limit of this panel. (b) The MTK1 MAPKKK, but not the TAK1 MAPKKK, binds to endogenous RACK1. Myc-tagged MTK1 (Myc-MTK1) or Myc-TAK1 was immunoprecipitated from transiently transfected COS-7 cells, and co-purified endogenous RACK1 was detected by immunoblotting (top row). (c) No MAPKK bound to endogenous RACK1. Flag-tagged MAPKKs (MEK1, MKK3/6/4/7), as well as the positive control Flag-MTK1, were individually expressed in COS-7 cells. Flag-tagged MAPKKs, or Flag-MTK1, were immunoprecipitated from the cell extracts, and the co-precipitated endogenous RACK1 was assayed by immunoblotting (top row). (d) No MAPK was found to bind endogenous RACK1. HA-tagged MAPKs (p38α, JNK1, ERK2) were transiently transfected into COS-7 cells. HA-tagged MAPKs were immunoprecipitated from the cell extracts, and co- precipitated endogenous RACK1 was assayed by immunoblotting (top panel). (b-d) The middle and bottom rows show the levels of protein expression. (e) Schematic structure of RACK1. RACK1 consists of seven WD40 repeats. Myc-RACK1 constructs in which one or more WD40 repeats are deleted were used in (f) and (g). (f) COS-7 cells were transiently co-transfected with Flag- MTK1 and one of Myc-RACK1 deletion mutants. Immunoprecipitated Flag- MTK1 was probed for co-precipitating Myc-RACK1 (top row). (g) COS-7 cells were transfected as indicated, and immunoprecipitated Flag-MTK1-N was probed for co-precipitating proteins. For both (f) and (g), the levels of protein expression are shown in the lower rows. a c b Myc-MTK1 Myc-TAK1 IP : Myc IB : RACK1 RACK1 Myc + + - - - - 37 181 37 kDa IP : Flag IB : RACK1 RACK1 Flag MTK1 MKK7 MEK1 MKK3 MKK4 MKK6 Flag-vector 37 37 48 kDa control Flag-MTK1 actin RACK1 kDa 48 37 25 d 48 136 180 221 269 317 93 1 2 3 4 5 6 7 WD40 repeat RACK1 e f g kDa 181 IP: Flag, IB: Myc IP: Flag, IB: Flag Myc Flag-MTK1 Myc-RACK1 ! 1 ! 1-3 ! 7 ! 6-7 ! 5-7 ! 4 + +++ + + + + - - WT WT 37 37 Myc-RACK1 Flag-MTK1-N Myc-MTK1-N IB: Flag IB: Myc Myc-MTK1-N Myc-RACK1 IP: Flag Lysate + + + + + + + - ++ ++ WT ! 4 ! 1-3 ! 5-7 -- 115 115 115 37 kDa RACK1 HA p38 JNK ERK HA-vector IP : HA IB : RACK1 kDa 37 37 46 © 2008 Macmillan Publishers Limited. All rights reserved.
-
Upload
phungkhuong -
Category
Documents
-
view
219 -
download
0
Transcript of a b c - media.nature.com · TIA1 were detected by immunofluorescence. (c) Ribosome-nonbinding...

s u p p l e m e n ta ry i n f o r m at i o n
www.nature.com/naturecellbiology 1
Figure S1 RACK1 binds to MTK1. (a) Proteins associated with MTK1. Cytoplasmic extracts were prepared from COS-7 cells transfected with a Flag-MTK1 expression vector, as well as from untransfected COS-7 cells (control). Extracts were immunoprecipitated using a Flag antibody. Polypeptides present in the precipitates were separated by 10.5% SDS-PAGE, and visualized by silver staining. The bands that are found only in the Flag-MTK1 transfected cells were excised from the gel, and identified by LC-MS-MS. In addition to RACK1 and actin, the ribosomal proteins S2, S3, and S6 were detected. Flag-MTK1 (ca 180 kDa) is above the limit of this panel. (b) The MTK1 MAPKKK, but not the TAK1 MAPKKK, binds to endogenous RACK1. Myc-tagged MTK1 (Myc-MTK1) or Myc-TAK1 was immunoprecipitated from transiently transfected COS-7 cells, and co-purified endogenous RACK1 was detected by immunoblotting (top row). (c) No MAPKK bound to endogenous RACK1. Flag-tagged MAPKKs (MEK1, MKK3/6/4/7), as well as the positive control Flag-MTK1, were individually expressed in COS-7 cells. Flag-tagged
MAPKKs, or Flag-MTK1, were immunoprecipitated from the cell extracts, and the co-precipitated endogenous RACK1 was assayed by immunoblotting (top row). (d) No MAPK was found to bind endogenous RACK1. HA-tagged MAPKs (p38α, JNK1, ERK2) were transiently transfected into COS-7 cells. HA-tagged MAPKs were immunoprecipitated from the cell extracts, and co-precipitated endogenous RACK1 was assayed by immunoblotting (top panel). (b-d) The middle and bottom rows show the levels of protein expression. (e) Schematic structure of RACK1. RACK1 consists of seven WD40 repeats. Myc-RACK1 constructs in which one or more WD40 repeats are deleted were used in (f) and (g). (f) COS-7 cells were transiently co-transfected with Flag-MTK1 and one of Myc-RACK1 deletion mutants. Immunoprecipitated Flag-MTK1 was probed for co-precipitating Myc-RACK1 (top row). (g) COS-7 cells were transfected as indicated, and immunoprecipitated Flag-MTK1-N was probed for co-precipitating proteins. For both (f) and (g), the levels of protein expression are shown in the lower rows.
a cbMyc-MTK1
Myc-TAK1
IP : MycIB : RACK1
RACK1
Myc
++-
- --
37
181
37
kDa
IP : Flag
IB : RACK1
RACK1
Flag
MTK
1
MK
K7
ME
K1
MK
K3
MK
K4
MK
K6
Flag-vector37
37
48
kDacontro
l
Flag-MTK1
actin
RACK1
kDa
48
37
25
d
48 136
180
221
269
317
93
1 2 3 4 5 6 7
WD40 repeat
RACK1
e
f g
kDa
181
IP: Flag, IB: Myc
IP: Flag, IB: Flag
Myc
Flag-MTK1
Myc-RACK1 ! 1
! 1
-3! 7
! 6
-7! 5
-7! 4
+ + + +++++-- W
T
WT
37
37
Myc-RACK1
Flag-MTK1-N
Myc-MTK1-N
IB: Flag
IB: Myc
Myc-MTK1-N
Myc-RACK1
IP: Flag
Lysate
+ ++ +++ +-
+ ++ +
WT
! 4!
1-3
! 5-
7
- -
115
115
115
37
kDa
RACK1
HA
p38
JNK
ER
K
HA-vector
IP : HA
IB : RACK1
kDa
37
37
46
Figure S1
© 2008 Macmillan Publishers Limited. All rights reserved.

s u p p l e m e n ta ry i n f o r m at i o n
2 www.nature.com/naturecellbiology
Figure S2 (a and b) RACK1 knock-down inhibits MTK1 activation. M57 cells were transfected with either a control or a RACK1 shRNAi expression vector. After 72 h incubation with puromycin, the cells were stimulated with 1 mM H2O2 for 90 min (a), or 50 ng/ml TNFα for 120 min (b). Activation-associated phosphorylation of Myc-MTK1was detected by immunoblotting using anti-P-Thr1493. The fold activation of MTK1 was determined and is shown in the bar graphs. (c) RACK1 knock-down does not affect TAK1 activation by osmotic stress. HEK293 cells were transfected with a RACK1 shRNAi expression vector. After a 36 h incubation, the cells were
super-transfected with Myc-TAK1, and incubated for an additional 36 h. The cells were stimulated with 0.5 M sorbitol, and activation-associated phosphorylation of Myc-TAK1 was detected by immunoblotting. Fold activation is shown in the bar graph below. (d and e) RACK1 expression does not affect the interaction between MTK1-N and MTK1-C fragments. COS-7 cells were transiently transfected with Myc-MTK1-N, Flag-MTK1-C, GADD45β, and HA-RACK1 (d) or shRNAi-RACK1 (e) as indicated. Flag-MTK1-N was immunoprecipitated, and co-precipitated Myc-MTK1-C was detected by immunoblotting (top rows).
a b
0
0.5
1.0
1.5
2.0
2.5
Fold
activation
RACK1shRNAi Control
- + - +Sorbitol
Myc-TAK1
P-TAK1
RACK1
actin
82
8237
37
kDa
c
ed
Myc-MTK1-C
Flag-MTK1-N
Myc-MTK1-C
HA-RACK1
GADD45!
Lysate
IP: Flag
Myc-MTK1-C
Flag-MTK1-N
HA-RACK1
GADD45!
+ ++ +++ +-
++
- - -- - -
kDa48
115
48
37
18 RACK1
GADD45!
Myc-MTK1-C
Flag-MTK1-N
Myc-MTK1-CIP: Flag
Lysate
shRNAi-RACK1
GADD45!
Flag-MTK1-N
Myc-MTK1-C +
- - +- - +
+++
+
++
+
+
+
kDa
48
115
48
37
18
- + - +
Control RACK1shRNAi
kDa
181
18137
37
TNF"
P-MTK1
Myc-MTK1
RACK1
actin
0
2
4
6
8
Fold
activation
- + - +
Control RACK1shRNAi
P-MTK1
Myc-MTK1
RACK1
actin
H2O2 kDa
181
18137
37
0
0.5
1.0
1.5
2.0
Fold
activation
Figure S2
© 2008 Macmillan Publishers Limited. All rights reserved.

s u p p l e m e n ta ry i n f o r m at i o n
www.nature.com/naturecellbiology 3
Figure S3 (a) Subcellular localization of endogenous RACK1 (red) and endogenous MTK1 (green) before (-) and after (AsO2
-) arsenite treatment. HeLa cells were treated with 0.5 mM arsenite for 50 min and endogenous RACK1 and MTK1 were detected by immunostaining. (b and c) Recruitment of RACK1 into cytoplasmic stress granules (SGs) by arsenite. (b) HeLa cells
were transfected with DsRed-RACK1, and, after 36 h, treated with 0.5 mM arsenite. RACK1 localization was visualized by the DsRed fluorescence. (c) The intensity of the DsRed fluorescence at four SG-like spots and at four cytoplasmic areas were measured. The ratio of the intensity at SGs and in the cytoplasm was calculated. The scale bars represent 10 µm.
AsO2-
-
MTK1RACK1 Mergea
b c
SG
s /
Cyto
pla
sm
0
1
3
2
4
0 10 20 30 40 50
Time (min)
Arsenite: 0.5 mM
0 min
50 min
10 min
20 min
15 min
25 min 30 min
35 min 40 min
Figure S3
© 2008 Macmillan Publishers Limited. All rights reserved.
s u p p l e m e n ta ry i n f o r m at i o n
4 www.nature.com/naturecellbiology
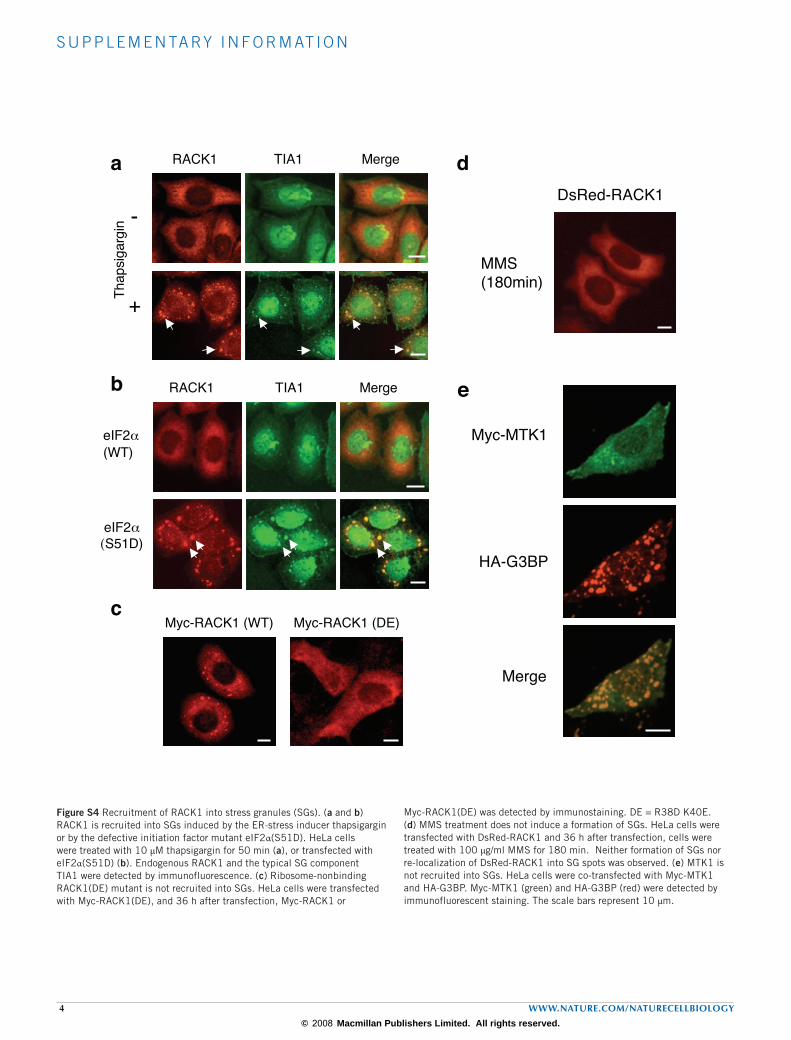
Figure S4 Recruitment of RACK1 into stress granules (SGs). (a and b) RACK1 is recruited into SGs induced by the ER-stress inducer thapsigargin or by the defective initiation factor mutant eIF2α(S51D). HeLa cells were treated with 10 µM thapsigargin for 50 min (a), or transfected with eIF2α(S51D) (b). Endogenous RACK1 and the typical SG component TIA1 were detected by immunofluorescence. (c) Ribosome-nonbinding RACK1(DE) mutant is not recruited into SGs. HeLa cells were transfected with Myc-RACK1(DE), and 36 h after transfection, Myc-RACK1 or
Myc-RACK1(DE) was detected by immunostaining. DE = R38D K40E. (d) MMS treatment does not induce a formation of SGs. HeLa cells were transfected with DsRed-RACK1 and 36 h after transfection, cells were treated with 100 µg/ml MMS for 180 min. Neither formation of SGs nor re-localization of DsRed-RACK1 into SG spots was observed. (e) MTK1 is not recruited into SGs. HeLa cells were co-transfected with Myc-MTK1 and HA-G3BP. Myc-MTK1 (green) and HA-G3BP (red) were detected by immunofluorescent staining. The scale bars represent 10 µm.
b
c
e
da
Thapsig
arg
in
RACK1 TIA1 Merge
-
+
eIF2!
(WT)
RACK1 TIA1 Merge
eIF2!
(S51D)
Myc-RACK1 (WT) Myc-RACK1 (DE)
DsRed-RACK1
MMS (180min)
Myc-MTK1
HA-G3BP
Merge
Figure S4
© 2008 Macmillan Publishers Limited. All rights reserved.

s u p p l e m e n ta ry i n f o r m at i o n
www.nature.com/naturecellbiology 5
Figure S5 (a and b) G3BP-mediated SG formation suppresses MTK1 activation. (a) HeLa cells were transfected as indicated. After a 36 h incubation, immunoprecipitated Myc-MTK1 was probed for activation-associated phosphorylation (top row). (b) COS-7 cells were transfected as indicated. After a 36 h incubation, Myc-MTK1 was immunoprecipitated and probed for co-precipitating GADD45β (top row). (c-e) Arsenite pretreatment suppresses MTK1 activation by MMS. (c) M57 cells were treated with 0.5 mM arsenite. Immunoprecipitated Myc-MTK1 was probed
for activation-associated phosphorylation of MTK1. (d) M57 cells were pretreated with arsenite for 30 min followed by a 3 h treatment with MMS as indicated. Immunoprecipitated Myc-MTK1 was probed for activation-associated phosphorylation of MTK1 at T1493 (top row). (e) HEK293 cells were pretreated with arsenite for 30 min followed by a 5 h treatment with MMS as indicated. Immunoprecipitated endogenous MTK1 was probed for activation-associated phosphorylation at T1493 (top row). For (a-e), the levels of protein expression are shown in the lower rows.
ba
P-MTK1
Myc-MTK1
Myc-GADD45!
GFP-G3BP
Myc-MTK1
Myc-GADD45!
GFP-G3BP
+
++
--+
-+
+ -
++
kDa
181
181
25
82Lysate
IP: MycIB: GADD45!
GADD45!
GFP-G3BP
Myc-MTK1
Myc-MTK1
GFP-G3BP
GADD45!
+
++
--+
-+
+ -
++
kDa
18
181
18
82
c
d e
P-MTK1
Myc-MTK1
MMS
Arsenite --
--+
+ ++
kDa
181
181
P-MTK1
MTK1
MMS
Arsenite --
--+
+ ++
kDa181
181
Phospho-MTK1
Myc-MTK1
Arsenite 0 15 30 45 60 905 (min)
181
181
kDa
Figure S5
© 2008 Macmillan Publishers Limited. All rights reserved.
s u p p l e m e n ta ry i n f o r m at i o n
6 www.nature.com/naturecellbiology
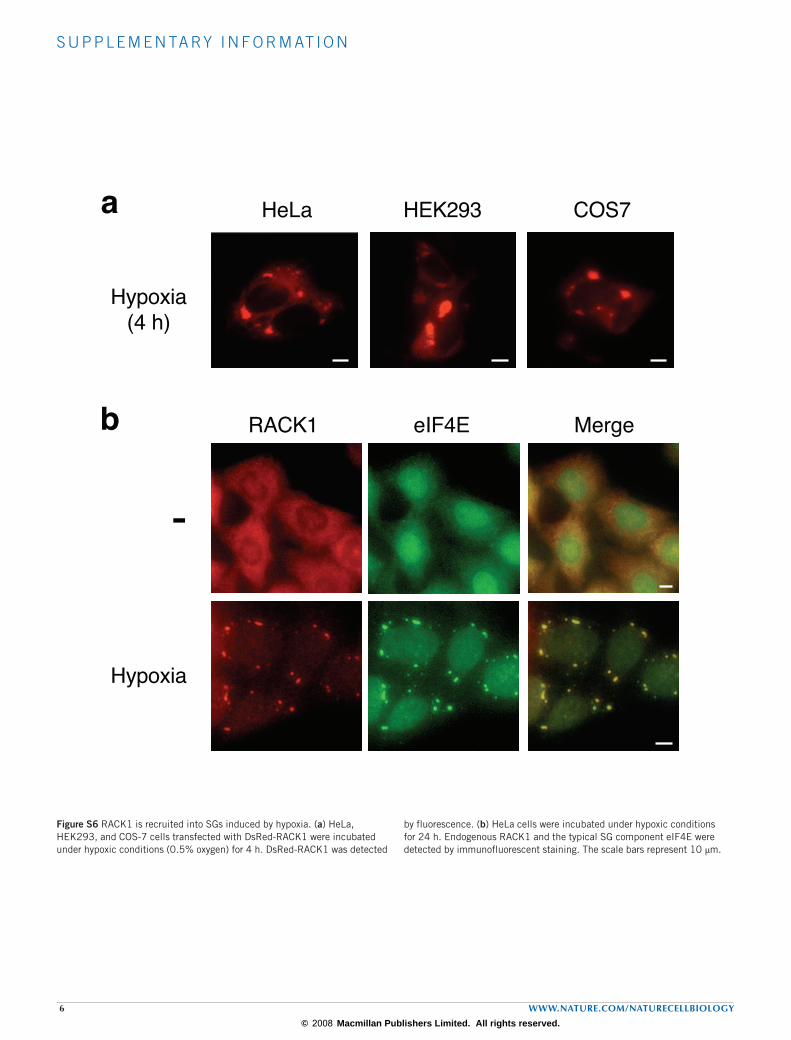
Figure S6 RACK1 is recruited into SGs induced by hypoxia. (a) HeLa, HEK293, and COS-7 cells transfected with DsRed-RACK1 were incubated under hypoxic conditions (0.5% oxygen) for 4 h. DsRed-RACK1 was detected
by fluorescence. (b) HeLa cells were incubated under hypoxic conditions for 24 h. Endogenous RACK1 and the typical SG component eIF4E were detected by immunofluorescent staining. The scale bars represent 10 µm.
a
b
HEK293 COS7
Hypoxia(4 h)
HeLa
MergeeIF4ERACK1
-
Hypoxia
Figure S6
© 2008 Macmillan Publishers Limited. All rights reserved.

s u p p l e m e n ta ry i n f o r m at i o n
www.nature.com/naturecellbiology 7
Figure S7 (a-d) SG formation by hypoxia inhibits etoposide-induced apoptosis. HEK293 cells (a and b), or HEK293 cells stably expressing RACK1(DE) (c and d), were treated with 50 µM etoposide and incubated either under normoxia (-) or hypoxia (+). After a 24 h incubation, cells were stained with Annexin V-Cy3, and visualized by fluorescence microscopy. About 500 cells were scored to calculate the percentage of apoptotic cells. (e and f) RACK1 knock-down suppresses etoposide-induced apoptosis in HEK293 cells. (e) HEK293 cells were transfected with a pSIH-H1-copGFP expression vector for RACK1 shRNAi (or a control
vector for Luciferase RNAi). After a 24 h incubation, the cells were super-transfected with the same vector and incubated for an additional 24 h. Cells were then treated with 50 µM etoposide for 24 h. Cells that were transfected by the shRNAi vectors were visualized by GFP expression, whereas apoptotic cells were visualized by Annexin V-Cy3 staining. (f) Percentage of apoptotic cells among GFP-positive cells were calculated. Error bars indicate s.e.m. of three independent experiments. RACK1 knock-down by the shRNAi vector was confirmed by western blotting (data not shown). The scale bars represent 50 µm.
c d
a b
Ap
op
totic c
ells
(%
)
0
10
20
30
+ +- --
Etoposide
Hypoxia + +-- -- -+
+ ++
Etoposide
Hypoxia
Phasecontrast
Annexin V
Ap
op
totic c
ells
(%
)
0
10
20
30+ RACK1
(DE)
+ +- --
Etoposide
Hypoxia + +-- -- -+
+ ++
Phasecontrast
Annexin V
Etoposide
Hypoxia
0
10
20
30
Apopto
tic c
ells
(%
)shRNAi-Control ++ - -shRNAi-RACK1 - + +-
Etoposide + +- -e f
Etoposide
shRNAi-Control
shRNAi-RACK1
GFP
Annexin V
- - + +- -+ +
- -+ +
Figure S7
© 2008 Macmillan Publishers Limited. All rights reserved.
s u p p l e m e n ta ry i n f o r m at i o n
8 www.nature.com/naturecellbiology
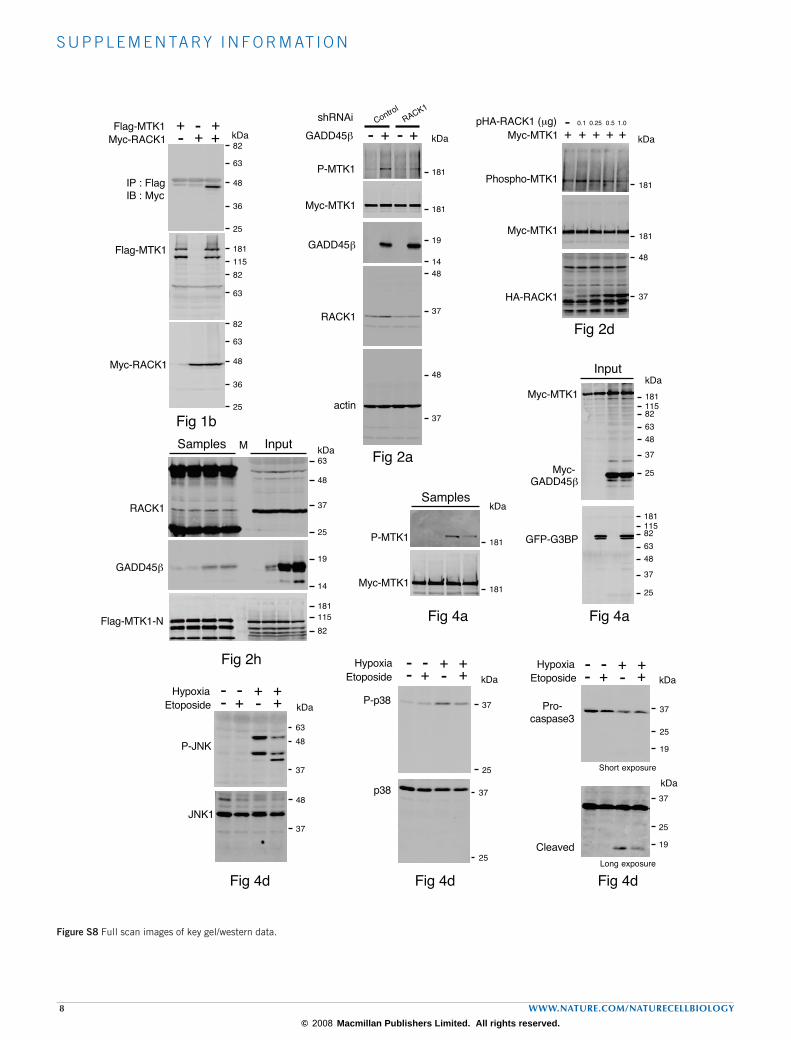
Figure S8 Full scan images of key gel/western data.
Myc-RACK1
Flag-MTK1
Myc-RACK1
Flag-MTK1
IP : FlagIB : Myc
-++
+ +-
82
kDa
63
48
36
25
82
63
48
36
25
181
115
82
63
Fig 1b
kDa
Myc-MTK1
GADD45!
GADD45!
P-MTK1
RACK1
actin
shRNAi Control
- + - +RACK1
181
181
19
14
37
48
37
48
Fig 2a
Flag-MTK1-N
GADD45!
Samples
RACK1
63
48
37
25
19
14
115
181
82
M InputkDa
Fig 2h
Fig 2d
Phospho-MTK1
Myc-MTK1
pHA-RACK1 (µg)
HA-RACK1
Myc-MTK1- 0.1 0.25 0.5 1.0
+ + ++ + kDa
181
48
181
37
Fig 4a
P-MTK1
Myc-MTK1
SampleskDa
181
181
GFP-G3BP
Myc- GADD45!
InputkDa
Myc-MTK1
82
63
37
25
181115
48
82
63
37
25
181115
48
Fig 4a
Fig 4d
P-p38
Etoposide
Hypoxia + +- -+- +- kDa
37
25
p38 37
25
Fig 4d
JNK1
P-JNK
+ +- -+- +-
63
48
37
kDa
48
37
Etoposide
Hypoxia
Fig 4d
Long exposure
37
kDa
Pro-caspase3
+ +- -+- +-
25
19
37
Short exposure
kDa
Cleaved
25
19
Etoposide
Hypoxia
Figure S8
© 2008 Macmillan Publishers Limited. All rights reserved.
![Review Article Roles of Rack1 Proteins in Fungal Pathogenesisdownloads.hindawi.com/journals/bmri/2016/4130376.pdf · human, animal, plant, and ecosystem health [, ]. Particu- ...](https://static.fdocuments.net/doc/165x107/5f7f8c3ba616065c2d1af2b9/review-article-roles-of-rack1-proteins-in-fungal-p-human-animal-plant-and-ecosystem.jpg)