
Characterization of complex polymer systems by MALDI Mass ...
71
Characterization of complex polymer systems by MALDI Mass Spectrometry” Concetto Puglisi National Research Council Institute of Polymers, Composites and Biomaterials Catania, Italy
Transcript of Characterization of complex polymer systems by MALDI Mass ...

Characterization of complex polymer systems by MALDI Mass Spectrometry”
Concetto Puglisi
National Research Council Institute of Polymers, Composites and Biomaterials
Catania, Italy
Mass Spectrometry
Ions Separation Ions Production
Ions Detection
Ions Separation Magnetic/Electric Field Time of Flight Quadrupole Ion Trap FT Ions-cyclotron resonance
Ion Detectors Electron Multiplier Array Detector
Ions Production Gas Phase Techniques (EI,CI,NCI) Desorption Techniques
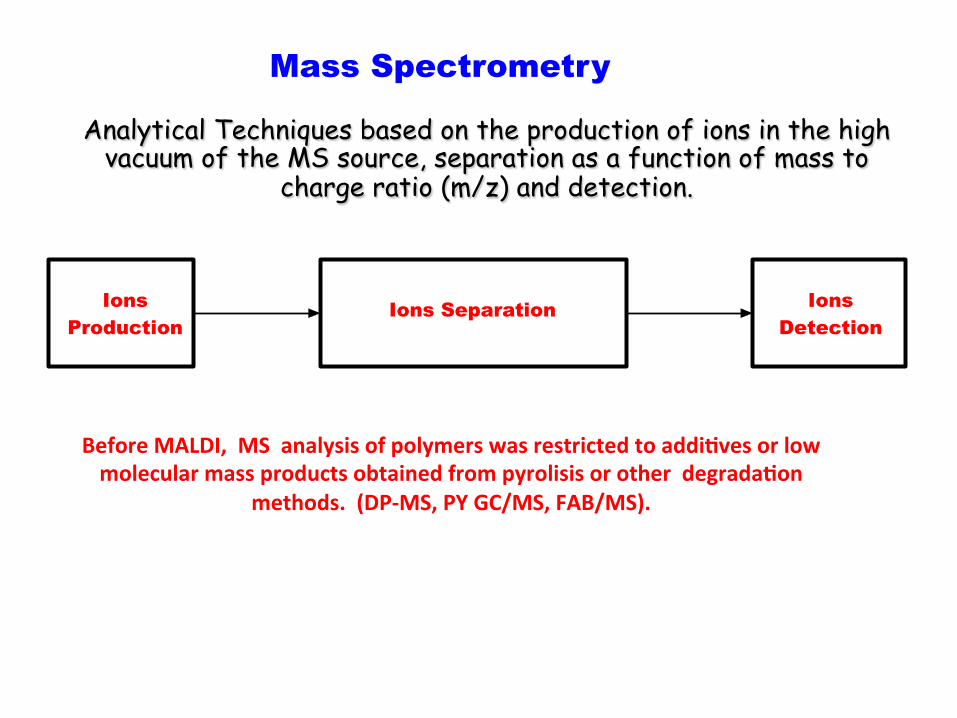
Mass Spectrometry
Analytical Techniques based on the production of ions in the high vacuum of the MS source, separation as a function of mass to
charge ratio (m/z) and detection.
Before MALDI, MS analysis of polymers was restricted to addi:ves or low molecular mass products obtained from pyrolisis or other degrada:on
methods. (DP-‐MS, PY GC/MS, FAB/MS).


Chemistry Nobel Prize 2001
John B. Fenn Koichi Tanaka
R.Abate, A. Ballistreri, G. Montaudo, D. Garozzo, G. Impallomeni, G. Critchley, K. Tanaka, Rapid Communica>on in Mass Spectrometry, vol. 7, 1033-‐1036 (1993)
Mass Spectrometry
Ions Separation Ions Production
Ions Detection
Ions Separation Magnetic/Electric Field Time of Flight Quadrupole Ion Trap FT Ions-cyclotron resonance
Ion Detectors Electron Multiplier Array Detector
Ions Production Gas Phase Techniques (EI,CI,NCI) Desorption Techniques
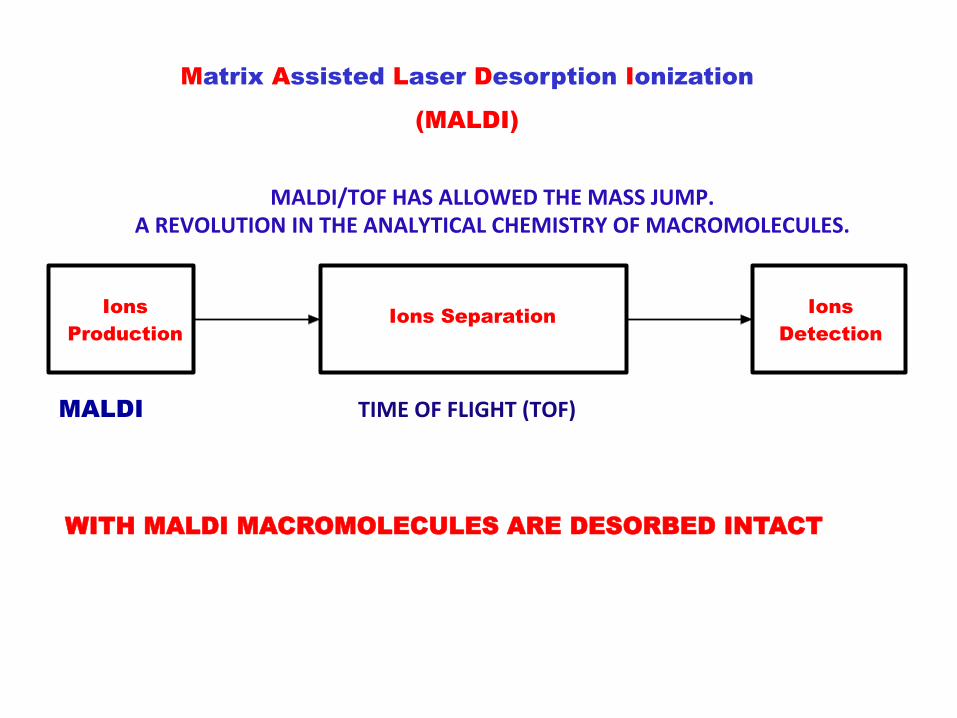
MALDI
WITH MALDI MACROMOLECULES ARE DESORBED INTACT
MALDI/TOF HAS ALLOWED THE MASS JUMP. A REVOLUTION IN THE ANALYTICAL CHEMISTRY OF MACROMOLECULES.
TIME OF FLIGHT (TOF)
Matrix Assisted Laser Desorption Ionization (MALDI)

Matrix Assisted Laser Desorption Ionization (MALDI)
The MALDI process consists of the intimate mixing of the sample with a high molar excess (up to 104 fold) of a low molecular mass organic matrix compound;
Conversion of this mixture to a solid deposit;
Introduction to a high vacuum chamber;
Bombardment with a pulsed UV laser light; and
Collection and measurement of the ions desorbed by the laser.
Separation and identification of the ions produced by a Time Of Flight (TOF) tube

Each laser pulse generates a plume of particles, including ions and neutrals, matrix and analyte, which expand at supersonic speed from the surface of the probe and particularly at right angles to the surface.
The ionization of polymer occurs by the formation of adducts ions with H+ or with alcaline ions (litium, sodium or potassium) even they are not added to the solution

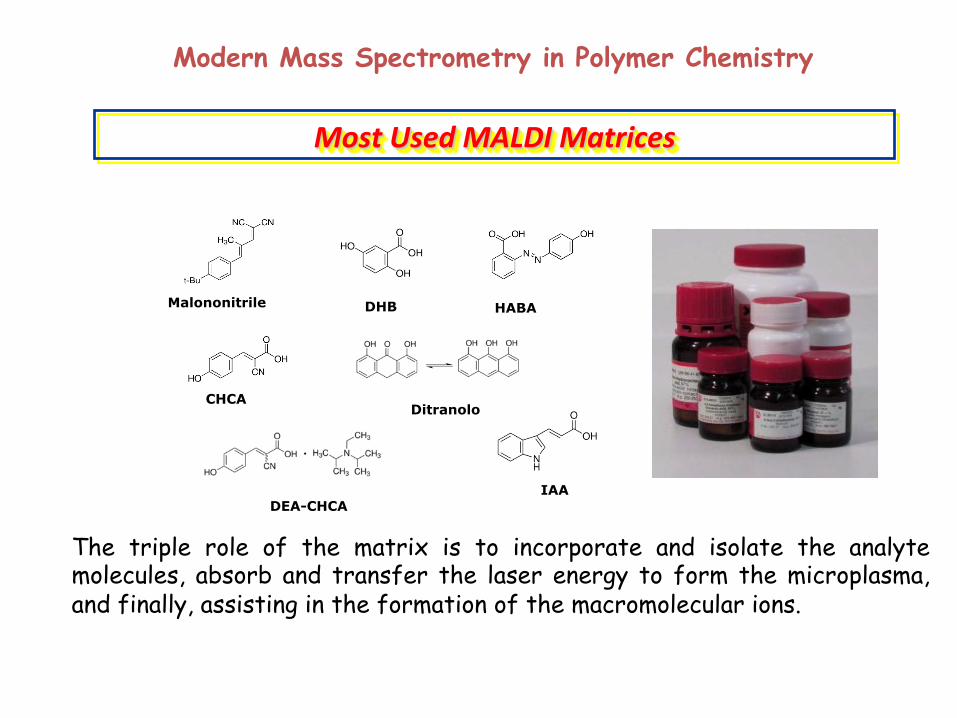
Most Used MALDI Matrices
Malononitrile DHB HABA
IAA
Ditranolo CHCA
DEA-CHCA
The triple role of the matrix is to incorporate and isolate the analyte molecules, absorb and transfer the laser energy to form the microplasma, and finally, assisting in the formation of the macromolecular ions.
Modern Mass Spectrometry in Polymer Chemistry

MALDI-TOF OF POLYMERS
Ø Detection of Intact Molecules
Ø Very High Sensitivity
Ø High Resolution (> 20000 ppm)
q Molar Mass Determination
q Copolymer Analysis
q End Groups Determination/Structure
v Mechanisms of Polymer Degradation
v Mechanisms of Synthesis
Main APPLICATIONS
Main FEATURES

MALDI-TOF OF POLYMERS
Ø Detection of Intact Molecules
Ø Very High Sensitivity
Ø High Resolution
q Molar Mass Determination
q Copolymer Analysis
q End Groups Determination
v Mechanisms of Polymer Degradation
v Mechanisms of Synthesis
Main APPLICATIONS
Main FEATURES
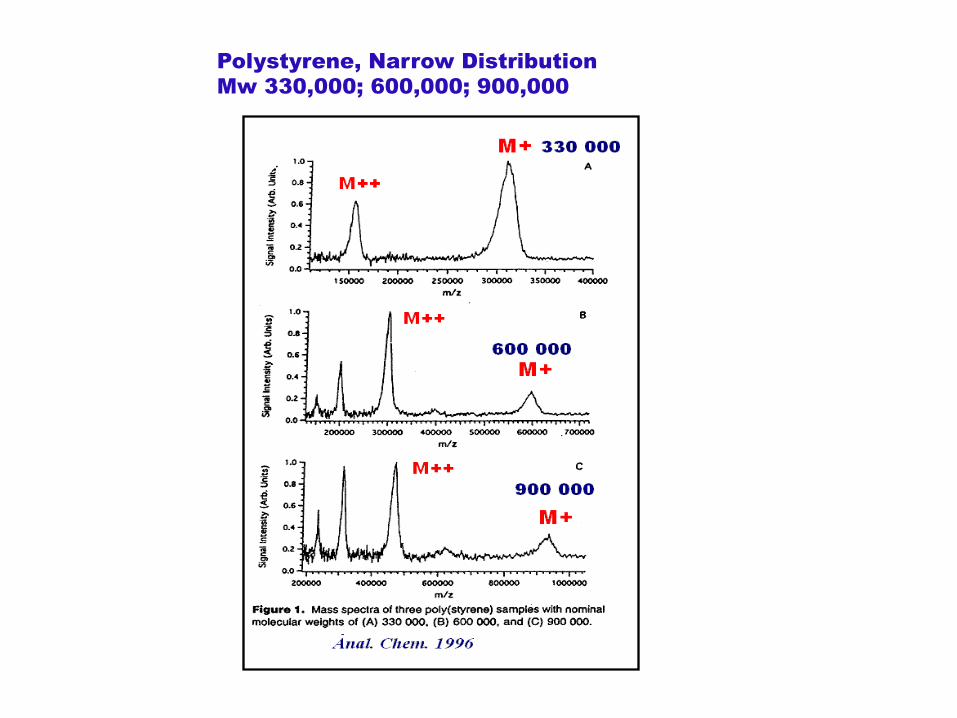
Polystyrene, Narrow Distribution Mw 330,000; 600,000; 900,000

,
0
20
40
60
80
100
120
140
160
180
200
coun
ts/1000
m/z
79160
156970
312530
Osmometry Mn= 153600
Viscosometry Mv=159770
Light Scattering Mw=158180 GPC (SEC) Mn= 152350
Mw= 156050 MALDI Mn = 152350
Mw= 156450
Polystyrene (D=1.001)
Very Narrow Distribution
M+
M++
2M+
0
200
400
600
800
1000
1200
1400
1600
1800
Counts
2000 4000 6000 8000 10000 12000 14000 16000 18000m/z
4000 4500m/z
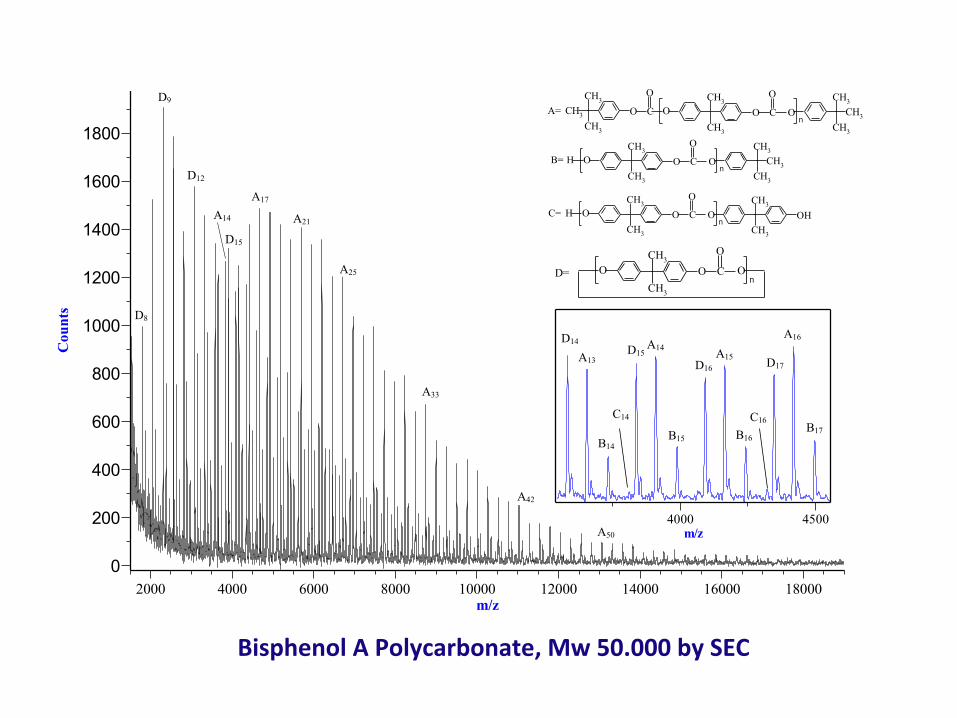
CH3
CH3O
OO COn
CH3
CH3
CH3CH3
CH3O
O CCH3A=
CH3
CH3O
OO COn
CH3
CH3
CH3HB=
CH3
CH3O
OO COn
H
CH3
CH3
OHC=
CH3
CH3O
OO COn
D=
D14 D15
D16 D17 A13 A14
A15
A16
B14 B15 B16
B17 C14 C16
D9
A17
D12
D8
D15
A14 A21
A25
A33
1
A42
A50
Bisphenol A Polycarbonate, Mw 50.000 by SEC

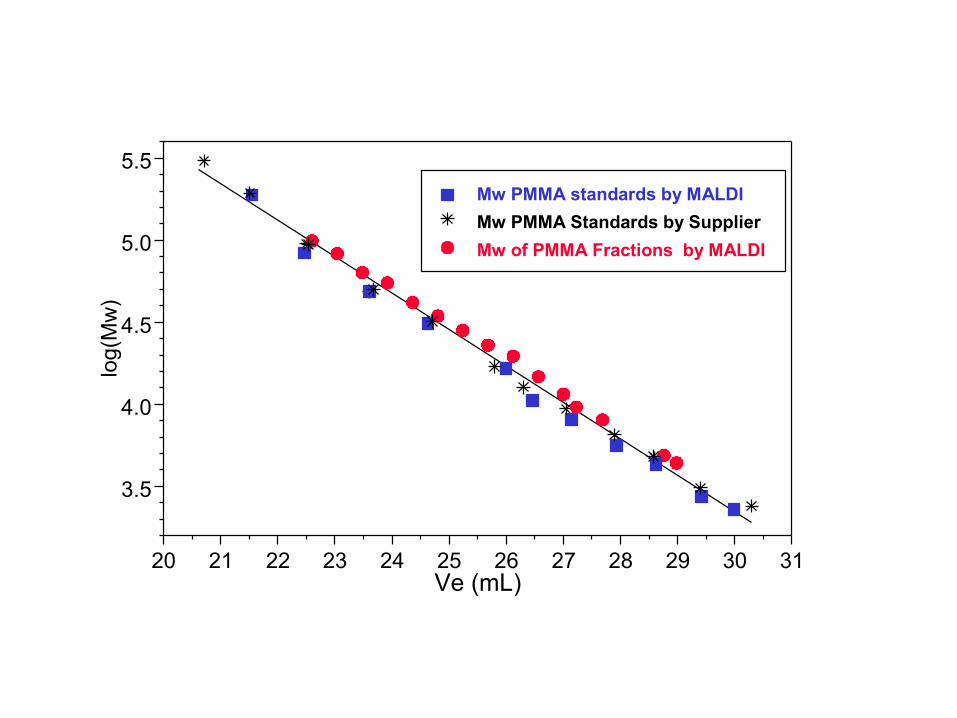
Coupling «off-line» SEC with MALDI MALDI as absolute mass detector for GPC
A.U
0 10 20 30 40 Vr (ml)
m/z
m/z m/z
m/z
310000
190000 49000
2400

3.5
4.0
4.5
5.0
5.5
log(
Mw
)
20 21 22 23 24 25 26 27 28 29 30 31Ve (mL)
Mw PMMA standards by MALDIMw PMMA Standards by SupplierMw of PMMA Fractions by MALDI
3.5
4.0
4.5
5.0
5.5
log(
Mw
)
20 21 22 23 24 25 26 27 28 29 30 31Ve (mL)
Mw PMMA standards by MALDIMw PMMA Standards by SupplierMw of PMMA Fractions by MALDI
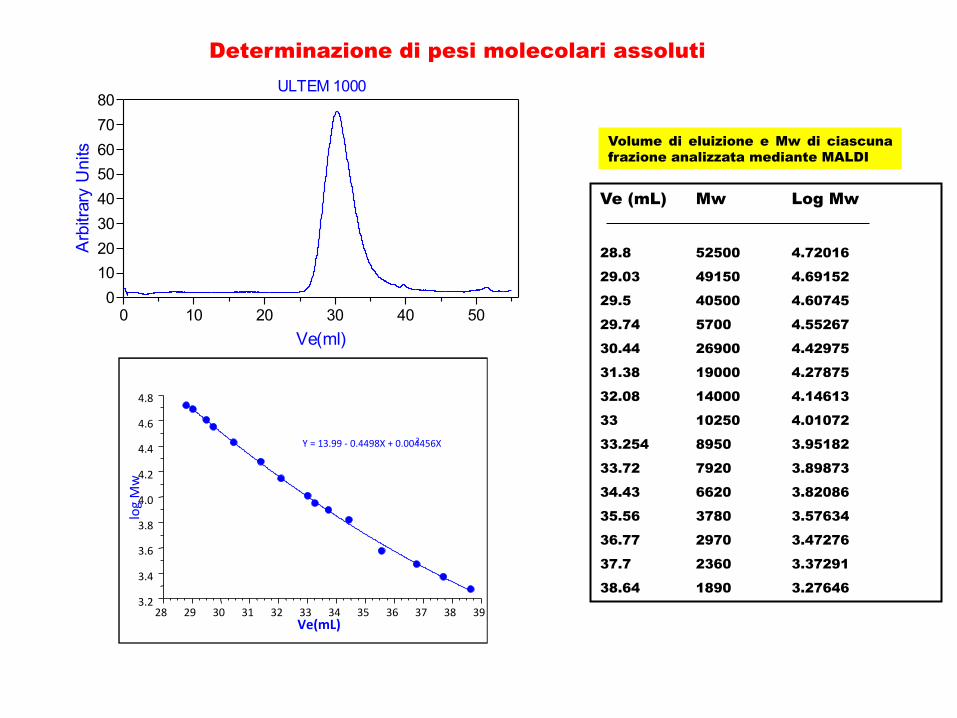
3.2 3.4 3.6 3.8 4.0 4.2 4.4 4.6 4.8
log Mw
28 29 30 31 32 33 34 35 36 37 38 39 Ve(mL)
Y = 13.99 -‐ 0.4498X + 0.004456X 2
01020304050607080
Arb
itrar
y U
nits
0 10 20 30 40 50Ve(ml)
ULTEM 1000
Determinazione di pesi molecolari assoluti
Ve (mL) Mw Log Mw
28.8 52500 4.72016
29.03 49150 4.69152
29.5 40500 4.60745
29.74 5700 4.55267
30.44 26900 4.42975
31.38 19000 4.27875
32.08 14000 4.14613
33 10250 4.01072
33.254 8950 3.95182
33.72 7920 3.89873
34.43 6620 3.82086
35.56 3780 3.57634
36.77 2970 3.47276
37.7 2360 3.37291
38.64 1890 3.27646
Volume di eluizione e Mw di ciascuna frazione analizzata mediante MALDI
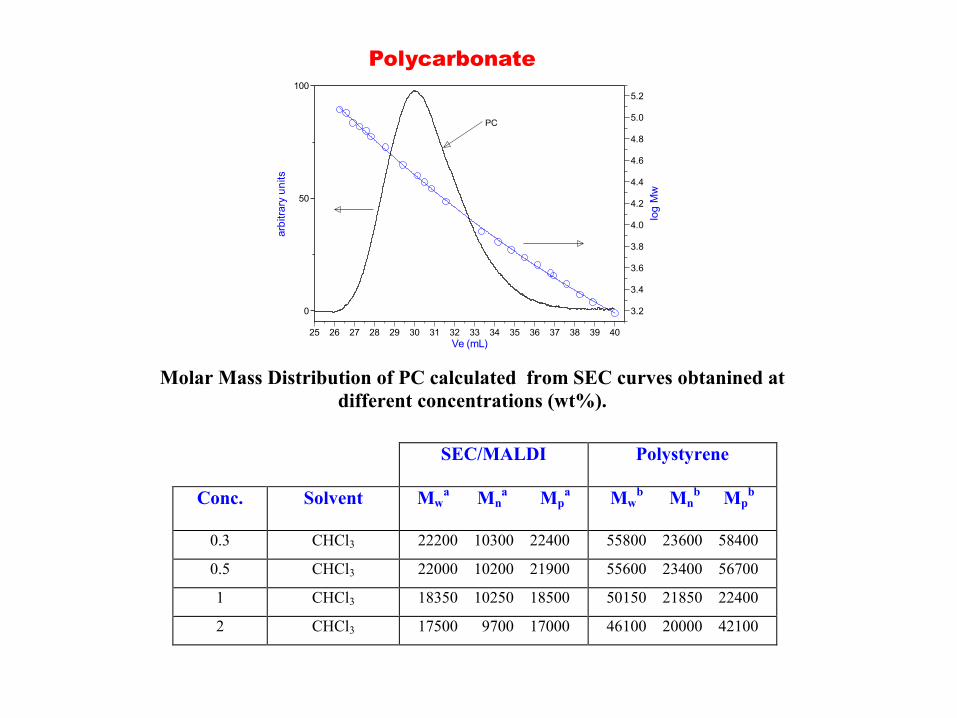
TABLE 1 Molar Mass Distribution of PC calculated from SEC curves obtanined at
different concentrations (wt%).
SEC/MALDI Polystyrene
Conc.
Solvent Mwa Mn
a Mpa Mw
b Mnb Mp
b
0.3 CHCl3 22200 10300 22400 55800 23600 58400
0.5 CHCl3 22000 10200 21900 55600 23400 56700
1 CHCl3 18350 10250 18500 50150 21850 22400
2 CHCl3 17500 9700 17000 46100 20000 42100
3.2
3.4
3.6
3.8
4.0
4.2
4.4
4.6
4.8
5.0
5.2
log
Mw
0
50
100
arbi
trary
uni
ts
25 26 27 28 29 30 31 32 33 34 35 36 37 38 39 40Ve (mL)
PC
Polycarbonate

MALDI-TOF OF POLYMERS
Ø Detection of Intact Molecules
Ø Very High Sensitivity
Ø High Resolution
q Molar Mass Determination
q Copolymer Analysis
q End Groups Determination
v Mechanisms of Polymer Degradation
v Mechanisms of Synthesis
APPLICATIONS
FEATURES

Structure Characterization of Copolymers
NMR (1H – 13C)
MALDI Mass Spectrometry
Copolymers microstructure
§ Copolymer Composition
§ Average sequence length
§ Degree of randomness
§ The weight fraction of copolymers with respect to homopolymers

MODELING PROCESS BASED ON CHAIN STATISTICS
1. CHOICE OF DISTRIBUTION MODELS A NUMBER OF DIFFERENT DISTRIBUTION MODELS CAN BE CONSIDERED, OLIGOMERS ABUNDANCES CAN BE GENERATED ACCORDING TO EACH MODEL (BERNOULLIAN, MARKOFFIAN 1° AND 2°, SEQUENTIAL)
2 THEORETICAL NMR OR MASS SPECTRA GENERATE THEORICAL NMR OR MASS SPECTRA FOR A SPECIFIC
COPOLYMER SEQUENCE BY ASSUMING PEAKS INTENSITIES EQUAL TO RELATIVE OLIGOMER ABUNDANCES, AND APPLYING THE APPROPRIATE CONVOLUTION AND MULTIPLICITY RULES
3 ITERATION AND BEST FIT MINIMIZATION A SERIES OF THEORETICAL MASS SPECTRA ARE ORIGINATED AND,
COMPARING THE EXPERIMENTAL MS INTENSITIES WITH THOSE CALCULATED FOR A SPECIFIC MODEL, THE MOST LIKELY COPOLYMER MICROSTRUCTURE AND COMPOSITION CAN BE DETERMINED
IAmBn = f(PAA, PAB, PBA, PBB)
AF = qΣi(Iiexp - Ii
calcd)2
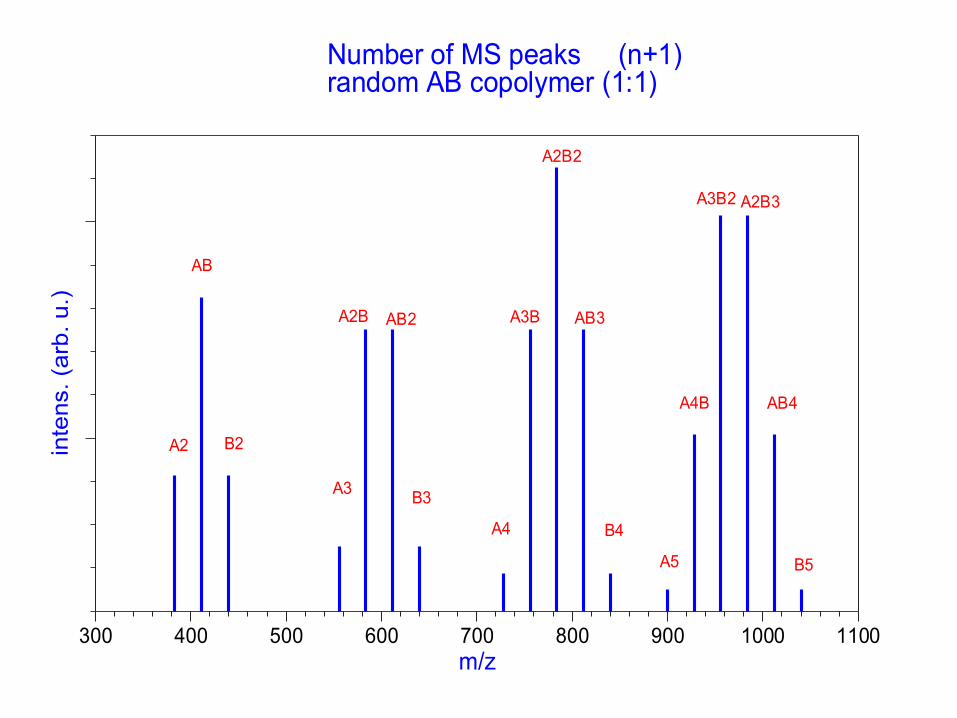
inte
ns. (
arb.
u.)
300 400 500 600 700 800 900 1000 1100m/z
AB
AB4A4B
Number of MS peaks (n+1)random AB copolymer (1:1)
A2 B2
A3 B3
A4
AB2
B4
A2B
A2B3
A2B2
A3B
A5
AB3
A3B2
B5

Oligomers
Formula
Monomers
C1A
I(A) / { I(A) + I(B) }
Dimers
C2A
{2I(A2) + I(AB)} / {2I(A2) + 2I(AB) + 2I(B2)}
Trimers
C3
A
{3I(A3) + 2I(A2B) + I(AB2)} / {3I(A3) + 3I(A2B) + 3I(AB2) + 3I(B3)}
Tetramers
C4
A
{4I(A4) + 3I(A3B) + 2I(A2B2) + I(AB3)}/ {4I(A4) + 4I(A3B) + 4I(A2B2) + 4I(AB3) 4I(B4)}
Composition for a AB copolymer (Composition Estimates Method)
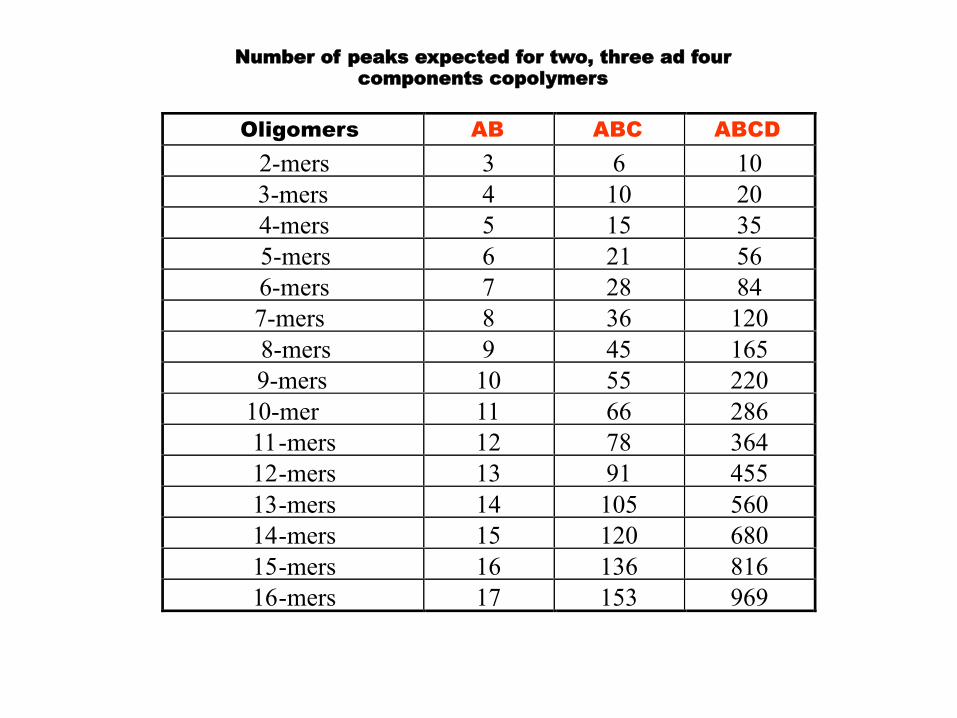
Oligomers AB ABC ABCD 2-mers 3 6 10 3-mers 4 10 20
4-mers 5 15 35 5-mers 6 21 56 6-mers 7 28 84 7-mers 8 36 120 8-mers 9 45 165 9-mers 10 55 220 10-mer 11 66 286 11 - mers 12 78 364 12 - mers 13 91 455 13 - mers 14 105 560 14 - mers 15 120 680 15 - mers 16 136 816 16 - mers 17 153 969
Number of peaks expected for two, three ad four components copolymers

0
200
400
600
800
1000
2000 3000 4000 5000 6000 7000 8000 9000m/z
2600 2700 2800 2900 3000 3100m/z
A6B6A7B5 A5B7
A4B8
A3B9
A8B5
A9B4
A8B4
A4B7
A5B6A6B5
A7B4
A3B7
A8B3 A2B8A9B3 A3B8
A2B9A10B3
a.i.
A6B6A6B7A6B5
A5B6
A7B7
A7B8
A8B7
A5B5
A8B8A8B9
A9B9
A9B10
A10B10
A10B11 A11B11
MALDI-TOF spectrum of butylene adipate (A)/sebacate (B) copolymer.

MODELING PROCESS BASED ON CHAIN STATISTICS
1. CHOICE OF DISTRIBUTION MODELS A NUMBER OF DIFFERENT DISTRIBUTION MODELS CAN BE CONSIDERED, OLIGOMERS ABUNDANCES CAN BE GENERATED ACCORDING TO EACH MODEL (BERNOULLIAN, MARKOFFIAN 1° AND 2°, SEQUENTIAL)
2 THEORETICAL NMR OR MASS SPECTRA GENERATE THEORICAL NMR OR MASS SPECTRA FOR A SPECIFIC
COPOLYMER SEQUENCE BY ASSUMING PEAKS INTENSITIES EQUAL TO RELATIVE OLIGOMER ABUNDANCES, AND APPLYING THE APPROPRIATE CONVOLUTION AND MULTIPLICITY RULES
3 ITERATION AND BEST FIT MINIMIZATION A SERIES OF THEORETICAL MASS SPECTRA ARE ORIGINATED AND,
COMPARING THE EXPERIMENTAL MS INTENSITIES WITH THOSE CALCULATED FOR A SPECIFIC MODEL, THE MOST LIKELY COPOLYMER MICROSTRUCTURE AND COMPOSITION CAN BE DETERMINED
IAmBn = f(PAA, PAB, PBA, PBB)
AF = qΣi(Iiexp - Ii
calcd)2
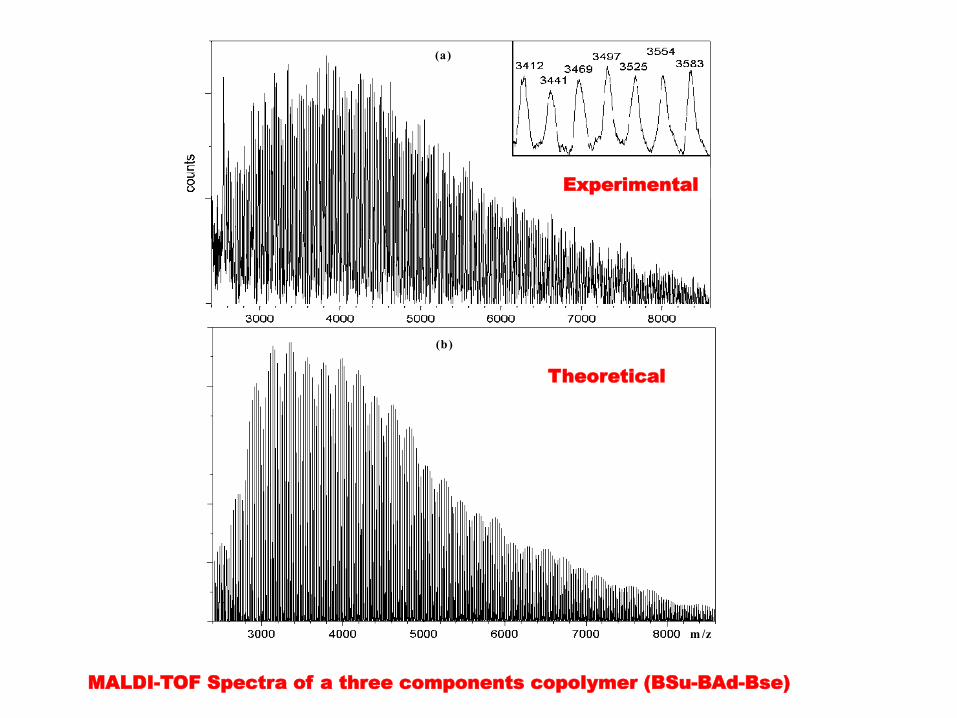
m /z
(b)
(a)
MALDI-TOF Spectra of a three components copolymer (BSu-BAd-Bse)
Theoretical
Experimental
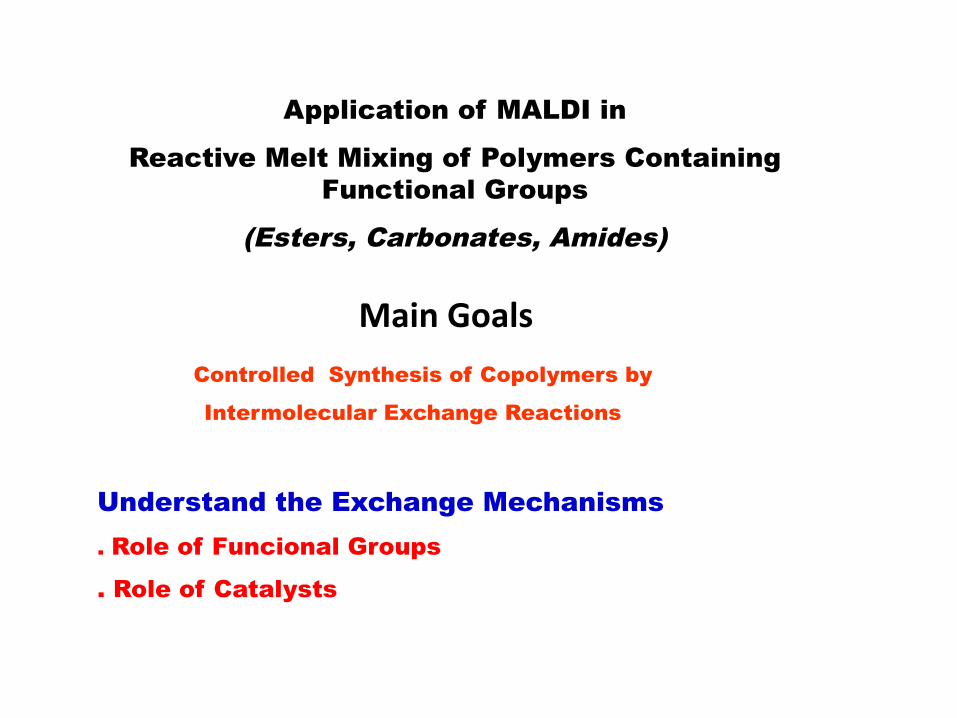
Application of MALDI in
Reactive Melt Mixing of Polymers Containing Functional Groups
(Esters, Carbonates, Amides)
Understand the Exchange Mechanisms . Role of Funcional Groups
. Role of Catalysts
Controlled Synthesis of Copolymers by
Intermolecular Exchange Reactions
Main Goals

random copolymers
A-A-B-A-B-B-A-A-B-B-B-A-A-A-B-B-A-B
B-B-A-B-A-A-B-B-A-A-A-B-B-B-A-A-B-A +
diblock copolymers
A-A-A-A-A-A-A-A-A-A-A-A-A-A-B-B-B-B
B-B-B-B-B-B-B-B-B-B-B-B-B-B-A-A-A-A +
interchange
A-A-A-B-B-A-A-A-A-A-B-B-B-A-A-A-A-A
B-B-B-A-A-B-B-B-B-B-A-A-A-B-B-B-B-B + multiblock
copolymers
interchange
interchange
A-A-A-A-A-A-A-A-A-A-A-A-A-A-A-A-A-A
B-B-B-B-B-B-B-B-B-B-B-B-B-B-B-B-B-B + homopolymers

Block Copolyamide
Random Copolyamide
O OHOC (CH2)4 C NH (CH2)6 NH
y
OOOHC (CH2)4 C
x
O ONH (CH2)6 NH C (CH2)8 C
Ny6,10Ny6,6
+ C (CH2)8 C NH (CH2)6 NHp
HO
Ny6,10
O O
Further reaction
m C (CH2)4 CC (CH2)4 C NH (CH2)6 NH n
OO O O OONH (CH2)6 NH C (CH2)8 C
+
NH (CH2)6 NH C (CH2)8 C n
OONy6,10
OHC (CH2)4 CC (CH2)4 C NH (CH2)6 NH n Ny6,6OO O O
AMMIDE/AMMIDE (Ny66/Ny610)
Mixing Temp 290°C

13C-NMR spectra of Ny6,6-COOH and Ny6,10 equimolar mixtures
(ppm) 178 179 180 43.5 44.5 33 33.5 34 194 195
a’’ a’
a
b c
d
e
f
e’ e’’
A
B
C
physical blend
290°C for 3h
310°C for 1h
n
C CH2 (CH2)2 CH2 CHO OHn
NH CH2 (CH2)4 CH2 NH C CH2 (CH2)2 CH2 CO
e' e'' a' c a e
O
a''
O O
ONH CH2 (CH2)4 CH2 NH C CH2 (CH2)6 CH2 C
d b f
O
Ny6,6-COOH
Ny6,10
AMMIDE/AMMIDE (Ny66/Ny610)
0
50
100
0
50
100
1000 2000 3000 4000 5000
1000 2000 3000 4000 5000
I%
I%
m/z
m/z
(a)
(b)
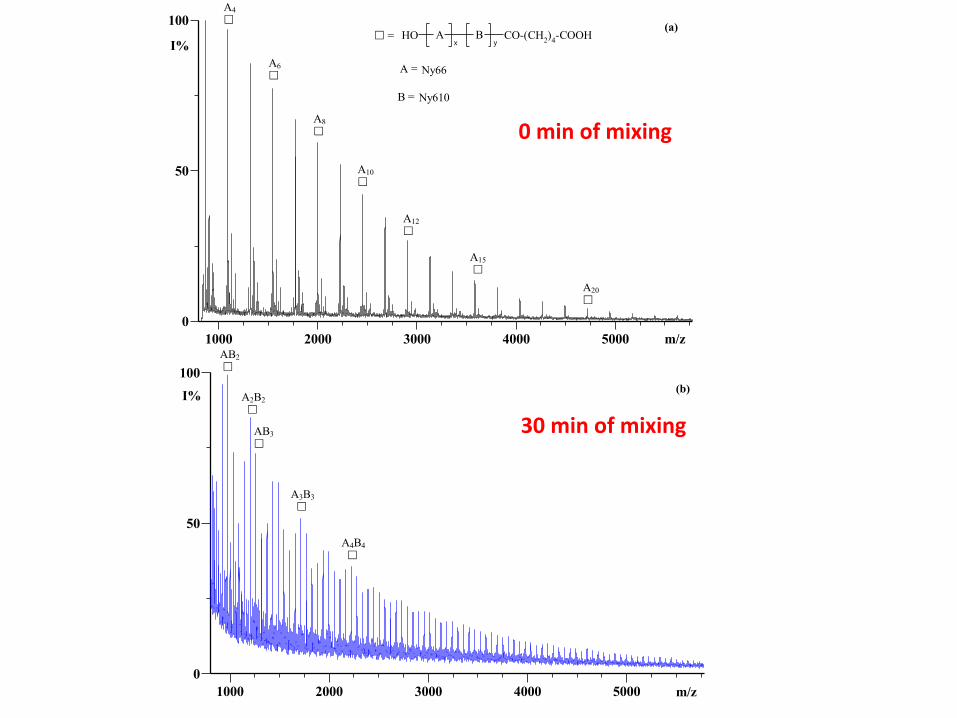
Figure 4 - MALDI-TOF mass spectra of an equimolar mixture of Ny6,6-COOH (Mv = 7,200) and high MM Ny6,10 (Mv =36,100): (a) physical blend, (b) melt mixed at 290°C for 30 min.
A2B2 £
AB3 £
AB2 £
A3B3 £
A4B4 £
A4 £
A8 £
A6 £
A10 £
A20 £
A12 £
A15 £
AHO CO-(CH2)4-COOHy
x
B£ =
A = Ny66
B = Ny610
0
50
100
0
50
100
1000 2000 3000 4000 5000
1000 2000 3000 4000 5000
I%
I%
m/z
m/z
(a)
(b)
Figure 4 - MALDI-TOF mass spectra of an equimolar mixture of Ny6,6-COOH (Mv = 7,200) and high MM Ny6,10 (Mv =36,100): (a) physical blend, (b) melt mixed at 290°C for 30 min.
A2B2 £
AB3 £
AB2 £
A3B3 £
A4B4 £
A4 £
A8 £
A6 £
A10 £
A20 £
A12 £
A15 £
AHO CO-(CH2)4-COOHy
x
B£ =
A = Ny66
B = Ny610
0 min of mixing
30 min of mixing
0
50
100
0
50
100
0
50
100
1000 1200 1400 1600 1800 m/z
1000 1200 1400 1600 1800
1000 1200 1400 1600 1800
I%
I%
m/z
m/z
I%
m/z
A4
A3
A4
A5
A6
A7
A4B
AB3
A2B2
A3B
B3
AB2
A2B
B4
A3
A3
A7
A6
A5
A4
A2B2 A3B
AB4
AB3 A2B3
A4B
A3B2
AB2 AB3
B3
A5B
A2B
A4B2
A3B3
A2B4 AB5
A3B2
A3B2
A2B3
A2B3
A5B
A5B
A4B2
A4B2
A3B3
A3B3
A4B
AB3
A3B A2B2
A2B AB2
B3 A6B
A6B
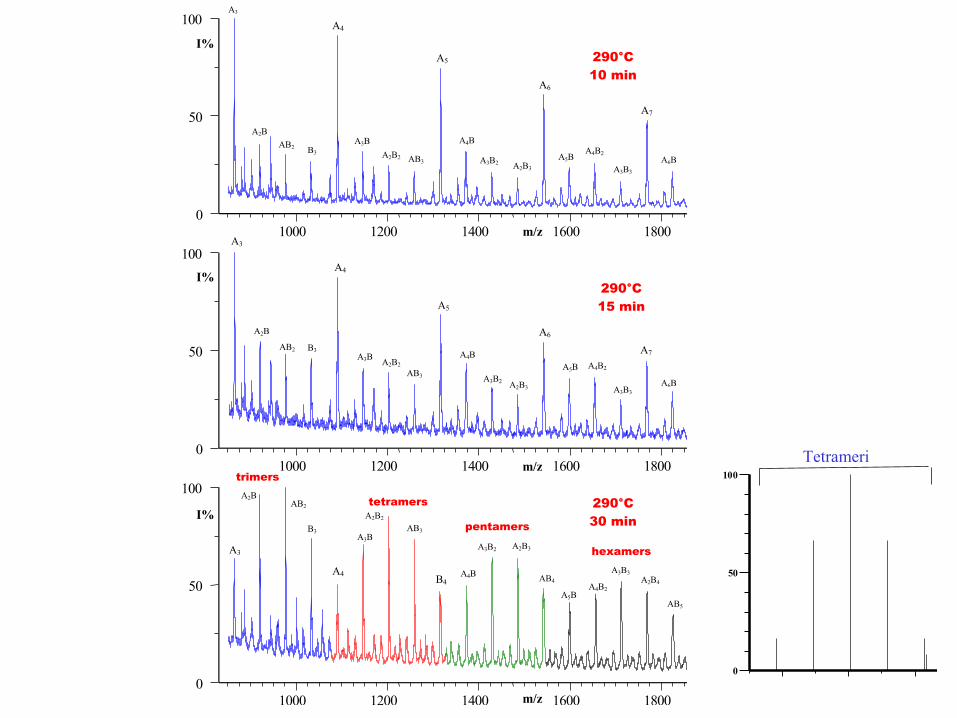
290°C 10 min
290°C 15 min
290°C 30 min
tetramers
trimers
pentamers
hexamers
0
50
100
0
50
100
0
50
100
1000 1200 1400 1600 1800 m/z
1000 1200 1400 1600 1800
1000 1200 1400 1600 1800
I%
I%
m/z
m/z
I%
m/z
A4
A3
A4
A5
A6
A7
A4B
AB3
A2B2
A3B
B3
AB2
A2B
B4
A3
A3
A7
A6
A5
A4
A2B2 A3B
AB4
AB3 A2B3
A4B
A3B2
AB2 AB3
B3
A5B
A2B
A4B2
A3B3
A2B4 AB5
A3B2
A3B2
A2B3
A2B3
A5B
A5B
A4B2
A4B2
A3B3
A3B3
A4B
AB3
A3B A2B2
A2B AB2
B3 A6B
A6B
290°C 10 min
290°C 15 min
290°C 30 min
tetramers
trimers
pentamers
hexamers
0
50
100
0
50
100
1100 1200 1300 1400 1500 1600 1700 1800
Tetrameri Esameri

AMMIDE/AMMIDE (Ny66/Ny610)

290 °C
30 min
60 min
180 min
0
50
100
0
50
100
0
50
100
1000m/z
1000
1000
I%
I%
m/z
m/z
(a)
(c)
Figure 6 - Enlarged section of the MALDI-TOF mass spectra of Ny6,6/Ny6,10 reacted at 290 °C for: (a) 30 min, (b) 60 min and (c) 180 min. With the labels A and B are indicated the Ny6,6 and Ny6,10 units, respectively. Peaks labelled with the symbol Δ indicate copolymer chains terminated with cyclopentanone units.
I%
m/z
(b)
AB2 A2B
1014 B3
958 AB2
B3 A3 902
A2B
B3
B3
B3
B3
AB2
AB2
AB2
AB2
A2B
A2B
A2B
A2B
A3
A3
Δ Δ Δ
Δ
Δ Δ
Δ Δ
Δ

MALDI-TOF OF POLYMERS
Ø Detection of Intact Molecules
Ø Very High Sensitivity
Ø High Resolution
q Molar Mass Determination
q Copolymer Analysis
q End Groups Determination
v Mechanisms of Polymer Degradation
v Mechanisms of Synthesis
APPLICATIONS
FEATURES
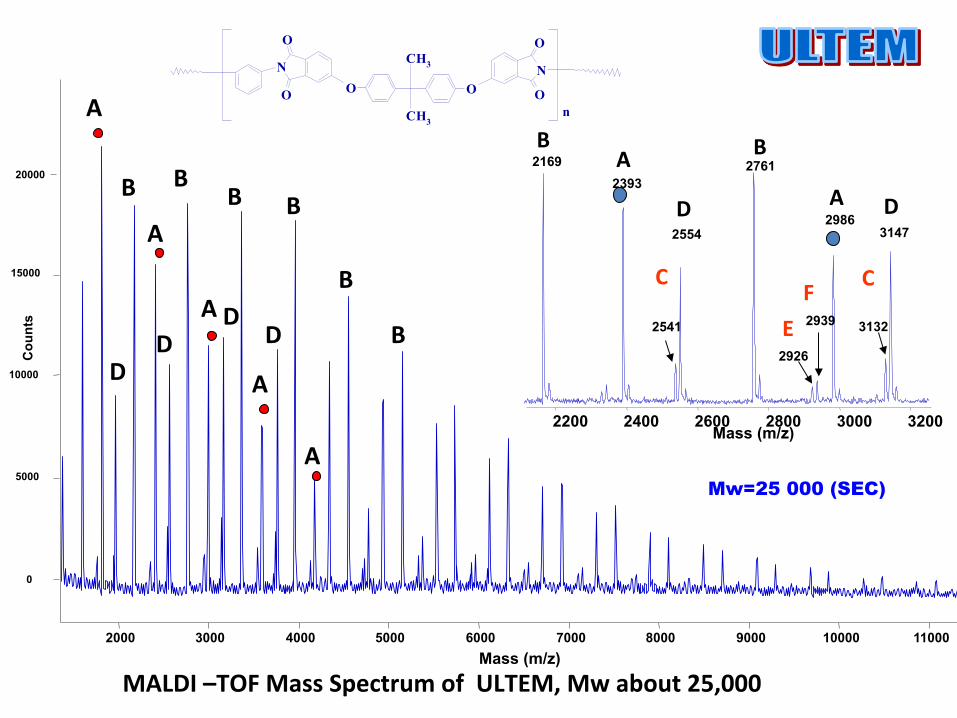
MALDI –TOF Mass Spectrum of ULTEM, Mw about 25,000
10000
15000
20000
0
5000
Cou
nts
2000 3000 4000 5000 6000 7000 8000 9000 10000 11000 Mass (m/z)
A
A
A
A
A
B B B B
B
B D
D D
D
C C F E
2200 2400 2600 2800 3000 3200 Mass (m/z)
2761
2939
2169 2393
2541
2554 2986
3147
3132
2926
A
D A D
B B
n
CH3
CH3
ON
O
O
NO
O
O
Mw=25 000 (SEC)

NO
O
O
CH3
CH3
O CH3
O
O
N NO
O
O
CH3
CH3
ON
O
O
CH3
n
F
O
O
O
CH3
CH3
OO
O
N N
O
O O
H
n
C
O
O
O
CH3
CH3
OO
O
N NO
O
O
CH3
CH3
ON
O
O
CH3O
n
E
NO
O
O
CH3
CH3
ONNO
O
O
ON
O
O
n
B
CH3
CH3
ON
O
O
NO
O
O n
A
NO
O
O
CH3CH3
CH3
ONNO
O
O
O
n
D

0
5000
Cou
nts
B
B
Mass (m/z ) 2000 3000 4000 5000 6000 7000 8000 9000 10000
10000
15000 B
B
B
B
B
2559 2541
2581
2761
2169 2393
2986 3151
3132
2777
B
A
A C
C
2184
2200 2409 3167
2646
2690 3002 28
95
2913
2320
2945
H L K
R
U
W
U B1
B2 A1 I
B1
H
H1
2200 2400 2600 2800 3000 3200 Mass (m/z)
E
E O
2661
N 2676
MALDI-‐TOF Mass Spectrum of PEI Sample Photo-‐oxidised at 60°C for 216 hours
Photo-Oxidation

not-oxidized chains
C C F
E
2200 2400 2600 2800 3000 3200 Mass (m/z)
2761
2939
2169 2393
2541
2554 2986
3147
3132
2926
A
D A D
B B
B
2559 2541
2581
2761
2169 2393
2986 3151
3132 2777
B A
A C C
2184 2200 2409
3167
2646
2690 3002 28
95
2913
2320
2945
H L K
R
U
W
U B1 B2 A1
I B1
H
H1
2200 2400 2600 2800 3000 3200 Mass (m/z)
E E
O 2661
N 2676
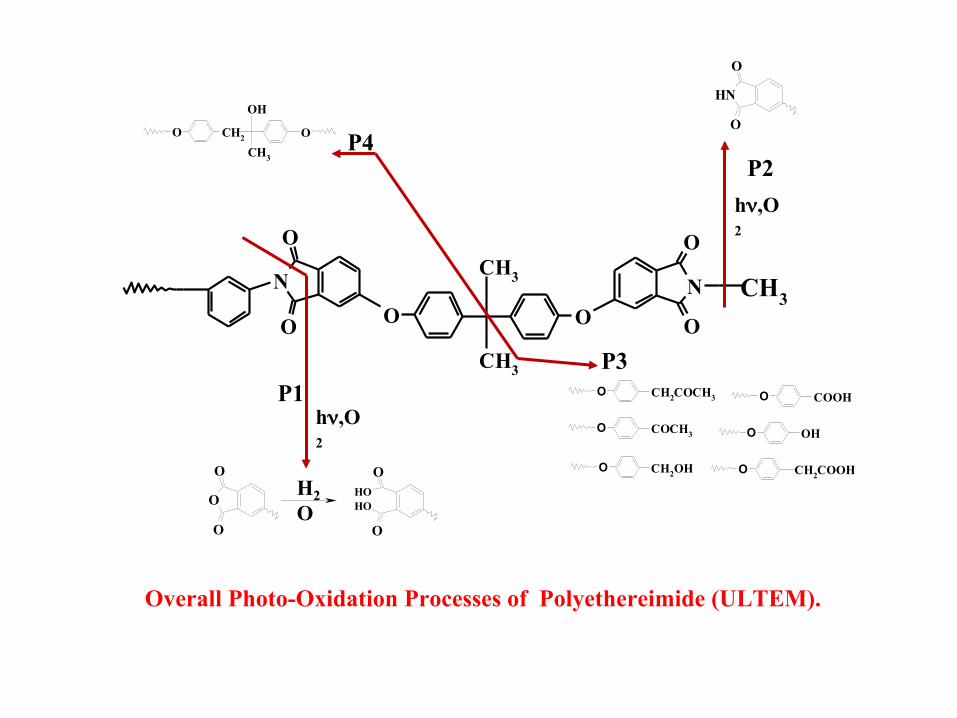
Photo-Oxidation
CH3
CH3
ON
O
O
NO
O
O
CH3
P1 COCH3O
COOHOCH2COCH3O
OHO
CH2OHO CH2COOHO
NH
O
O
O
O
O
O
O
OHOH
H2O
hν,O2
P2
P3
P4 OH
CH3
OO CH2
Overall Photo-Oxidation Processes of Polyethereimide (ULTEM).
hν,O2
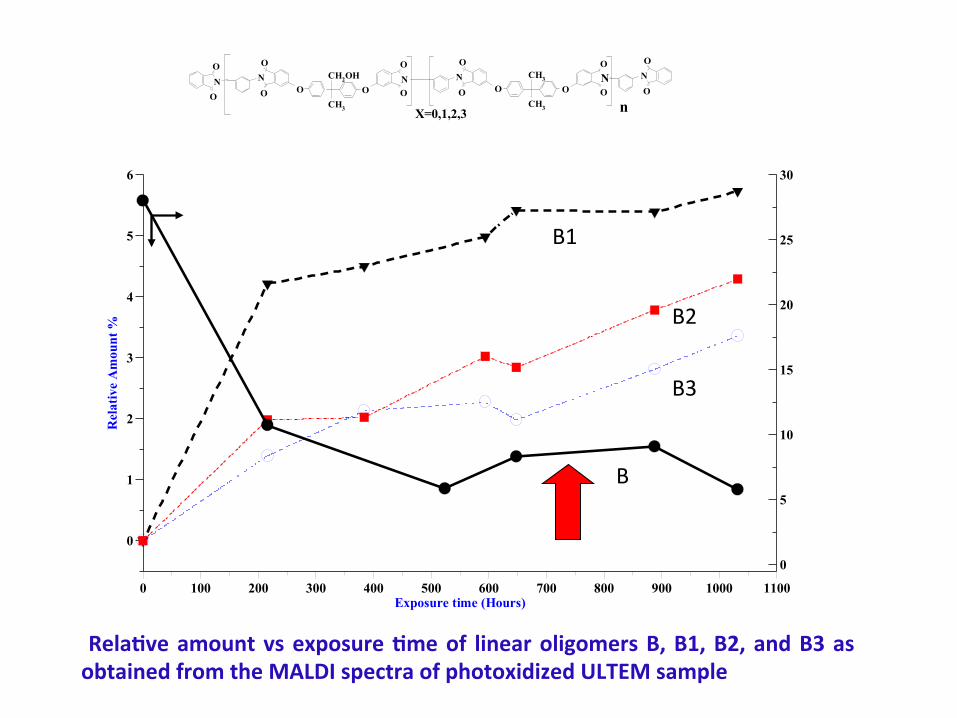
0
1
2
3
4
5
6
Rel
ativ
e A
mou
nt %
0
5
10
15
20
25
30
0 100 200 300 400 500 600 700 800 900 1000 1100Exposure time (Hours)
NO
O
O
CH2OH
CH3
ONO
ON
O
ON
O
O
O
CH3
CH3
ONO
O
NO
O
X=0,1,2,3 n
Rela:ve amount vs exposure :me of linear oligomers B, B1, B2, and B3 as obtained from the MALDI spectra of photoxidized ULTEM sample
B
B1
B2
B3
CH
H
NH COCO (CH2)4 CH2 CH2 CH2 CH2 CH2 NH CO
H abstraction
NorrishI Norrish II
CO (CH2)4NH CHO
CO (CH2)4NH COOH
CO (CH2)4NH CH3
(B)
(CH2)5CO NH2
(CH2)5CO NH CHO
CO (CH2)3NH CH CH2
CO (CH2)3NH CH3
CO (CH2)2NH CH CH2
(CH2)5CO NH CO CH3
(C)
(A)
CH NH
O OH
CO (CH2)4
(CH2)4CO CHO
(CH2)4CO COOH
NH CO NH2(CH2)5
NH(CH2)4CO CO CO
hν
hνhν
Scheme 2
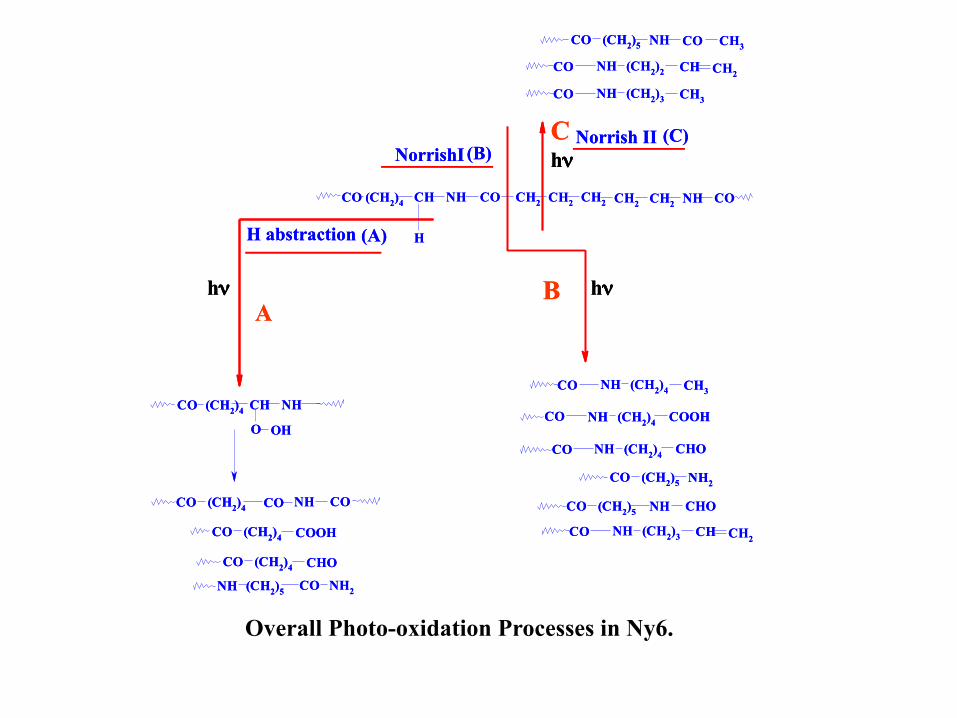
Overall Photo-oxidation Processes in Nylon 6.
AB
C
CH
H
NH COCO (CH2)4 CH2 CH2 CH2 CH2 CH2 NH CO
H abstraction
NorrishI Norrish II
CO (CH2)4NH CHO
CO (CH2)4NH COOH
CO (CH2)4NH CH3
(B)
(CH2)5CO NH2
(CH2)5CO NH CHO
CO (CH2)3NH CH CH2
CO (CH2)3NH CH3
CO (CH2)2NH CH CH2
(CH2)5CO NH CO CH3
(C)
(A)
CH NH
O OH
CO (CH2)4
(CH2)4CO CHO
(CH2)4CO COOH
NH CO NH2(CH2)5
NH(CH2)4CO CO CO
hν
hνhν
Scheme 2
Overall Photo-oxidation Processes in Nylon 6.
AB
C
Overall Photo-oxidation Processes in Ny6.


O
CH3
CH2 O
OH
O
OHO
CH2COCH3O
COCH3O
CH2OHO
CH2COCH3O CH2COOHOO2
CH2OHOO2
COOHO
CH2O C
CH3
O
OH
++
1'
SCHEME 3b. Photo-‐degradaGon mechanisms of Bisphenol-‐A-‐ moiety
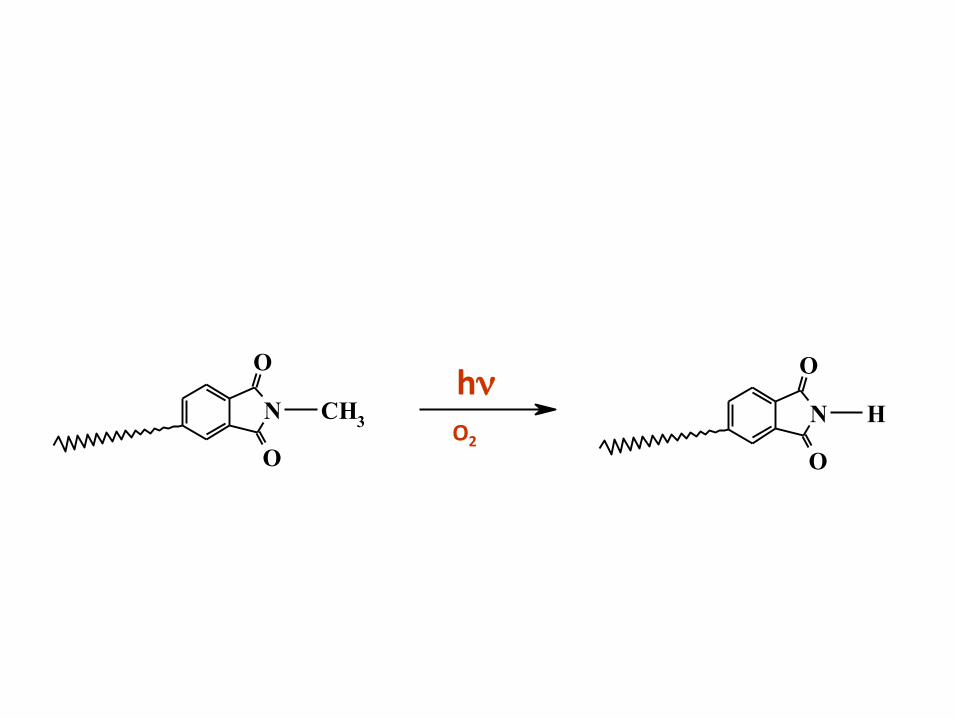
N H
O
O
N CH3
O
O
hν O2

SCHEME 3a. Photo-‐degradaGon mechanisms of Bisphenol-‐A-‐ moiety
O2 R.
CH2
CH3
O
CH3
CH3
O O
O
CH2
CH3
O O
CH2OH
CH3
O O
O2
O
CH3
CH2 O
OH
O
CH3
CH2O
O
OO
H
CH2O C
CH3
O
OH
1'
O2
rearrangement
.
Further Decomposition (Scheme 3 b)
1
+ H.
.
+ H.

n
NH O
H C 2H 2H C2
H C2
H CCC2
Nylon 6
Remarkable information on the photo oxidation of Nylon 6 and Nylon 66 has been provided, in the past, mainly by UV and IR spectroscopy and by wet chemistry methods

CH
H
NH COCO (CH2)4 CH2 CH2 CH2 CH2 CH2 NH CO
H abstraction
NorrishI Norrish II
CO (CH2)4NH CHO
CO (CH2)4NH COOH
CO (CH2)4NH CH3
(B)
(CH2)5CO NH2
(CH2)5CO NH CHO
CO (CH2)3NH CH CH2
CO (CH2)3NH CH3
CO (CH2)2NH CH CH2
(CH2)5CO NH CO CH3
(C)
(A)
CH NH
O OH
CO (CH2)4
(CH2)4CO CHO
(CH2)4CO COOH
NH CO NH2(CH2)5
NH(CH2)4CO CO CO
hν
hνhν
Scheme 2
Overall Photo-oxidation Processes in Nylon 6.
AB
C
Overall Photo-oxidation Processes in Ny6.

3.1
3.2
3.3
3.4
3.5
3.6
3.7
3.8
3.9
4.0
4.1
4.2
4.3
log
Mv
0 10 20 30 40 50 60 70 80 90 100 110 120
Exposition Time (hours)
Molar mass of photo-oxidised Ny6 samples as a function of exposition time

Cou
nts
0
10000
20000
30000
1000 2000 3000 4000 5000 6000 Mass (m/z)
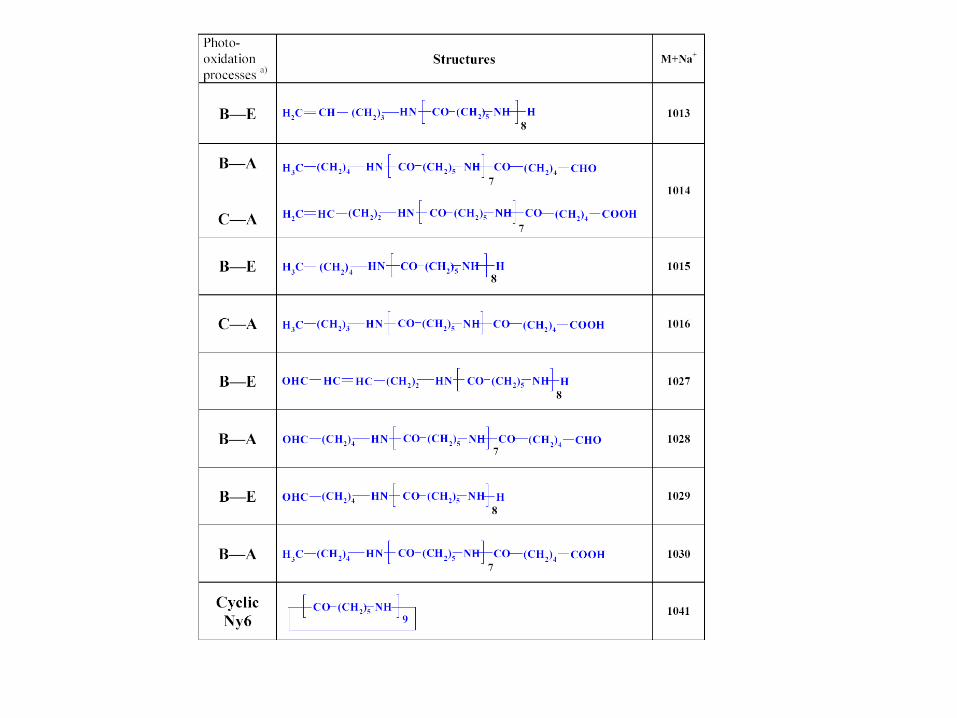
MALDI-TOF mass spectrum of Ny6
CO (CH2)5 9NH A
OH CO (CH2)5 9HNH B
OH8
CO(CH2)5CO NH C
1040 1045 1065 1020 1025 1030 1035 1050 1055 1060
1050 CNa +
1019 1020
1041
1042
1043
ANa +
AH+
1037
1059
1060
BNa +
BH+
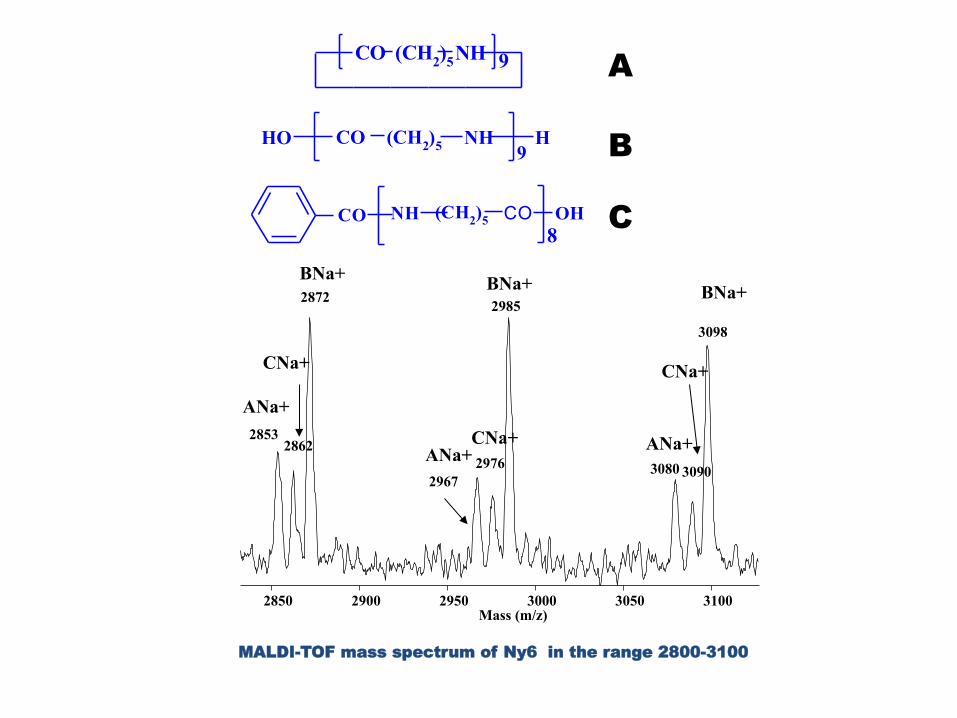
MALDI-TOF mass spectrum of Ny6 in the range 2800-3100
2853 2862
2872
2967 2976
2985
3080 3090
3098
2850 2900 2950 3000 3050 3100 Mass (m/z)
ANa+
BNa+
CNa+
ANa+
BNa+
CNa+ ANa+
CNa+
BNa+
CO (CH2)5 9NH A
OH CO (CH2)5 9HNH B
OH8
CO(CH2)5CO NH C
5000
10000
15000
20000
25000
30000
Counts
1020 1040 1060 1080 1100 1120 Mass (m/z)
1000
2000
3000
4000
5000
6000
7000
8000
Count
s
1020 1040 1060 1080 1100 1120 Mass (m/z)
0
10000
20000
30000
40000
Count
s
1020 1040 1060 1080 1100 1120 Mass (m/z)
1041
1041
1057
1057
1045
1045
1073
1073
1029
1029
1086 1114 1126
1126 1100 1114
1100
1086
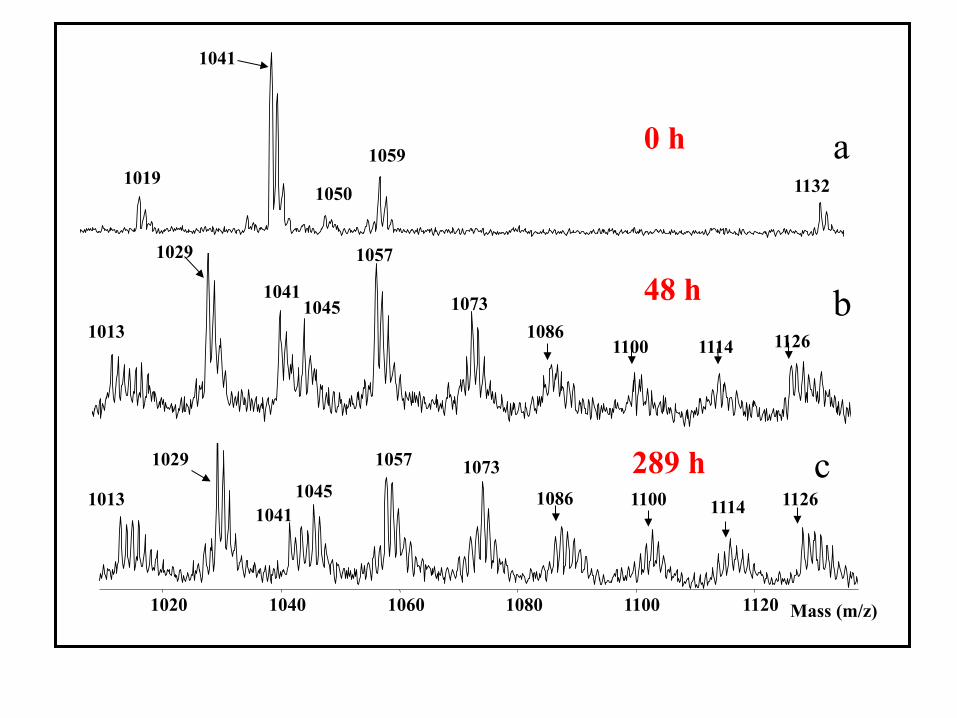
1020 1040 1060 1080 1100 1120 Mass (m/z)
1013
1013
a
b
c
1059
1050
1041
1019 1132
48 h
289 h
0 h

MALDI-TOF mass spectrum of Ny 6 after the deisotoping procedure.
1020 1025 1030 1035 1040 1045 1050 1055 1060
m/z
1050 CNa+
1037
1059 BNa+
BH+ 1019
1041 ANa+
AH+
1040 1045 1065 1020 1025 1030 1035 1050 1055 1060 Mass (m/z)
10
50
1019
10
20
1041
10
42
1043
10
37
10
59
1
06
0

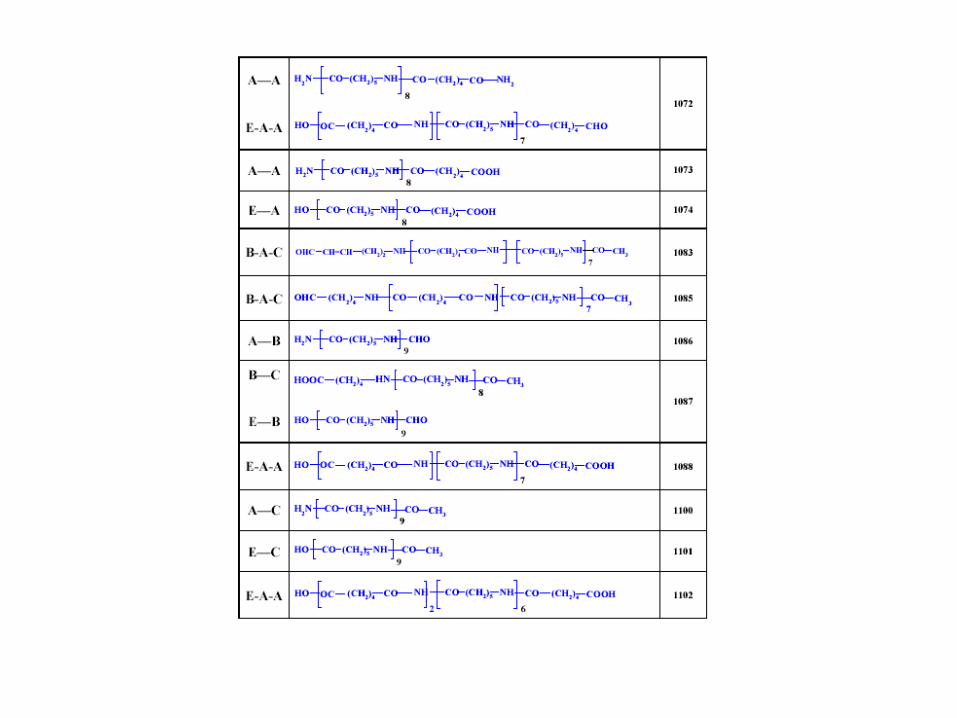
1010 1020 1030 1040 1050 1060 1070 1080 1090 1100 1110 1120
1041
1043
1045 1055
1057
1069
1072
1073
1083
1085 1086
1100 1101 1114
1113
1013
1029
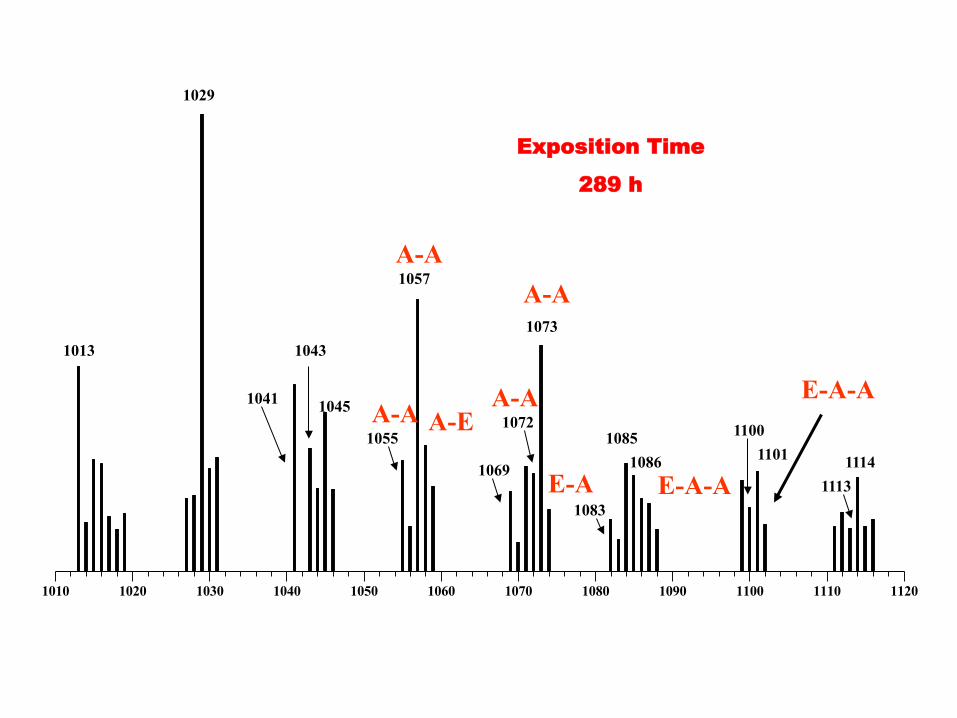
Deisotopized MALDI-TOF Mass Spectrum, in the mass range 1010-1120Da of Ny6 sample photo-oxidized for 289 hours.
m/z


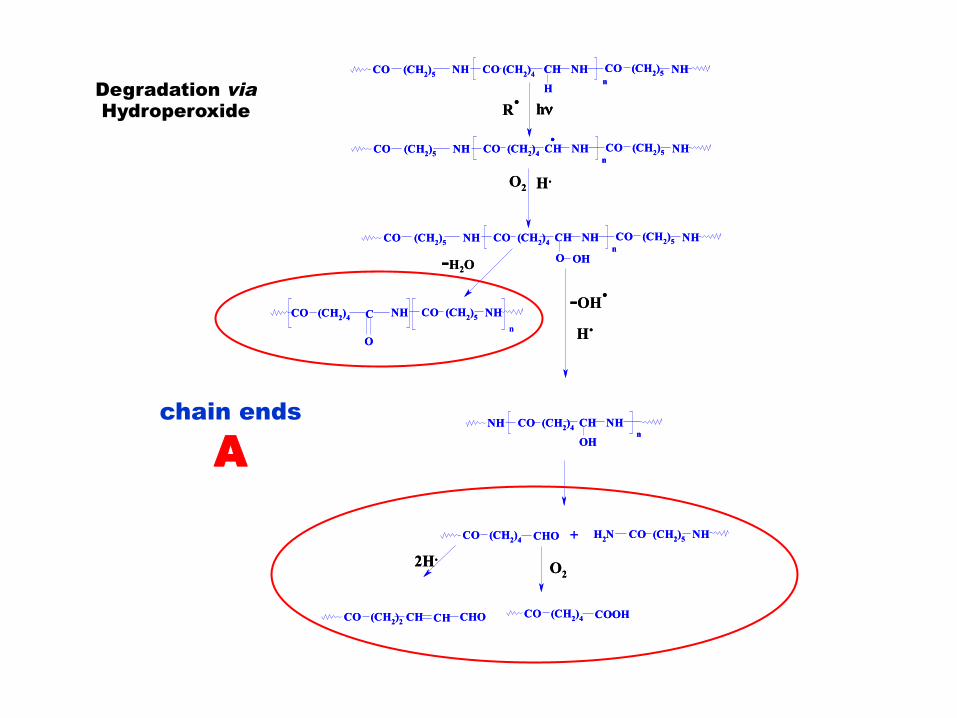
(CH2)4CO CHO
(CH2)4CO COOH
+ NH2
CO (CH2)4 CO (CH2)5 NHNH(CH2)5CO CH
H
NH
CO (CH2)4 CO (CH2)5 NHNH(CH2)5CO CH NH
.
n
n
CO (CH2)4 CO (CH2)5 NHNH(CH2)5CO CH NH
nO OH
CO (CH2)5
NHNH(CH2)4CO
O
C
CO (CH2)4 NH CH
OH
NHn
n
(CH2)2CO CHOCH CH
CO (CH2)5 NH
R.
hν
O2 H.
-H2O
-OH.
H.
O22H.
Scheme 1
Photo-decomposition of a Nylon6 Hydroperoxides
Degradation via Hydroperoxide
chain ends
A
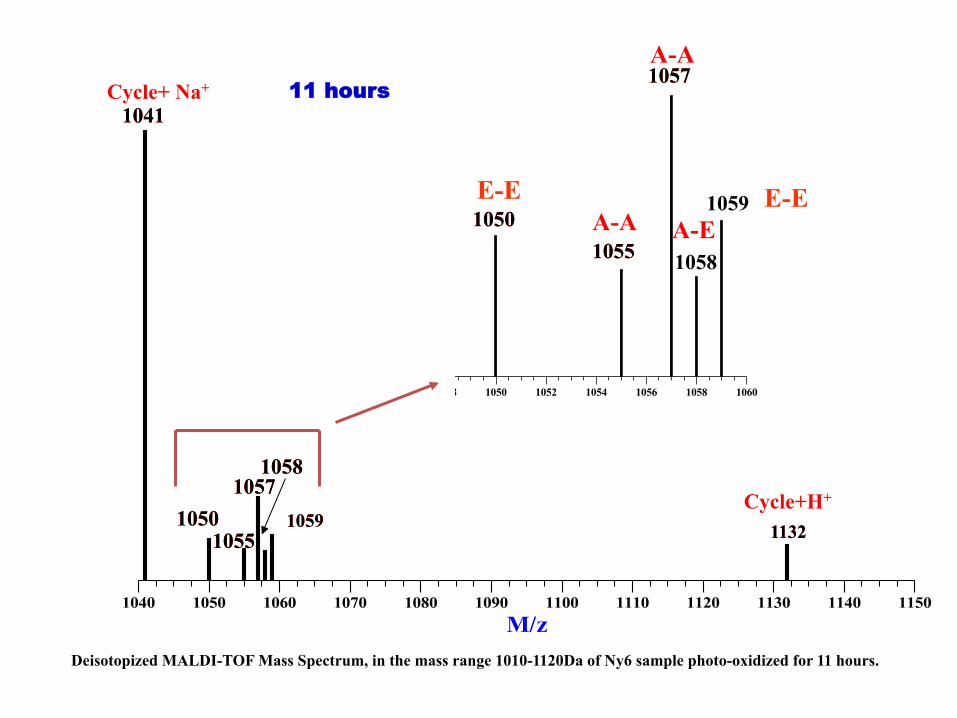
1040 1050 1060 1070 1080 1090 1100 1110 1120 1130 1140 1150M/z
1041
1055 1050
1058
1059 1132
1057
Cycle+ Na+
1041
1055 1050
1058
1059 1132
1057 Cycle+H+
1057 1057
1040 1042 1044 1046 1048 1050 1052 1054 1056 1058 1060Exposure Time (Hours)
1050 1055
1050 1055 1058
1059 A-E A-A
A-A
Deisotopized MALDI-TOF Mass Spectrum, in the mass range 1010-1120Da of Ny6 sample photo-oxidized for 11 hours.
11 hours
E-E E-E
1010 1020 1030 1040 1050 1060 1070 1080 1090 1100 1110 1120
1041
1043
1045
1055
1057
1069
1072
1073
1083
1085 1086
1100 1101 1114
1113
1013
1029
Exposition Time
289 h
A-A
A-A A-A
A-A A-E
E-A-A
E-A-A E-A
NH(CH2)5CO COOH
(CH2)5CO NH2
+
CO CH2 (CH2)4 CONH (CH2)5 NHNH(CH2)5CO
CO(CH2)4 NHCH3
n
.CO(CH2)4 NHCH2
NH(CH2)5CO CHO
O2
-CO2
+H.+H.
O2
PH
CO(CH2)4 NHCH2
O OH-H20
CO(CH2)4 NHOHC
O2
CO(CH2)4 NHHOOC
-H
.NH(CH2)5CO CO
.
-2H.
CO(CH2)2 NHCHOHC HC
CO(CH2)3 NHCHCH2
hν
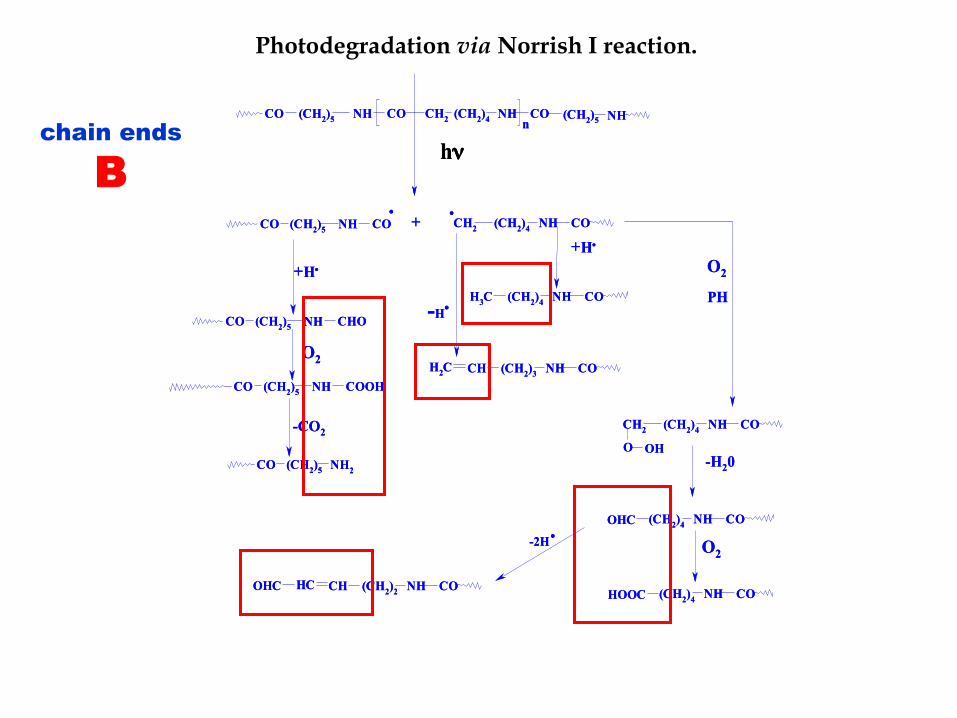
Scheme 3
Photo-Decomposition of Nylon 6 by Norrish I Reaction
NH(CH2)5CO COOH
(CH2)5CO NH2
+
CO CH2 (CH2)4 CONH (CH2)5 NHNH(CH2)5CO
CO(CH2)4 NHCH3
n
.CO(CH2)4 NHCH2
NH(CH2)5CO CHO
O2
-CO2
+H.+H.
O2
PH
CO(CH2)4 NHCH2
O OH-H20
CO(CH2)4 NHOHC
O2
CO(CH2)4 NHHOOC
-H
.NH(CH2)5CO CO
.
-2H.
CO(CH2)2 NHCHOHC HC
CO(CH2)3 NHCHCH2
hν
Scheme 3
Photo-Decomposition of Nylon 6 by Norrish I Reaction
Photodegradation via Norrish I reaction.
chain ends
B

CH2NH CH2 CH CH2 CO NH (CH2)5 COCH3+
CH2NH CH2 CH2 CH3
CO (CH2)5 NHNHCH2CO CH2CHCH2CH2
H
NH CHCH2CH2
H
CH2CH2
O
C NH CO(CH2)5
hν
Photodegradation via Norrish II reaction
chain ends
C
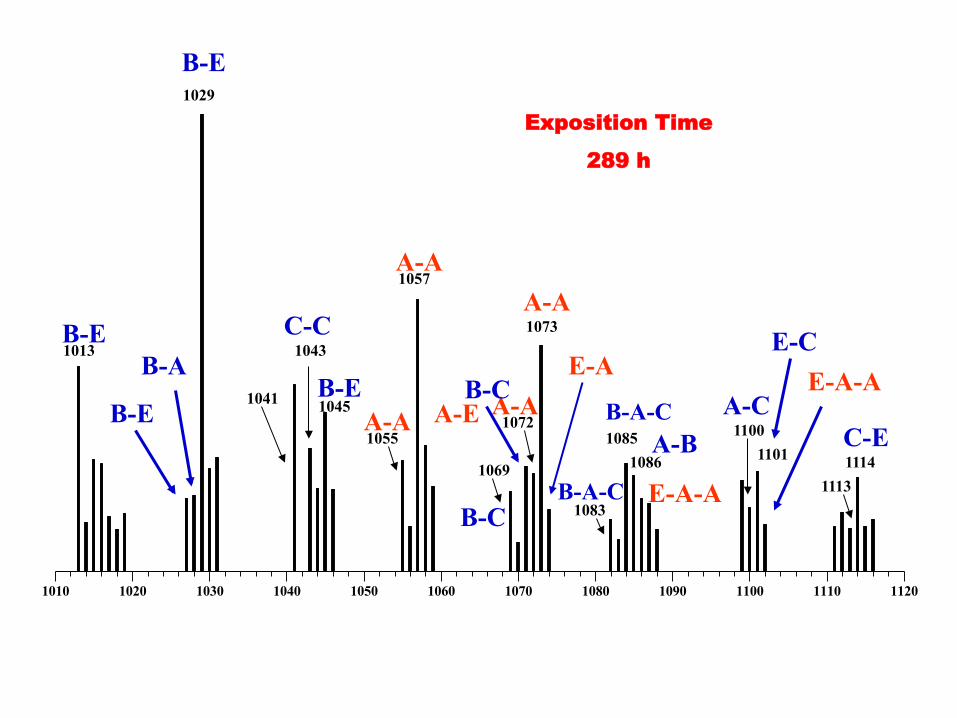
1010 1020 1030 1040 1050 1060 1070 1080 1090 1100 1110 1120
1041
1043
1045
1055
1057
1069
1072
1073
1083
1085 1086
1100 1101 1114
1113
1013
1029
Exposition Time
289 h
A-A
A-A A-A
A-A E-A
E-A-A
E-A-A A-E B-E
B-E
C-C
B-E
B-C
A-C C-E
B-A-C
B-A-C
A-B
E-C B-E B-A
B-C

-1.0 0.0 1.0 2.0 3.0 4.0 5.0 6.0 7.0 8.0 9.0
I %
0.0 0.5 1.0 1.5 2.0 2.5 3.0 3.5 4.0
0 10 20 30 40 50 Exposition Time
OH CO (CH2)5 9HNH
Decomposition via Hydroperoxide
Relative amount vs exposition time of species at m/z 1058 and 1059, as obtained from the MALDI spectra of photo-oxidized Ny6 sample
NH2 CO (CH2)5 9CONH (CH2)4 CHO
E-A
E-E

-1
0
1
2
3
% R
elat
ive
Am
ount
0 5 10 15 20 25 30 35 40 45 50Exposure Time
-0.1
0.0
0.1
0.2
0.3
0.4
0.5
0.6
% R
elat
ive
Am
ount
0 5 10 15 20 25 30 35 40 45 50Exposure Time (Hours)
Induction Period
Induction Period
Norrish II
Norrish I
CO (CH2)5 NHHN(CH2)4OHC H
8
OH CO (CH2)5 NH CO CH3
9
0
1
2
3
4
% R
elat
ive
Am
ount
0 5 10 15 20 25 30 35 40 45 50Exposure time (Hours)Exposure Time (Hours)
Figure 6(a-c) . Relative amount vs exposure time of species at m/z (a) 1029, (b) 1101 and (c)1058, as obtained from the MALDI spectra of photo-oxidized 10 µm Ny6 samples.
NH2 CO (CH2)5 HNH
9
Hydroperoxides Decomposition
Relative amount vs exposition time of species at m/z 1029 and 1100,
as obtained from the MALDI spectra of photo-oxidized Ny6 sample

CH
H
NH COCO (CH2)4 CH2 CH2 CH2 CH2 CH2 NH CO
H abstraction
NorrishI Norrish II
CO (CH2)4NH CHO
CO (CH2)4NH COOH
CO (CH2)4NH CH3
(B)
(CH2)5CO NH2
(CH2)5CO NH CHO
CO (CH2)3NH CH CH2
CO (CH2)3NH CH3
CO (CH2)2NH CH CH2
(CH2)5CO NH CO CH3
(C)
(A)
CH NH
O OH
CO (CH2)4
(CH2)4CO CHO
(CH2)4CO COOH
NH CO NH2(CH2)5
NH(CH2)4CO CO CO
hν
hνhν
Scheme 2
Overall Photo-oxidation Processes in Nylon 6.
AB
C
Overall Photo-oxidation Processes in Ny6.
30 40 50 60 70 80 90 100(°C)
a
b
c
d e
f
g
h
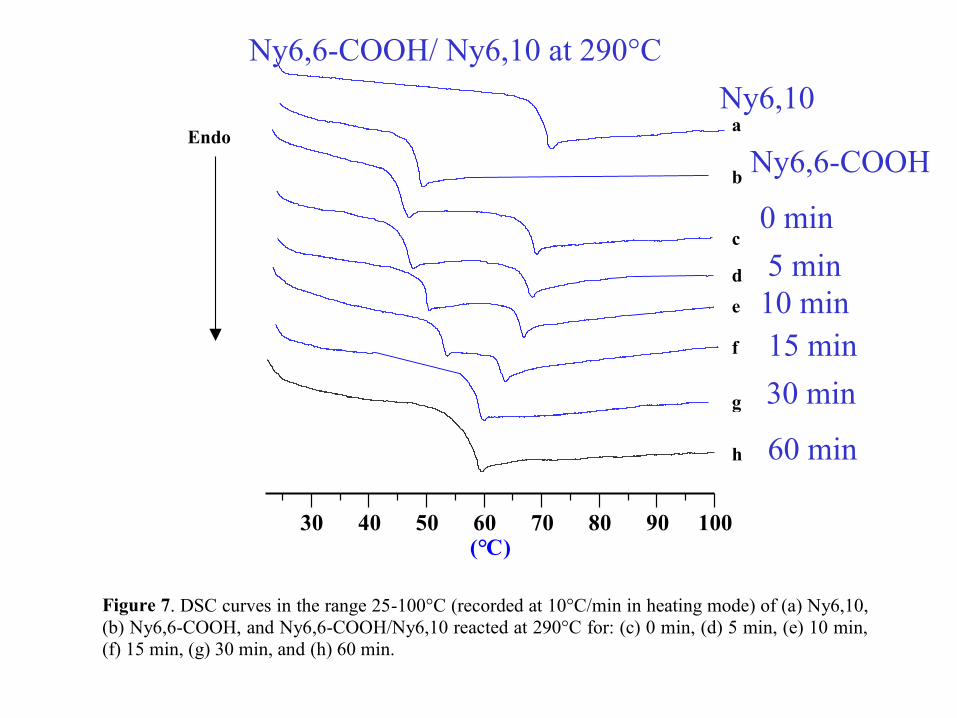
Figure 7. DSC curves in the range 25-100°C (recorded at 10°C/min in heating mode) of (a) Ny6,10, (b) Ny6,6-COOH, and Ny6,6-COOH/Ny6,10 reacted at 290°C for: (c) 0 min, (d) 5 min, (e) 10 min, (f) 15 min, (g) 30 min, and (h) 60 min.
Endo
Ny6,10
Ny6,6-COOH
Ny6,6-COOH/ Ny6,10 at 290°C
0 min 5 min 10 min 15 min 30 min
60 min
3.5
4.0
4.5
5.0
5.5
log(
Mw
)
20 21 22 23 24 25 26 27 28 29 30 31Ve (mL)
Mw PMMA standards by MALDIMw PMMA Standards by SupplierMw of PMMA Fractions by MALDI
3.5
4.0
4.5
5.0
5.5
log(
Mw
)
20 21 22 23 24 25 26 27 28 29 30 31Ve (mL)
Mw PMMA standards by MALDIMw PMMA Standards by SupplierMw of PMMA Fractions by MALDI


![PRACTICE OF POLYMER MALDI 11maldi.ch.pw.edu.pl/pomiary/Artykuly/liang-li/ocr/021-040_unity-reader.pdf · 2.2 PRACTICE OF POLYMER MALDI 11 MALDI sources [10]; these have also become](https://static.fdocuments.net/doc/165x107/5e20a425f916e801c369e9f7/practice-of-polymer-maldi-22-practice-of-polymer-maldi-11-maldi-sources-10-these.jpg)


