characterization of glass fibre reinforced polyamide/acrylonitrile ...

Characterization of Adaptive Reinforced Concrete Structures
Kirk R. Biszick
Director of Engineering
Optechnology, Inc.
5000 Allendale Drive
Huntsville, AL 35811
John A. Gilbert
Professor of Mechanical Engineering
Department of Mechanical and Aerospace Engineering
University of Alabama in Huntsville
Huntsville, AL 35899
Houssam Toutanji
Professor of Civil Engineering
Department of Civil and Environmental Engineering
University of Alabama in Huntsville
Huntsville, AL 35899
Thomas Lavin
President
Soems, Inc.
Watchung, NJ 07069
Michael T. Britz
Department of Mechanical and Aerospace Engineering
University of Alabama in Huntsville
Huntsville, Alabama 35899
Ravi K. Bommu
Department of Mechanical and Aerospace Engineering
University of Alabama in Huntsville
Huntsville, Alabama 35899
ABSTRACT
This paper discusses the research, development, and design considerations used to produce a Structural Information System
(SIS) capable of characterizing the behavior of an adaptive reinforced concrete structure designed to withstand reverse
loadings. The SIS consists of a collection of surface mounted and embedded sensors connected to a portable computer. The
composite structure is reinforced with hollow carbon fiber tendons equipped with embedded strain gages and the work
includes theoretical arguments, polymer concrete mix design, concrete testing, reinforcement selection and placement, sensor
selection and placement, and structural testing and analysis. The primary objective is to insure that the stress in the materials
remains within the elastic range so that damage does not occur. A finite element model is developed to accurately

characterize the structural response in the elastic range and a hybrid approach is suggested in which displacement, strain, and
stress can be obtained with a rudimentary SIS consisting of a single embedded sensor. The ability to characterize failure,
once it occurs, is also demonstrated by analyzing data obtained from displacement-controlled tests. Results indicate that
splices in the tendons and slippage between the tendons and the concrete help to prevent sudden failure and allow the
structure to withstand relatively high service loads despite appreciable deformation.
INTRODUCTION
Today’s common advanced composite materials are made of continuous fibers, either graphite or Kevlar®, suspended in a
polymeric matrix, typically an epoxy of some type. The technology underlying these materials has been developed over the
past sixty years and the materials have been widely used in numerous civil and aerospace applications primarily due to their
high strength-to-weight and/or stiffness-to-weight ratio. While advances in such composite materials have been steady, there
have been relatively few revolutionary changes of late. But the investigation and development of a new breed of
cementitious composite materials with matrices based on a unique hybrid blend of inorganic and organic components has the
potential to revolutionize structural design.
The designs associated with this technology are based on the strength and position of the materials in the composite section
but the overall design strategy relies mainly on the large difference in stiffness between the constituents in the composite
section to drive the internal stress from the matrix to the reinforcement [1]. Since it is possible to produce a cementitious
matrix that is more flexible than the polymeric matrices currently used to construct most advanced composite materials, these
so-called “STARS” (Strategically Tuned Absolutely Resilient Structures) offer structural and aerospace engineers more
design flexibility.
The evolution of STARS began with the production of thin, lightweight, and structurally efficient panels capable of resisting
stresses produced by reverse bending [2]. The study showed that a very efficient composite structure could be fabricated by
placing a flexible polymer-enhanced cementitious matrix having a relatively low elastic modulus over two layers of a rigid
steel wire mesh having a relatively high elastic modulus. Materials were placed symmetrically to form an '”adaptive” section
that reacted similarly when bending couples were reversed. Since the compressive strength of the cementitious material was
less than its tensile strength [3], it was the modulus of elasticity and tensile strength of the cementitious matrix, as well as the
bond strength between the matrix and the reinforcement, that impacted the design most.
A modified transform section theory was developed to determine the deflections and stresses in these highly compliant
cementitious structures [4] and the method was applied to study graphite-reinforced composites. Multi-layered composite
beams were analyzed by incorporating material properties established from standard tests and finite element modeling was
used to verify results.
The work fueled another investigation that quantified the dynamic characteristics of laminated plates [5]. In this study, an
analytical dynamic finite element model was developed to evaluate the natural frequencies and mode shapes for structures
subjected to different boundary conditions. This model was subsequently applied to study the dynamic performance of a
larger structure [6]. Numerical results compared favorably with experimental impact hammer test data. As a result, it was
concluded that the classical laminated plate theory developed for composite materials could be applied to quantify the
dynamic behavior of highly compliant composite structures made from cementitious materials.
Research performed on stiffer concretes showed that material deficiencies caused by impact could be overcome by
introducing a stiff weave-like reinforcement [7], and tests were performed to characterize the impact properties of STARS
[8,9]. Recent improvements were made in cementitious matrices by capitalizing on the atomic and molecular interaction that
occurred between constituents [10-12].
Although research in this area has progressed, most of the investigators mentioned above relied on layers of continuous
graphite fiber mesh to reinforce their sections. However, there is merit associated with embedding rebar, especially if it can
be outfitted with sensors capable of monitoring the overall performance of the reinforced cementitious structure.
Many studies have been performed by placing strain gages directly on the surface of rebar. In these cases, the lead wires are
typically wrapped around the rebar and fed to the measuring instrument. As such, the wires are embedded in the surrounding
matrix making them susceptible to lead wire effects.
In recent studies, strain gages have been installed within hollow steel rebar and sister bars. The rebar is embedded directly

into the matrix for structural purposes while the sister bar is strapped to a reinforcing element [13]. Several bars can be
joined by screwing them together.
Other vibrating wire sister bar strain meters have been used in concrete structures such as piles, diaphragm/slurry walls,
bridge abutments, tunnel lining, dams, and foundations [14]. Gages have even been embedded within a membrane to monitor
the effects associated with waterproofing roof systems of large buildings [15].
This paper discusses the research, development, and design considerations used to produce a Structural Information System
(SIS) capable of characterizing the behavior of an adaptive reinforced concrete structure designed to withstand reverse
loadings. The SIS consists of a collection of surface mounted and embedded sensors connected to a portable computer. The
composite structure is reinforced with hollow carbon fiber tendons equipped with embedded strain gages and the work
includes theoretical arguments, polymer concrete mix design, concrete testing, reinforcement selection and placement, sensor
selection and placement, and structural testing and analysis.
REINFORCED CONCRETE BEAM DESIGN
As mentioned previously, the evolution of STARS included a transition from steel to graphite mesh. This was done primarily
because graphite is ten times stronger and five times lighter than steel; graphite is also less susceptible to corrosion.
Similarly, an alternative to producing instrumented steel rebar is to manufacture discrete instrumented hollow carbon fiber
reinforced polymer (CFRP) tendons that have strain gages mounted within them. But, before these structural elements could
be embedded within a cementitious matrix to form an adaptive structure, it was necessary to characterize their material
properties and structural response [16,17].
The design of the reinforced concrete beams used to demonstrate the SIS began with determining their dimensions. In order
to comply with ASTM C78/C78M-10 [18], the standard for determining flexural strength of concrete in third-point loading,
the height and width of the beam were made 8.9 cm. The total length of the reinforced concrete section was established at
53.3 cm. This allowed a third-point test to be conducted over a 45.72 cm long span comprised of three equally distant
sections that were 15.24 cm long. The central span constitutes the constant moment section of the beam where measurements
were taken.
As illustrated in Fig. 1, an adaptive section was constructed by placing two instrumented tendons symmetrically in the
section. The carbon tendons had an inner diameter of 1.59 cm and a wall thickness equal to 1.02 mm.
Fig. 1 Typical cross section of the reinforced concrete beam
Each reinforcing element consisted of two equal length tendons sections spliced together at center span in order to facilitate
strain gage placement. The 5.08 cm long splice had an inner diameter of 1.4 cm and an outer diameter of 1.54 cm.
A strain gage was placed on the inner surface of each reinforcing element adjacent to the splice before the sections were
joined. The elements were rotated so that these gages were located at the furthest distance from the centroid of the beam.

The tendons were suspended within a wooden mold and the concrete mix, described in Table 1, was placed over them. After
the beams had cured, strain gages were placed at mid span on the upper and lower surfaces of the beam.
Table 1 Acrylic SBR mix table
SBR mix Proportion
Cement 10.08 kg 710.1 kg/m3
B-79 3.84 kg 270.5 kg/m3
Metakaolin 0.6 kg 42.27 kg/m3
Water 0.36 kg 25.36 kg/m3
Sika 0.12 kg 8.45 kg/m3
Acrylic SBR latex 4.8 kg 338.1 kg/m3
TEST SETUP
Figure 2 shows a photograph of the test apparatus. The upper roller extensions were placed 15.24 cm apart, and the lower
roller extensions were placed 45.7 cm apart. The strain gage wires from the gages placed within the tendons and on the free
surfaces of the beam were inserted into separate channels of a data acquisition system. Wires from two linear variable
differential transformers (LVDT’s) were also inserted into separate channels to ascertain the central deflection of the beam
but the deflection of the crosshead was ultimately used to establish this parameter.
Fig. 2 Beam situated within test apparatus
During the tests, the bottom of the platen moved upwards. Displacement control was used to apply load to the beam at a rate
of 1.27 mm/min. Wires from a load cell, located directly above the upper platen, were also fed into the data acquisition
system.
RESULTS AND DISCUSSION
A total of four beams were tested. Figure 3 shows plots corresponding to strain vs. deflection data taken from the strain
gages placed within the tendons in beam 1; a load vs. deflection plot is superimposed. Note that the ordinate values
correspond to both strain (µε) and load (N). Since the test was conducted in a deflection controlled manner, the abscissa
reflects the time expended during the test. In this case, the duration was 12 minutes (15.14 mm/1.27 mm/min).
Figure 4, on the other hand, shows plots corresponding to strain vs. deflection data taken from the strain gages mounted on

the upper and lower surfaces of beam 1; the load vs. deflection plot is also superimposed.
In this case, the beam remained intact until a crack developed in the central span at the lower surface of the beam. The first
crack occurred when the load reached 11.64 kN. The crack is detected by the gages and can be seen as jump discontinuities
in the load and strain plots for both the tendons (see Fig. 3) and the surface mounted gages (see Fig. 4).
Fig. 3 Beam 1 load and tendon strain plotted as a function of crosshead displacement
Fig. 4 Beam 1 load and concrete strain plotted as a function of crosshead displacement
Prior to cracking, the strains increase monotonically and fairly linearly with load. The strains in the upper tendon and top
gage are compressive while those in the lower tendon and bottom gage are tensile. The magnitudes of the strains in the
tendons are nearly equal; the same holds true for the magnitudes of the strains measured on the surface. Up until this point,
the material behavior can be construed as linearly elastic.
Referring to the plots shown in Figs. 3 and 4, immediately after the first crack occurred, the load dropped from 11.64 kN to
8.12 kN. The strain in the upper tendon decreased slightly from -1074με to -851με, whereas that in the lower tendon
significantly increased from 1004με to 1646με. At the same time, the strains on the upper and lower surfaces both decreased,
slightly more on the lower surface.
The distinct shape changes which occurred in the strain plots reflected the stress transfer from the weakened concrete, located
-4000
0
4000
8000
12000
16000
0 2 4 6 8 10 12 14 16
Lo
ad (
N),
Str
ain (
με)
Crosshead displacement (mm)
load
upper tendon strain
lower tendon strain
-16000
-12000
-8000
-4000
0
4000
8000
12000
16000
0 2 4 6 8 10 12 14 16
Lo
ad (
N),
Str
ain (
με)
Crosshead displacement (mm)
load
top concrete strain
bottom concrete strain
in the tension zone, to the lower tendon. When this happened, the neutral axis of the beam moved upward toward the top of
the beam but remained below the inside top portion of the upper tendon where the strain gage was located.
Remarkably, once this stress transfer occurred, the load continued to increase significantly to a peak value of 15.94 kN, at
which point a second crack was observed. This crack occurred in the central span on the right side about 2.54 cm inside the
right upper roller. The second crack extended up to the top of the upper tendon, and as time went on, propagated lengthwise
toward the center of the beam.
During the time between the occurrences of the first and second cracks, the magnitudes of the strains in the tendons and on
the surfaces increased, except for a slight glitch observed approximately midway through the cycle. This anomaly was later
attributed to slippage of the lower tendon within the concrete matrix.
Following the drop in load to 8.88 kN, created by the onset of the second crack, the load increased to 11.96 kN as the crack
on the right side continually widened. During this time, the compressive strains in the upper and lower tendons increased;
from -823με to -1646με and from 2901με to 4825με, respectively.
At this point, the lower tendon began to fracture which resulted in a decrease in strain from 4825με to 3096με. But the
failure did not happen instantly; since the tendon continued to sustain a tensile strain. When the fracture occurred, the
compressive strain in the upper tendon dropped from -1646με to -112με (compressive) before gradually changing to 321με
(tensile, and finally increasing to 795με when the test was halted; after 12 minutes when the crosshead deflection was 15.24
mm. During this portion of the loading cycle, the strain on the bottom surface remains fairly constant at about 950με, since
the central section was completely segmented. At the same time, the strain on the top surface became progressively higher
and increased to -12,380με as the stresses were transferred to this region.
The change in sign of the strain that occurred in the upper tendon indicated that, when the lower tendon fractured, the neutral
axis shifted even further towards the top of the beam, beyond the inside portion of the upper tendon where the gage was
located. At this point, both tendons were in tension; albeit the lower tendon had already fractured. The minor glitches in the
strain plots extracted from the tendons were later attributed to lateral movement (slippage) which occurred as the bonds
between the tendons and the concrete matrix broke.
It is significant to note that the beam sustained a load only slightly less than that which corresponded to the first crack (11.64
kN) despite appreciable deformation and readily observable damage that was observed. This remarkable performance was
attributed mainly to the symmetrical distribution of the tendons in the section and partly to the expansion joints created by
placing the splices in them. The result was so unexpected that a decision was made to extend the duration of the next three
tests to see how much deformation a beam could really take before it was readily apparent that it would collapse.
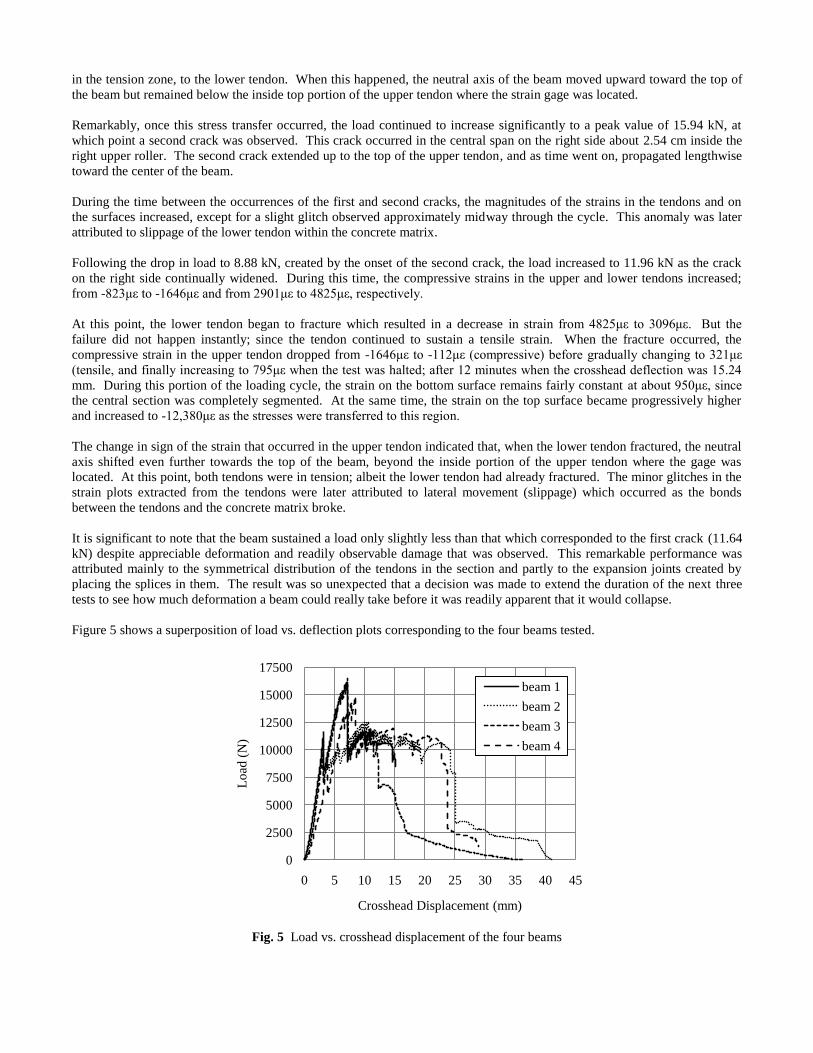
Figure 5 shows a superposition of load vs. deflection plots corresponding to the four beams tested.
Fig. 5 Load vs. crosshead displacement of the four beams
0
2500
5000
7500
10000
12500
15000
17500
0 5 10 15 20 25 30 35 40 45
Lo
ad (
N)
Crosshead Displacement (mm)
beam 1
beam 2
beam 3
beam 4

It is readily apparent that these curves provide a measure of structural integrity as well as valuable clues regarding how
damage took place and progressed. A similar conclusion can be reached regarding the output from the sensors in the
structural information system. It is also apparent that the structural performance of these reinforced concrete beams is nearly
the same up to the first crack but it may be very different after that. The discussions included below show that it is possible
to produce a finite element model that accurately characterizes the structural behavior and, as a result, a structural
information system containing a single sensor is all that is required to completely define the displacement, strain, and stress
for every point in the structure.
FINITE ELEMENT ANALYSIS (FEA) OF REINFORCED CONCRETE BEAMS: CONCRETE
A finite element model was developed to quantify the structural behavior of the beams while they remained within the elastic
range. The analysis was performed using NX Nastran and Patran 2010. The model was developed using FEMAP, imported
into Patran, solved in Nastran, and then post processed in Patran. The beam section was made 45.7 cm long. It was simply
supported on the bottom at both ends along the direction of the width. This corresponded to the position of the bottom rollers
of the loading frame used to test the beams. In order for the model to successfully run, a single fixed point was required to be
placed somewhere along the bottom roller. This was done at the center of the right roller for reasons of symmetry and
convenience.
The finite element model utilized the material properties gleaned from the concrete tests and the tendon tests. For the
concrete, modeled as an isotropic material, Ec = 3.82 GPa and ν = 0.255. For the nominal portion of the fused tendon, EL =
98.6 GPa, ET = 13.03 GPa. For the fused portion of the same tendon, EL = 103.2 GPa, ET = 20.9 GPa. A Poisson’s ratio of
0.27 was used for both portions of the fused tendon.
Since the model was developed in tandem with structural testing, deflections and strains are presented for a simulated load
case of 11.12 kN. To simulate the loads placed at the upper rollers at the 15.24 cm center span, a 5.56 kN load was
distributed along the width of the beam at the position of each of the rollers. These two loads when added together constitute
the 11.12 kN load. This load case was selected because it approximated the load value to the first crack of the first two
beams tested. Comparisons are made with test results by multiplying the analytical results by a scale factor of 0.953 that
reflects the average load to the first crack for beams 1 through 4 which was 10.61 kN.
A linear elastic constitutive model was used, because it was assumed that the deflections occurred within the linear elastic
range. The mesh element used to simulate the carbon fiber tube was a 2D quadrilateral shell (or plate) element called
CQUAD4. The elements were assigned a thickness of 0.89 mm, corresponding to the thickness of the carbon fiber in the
1.59 cm diameter tube.
In the 5.08 cm long region of the fused piece, elements were assigned a thickness of 1.73 mm. This accounts for the
thickness of the 0.89 mm tube plus that of the 0.84 mm splice. The rest of the fused tube was correctly aligned by assigning
the material orientation <0. 1. 0.>, which aligned the tube with the local Y axis coordinate system.
The solid elements used for the concrete in the model were a solid hexagonal element called CHEXA8. Locations of node
points of the concrete elements in the region of the tendons were joined with the nodes from the tendons so that the model
would perform correctly.
Figure 6 shows a contour plot of the strain in the concrete beam. The beam model is oriented so that the strain on the top of
the beam can be more easily identified. By inspecting the contour plot, the color of the top of the beam can be matched with
the color key identifying the corresponding range of strain in the model. In the small region over which the gage was placed,
strains range from -1170με to -1910με.
In order to more precisely determine the strain in the top of the concrete, maximum and minimum ranges of the color key are
modified during post-processing. In this case, -1170με to -1910με are inserted and results obtained. Then the process is
repeated for a smaller range. This produces a rendition in which the contour plot is isolated to the upper surface of the beam
between the load points (see Fig. 7). Based on the contour plot in Fig. 7, the strain at the very center of the span ranges from
-1795με to -1806με, with an average of-1800.5με. This value is compared to the test results of the beams.

Fig. 6 Concrete strain, oriented to show strain on top
Fig. 7 Concrete strain on top, with strains isolated between the load points
FINITE ELEMENT ANALYSIS (FEA) OF REINFORCED CONCRETE BEAMS: TENDONS
Figure 8 shows a contour plot of the strain in the tendons. The beam model is oriented so that the strain on the top of the
upper tendon can be more easily identified. By inspecting the contour plot, the color of the top of the tendon can be matched
with the color key identifying the corresponding range of strain in the model. This shows the strain range in the top of the
upper tendon in the region where the gage was placed. Those values range from -900με to -1100με. The contour plot is of
the maximum strains in the tendons, so the figure most accurately interprets the strains on the outside of the tendon. Note
that the strain gage was placed on the inside of the tendon.
In order to more precisely determine the strain in the top of the upper tendon in the region where the strain gage was placed,
maximum and minimum ranges of the color key are again modified during post-processing. In this case, -550με to -1100με
are inserted and results obtained. This produces a picture where the contour plot is isolated to a portion of the upper surface
of the tendon (see Fig. 9). The contour plot in Fig. 9 is of the inner strains in the tendons, so the figure most accurately
interprets the strains on inside of the upper tendon. Based on the contour plot, the strain in the region of the upper gage

indicates the strain ranges between -1063με and -1100με, with an average of -1082με. This value is compared to the test
results of the beams. Close inspection of the contour plots in Figs. 8 and 9 shows that there is a longitudinal strain gradient
along the length of the tendon, highest in the region just beyond the center of the fuse piece.
Fig. 8 Tendon strain, oriented to show outer strain in the top of the upper tendon
Fig. 9 Tendon strain, oriented to show inner strain isolated in the top of the upper tendon
COMPARISON OF FEM AND SIS RESULTS
The finite element model was designed to characterize the elastic behavior of the concrete reinforced beams. A comparison
of the results of the four beams corresponding to the point at which the first crack occurred was performed to verify the
model. The average load to the first crack for the beams was 10.61 kN. The finite element model was developed in tandem
with structural testing; deflections and strains were presented for a simulated load case of 11.12 kN. Thus, comparisons can
be made with the test results by multiplying the analytical results by a scale factor of 0.953.
Figure 10 shows plots corresponding to strain vs. deflection data taken from the strain gages placed within the upper and
lower tendons, respectively. The results are presented for all four beams and only up to the point at which the first crack

occurred. The average value of the strain in the upper tendon is -1011µε, whereas the average value in the lower tendon is
871.5µε. The strains predicted by the model on the inner surfaces (see Fig. 9) were equal to -1082µε and 1135µε,
respectively. When multiplied by the scale factor, strains of -1031µε and 1082µε, respectively, are predicted. Assuming that
the model is correct, the percentage errors are 1.9 and 19.5%, respectively.
Fig. 10 Load vs. upper tendon strain (left) and lower tendon strain (right) in the four beams, to first crack
Figure 11 shows plots corresponding to strain vs. deflection data taken from the strain gages placed on the upper and lower
surfaces, respectively. The results are presented for all four beams and only up to the point at which the first crack occurred.
The average value of the strain on the upper surface is -1537.5µε, whereas the average value on the lower surface is 1736µε.
The strains predicted by the model on the upper and lower surfaces (see Fig. 7) were equal to -1800.5µε and 1861µε,
respectively. When multiplied by the scale factor, strains of -1716µε and 1774µε, respectively, are predicted. Assuming that
the model is correct, the percentage errors are 10.4 and 2.1%, respectively.
Fig. 11 Load vs. top concrete strain (left) and bottom concrete strain (right) in the four beams, to first crack
The average value of the tensile stress on the lower surface was 6.63 MPa. The tensile stress predicted by the model is 7.58
MPa. When multiplied by the scale factor, a tensile stress of 7.23 MPa is predicted. Assuming that the model is correct, the
percentage errors are 10.4 and 2.1%, respectively.
0
2000
4000
6000
8000
10000
12000
-1200-1000-800-600-400-2000
Lo
ad (
N)
Upper tendon strain (με)
beam 1
beam 2
beam 3
beam 4
FEA
0
2000
4000
6000
8000
10000
12000
0 200 400 600 800 1000 1200
Lo
ad (
N)
Lower tendon strain (με)
beam 1
beam 2
beam 3
beam 4
FEA
0
2000
4000
6000
8000
10000
12000
-2500-2000-1500-1000-5000
Lo
ad (
N)
Top concrete strain (με)
beam 1
beam 2
beam 3
beam 4
FEA
0
2000
4000
6000
8000
10000
12000
0 500 1000 1500 2000 2500
Lo
ad (
N)
Bottom concrete strain (με)
beam 1
beam 2
beam 3
beam 4
FEA

Table 2 summarizes the load, strain, and stress to the first crack in the beams, and compares them to the results obtained from
the FEA. Considering that there are deviations in the strain plots from beam to beam and that the strain response is
somewhat non-linear just before the beams crack, the model predicted the structural behavior quite well. If the beams were
placed more consistently, the model may have done even better.
Table 2 First crack summary of beams 1 through 4, with test results compared to FEA
Beam 1 Beam 2 Beam 3 Beam 4 Beam average FEA result
Load 11.64 kN 10.88 kN 10.12 kN 9.75 kN 10.60 kN 10.60 kN
Upper
tendon strain -1074με -1255με -795με -920με -1011με -1031με
Lower
tendon strain 1004με 976με 753με 753με 871.5με 1082με
Top
concrete strain -1869με -1576με -1269με -1436με -1537.5με -1716με
Bottom
concrete strain 1757με 2259με 1436με 1492με 1736με 1774με
Bottom
concrete stress 6.72 MPa 8.63 MPa 5.49 MPa 5.70 MPa 6.63 MPa 7.23 MPa
There is also a possibility of tuning the model with the data extracted from the structural information system or making the
model more sophisticated by incorporating an iterative procedure to account for things like changes in the elastic modulus
with strain.
HYBRID ANALYSIS
Provided that an accurate model can be developed, it should be possible to monitor the strain at any location and by scaling
the reading, predict the displacements, strains and stresses at every point in the structure. Although this approach is only
valid while the structure is in the elastic range, it has the potential to change the way in which structural monitoring is
currently performed and could significantly lessen the associated work and cost.
CONCLUSIONS
This paper showed that a structural information system can be developed to monitor an adaptive structure designed to resist
reverse loadings. The primary objective was to insure that the stress in the materials remained within the elastic range so that
damage did not occur.
A finite element model was developed to accurately characterize the structural response in the elastic range and a hybrid
approach was suggested in which displacement, strain, and stress could be obtained with a rudimentary SIS consisting of a
single embedded sensor.
The ability to characterize failure, once it occurred, was also demonstrated by analyzing data obtained from displacement-
controlled tests. Results indicated that splices in the tendons and slippage between the tendons and the concrete helped to
prevent sudden failure and allowed the structure to withstand relatively high service loads despite appreciable deformation.
ACKNOWLEDGMENTS
The authors would like to thank the United States Army Research, Development, and Engineering Center (AMRDEC) of the
Research, Development, and Engineering Command (RDECOM) at Redstone Arsenal in Huntsville, Alabama, for supporting
this research under the Department of Defense (DOD) Small Business Innovative Research (SBIR) Phase I, Phase I Option,
and Phase II contract no. W31P4Q-05-C-R103. Portions of the work were also funded by the U.S. Department of Commerce
under NOAA SBIR Phase I and Phase II contract no. WC133R-09-CN-0108. The authors would also like to thank Dr. Bo
Xu for his contribution to the PVB concrete development and Mr. Rajesh Vuddandam for his contribution to beam testing
with the data acquisition system. Any opinions, findings, conclusions or recommendations expressed in this publication are
those of the authors and do not necessarily reflect the views of the funding agencies previously mentioned.

REFERENCES [1] Biszick, K.R., Toutanji, H.A., Gilbert, J.A., Marotta, S.A, Ooi, T.K., “Evolution of strategically tuned absolutely resilient structures (STARS),” Proc. of SEM Annual Conference & Exposition on Experimental and Applied Mechanics, Saint Louis, Missouri, Paper No. 32, 7 pages, 2006. [2] Biszick, K.R., Gilbert, J.A., “Designing thin-walled, reinforced concrete panels for reverse bending,” Proc. of the SEM Spring Conference on Theoretical, Experimental and Computational Mechanics, Cincinnati, Ohio, pp. 431- 434, 1999. [3] Brara, A., Klepaczko, J.R., “Experimental characterization of concrete in dynamic tension,” CNERIB, Algeria and Laboratory of Physics and Mechanics of Materials, Ile de Saulcy, France, 2005. [4] Vaughan, R.E., Gilbert, J.A., "Analysis of graphite reinforced cementitious composites," Proc. of the SEM Annual Conference and Exposition, Portland, Oregon, pp. 532-535, 2001. [5] Ooi, T.K., Gilbert, J.A., Bower, M.V., Vaughan, R.E., Engberg, R.C., “Modal analysis of lightweight graphite reinforced silica/polymer matrix composite plates,” Experimental Mechanics, 45(3), pp. 1-5, 2005. [6] Ooi, T.K., Engberg, R.C., Gilbert, J.A., Vaughan, R.E., Bower, M.V. “Modal testing of a lightweight cementitious structure,” Experimental Techniques, November/December, pp. 37-40, 2004. [7] Badr, A., Ashour, A.F., Platten, A.K., “Statistical variations in impact resistance of polypropylene fibre-reinforced concrete,” International Journal of Impact Engineering, 32(11), pp. 1907-1920, 2006. [8] Binek, L.A., Gilbert, J.A., Ooi, T.K., Bower, M.V., Biszick, K.R., “Ballistic testing of STARS,” Proc. of SEM Annual Conference & Exposition on Experimental and Applied Mechanics, Springfield, Massachusetts, Paper No. 196, 10 pages, 2007. [9] Xu, B., Toutanji, H., Gilbert, J.A., “Impact resistance of poly(vinyl alcohol) fiber reinforced high-performance organic aggregate cementitious material,” Cement and Concrete Research, 40, pp. 347-351, 2010. [10] Lavin, T., Toutanji, H., Xu, B., Ooi, T.K., Biszick, K.R., Gilbert, J.A., “Matrix design for strategically tuned absolutely resilient structures (STARS),” Proc. of SEM XI International Congress on Experimental and Applied Mechanics, Orlando, Florida, Paper No. 71, 12 pages, 2008. [11] Toutanji, H., Xu, B., Gilbert, J.A., Lavin, T., “Properties of poly(vinyl alcohol) fiber reinforced high-performance organic aggregate cementitious material: converting brittle to plastic,” Construction and Building Materials, 24(1), pp. 1-10, 2010. [12] Xu, B., Toutanji, H.A., Lavin, T., Gilbert, J.A., “Characterization of poly(vinyl alcohol) fiber reinforced organic aggregate cementitious materials,” Polymers in Concrete, 666, pp. 73-83, 2011. [13] Instrumented rebar and sister bar, Model IRHP and IRCL, RockTest Limited company (Ltd.) Telemac subsidiary data sheet, Saint-Lambert, Quebec, Canada, available on the web at http://www.roctest-group.com/sites/default/files/datasheets/products/IRHP-E50138-W.pdf, pp. 1-2, 2005. [14] Encardio-rite: Excellence through ingenuity: Model EDS-12V vibrating wire sister bar strain meter product sheet, Encardio-rite Electronics, Lucknow, India, available on the web at: http://encardio.com/strain_gage.asp, pp. 1-2, 2008. [15] Sanchez, J., Andrade, C., Fullea, J., “Hydrothermal monitoring using embedded sensors of the actual roof system of the Prado Museum,” Construction and Building Materials, 24(12), pp. 2579–2589, 2010. [16] Bommu, R.K., Development of instrumented tendons for embedment in a structural information system, Master’s Thesis, Department of Mechanical and Aerospace Engineering, University of Alabama in Huntsville, 2010. [17] Biszick, K.R., Design of a Structural Information System (SIS) for Strategically Tuned Absolutely Resilient Structures (STARS), Ph.D. Dissertation, Department of Civil and Environmental Engineering, University of Alabama in Huntsville, 2010. [18] ASTM C78/C78M-10, Standard test method for flexural strength of concrete (using simple beam with third-point loading), technical committee document, American Society for Testing and Materials (ASTM) Committee C09.61, West Conshohocken, Pennsylvania, 2010.