CHARACTERISTICS OF URBAN WOODLANDS AFFECTING …
15
Landscape and Urban Planning, 14 (1987) 481-495 481 Elsevier Science Publishers B. V., Amsterdam - Printed in The Netherlands CHARACTERISTICS OF URBAN WOODLANDS AFFECTING BREEDING BIRD DIVERSITY AND ABUNDANCE NANCY G. TILGHMAN 1 USDA Forest Service, Northeastern Forest Experiment Station, Holdsworth Hall, University of Massachusetts, Amherst, MA 01003 (U.S.A.) (Accepted for publication 18 March 1987) ABSTRACT Tilghman, N. G., 1987. Characteristics of urban woodlands affecting breeding bird diversity and abundance. Landscape Urban Plann., 14: 481-495. Breeding bird communities were studied in 32 forest islands surrounded by urban develop- ment. These isolated woodlands in Springfield, Massachusetts, provided breeding habitats for a wider variety of birds (77 species) than previ- ously described for other urban habitats (e.g. four times as many species as found in urban residential areas in the same city in a previous study). The size of the woodland was the pri- mary influence on bird diversity in these wood- lands, explaining 79 and 75% of the variation in total species richness and the Shan- non-Weaver index of bird species diversity, re- spectively. Other woodland characteristics that played a significant role in determining the va- riety of bird species were the density of build- ings in the area immediately adjacent to the woods, density of shrubs within the woods, dis- tance to the nearest trail, distance to the nearest body of water and average canopy height. Per- centage of coniferous tree cover was the most important variable in explaining the variation in the number of birds detected at a sampling point (R 2 =0.26). Information on the distance to the nearest trail, distance to the nearest body of water and distance to the nearest extensive forest area were also important in determining the number of bird sightings. The size of the woodland (1-69 ha) played an important role in the distribution of individual bird species. About half of all species observed in these wood- lands were more commonly found in the larger woods (43-69 ha). Eight species were more abundant in the smallest woodlands (1-5 ha), and a few others were apparently insensitive to the size of the woodland. Specific recommen- dations are made to improve the design and management of urban woodlands for enrich- ment of the avifauna within a city. 1 Present address: Redwood Sciences Laboratories, 1700 Bayview Drive, Arcata, CA 95521, U.S.A.
Transcript of CHARACTERISTICS OF URBAN WOODLANDS AFFECTING …
Landscape and Urban Planning, 14 (1987) 481-495 481 Elsevier Science Publishers B. V., Amsterdam - Printed in The Netherlands
CHARACTERISTICS OF URBAN WOODLANDS AFFECTING BREEDING BIRD DIVERSITY AND
ABUNDANCE
NANCY G. TILGHMAN1
USDA Forest Service, Northeastern Forest Experiment Station, Holdsworth Hall, University of Massachusetts, Amherst, MA 01003 (U.S.A.)
(Accepted for publication 18 March 1987)
ABSTRACT
Tilghman, N. G., 1987. Characteristics of urban woodlands affecting breeding bird diversity and abundance. Landscape Urban Plann., 14: 481-495.
Breeding bird communities were studied in 32 forest islands surrounded by urban develop- ment. These isolated woodlands in Springfield, Massachusetts, provided breeding habitats for a wider variety of birds (77 species) than previ- ously described for other urban habitats (e.g. four times as many species as found in urban residential areas in the same city in a previous study). The size of the woodland was the pri- mary influence on bird diversity in these wood-lands, explaining 79 and 75% of the variation in total species richness and the Shan- non-Weaver index of bird species diversity, re-spectively. Other woodland characteristics that played a significant role in determining the va- riety of bird species were the density of build- ings in the area immediately adjacent to the
woods, density of shrubs within the woods, dis-tance to the nearest trail, distance to the nearest body of water and average canopy height. Per-centage of coniferous tree cover was the most important variable in explaining the variation in the number of birds detected at a sampling point (R2=0.26). Information on the distance to the nearest trail, distance to the nearest body of water and distance to the nearest extensive forest area were also important in determining the number of bird sightings. The size of the woodland (1-69 ha) played an important role in the distribution of individual bird species. About half of all species observed in these wood-lands were more commonly found in the larger woods (43-69 ha). Eight species were more abundant in the smallest woodlands (1-5 ha), and a few others were apparently insensitive to the size of the woodland. Specific recommen-dations are made to improve the design and management of urban woodlands for enrich-ment of the avifauna within a city.
1Present address: Redwood Sciences Laboratories, 1700 Bayview Drive, Arcata, CA 95521, U.S.A.

482
INTRODUCTION
Wildlife can be found in many habitats within the city. Typical urban species are as-sociated with high-density industrial or resi-dential areas. Many of these species are exotics that have capitalized on the presence of man-made nest sites (e.g. roof eaves, building ledges) and food sources (e.g. garbage, bird feeders). Remnants of natural communities of the region can often be found in isolated patches of undeveloped habitat. One of the most important types of undeveloped habitat for wildlife in the city is the woodland. Tregay (1979) defines urban woodlands as wooded landscapes ranging in size from large forests to small patches. The lower size limit may vary, but he suggests that an urban woodland may be as small as 0.5 ha as long as there is a mini-mum of disturbance to its flora and fauna. The role that these small ecosystems play in pro-viding the urban dweller with a "biological, psychological and romantic link with nature" is significant (Tregay, 1979, p. 294).
Several studies have shown that people who live in cities appreciate the chance to see wild-life, especially the opportunity to observe birds (Dagg, 1970; Brown and Dawson, 1978; Wit-ter et al., 1981; Yeomans and Barclay, 1981). Development of an appreciation of nature in early childhood can lead to years of enjoyment of the out-of-doors and a more environmen-tally concerned citizenry. Bird-watching is en-joyed by a wide range of people and is considered a sport by some and a form of na-ture study by others. Therefore, from both a recreational and educational viewpoint, it should be the goal of municipal and state agen-cies to provide urban dwellers with nearby nat-ural areas that meet the habitat requirements of a variety of wildlife, including birds. This study was designed to determine the character-istics of urban woodlands that support the greatest diversity and abundance of breeding birds in Springfield, Massachusetts. Secondar-
ily, this study attempts to demonstrate the re-lationship between individual bird species and the size of the woodlands.
STUDY AREAS
This study was conducted in Springfield (Hampden County), Massachusetts (42○07'N, 72○35'W), in the Connecticut River valley. Springfield is a city of 152 000 people and covers about 85 km2. The city is part of a larger urban complex with three other cities (Chicopee, Holyoke and West Spring-field), having a total population of about 310 000 people (MacConnell, 1975). The av-erage winter temperature is - 2○C and the av-erage summer temperature is 22○C; mean annual precipitation is 112 cm (Mott and Swenson, 1978).
Forests cover about 65% of Hampden County. These forests lie in the transition zone between the northern hardwood forest of northern New England and the oak-hickory forest of southern New England. Urban devel-opment occurs in 13% of the county and is mainly concentrated in the area in and around Springfield (MacConnell, 1975). Although pre-settlement vegetation was primarily forest, only 18% of the city remains in forest cover; much of this has been extensively altered. Thirty-two urban woodlands, ranging in size from 1 to 69 ha, were selected from these remnant patches of wooded habitat (Fig. 1). All mixed hard-wood stands larger than 1 ha were included in the study. Manicured woods in which the un-derstory had been eliminated and replaced by lawn cover were not used. Woodlands that were not isolated from the extensive forests of the region by urban development were also not included.
Study sites included portions of city parks, natural areas set aside by the local conserva-tion commission, wooded school land and a few privately owned woodlands (Tilghman,

483
Fig. 1. Location of study areas in Springfield, Massachusetts.
1983). Many of the remnant woods were lo-cated on land unsuitable for urban develop-ment, such as steep-sided ravines, and comprised a mixture of upland and lowland forest types. The major upland tree species were northern red oak (Quercus rubra), black oak (Q. velutina), eastern hemlock (Tsuga canadensis) and eastern white pine (Pinus strobus), occurring on both flat sites and on the steep slopes of the ravines. Red maple (Acer rubrum) and American elm (Ulmus ameri-cana) dominated the stream bottoms and drainage areas.
Although these areas did not include mani-cured parklands, many of the study sites were subject to heavy human use. Trails of various widths were common in several of the woods. A few of the woodlands had paved roadways, but most of these were blocked off. Motorized traffic in the form of dirt bikes used the trails in some woodlands, but most human travel was on foot. Neighborhood children often played in and explored the woodlands. People living near the woodlands used theme as dump sites
for lawn and garden refuse and junk metal. Young people sometimes used certain areas for beer drinking, target practice, fishing and other recreational activities.
METHODS
Birds in each woodland were sampled three times during each breeding season for 2 years. Surveys were conducted from 25 May to 30 June 1980 and from 1 to 30 June 1981 on clear calm mornings from sunrise to 09.00 EDT. Sampling was conducted at systematically-lo-cated points in each woodland. All points were at least 100 m apart and 50 m from the nearest edge. The detection area associated with each sampling point covered approximately 0.8 ha. As many sampling points as could be fitted into each woodland were used up to a maximum of 10. In woodlands > 10 ha, sampling points were evenly distributed throughout the woods so that samples were independent and all por-tions of the woods were sampled. Thus, a uni-form proportion of each woodland was

484
sampled in woodlands < 10 ha, but because we were limited to only 10 sampling points per morning in woodlands > 10 ha, sampling in-tensity in these large woodlands varied. Ob-servers were selected from experienced birdwatchers and trained in the sampling tech-nique prior to the field season. The training period included field exercises in which all ob-servers counted birds at the same point at the same time. Differences in results were dis-cussed and problems in identification of spe-cies and individuals were highlighted. Four observers counted birds on a total of 193 sam-pling points each year, recording all birds heard or seen during a 20-min period. Fly-overs, ob-vious migrants, or birds outside the woods were not included. Care was taken to prevent dou- ble records of individuals at the same or adja-cent sampling points.
The number of different bird species ob-served in each woodland was determined from all three visits. In an effort to adjust for differ-ences in sampling intensity in woodlands > 10 ha, a jackknife procedure (Miller, 1964) was applied to the number of bird species ob-served. This procedure produced an estimate of the number of bird species that would have been observed in each woodland if an unlim-ited number of bird sampling points had been located. The jackknife estimator of the num- ber of species in a woodland was used as a de-pendent variable in the multiple regressions described below, but since use of this artificial variable did not improve the predictability of the number of species present, these results will not be included in further discussions. An in-dex of bird species diversity (H') was calcu-lated (Shannon and Weaver, 1949) using natural logarithms. At each sampling point and for each year, an index of the abundance of each species was taken to be the highest num-ber of individuals recorded on any one visit. The average number of sightings per point was calculated for each species in each woodland; these values were also combined to give the av-erage number of bird sightings per point for
each woodland. The estimates of the average number of sightings do not give density esti-mates, but they were used as an index to bird abundance in each woodland. The hazard of adding averages for bird species of different detectabilities was recognized, but preliminary examination of data for highly detectable and less detectable species showed no relationship between average sightings of these species and the major independent variables. Thus, the av-erage number of birds detected per point for all points in a woodland was used as an index to bird abundance.
Various measures of the size, isolation, veg-etation characteristics and human activity were determined for each of the 32 urban wood-lands. The area and perimeter of each wood-land were determined from aerial photographs. In addition to using the area (size in ha) as a variable by itself, information on the area and perimeter of each woodland were combined into another variable indicating the relative amount of edge present (Patton, 1975). Pat-ton's formula for this edge index (DI) is DI= TP/[2 (Aπ)0.5], where TP is the total pe-rimeter of the woodland and A is the area. The distance (m) to the nearest extensive woods (>400 ha) was also measured from aerial photographs and represented the degree of iso-lation of these urban woodlands from the near-est natural forest bird community that might serve as a source for immigrating individuals. The distance (m) to the nearest body of water (e.g. lake, pond, stream or creek) was meas-ured at each sampling point and the overall soil moisture of each woodland was classified into one of three classes (1 =wet, 2= intermediate, 3 =dry) based on information on the depth to the high-water table as reported by Mott and Swenson (1978).
Several variables characterizing the vegeta-tion were measured in 0.04-ha plots centered on the bird-sampling points. In an effort to better characterize the vegetation in the small-est woodlands, a minimum of four vegetation plots were taken in those woods with less than

four bird-sampling points. Tree density (No. ha-1) was determined by the point-centered quarter method (Cottam and Curtis, 1956). The height (m) of each of the sampled trees was measured by means of a Haga altimeter or telescoping pole, and the percentage of trees that were coniferous was recorded. Shrub den-sity (No. ha-1) was measured on two 0.002- ha strips at each plot (James and Shugart, 1970; James, 1978). A spherical densiometer was used to estimate percentage canopy clo-sure at five locations on each plot. The struc-ture of the vegetation in each woodland was also determined at these five sampling points on each 0.04-ha plot. At each point, three lay-ers (0-0.6 m, 0.6-6.1 m, > 6.1 m) were eval-uated for presence or absence of vegetation. Thus an index of the amount of layering of the vegetation was calculated as a value from 0 to 300 based on the sum of the percentage of points that had some form of vegetation in each of the three layers (after Karr, 1968).
One major difference between these wood-lands and forests outside the city is the in-creased human activity in and around each wood. Because of the large number of urban woodlands involved in this study, the human activity associated with each woodland was measured indirectly. An index of the degree of human disturbance within each woodland was established as the distance (m) from each bird-sampling point to the nearest trail or to the edge of the wood, whichever was closer. The level of human activity in the area immediately adja-cent to the wood was defined as the density of buildings (No. ha-1) in a 90-m strip around the wood.
Multiple regression techniques were em-ployed to examine the relationship between the independent habitat variables and the depen-dent bird variables. Simple regressions of every combination of habitat and bird variables were used to detect those habitat variables having significant association with the dependent variables, and to investigate the form of that relationship (straight line or curvilinear). For
485 each habitat variable, the simple regression with the highest R2 dictated the form used as an independent variable in the multiple regres-sion analyses. Dependent variables included two measures of bird diversity the number of bird species observed (S), and bird species di-versity (H') and one measure of bird abun-dance the average number of birds detected per sampling point (NMBIRDS).
The average number of sightings of individ-ual bird species in urban woodlands of differ-ent sizes served to demonstrate the degree of sensitivity of the species to "island" size. Spe-cies that were observed fewer than six times in a single year were not included in this analysis. Regression analyses of the abundance indices of each of the remaining bird species on the corresponding size of urban woodland sug-gested the direction and significance of this re-lationship. Significant regression equations that explained a high proportion of the varia-tion in a species' abundance and had a positive slope indicated that the species was more com-mon in large woodlands; significant regres-sions with a negative slope indicated that the species were more common in smaller woodlands.
RESULTS
Bird communities
Seventy-seven different bird species were observed during the breeding season in the 32 study areas (Table 1). On average, 32.5 species (SD = 8.5, N = 64; 193 sampling points X2 years) were observed in any one woodland in one season. The average number of species ob-served per sampling point was 20.7 (SD = 4.0, N = 386); the average number of birds ob-served per point was 48.1 (SD =10.7, N= 386). Although typical urban bird species were found in these woodlands, several species associated with more rural habitats were also found (mostly insectivores, e.g. the cuckoos, pileated woodpecker, some of the flycatchers, brown
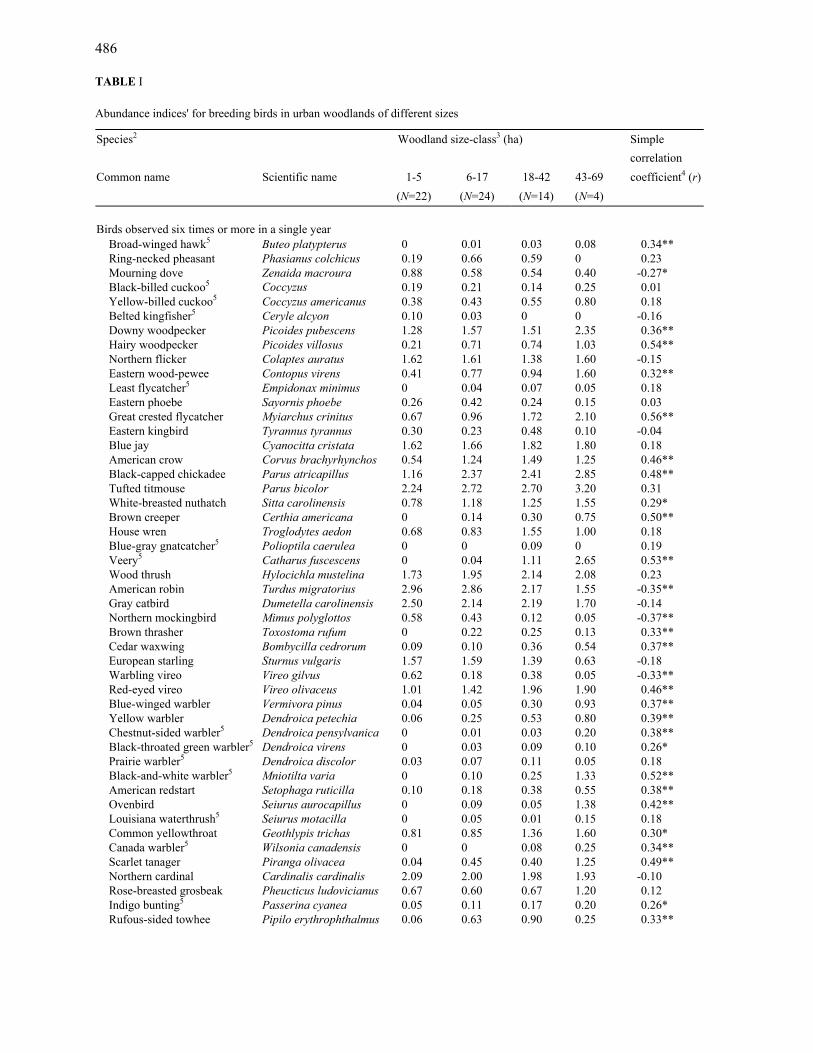
486 TABLE I Abundance indices' for breeding birds in urban woodlands of different sizes
Species2 Woodland size-class3 (ha) Simple correlation
Common name Scientific name 1-5 6-17 18-42 43-69 coefficient4 (r) (N=22) (N=24) (N=14) (N=4)
Birds observed six times or more in a single year Broad-winged hawk5 Buteo platypterus 0 0.01 0.03 0.08 0.34** Ring-necked pheasant Phasianus colchicus 0.19 0.66 0.59 0 0.23 Mourning dove Zenaida macroura 0.88 0.58 0.54 0.40 -0.27* Black-billed cuckoo5 Coccyzus 0.19 0.21 0.14 0.25 0.01 Yellow-billed cuckoo5 Coccyzus americanus 0.38 0.43 0.55 0.80 0.18 Belted kingfisher5 Ceryle alcyon 0.10 0.03 0 0 -0.16 Downy woodpecker Picoides pubescens 1.28 1.57 1.51 2.35 0.36** Hairy woodpecker Picoides villosus 0.21 0.71 0.74 1.03 0.54** Northern flicker Colaptes auratus 1.62 1.61 1.38 1.60 -0.15 Eastern wood-pewee Contopus virens 0.41 0.77 0.94 1.60 0.32** Least flycatcher5 Empidonax minimus 0 0.04 0.07 0.05 0.18 Eastern phoebe Sayornis phoebe 0.26 0.42 0.24 0.15 0.03 Great crested flycatcher Myiarchus crinitus 0.67 0.96 1.72 2.10 0.56** Eastern kingbird Tyrannus tyrannus 0.30 0.23 0.48 0.10 -0.04 Blue jay Cyanocitta cristata 1.62 1.66 1.82 1.80 0.18 American crow Corvus brachyrhynchos 0.54 1.24 1.49 1.25 0.46** Black-capped chickadee Parus atricapillus 1.16 2.37 2.41 2.85 0.48** Tufted titmouse Parus bicolor 2.24 2.72 2.70 3.20 0.31 White-breasted nuthatch Sitta carolinensis 0.78 1.18 1.25 1.55 0.29* Brown creeper Certhia americana 0 0.14 0.30 0.75 0.50** House wren Troglodytes aedon 0.68 0.83 1.55 1.00 0.18 Blue-gray gnatcatcher5 Polioptila caerulea 0 0 0.09 0 0.19 Veery5 Catharus fuscescens 0 0.04 1.11 2.65 0.53** Wood thrush Hylocichla mustelina 1.73 1.95 2.14 2.08 0.23 American robin Turdus migratorius 2.96 2.86 2.17 1.55 -0.35** Gray catbird Dumetella carolinensis 2.50 2.14 2.19 1.70 -0.14 Northern mockingbird Mimus polyglottos 0.58 0.43 0.12 0.05 -0.37** Brown thrasher Toxostoma rufum 0 0.22 0.25 0.13 0.33** Cedar waxwing Bombycilla cedrorum 0.09 0.10 0.36 0.54 0.37** European starling Sturnus vulgaris 1.57 1.59 1.39 0.63 -0.18 Warbling vireo Vireo gilvus 0.62 0.18 0.38 0.05 -0.33** Red-eyed vireo Vireo olivaceus 1.01 1.42 1.96 1.90 0.46** Blue-winged warbler Vermivora pinus 0.04 0.05 0.30 0.93 0.37** Yellow warbler Dendroica petechia 0.06 0.25 0.53 0.80 0.39** Chestnut-sided warbler5 Dendroica pensylvanica 0 0.01 0.03 0.20 0.38** Black-throated green warbler5 Dendroica virens 0 0.03 0.09 0.10 0.26* Prairie warbler5 Dendroica discolor 0.03 0.07 0.11 0.05 0.18 Black-and-white warbler5 Mniotilta varia 0 0.10 0.25 1.33 0.52** American redstart Setophaga ruticilla 0.10 0.18 0.38 0.55 0.38** Ovenbird Seiurus aurocapillus 0 0.09 0.05 1.38 0.42** Louisiana waterthrush5 Seiurus motacilla 0 0.05 0.01 0.15 0.18 Common yellowthroat Geothlypis trichas 0.81 0.85 1.36 1.60 0.30* Canada warbler5 Wilsonia canadensis 0 0 0.08 0.25 0.34** Scarlet tanager Piranga olivacea 0.04 0.45 0.40 1.25 0.49** Northern cardinal Cardinalis cardinalis 2.09 2.00 1.98 1.93 -0.10 Rose-breasted grosbeak Pheucticus ludovicianus 0.67 0.60 0.67 1.20 0.12 Indigo bunting5 Passerina cyanea 0.05 0.11 0.17 0.20 0.26* Rufous-sided towhee Pipilo erythrophthalmus 0.06 0.63 0.90 0.25 0.33**
aalbert
aalbert

487 TABLE I (continued)
Species Woodland size-class3 (ha) Simple correlation Common name Scientific name 1-5 6-17 18-42 43-69 coefficient4 (r)
(N=22) (N=24) (N=14) (N=4) Chipping sparrow Spizella passerina 0.22 0.30 0.17 0.20 -0.13 Field sparrow Spizella pusilla 0 0.01 0.11 0 0.22 Song sparrow Melospiza melodia 2.47 2.16 1.66 2.23 -0.25* Swamp sparrow Melospiza georgiana 0.09 0 0.04 0 -0.18 Red-winged blackbird5 Agelaius phoeniceus 2.29 1.25 2.41 1.73 -0.09 Common grackle Quiscalus quiscula 2.46 1.55 1.96 1.50 -0.29* Brown-headed cowbird Molothrus ater 0.87 1:04 1.20 1.80 0.26* Northern oriole Icterus galbula 1.88 1.45 1.63 1.53 -0.23 Purple finch Carpodacus purpureus 0.11 0.01 0 0.05 -0.24 House finch Carpodacus mexicanus 1.03 0.62 0.73 0.43 -0.30* American goldfinch Carduelis tristis 0.22 0.18 0.43 0.43 0.07 House sparrow Passer domesticus 1.77 1.52 0.09 0.55 -0.45**
Species observed fewer than six times in a single year; not included in analysis
Green-backed heron5 Butorides striatus Ruffed grouse5 Bonasa umbellus Rock dove Columba livia Eastern screech-owl5 Otus asio Barred owl5 Strix varia Pileated woodpecker Dryocopus pileatus Alder flycatcher5 Empidonax alnorum Willow flycatcher5 Empidonax traillii Tree swallow Tachycineta bicolor Red-breasted nuthatch Sitta canadensis Carolina wren5 Thryothorus ludovicianus Winter wren5 Troglodytes troglodytes Eastern bluebird5 Sialia sialis Solitary vireo5 Vireo solitarius Yellow-throated vireo5 Vireo flavifrons Nashville warbler5 Vermivora ruficapilla Pine warbler5 Dendroica pinus
1The average number of individuals of a given species detected per point for all woodlands in a particular size-class. 2Common and scientific names follow the checklist of the American Ornithologists' Union, 1983. 3For presentation of the data, woodlands were grouped into size-classes on the basis of natural breaks in the distribution of sizes studied. The number of cases in each size-class represents the number of woods of that size times 2 years' data. Regressions were run on data from each woodland, not on grouped means. 4Regression of abundance indices for a particular species on the size of the woodland. Significance of relationship: *=P< 0.05; **=P< 0.01. 5Species not observed in nearby urban or suburban residential areas (DeGraaf and Wentworth, 1981).
creeper, winter wren, Carolina wren, blue-gray gnatcatcher, solitary vireo, various warblers, scarlet tanager, plus broad-winged hawk, ruffed grouse, barred owl, belted kingfisher, wood thrush, veery and eastern bluebird; see Table I for the scientific names of bird species).
Relationship of bird diversity to woodland characteristics
In regression analysis, size of woodland was by far the most important variable affecting the number of bird species observed (S) and bird
aalbert
aalbert

488
species diversity (H'). For S, coefficients of determination (R2) were 0.58 for the linear and 0.79 for the curvilinear (logarithm of size) regressions. For H', the correlation coeffi-cients were 0.51 for the linear and 0.75 for the curvilinear regressions. The largest woodlands had nearly twice as many species as did the smallest woodlands, and bird species diversity exhibited a similar range in values (Table II).
Examination of a plot of the curvilinear regression for S indicates that the number of bird species increased rapidly as the size of woodland increased from 1 to 25 ha; there-after, the increase was more gradual (Fig. 2). At 25 ha, about 0.75 of the maximum number of species were represented.
In addition to size of woodland, number of adjacent buildings, density of the shrub layer TABLE II
Effect of size of urban woodland on two measures of bird diversity
and proximity of trails were significantly re-lated to both S and H'. Canopy height and dis-tance to water were also significant in the H' regression. However, addition of these vari-ables in various combinations to the simple regression models containing woodland size increased the amount of variation explained by only 7-10% (Table III) .
Large numbers of buildings reduced the number of bird species and bird species diver-sity, while a well-developed shrub layer in-creased the number of species and diversity. Taller trees in the canopy resulted in lower di-versity, but did not significantly affect the number of bird species (Table III). Woods with less edge (more compact in shape) and woods on dryer sites supported a greater variety of bird species as measured by H' but not by S. These two variables did not appear in the two best multiple regressions of H', being non-sig-nificant in the presence of one or more of the other variables.
Distance to trails appeared in multiple regressions for both S and H' (Table III), but affected these dependent variables in different ways depending upon the other variables in the equation. When number of buildings was not included in combination with distance to trails, both bird species diversity and number of bird species were low in close proximity to trails, but when buildings and trails were both in-cluded in the regressions, the number of bird species (but not H') was highest in close prox-imity to trails. Since both trails and buildings are measures of human disturbance, it is not surprising that they are correlated (r=0.50). This, plus the fact that both buildings and trails are only weakly correlated with the dependent variables, probably accounts for the shifts in the direction of the relationship between trails and S. I do not believe this shift has any bio-logical significance.
Relationships of bird abundance to woodland characteristics
Percentage coniferous tree cover and size of
Dependent Woodland size-class (ha) variable 0.9-5 6-17 18-42 43-69 (N=11) (N=12) (N=7) (N=2) S 24.0 A1 33.0 B 41.1 C 46.2 C H' 3.00 A 3.26 B 3.43 C 3.56 C
1Means in a row not followed by the same letter are signifi-cantly different (P< 0.001, Duncan's new multiple range test).
Fig. 2. Relationship of number of bird species observed (S) to size of urban woodland.

489
TABLE III
Regression coefficients for multiple regression models' relating measures of bird diversity and abundance to characteristics of urban woodlands
Independent variables2
Dependent variables S
H '3
H '3
NMBIRDS
Log (size of woodland) 14.65 0.35 0.33 - Building density -1.25 -0.015 -0.017 - Shrub density 0.0003 - - - Log (shrub density) - - 0.16 - Distance to trails -0.13 - - - 1/(Distance to trails) - -0.27 -0.25 -17.021/(Canopy height) - 3.88 - - Distance to water - -0.0002 -0.0002 -0.014Log (% coniferous cover) - - - 7.58Isolation of woodland - - - 0.0009 Y-intercept 22.12 2.745 2.404 37.902 R2 0.86 0.85 0.85 0.48
1Only independent variables whose regression coefficients were significantly different from zero (P ≤ 0.05) were included in the models. 2Transformations are as indicated: Log=logarithmic transformation (base 10); 1 /=hyperbolic transformation. 3Two regression models for H' are included in this table since both explained the greatest amount of variation in H'.
woodland explained similar amounts of the variation in the number of birds present (sim-ple R 2 s of 0.26 and 0.25, respectively). How-ever, these two independent variables were not both significant when both were present in multiple regressions. A close examination of the data set showed few data for small wood-lands with > 10% coniferous tree cover and for large woodlands with <2% coniferous tree cover. This resulted in a high correlation be-tween the two independent variables (r=0.51) that only allowed one of them (percentage coniferous tree cover) to enter into the multi-ple regression model. It appears that woods with scattered patches of pines and hemlocks tended to have greater numbers of birds. It is unclear, however, that larger urban woodlands would have supported higher densities of birds had these woods not also had a higher percent-age of coniferous trees in the overstory; the re-lationship may have been an artifact of sampling.
The multiple regression model for NMBIRDS was much less powerful in its abil-ity to explain the variation in bird abundance (R 2 =0.48) than were the models for the two
measures of bird diversity. There was no single variable that could account for a large propor-tion of the differences in bird abundance. The model indicates that woods with a greater pro-portion of coniferous trees in the overstory and water in or near them tended to have higher bird densities. These high bird abundances were also associated with more isolated urban woodlands, located far from the nearest exten-sive forest. Woods with trails close to the sam-pling points tended to have fewer birds (Table III).
Relationship of individual bird species to size of woodland
Nearly half of the species examined for as-sociation with size of woodland were signifi-cantly more abundant in the larger woodlands (Table I). Of the 27 species more commonly found in larger woods, nine were never ob-served in woods smaller than 5 ha (broad-winged hawk, brown creeper, veery, brown thrasher, black-and-white warbler, chestnut-sided warbler, black-throated green warbler, ovenbird and Canada warbler). On the other
aalbert

490 hand, eight bird species were most abundant in the smallest woodlands (especially Ameri-can robin, northern mockingbird, warbling vi-reo and house sparrow). Several species did not seem to be sensitive to the size of the wood-land at all (Table I). Some of these species, such as the northern flicker, blue jay and northern cardinal, might be considered ubiq-uitous. Other species such as the swamp spar-row and red-winged blackbird are more obviously limited by other factors (e.g. near-ness to water).
DISCUSSION
Most studies of birds in urban environments have indicated that these areas are relatively poor in number of species compared to more rural habitats, but rank high in density of in-dividuals (Pitelka, 1942; Woolfenden and Rohwer, 1969; Emlen, 1974; Guthrie, 1974; Walcott, 1974; DeGraaf, 1978). The present study has shown that the variety of breeding-bird species in urban woodlands can be much greater than is typical of other urban habitats. Urban woodlands in the present study had about 50% more bird species than DeGraaf and Wentworth's (1981) suburban residential areas and about four times as many species as their urban residential areas (also in Springfield). The additional species found in urban wood-lands (indicated in Table I) were primarily wetland species, ground-nesting and -foraging species, insectivores and carnivores. The pres-ence of these species in the more natural wood-lands is probably due to the greater variety of food and relatively undisturbed nest sites found there. In a study of bird habitat relationships in a New England suburb, DeGraaf and Went-worth (1986) demonstrated that certain insec-tivorous species were not present except in nearby natural forest stands. In urban areas where large natural forests are distant, urban woodlands can provide habitat for many spe-cies that might otherwise only be found in the native forests of the region. Indeed, the num-
bers of breeding bird species in the largest ur-ban woodlands surveyed were about the same as found in a study of forest birds in a 4650-ha wooded preserve located about 40 km from Springfield (R.M. DeGraaf, personal commu-nication, 1986). However, all urban wood- lands are not alike in their ability to attract and support a variety of breeding bird species. Bird diversity and abundance in these areas differ with the physical characteristics of the wood-lands (size, shape and isolation), the variety of microhabitats provided (by layers and com-position of the vegetation) and the level of hu-man activity in and around the woods.
Size of woodland was by far the most impor-tant variable in explaining differences in both the number of bird species and bird species di-versity in urban woodlands. These results sup-port the idea that "habitat islands" in an urban setting follow some of the basic concepts of is-land biogeography (MacArthur and Wilson, 1963, 1967), especially the species-area rela-tionship that has held true in many bird stud- ies of fragmented forests (Moore and Hooper, 1975; Forman et al., 1976; Galli et al., 1976; Tilghman, 1977; Robbins, 1979; Whitcomb et al., 1981). Davis and Glick (1978) and Sam- son (1980) have suggested that the isolated nature of urban parklands should make them suitable for conservation strategies based on island biogeographical theory. Previous stud- ies of bird communities of urban parks and woodlands have provided data that might be used as evidence of the insular qualities of ur-ban woodlands, but none have examined this relationship with so many woodlands or over such a broad range of sizes (Luniak, 1974; Ga-vareski, 1976; Alonso and Purroy, 1979).
In a review of several studies dealing with island biogeography or its application to "hab-itat islands", Gilbert (1980) concurs that area (or size) is usually the major factor contribut-ing to the number of species. The importance of size of woodland in this study supports the idea that nature reserves or parks should be as large as possible if the entire complement of

491 study, however, the degree of isolation (4-11 km) was probably negligible relative to the dispersal ability of birds. The positive rela-tionship between isolation and bird numbers has been described in a few island studies, but usually in terms of niche expansion and den-sity compensation in the face of reduced com-petition from a reduced number of species (MacArthur et al., 1972). As mentioned pre-viously, this is the typical finding of bird stud-ies in the more developed portions of the city where local avifaunas are dominated by a few species occurring at extremely high densities. In these urban woodlands, however, no rela-tionship was detected between the degree of isolation and number of species, so density compensation does not appear to be a suitable explanation for the increased numbers of birds. Rather, these more isolated woods may be far more attractive to birds from the surrounding urban habitats than are urban woodlands that are closer to the extensive forests outside the city. Birds that depend on shrubs and trees for breeding and foraging sites may find it advan-tageous to move into these woods where they must tolerate increased competition from their neighbors, but where food and nest sites are also more plentiful.
Of the various measures of the vegetation and microhabitats available in these wood-lands, the variables that predicted bird diver-sity were indicators of the horizontal and vertical complexity of the woods. Lower can-opy height may have been associated with an increase in the variety of birds present, if shorter average canopy heights represented in-creased horizontal heterogeneity with more openings in the woodlands. Woods with streams flowing through them or lakes adja- cent to them added a dimension to the micro-habitats available and thus had a greater bird species diversity and total bird abundance. Birds such as green-backed herons, belted kingfishers, veeries, Louisiana waterthrushes, common yellowthroats, red-winged blackbirds and swamp sparrows found suitable nesting
naturally occurring fauna is to be maintained (Terborgh, 1974; Diamond, 1975; Sullivan and Shaffer, 1975; Whitcomb et al., 1976; Faaborg, 1979; Hounsome, 1979). Although the urban woodlands examined in this study are gener-ally much smaller than would be recom-mended for a nature reserve, their role in increasing the diversity of bird life in the city is important.
Size of woodland may have been important in determining bird abundance, but interpre-tation of the results is difficult because of the correlation between size of woodland and per-centage coniferous cover mentioned previ-ously. If, however, the positive association between size of woodland and bird numbers is real, these results directly contradict a study conducted in Europe (Oelke, 1966). It may be that larger woods have a greater variety of de-sirable microhabitats and can accommodate a large number of individuals, attracting birds from the surrounding residential areas.
Variations in the shape or configuration of these urban woodlands were measured by an edge index. While it is well documented that species richness tends to increase in the eco-tones between habitat types, the relative amount of edge associated with these urban woodlands played only a minor role in deter-mining the variety of birds within them. The relative unimportance of edge in this study is probably due to the placement of the bird sam-pling points at least 50 m from the nearest edge, in an effort to reduce the chance of recording birds that were actually outside the woodland.
Increased isolation of urban woodlands from the nearest probable source of colonizing in-dividuals ("mainland" woods) had a positive effect on bird abundance, but did not play a role in the models for bird diversity. Other studies of bird communities on habitat islands have indicated that increased isolation may decrease the variety of bird species, especially forest interior species (MacClintock et al., 1977; Butcher et al., 1981; Whitcomb et al., 1981; Opdam et al., 1984). In the present

492
and foraging sites that were not available in woods without water nearby. Rich food sup-plies and dense vegetation that are often asso-ciated with these wetland areas probably allowed a greater density of birds to nest in and around the wetlands than in the remainder of the woodlands. Urban woodlands with patches of coniferous cover were able to support higher densities of birds. This habitat type may have been sufficiently rare in the city as a whole to attract birds to these woods from neighboring habitats.
Several studies have demonstrated the rela-tionship between vertical vegetation complex-ity and bird species diversity (MacArthur and MacArthur, 1961; MacArthur et al., 1962, 1966; Recher, 1969; Karr and Roth, 1971). In urban habitats, the presence of shrub layers has been shown to be particularly important to the variety of bird species in parks (Linehan et al., 1967; Burr and Jones, 1968; Gavareski, 1976). In the present study, the presence of a well-de-veloped shrub layer provided habitats for low-nesting or shrub-feeding species and, by in-creasing the vertical dimension of the woods, increased the variety of niches available.
Differences in the size of urban woodlands and changes in vegetation cannot explain all the differences in their bird communities. Histor-ical factors such as man's influence on the sys-tem need to be considered. In this study, the density and proximity of buildings to the woodlands were used as an index to the level of urbanization adjacent to the woods. This in-dex had an overall negative effect on bird di-versity and, to a lesser extent, bird abundance. Batten (1972) and Butcher et al. (1981) have also documented declines in the total number of bird species present and noted qualitative changes in the kinds of species in isolated wooded areas as the level of urbanization in-creased around them.
In the present study, the direct effect of hu-man disturbance within urban woodlands was measured by the distance between bird sam-pling points and the nearest trails. Although the
impact of this variable on the two measures of bird diversity was confusing, it appears that the level of disturbance associated with trails in the woods did not have a great effect on bird spe-cies diversity. The shape of the curve relating trails to diversity suggests that traffic along trails limits the variety and numbers of birds in the area immediately adjacent to the trail, but that there is little or no effect beyond this point. The type of trampling disturbance sug-gested by Whitcomb (1977) did not play a ma-jor role in determining the breeding bird communities of these areas. Linehan et al. (1967) found human activity in urban wood-lands in Delaware had little effect on the bird community when a sufficient shrub layer was present. Other researchers (Nasmith, 1975; Cooke, 1980) have commented on the toler-ance of urban and suburban birds to moderate levels of human activity. Once birds have es-tablished their territories and built their nests, it takes a great amount of direct disturbance by man or predators associated with areas of hu-man habitation to cause the birds to desert their nests.
Several researchers have demonstrated that size of forest tract can be a limiting factor in the distribution of individual forest-dwelling bird species (Forman et al., 1976; Galli et al., 1976; Robbins, 1979; Whitcomb et al., 1981). The trend in abundance indices of the bird species that were found in this study indicates that certain bird species are size-limited in their distribution in urban woodlands. In some in-stances, the species associated with larger ur-ban woodlands are the same as those found to be intolerant of forest fragmentation in more suburban areas of central Maryland (e.g. hairy woodpeckers, red-eyed vireos, black-and-white warblers, ovenbirds and scarlet tanagers). Other species that seemed to show no real af-finity for large forests in the Maryland study were significantly associated with larger urban woodlands in this study (e.g. downy wood-peckers, great crested flycatchers, eastern wood-pewees, American crows and rufous-

sided towhees; Whitcomb et al., 1981). Some of these associations with large urban wood-lands may be more in response to greater iso-lation from surrounding urban activity than to the need for a large tract of forest habitat per se. The species that were more common in the smaller woods were typical urban species usu-ally found in residential or industrial habitats. Small urban woodlands were often reminis- cent of residential habitats in both vegetation structure and human activity and thus proba- bly attracted similar bird species.
MANAGEMENT RECOMMENDATIONS
The results of this study should be useful to urban land managers in the northeast who are involved in the acquisition and management of natural areas within the city. Specific rec-ommendations are listed below. (1) Large woodlands ( > 25 ha) are necessary
to maintain a high bird species diversity and thus provide urban dwellers with the opportunity to see a wide variety of birds typical of more rural forests of the region.
(2) Maintenance of natural vegetation in the shrub layer can provide an increased number of niches for an increase in num-ber of bird species.
(3) Woodlands with a variety of microhabi-tats, such as small scattered openings and some form of water in or adjacent to the woods, can provide nesting and feeding sites for a variety of birds. Patches of pines or hemlocks and wetland areas within the woods can also increase the number of birds in the area.
(4) Wherever possible, buildings immedi-ately adjacent to the woodlands (within 90 m) should be kept to a minimum.
(5) Trail systems should be limited in scope. Instead of a fine network of trails throughout the woods, a few well-marked trails providing human access to particu-lar portions of the woods should be maintained.
REFERENCES
Alonso, J.A. and Purroy, F.J., 1979. Avifauna de los parques de Madrid. Naturalia Hispanica, No. 18, Instituto Na-cional Para la Conservacion de la Naturaleza, Madrid, 109 pp.
American Ornithologists' Union, 1983. Check-list of North American Birds. 6th edn. American Ornithologists Union, Lawrence, KS, 877 pp.
Batten, L.A., 1972. Breeding bird species diversity in relation to increasing urbanisation. Bird Study, 19: 157-166.
Brown, T.L. and Dawson, C.P., 1978. Interests, Needs and Attitudes of New York's Metropolitan Public in Relation to Wildlife. Cornell Univ. Agric. Exp. Stn., Nat. Resour. Res. Ext. Serv. No. 13, 53 pp.
Burr, R.M. and Jones, R.E., 1968. Influence of parkland hab-
493
In the past, urban conservation land has not been purchased as wildlife habitat; recreation has been the major motivation for land acqui-sition (Gray et al., 1979). But urban wood- lands can provide both a variety of wildlife habitats and the recreational opportunity for residents of our larger cities to experience na-ture and its diversity.
ACKNOWLEDGEMENTS
This study was funded by the U.S. Forest Service, Northeastern Forest Experiment Sta-tion, and the University of Massachusetts at Amherst. I thank R.M. DeGraaf for his advice and encouragement throughout the study, and D.A. Marquis for his help in the final analysis and revision of the manuscript. This study also benefitted from the advice of J. S. Larson, W. E. Dodge, W.B. Nutting and D.E. Kroodsma. D.L. Fischer, J.J. Green, Jr., S.D. Surner, G.M. Witman, P.H. Yaukey and M.D. Ziomek as-sisted with the field work. Thanks to R.A. Da-mon, J.T. Finn, T.A. Hosmer, G.S. Walton and D.W. Seegrist for their advice on statistical analyses, and to C.H. Nilon, Jr., B.R. Noon and L.W. VanDruff for suggestions for improving the manuscript. Special thanks to the Spring-field Parks Department, the Springfield Con-servation Commission, and several private landowners for their hospitality.

494
itat management on birds in Delaware. Trans. North Am. Wildl. Nat. Resour. Conf., 33: 299-306.
Butcher, G.S., Niering, W.A., Barry, W.J. and Goodwin, R.H., 1981. Equilibrium biogeography and the size of nature preserves: an avian case study. Oecologia, 49: 29-37.
Cooke, A.S., 1980. Observations on how close certain passer-ine species will tolerate an approaching human in rural and suburban areas. Biol. Conserv., 18: 85-88.
Cottam, G. and Curtis, J.T., 1956. The use of distance meas-ures in phytosociological sampling. Ecology, 37: 451-460.
Dagg, A.I., 1970. Wildlife in an urban area. Nat. Can., 97: 201-212.
Davis, A.M. and Glick, T.F., 1978. Urban ecosystems and island biogeography. Environ. Conserv., 5: 299-304.
DeGraaf, R.M., 1978. Avian communities and habitat asso-ciations in cities and suburbs. In: C.M. Kirkpatrick (Edi-tor), Wildlife and People. Purdue Univ., Dep. For. Nat. Resour., Lafayette, IN, pp. 7-24.
DeGraaf, R.M. and Wentworth, J.M., 1981. Urban bird com-munities and habitats in New England. Trans. North Am. Wildl. Nat. Resour. Conf., 46: 396-413.
DeGraaf, R.M. and Wentworth, J.M., 1986. Avian guild structure and habitat associations in suburban bird com-munities. Urban Ecology, 9: 399-412.
Diamond, J.M., 1975. The island dilemma: lessons of mod-ern biogeographic studies for the design of nature re-serves. Biol. Conserv., 7: 129-146.
Emlen, J.T., 1974. An urban bird community in Tucson, Ar-izona: derivation, structure, regulation. Condor, 76: 184-197.
Faaborg, J., 1979. Qualitative patterns of avian extinction on neotropical land-bridge islands: lessons for conservation. J. Appl. Ecol., 16: 99-107.
Forman, R.T.T., Galli, A.E. and Leck, C.F., 1976. Forest size and avian diversity in New Jersey woodlots with some land use implications. Oecologia, 26: 1-8.
Galli, A.E., Leck, C.F. and Forman, R.T.T., 1976. Avian dis-tribution patterns in forest islands of different sizes in central New Jersey. Auk, 93: 356-364.
Gavareski, C.A., 1976. Regulation of park size and vegeta-tion to urban bird populations in Seattle, Washington. Condor, 78: 375-382.
Gilbert, F.S., 1980. The equilibrium theory of island biogeog-raphy: fact or fiction? J. Biogeogr., 7: 209--235.
Gray, G.G., Larson, J.S. and Braunhardt, D.A., 1979. Urban conservation leadership and the wildlife resource. Urban Ecol., 4: 1-9.
Guthrie, D.A., 1974. Suburban bird populations in southern California. Am. Midl. Nat., 92: 461-466.
Hounsome, M., 1979. Bird life in the city. In: I.C. Laurie (Ed-itor), Nature in Cities. Wiley, New York, pp. 179-201.
James, F.C., 1978. On understanding quantitative surveys of vegetation. Am. Birds, 32: 18-21.
James, F.C. and Shugart, H.H., Jr., 1970. A quantitative method of habitat description. Audubon Field Notes, 24: 727-736.
Karr, J.R., 1968. Habitat and avian diversity on strip-mined land in east-central Illinois. Condor, 70: 348-357.
Karr, J.R. and Roth, R.R., 1971. Vegetation structure and
avian diversity in several New World areas. Am. Nat., 105: 423-435.
Linehan, J.T., Jones, R.E. and Longcore, J.R., 1967. Breed-ing-bird populations in Delaware's urban woodlots. Au-dubon Field Notes, 21: 641-646.
Luniak, M., 1974. The birds of park biotopes in small towns of central-eastern Poland. Acta Ornithol., 14: 99-143.
MacArthur, R.H. and MacArthur, J.M., 1961. On bird spe-cies diversity. Ecology, 42: 594-598.
MacArthur, R.H. and Wilson, E.O., 1963. An equilibrium theory of insular zoogeography. Evolution, 17: 373-387.
MacArthur, R.H. and Wilson, E.O., 1967. The Theory of Is-land Biogeography. Princeton University Press, Prince-ton, NJ, 203 pp.
MacArthur, R.H., MacArthur, J.W. and Preer, J., 1962. On bird species diversity. II. Prediction of bird census from habitat measurements. Am. Nat., 96: 167-174.
MacArthur, R.H., Recher, H. and Cody, M., 1966. On the relation between habitat selection and species diversity. Am. Nat., 100: 319-332.
MacArthur, R.H., Diamond, J.M. and Karr, J.R., 1972. Den-sity compensation in island faunas. Ecology, 53: 330-342.
MacClintock, L., Whitcomb, R.F. and Whitcomb, B.L., 1977. Evidence for the value of corridors and minimization of isolation in preservation of biotic diversity. Am. Birds, 31: 6-16.
MacConnell, W.P., 1975. Remote Sensing 20 Years of Change in Hampden County, Massachusetts, 1952-1972. Mass. Agric. Exp. Stn. Bull. 628, Amherst, MA, 99 pp.
Miller, R.G., Jr., 1964. A trustworthy jackknife. Ann. Math. Stat., 35: 1594-1605.
Moore, N.W. and Hooper, M.D., 1975. On the number of bird species in British woods. Biol. Conserv., 8: 239-250.
Mott, J.R. and Swenson, E.I., 1978. Soil Survey of Hampden County, Massachusetts, Central Part. USDA Soil Con-serv. Serv., Mass. Agric. Exp. Stn., Amherst, MA, 199 pp. Nasmith, E., 1975. Bird life in a city ravine. In: G.B. Mc-Keating (Editor), Nature and Urban Man. Can. Nat. Fed., Spec. Publ. No. 4, Ottawa, pp. 35-43.
Oelke, N., 1966. 35 years of breeding bird census work in Eu-rope. Audubon Field Notes, 20: 635-642.
Opdam, P., van Dorp, D. and ter Braak, C.J.F., 1984. The effect of isolation on the number of woodland birds in small woods in The Netherlands. J. Biogeogr., 11: 473-478.
Patton, D.R., 1975. A diversity index for quantifying habitat "edge". Wildl. Soc. Bull., 3: 171-173.
Pitelka, F.A., 1942. High population of breeding birds within an artificial habitat. Condor, 44: 172-174.
Recher, H., 1969. Bird species diversity and habitat diversity in Australia and North America. Am. Nat., 103: 75-80.
Robbins, C.S., 1979. Effect of forest fragmentation on bird populations. In: R.M. DeGraaf and K.E. Evans (Editors), Workshop Proceedings: Management of North Central and Northeastern Forests for Nongame Birds. USDA For. Serv. Gen. Tech. Rep. NC-51, pp. 198-212.
Samson, F.B., 1980. Island biogeography and the conserva- tion of nongame birds. Trans. North Am. Wildl. Nat. Re-sour. Conf., 45: 245-251.
Shannon, C.E. and Weaver, W., 1949. The Mathematical

495
Whitcomb, R.F., Lynch, J.F., Opler, P.A. and Robbins, C.S., 1976. Island biogeography and conservation: strategy and limitations. Science, 193: 1030-1032.
Whitcomb, R.F., Robbins, C.S., Lynch, J.F., Whitcomb, B.L., Klimkiewicz, M.K. and Bystrak, D., 1981. Effects of for- est fragmentation on avifauna of the eastern deciduous forest. In: R.L. Burgess and D.M. Sharpe (Editors), For- est Island Dynamics in Man-dominated Landscapes. Springer, New York, pp. 125-205.
Witter, D.J., Tylka, D.L. and Werner, J.E., 1981. Values of urban wildlife in Missouri. Trans. North Am. Wildl. Nat. Resour. Conf., 46: 424-431.
Woolfenden, G.E. and Rohwer, S.A., 1969. Breeding birds in a Florida suburb. Bull. Fla. State Mus., 13: 1-83.
Yeomans, J.A. and Barclay, J.S., 1981. Perceptions of resi-dential wildlife programs. Trans. North Am. Wildl. Nat. Resour. Conf, 46: 390-395.
Theory of Communication. University of Illinois Press, Urbana, IL, 117 pp.
Sullivan, A.L. and Shaffer, M.L., 1975. Biogeography of the megazoo. Science, 189: 13-17.
Terborgh, J., 1974. Preservation of natural diversity: the problem of extinction prone species. BioScience, 24: 715-722.
Tilghman, N.G., 1977. Problems in sampling songbird pop-ulations in southeastern Wisconsin woodlots. M.S. The-sis, University of Wisconsin, Madison, WI, 50 pp.
Tilghman, N.G., 1983. Breeding birds of urban woodlands. Ph.D. Dissertation, University of Massachusetts, Am-herst, MA, 132 pp.
Tregay, R., 1979. Urban woodlands. In: 1.C. Laurie (Editor), Nature in Cities. Wiley, New York, pp. 267-295.
Walcott, C.F., 1974. Changes in bird life in Cambridge, Mas-sachusetts from 1860 to 1964. Auk, 91: 151-160.
Whitcomb, R.F., 1977. Island biogeography and "habitat is-lands" of eastern forests. I. Introduction. Am. Birds, 31: 3-5.