Analysis of Household Characteristics Affecting the Demand ... · Analysis of Household...
14
Academic Journal of Economic Studies Vol. 1, No.2, June 2015, pp. 79–92 ISSN 2393-4913, ISSN On-line 2457-5836 Analysis of Household Characteristics Affecting the Demand of PLN’s Electricity. An Observation on Small Households in City of Medan, Indonesia Tongam Sihol Nababan Economics Faculty, University of HKBP Nommensen, Medan, Indonesia, E-mail: [email protected] Abstract This study aimed to: (1) analyze the characteristics of households affecting energy consumption of simple household electricity, (2) analyze the probability of each of the factors affecting the energy consumption of small household electricity. The study was conducted in city of Medan in the period of January 2014 to September 2014 with samples of 143 small households as the customers of PLN (State Electricity Company) Medan, which use the low voltage of electricity named TR-1/450VA. Data were analyzed by using the logistic regression model. The estimation results indicated that: (1) the higher the willingness to pay (WTP) of households, the higher the tendency to consume electrical energy >100 KWh per month by 4.694 times than of the households with willingness to pay < Rp 100 thousand per month, (2) the closer the households residence to the city center, the higher the tendency to consume electrical energy > 100 KWh per month by 2.288 times than of the households residence in the suburbs, (3) increasingly unfavourable response to electrical quality, the higher the chance to consume electrical energy > 100 KWh per month. Key words Small household, electricity energy, willingness to pay, tariff, location JEL Codes: D01, D11 1. Introduction Indonesia's economy has been beginning to improve characterized by economic growth with an average of 4.2% per year over the last 5 years (2010-2015). This achievement has led to the growth of the electricity energy sales with an average of 7% per year. The numbers of PLN’s (State Electricity Company in Indonesia) customers during the period of 2005 - 2013 also increase with an average increase of 5.52% per year. Electrification ratio increased from 63.75% in 2009 to 78.06% in 2013 (PLN Statistics, 2013). According to Kuswara (1997), in general, an increase in demand of electricity was caused by three factors: (1) an increase in economic activity in line with the growth of GDP (Gross Domestic Product), (2) an increase in the level of coverage or level of electrification, and (3) the turn of captive power plant to PLN’s electrical transmission due to its less efficient and due to lower economies of scale. Besides, population
Transcript of Analysis of Household Characteristics Affecting the Demand ... · Analysis of Household...

Academic Journal of Economic Studies Vol. 1, No.2, June 2015, pp. 79–92
ISSN 2393-4913, ISSN On-line 2457-5836
Analysis of Household Characteristics Affecting the Demand of PLN’s Electricity. An Observation on Small
Households in City of Medan, Indonesia
Tongam Sihol Nababan
Economics Faculty, University of HKBP Nommensen, Medan, Indonesia,
E-mail: [email protected]
Abstract This study aimed to: (1) analyze the characteristics of households affecting energy
consumption of simple household electricity, (2) analyze the probability of each of the factors affecting the energy consumption of small household electricity. The study was conducted in city of Medan in the period of January 2014 to September 2014 with samples of 143 small households as the customers of PLN (State Electricity Company) Medan, which use the low voltage of electricity named TR-1/450VA. Data were analyzed by using the logistic regression model. The estimation results indicated that: (1) the higher the willingness to pay (WTP) of households, the higher the tendency to consume electrical energy >100 KWh per month by 4.694 times than of the households with willingness to pay < Rp 100 thousand per month, (2) the closer the households residence to the city center, the higher the tendency to consume electrical energy > 100 KWh per month by 2.288 times than of the households residence in the suburbs, (3) increasingly unfavourable response to electrical quality, the higher the chance to consume electrical energy > 100 KWh per month.
Key words Small household, electricity energy, willingness to pay, tariff, location
JEL Codes: D01, D11
1. Introduction
Indonesia's economy has been beginning to improve characterized by economic growth with an average of 4.2% per year over the last 5 years (2010-2015). This achievement has led to the growth of the electricity energy sales with an average of 7% per year. The numbers of PLN’s (State Electricity Company in Indonesia) customers during the period of 2005 - 2013 also increase with an average increase of 5.52% per year. Electrification ratio increased from 63.75% in 2009 to 78.06% in 2013 (PLN Statistics, 2013). According to Kuswara (1997), in general, an increase in demand of electricity was caused by three factors: (1) an increase in economic activity in line with the growth of GDP (Gross Domestic Product), (2) an increase in the level of coverage or level of electrification, and (3) the turn of captive power plant to PLN’s electrical transmission due to its less efficient and due to lower economies of scale. Besides, population

Academic Journal of Economic Studies Vol. 1 (2), pp. 79–92, © 2015 AJES
80
growth has also become one of the factors to be considered (RUPTL 2006-2015). However, one of the most important factors is the price factor or electricity tariffs. In determining electricity tariffs, the government always tries to keep the maximum welfare of community with at a level that marginal cost of production equals with the ability and willingness of people to pay the price (ability and willingness to pay). In the future, economic growth, population, the number of electricity customers, and the electrification ratio are projected to keep rising. The economic growth will increase people's income and to push the demand for electrical appliances such as radio, television, freezer, refrigerator and other electric appliances used in the households. The studies of Bartel & Fiebeg (2000), Rab (2001), Meetamehra (2002), Larsen & Nesbakken (2002), Sweeney (2004) stated that the utilization of electrical energy in the households should be viewed as the relationship between the availability or stock equipment (stock of appliances) and the intensity of equipment usage (utilization rate). Guertin et al. (2003) and Halvorsen et al. (2003) suggested that the use of household electricity have to consider the demographic characteristics of households. Phenomena or issues about the variety of characteristics of electricity usage in the households are very important and interesting to study. In general, the household characteristics include the length of time to be a customer, number of rooms, number of electrical appliances, the amount of electrical energy used, and other energy sources as a substitute for electricity and other characteristics. In this study, the characteristics of household focused on variables of: electricity energy consumption, income, WTP (willingness to pay), the rate use of electricity appliances, location of residence, and the response to electrical power availability, electrical power quality and electricity tariffs. The PLN’s customers in city of Medan consist of four main sectors: household, social, business, and industry. The study only focused on household sector. Then, the consumers of household sector are grouped into six types based on electricity tariff categories and electricity power limit (Low Voltage or LV), i.e.: LV 450 VA, LV 900 VA, LV 1300 VA, LV 2200 VA, LV 2201 - 6600 VA, LV > 6600 VA. But in this study, the respondents are small households group which use the type of LV 450 VA. By using logistic regression, the aims of the study are to: (1) analyze the characteristics of households that can affect the demand of household electricity, (2) analyze the probability of each of the factors affecting the demand of household electricity.
2. Literature review
In general, the demand of household electricity energy depends on the stock or availability of electrical appliances and the intensity of its usage in the households (Wilder & Willenborg, 1975; Garbacz, 1984). Therefore, in order to estimate the demand function of household electricity have to include elements of the capital stock or the stock of electrical equipments with the assumption that the stocks of capital are

Analysis of Household Characteristics Affecting the Demand of PLN’s Electricity. An Observation on Small Households in City of Medan, Indonesia, Tongam Sihol Nababan
81
unchanged in the short term (Amarullah, 1984; Silk & Joutz, 1997). However, the demand function of electricity household not only include variables related to electricity energy itself but also consider other variables such as demographic and social characteristics. Thus, the demand of household electricity is influenced by household income, price or tariff of electricity, stocks of appliances, housing/building characteristics, and other relevant variables (Reiss & White, 2001). One of the most important variables in estimating the household electricity demand is price or electricity tariff. But in empirical studies, the proxies to price or electritcity tariff are different, especially in proxy of average price or marginal price. In his research, Wilder & Willenborg (1975) used average price based on the monthly electricity bill by arguing that consumers do not understand about the marginal price. In another hand, Halvorsen (1975), McKean and Winger (1992) have proved that by using log-linear estimation, the value of price elasticity of demand by using average price is not much different from the value of the price elasticity of demand while using marginal price. In connection with the price or electricity tariff, in Indonesia, the price of electricity is set or regulated by the government through the monopoly of PLN (State Electricity Company). It implies that the pricing has not correspond to the market price. Electricity is considered as a public goods, and for the reason and purposes of justice and social, electricity price should be subsidized. Therefore, in this study, the variable of electricity price is proxied by WTP (willingness to pay) by using CV (contingent valuation). The proxy of price with WTP through the CV method interpretes an attempt to gain directly how the willingness of consumers to pay the price of electricity used. Nam & Son (2005) stated that the use of variable WTP as a proxy for the price of electricity can be made by the reason that WTP consumers can express the value of the actual price of a good or service. The estimation model of household electricity demand can be specified in the form of a single equation and simultaneous equation. Amarullah (1984), Jung (1993),and Rab (2001) have used the the form of a single equation using Ordinary Least Square (OLS). Meanwhile, the estimation model of household electricity demand specified in the form of simultaneous equation has been carried out by Wilder & Willenborg (1975), Maddigan et al. (1983), and Garbacz (1984). But in this study, the estimation of the household characteristics that affect the demand of household electricity uses Logistic Regression Model. Logistic regression models is a method of data analysis used to find the relationship between the response variable (y) with a binary scale (dichotomous) with predictor variables (x) with polychotomus. This model is a common form of logit models for binary response (Hosmer and Lemeshow, 2000).
3. Methodology of research
3.1. Research data

Academic Journal of Economic Studies Vol. 1 (2), pp. 79–92, © 2015 AJES
82
The research was conducted in the city of Medan where PLN (State Electricity Company) operates. Data collection had been done during the period of January 2014 up to the month of September 2014. Research population is the customers of small households which subscribe electricity energy to PLN. The customers of small households are the consumer group which use electricity energy of PLN with low voltages, named LV 450 VA. The sampling method uses purposive sampling based on homogeneity in the electric energy usage patterns. The samples used in this study were 170 samples of small households. After all the data were collected from 170 samples, some household data were not complete and inconsistent with the household characteristics. Therefore, the numbers of samples used in this study were 143 households. The data included the household characteristics, i.e.: (1) the number of electricity energy demand of households; (2) stock of appliances in the households ; (3) household income; (4) the WTP of households for electrical energy; and (5) response of households to electrical power availability, electrical power quality and electricity tariffs.
3.2. Operational definition
In this study, the response variable (Y) consisted of the demand or consumption of household electricity energy, whereas the predictor variables (Xi) consisted of: household income (INC), willingness to pay (WTP), the index of the use of appliances (INDEX), location of household residence (LOC), and household perception to availability of electricity power (POW), quality of electricity (QUAL), and electricity tariff (TARIFF). To facilitate the introduction of the research variables in the model, the response variable and predictor variables, the operational definitions need to be described as shown in Table 1 below.
Table 1. Operational Definitions of Research Variables
Variable Definition Variable Name
in the Model
Demand or Consumption of
Household Electricity Energy
The amount of electricity energy consumed by household which obtained directly from the monthly electricity bill for last 6 months in kilowatt-hours (KWh)
Response Variable
(Binary Scale)
Household Income
Total income earned by earned household members, both income of the head of household and the members of household who use electricity during the last 6 months, measured in Rupiah per month (Rp/month)
INC (Dummy)
Willingness To Pay *)
Willingness of household to pay the price of electricity energy each month, measured in Rupiah per month (Rp/month)
WTP (Dummy)

Analysis of Household Characteristics Affecting the Demand of PLN’s Electricity. An Observation on Small Households in City of Medan, Indonesia, Tongam Sihol Nababan
83
Variable Definition Variable Name
in the Model
Use Index of Household
Appliances**)
Index which measures stock of appliances and utilization rate of electricity appliances owned by household.
INDEX (Dummy)
Location of Household Residence
Location of household residence, whether live in city center or city edge.
LOC (Dummy)
Availability of Electricity Power
Household perception of availability of electricity power by using TR/450 VA or TR/900 VA.
POW (Dummy)
Quality of electricity energy
Household perception of electricity quality by using TR/450 VA and TR/900 VA.
QUAL (Dummy)
Price or Tariff of electricity energy
Household perception of price or tariff of existing electricity energy.
TARIFF (Dummy)
______________________
Note: *) WTP data for electricity prices is obtained by using the method of economic contingent valuation surveys in the form of closed ended elicitation format referendum (bidding game format), or closed questions in the questionnaire as used by the Economy and Environment Program for Southeast Asia (EEPSEA) (Nam & Son, 2001, 2005). **) To measure the index of household appliances, this study used model of Jung (1993):
(1) INDEX is index of appliances, Oi,k is the number of electrical appliances k owned by household i. Denominator of INDEX is obtained by multiplying the average power of each electricity appliances (Bk in watts) with a maximum number of electrical appliances of each households (Ck), while Enumerator is obtained by multiplying the average power ( Bk) with the number of electrical appliances (Oi, k).
3.3. Model of Logistic Regression
Logistic regression is used to model the relationship between the response variable (Y) in form of a binary scale with independent variables in form of categories and or continuous. The model is specified in a common form of logit model for binary response. For variable Y with a nominal category has a Bernouli’s distribution with functions of odds distribution as follows (Agresti, 2002; Hosmer and Lemeshow, 2000):
P(Y = yi) = πiyi (1-πj) 1 – yi (2) with πj = probability (odds) of an event i and Y = 1, where value of yi is between 0 and 1. Models of logistic regression:
πi (x) = exp {β0 + βixij + βpxpj} (3)
1+exp {β0 + βixij +…+ βpxpj}
n
k kk
n
k kik
CB
OBINDEX
1
1 , 100

Academic Journal of Economic Studies Vol. 1 (2), pp. 79–92, © 2015 AJES
84
Then, the model is transformed into a logit:
(4)
with linear predictor: g(x)= β0+ βixij +…+ βpxpj, to examine the role of the independent variables in the model, the statistical test-Wald is used (Hosmer and Lemeshow, 2000).
4. Data analysis
4.1. Household Characteristics Affecting the Demand or Consumption of Small Household Electricity in Medan
The household characteristics means some variables directly related to the process of utilization of electricity energy. The descriptive data of variables Affecting the Demand or Consumption of Small Household Electricity in Medan shown in Table 2, Figure 1, Figure 2, Figure 3, and Figure 4.
Table 2. Descriptive Data of Household Characteristics (Samples = 143 households)
Variable Minimum Maximum Average
Consumption of Electricity Energy (KWh/month) 22.67 232.67 107.05
Income (Rp/month) 1,000,000 8,000,000 2,680,594.41
Willingness To Pay (WTP) (Rp/month) 10,000 200,000 43,286.71
Number of appliances per household (unit) 6 36 14.32
Index of appliances 5.93 50.09 20.07
Source: Author’s computation
Based on Table 2, the average amount of electricity consumption per month was 107.05 KWh. The highest of household income amounted to Rp 8 million and the lowest amounted Rp 1 million. WTP (willingness to pay) of households has an average of Rp 43,286.71 per month. The ownership of appliances has an average of 14.32 units per household and the average of index of appliances is 20.07. Generally, small households with LV/450 VA use electricity energy for basic needs such as light bulb, iron, television, tape recorder, radio, fan, refrigerator. Further, the figures (Figure 1,2,3,4) show that the majority of household heads have the occupation as entrepreneurs (44.06%), majority of households stated that availability of electricity power is sufficient (75.52%), majority of households stated that the quality of electricity is not good (77%), and majority of households stated that the existing electricity tariff is expensive (69%).

Analysis of Household Characteristics Affecting the Demand of PLN’s Electricity. An Observation on Small Households in City of Medan, Indonesia, Tongam Sihol Nababan
85
4.2. Model Selection
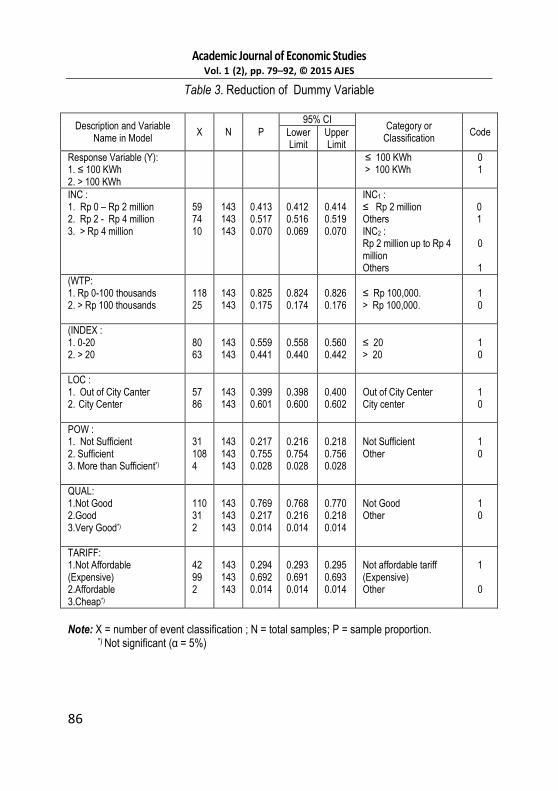
Each of independent variables, as shown in Table 2, is divided into category or classification as input numerical data in the calculation models. Before it is used in the model calculation, the variability of each of classification should be tested statistically. This activity is referred to as reduction dummy variables (Woro, 2011). Based on survey data obtained, the reduction of dummy variables shown in Table 3. Table 3 shows that there are seven independent variables or fourteen categories or classification used as predictors in model of logistic regression.
Academic Journal of Economic Studies Vol. 1 (2), pp. 79–92, © 2015 AJES
86
Table 3. Reduction of Dummy Variable
Description and Variable Name in Model
X N P
95% CI Category or
Classification Code Lower
Limit Upper Limit
Response Variable (Y): 1. ≤ 100 KWh 2. > 100 KWh
≤ 100 KWh > 100 KWh
0 1
INC : 1. Rp 0 – Rp 2 million 2. Rp 2 - Rp 4 million 3. > Rp 4 million
59 74 10
143 143 143
0.413 0.517 0.070
0.412 0.516 0.069
0.414 0.519 0.070
INC1 : ≤ Rp 2 million Others INC2 : Rp 2 million up to Rp 4 million Others
0 1
0 1
(WTP: 1. Rp 0-100 thousands 2. > Rp 100 thousands
118 25
143 143
0.825 0.175
0.824 0.174
0.826 0.176
≤ Rp 100,000. > Rp 100,000.
1 0
(INDEX : 1. 0-20 2. > 20
80 63
143 143
0.559 0.441
0.558 0.440
0.560 0.442
≤ 20 > 20
1 0
LOC : 1. Out of City Canter 2. City Center
57 86
143 143
0.399 0.601
0.398 0.600
0.400 0.602
Out of City Center City center
1 0
POW : 1. Not Sufficient 2. Sufficient 3. More than Sufficient*)
31 108 4
143 143 143
0.217 0.755 0.028
0.216 0.754 0.028
0.218 0.756 0.028
Not Sufficient Other
1 0
QUAL: 1.Not Good 2.Good 3.Very Good*)
110 31 2
143 143 143
0.769 0.217 0.014
0.768 0.216 0.014
0.770 0.218 0.014
Not Good Other
1 0
TARIFF: 1.Not Affordable (Expensive) 2.Affordable 3.Cheap*)
42 99 2
143 143 143
0.294 0.692 0.014
0.293 0.691 0.014
0.295 0.693 0.014
Not affordable tariff (Expensive) Other
1 0
Note: X = number of event classification ; N = total samples; P = sample proportion. *) Not significant (α = 5%)

Analysis of Household Characteristics Affecting the Demand of PLN’s Electricity. An Observation on Small Households in City of Medan, Indonesia, Tongam Sihol Nababan
87
5. Results
To determine the relationship between the dependent variable and independent variables, and the feasibility of the model of logistic regression, it is necessary to check out the validation of model and the calibration of model.
5.1. Validation of Model
Analysis of the determination of the relationship between the dependent variable and the independent variables in the model shown Table 4 and Table 5 below:
Table 4. Model Validation
Omnibus Tests of Model Coefficient
Chi-square df Sig.
Step 1
Step 46.507 8 .000
Block 46.507 8 .000
Model 46.507 8 .000
Coefficient of Model Determination
Step -2 Log
likelihood Cox & Snell R Square Nagelkerke R Square Step
1 147.761 .281 .376 1
Hosmer and Lemeshow Test
Step Chi-square df Sig. Step
1 3.234 8 .919 1
Table 5. Accuracy of Data Proportion and Model
Data Proportion
n Marginal Percentage
Consumption of household electricity energy
≤ 100 Kwh per month 65 45.45%
> 100 Kwh per month 78 54.54%
Model Accuracy
Observed Predicted
≤ 100 Kwh > 100 Kwh Percent
≤ 100 Kwh 43 22 66.20
> 100 Kwh 25 53 67.90
Overall Percentage 67.10
Source: Author’s computation by using SPSS version 19
Table 4 shows the value of χ2 = 46,507 with a significance level of 0.000 (α=5%) means that the model arranged have a significant relationship between the dependent variable with independent variable. The value of Nagelkerke R2 is 0.376 which means that the proportion of the variance of the energy consumption of household electricity

Academic Journal of Economic Studies Vol. 1 (2), pp. 79–92, © 2015 AJES
88
can simply be explained by the model as 37.60%. The value of Hosmer and Lameshow (HL) test is 0.919 (> 5%) means that the logistic regression model prepared can be used to predict the value of observation with 95% confidence. Table 5 shows that the proportion of data is (0.4545)² + (0.5454)² = 0.5039 (50.39%). The value of accuracy of logistic regression model (full model) is 67.10%. This value is greater than the value of data proportion. It means that model prepared can be used in predicting the demand or consumption of household electricity in Medan. Based on these tests, it is concluded that in generally the model is feasible to interpret.
5.2. Calibration of Model
Calibration Model is a determination of the parameter values (constant and coefficients) of a model in a logistic regression. Table 6 below shows the calibration and interpretation of the model, which analyzes the independent variables provide the significant expectations.
Table 6. Estimation of Variables in Model of Logistic Regression
Variable B S.E. Wald df Sig. Exp(B)
INC1 (1) 1.128 1.073 1.106 1 .293 3.090
INC2(1) .429 1.048 .167 1 .683 1.535
WTP(1) -1.548 .705 4.823 1 .028 .213
INDEX(1) -.292 .432 .459 1 .498 .746
LOC(1) -.827 .416 3.961 1 .047 .437
POW(1) -.458 .449 1.040 1 .308 .632
QUAL(1) 2.146 .564 14.476 1 .000 8.548
TARIFF(1) -.502 .443 1.282 1 .258 .605
Constant -.263 1.446 .033 1 .856 .769
Source: Author’s computation by using SPSS version 19
Description: INC1 (1) : Household income between Rp 2 million - Rp 4 million per month; INC2 (1) : Household income more than Rp 4 million per month; WTP (1) : Willingness to pay of household under Rp 100 thousand per month; INDEX (1) : Index of household appliances under 20; LOC (1) : Location of household residence in out of city center; POW(1) : Perception of availability of electricity power not sufficient; QUAL(1) : Perception of quality of electricity not good; TARIFF(1) : Perception of electricity prices not affordable (expensive). The estimation of parameter model in Table 6 shows the value of standard error (SE) of each independent variable is less than 2.0. It indicates that there is no problem of

Analysis of Household Characteristics Affecting the Demand of PLN’s Electricity. An Observation on Small Households in City of Medan, Indonesia, Tongam Sihol Nababan
89
multicollinearity within the model. The logistic regression model can be formed as follows: Ln (p/p-1) = -0.263 + 1.228 INC1(1) + 0.429 INC2(1) - 1.548 WTP(1) - 0.292 INDEX - 0.827 LOC(1) - 0.458 POW(1) + 2.146 QUAL(1) - 0.502 TARIFF (5) From the Table 6, it is concluded that there are three variables that affect significantly (α=5%) the energy demand or consumption of small household electricity in the city of Medan, i.e.: willingness to pay (WTP), the location of household residence (LOC), and Perception of quality of electricity. The effect of each variable can be described by viewing the value of the expectation value of the independent variables (Exp (B) or odds ratio as follows: 1. Variable of WTP(1) has an odds ratio of 0.213. It means that the households with willingness to pay < Rp 100 thousand per month tend to 0.213 time lower to consume the electricity energy > 100 KWh per month. In other words, the higher the willingness to pay of a household, the tendency to consume electricity energy > 100 KWh per month 4.694 times (1/0.213) higher compared with the household with willingness to pay < Rp 100 thousand per month, or the higher the willingness to pay of a household, the more the chance to consume electricity energy > 100 KWh per month. 2. Variable of LOC(1) has an odds ratio of 0.437. It means that households who live in out of city center tend to 0.437 time lower to consume the electricity energy > 100 KWh per month compared with the households living in the city center. Or, the closer to the city center the residence of the households, the tendency to consume electricity energy > 100 KWh per month 2.288 times (1/0.437) higher compared with the households living in out of city center. It means the closer to the city center, the more the chance of consuming electricity energy > 100 KWh per month. 3. Variable of QUAL(1) has an odds ratio of 8.548. It means that the households with response of not good to the electricity quality tend to 8.548 times higher to consume the electricity energy 100 > KWh per month compared with the household with response of good to the electricity quality. Or in other words, the increasingly unfavorable response to the electricity quality the more the chance of consuming the electricity energy > 100 KWh per month. Based on the significant variables, the model formed is:
π = exp (-0.263 – 1.548 WTP (1) – 0.827 LOC (1) + 2.146 QUAL (1))
(6) 1+exp (-0.263 – 1.548 WTP (1) – 0.827 LOC (1) + 2.146 QUAL (1)) From the above findings it can be predicted that the households with higher average income and higher WTP will continue to increase the use of electricity energy. Generally, the changes of household income will affect WTP and directly affect the consumption of electricity energy. The consumption of electricity energy differs
Academic Journal of Economic Studies Vol. 1 (2), pp. 79–92, © 2015 AJES
90
significantly between households living in the city center and those who live in out of the city center. The findings indicated that the households in the city center will consume more electricity energy compared with households in out of city center. It can be proved that the households in the city center are more sensitive to environmental factors such as temperature of houses, house arrangement which tends to narrow that use more appliances such as fans, lights, refrigerator, and others with longer duration of electricity usage. Another interesting finding is increasingly unfavourable response to the electrical quality, the more the chance of consuming the electricity energy. The response to unfavourable the electricity quality includes: the blackout of electricity often occurs and the information was not known by the household broadly, as well as the unstable electricity power. This condition is worrying because it can damage household electricity appliances. Thus, to maintain the quality of electricity and not to damage the electricity appliances, the households tend to use the stabilizer. The use of stabilizer, of course will increase the consumption of electricity energy.
6. Conclusions
Based on the estimation of logistic regression, it can be concluded as follows: 1. Of the eight variables observed in the household characteristics affecting the energy demand or consumption of small households (TR-1 / 450VA), there are only three variables that significantly affecting it, i.e.: WTP (willingness to pay), the location of household residence and the response or perception to the quality of electricity. 2. The higher wiilingness to pay (WTP) of the households, they tend to consume higher the electricity energy > 100 KWh per month amounted to 4.694 (or 1/0.213) times compared with the households with willingness to pay < Rp 100 thousand per month. 3. The closer to the city center the location of household residence, the households tend to consume electrical energy > 100 KWh per month amounted to 2.288 (or 1/0437) times compared with the households living in out of the city center. 4. The increasingly unfavourable response to the electrical quality, the higher the chance of consuming the electricity energy > 100 KWh per month.
Based on these results, the suggestions can be implied as follows:
1. The further research can be developed by analyzing the demand or consumption of electricity energy in other groups such as: groups of medium and luxury households which use the higher voltage, business groups, and industry groups with wider area coverage. 2. The further research can be developed by involving more independent variables and using the other models in estimating the factors affecting the demand or consumption of household electricity.

Analysis of Household Characteristics Affecting the Demand of PLN’s Electricity. An Observation on Small Households in City of Medan, Indonesia, Tongam Sihol Nababan
91
3. The role of PLN (State Electricity Company) is needed in order to increase the service systems giving the satisfaction to the public.
References
Agresti, A. (2002). Categorical Data Analysis, New Jersey: John Wiley & Sons, Hoboken. Amarullah, M. (1983). The Pricing of Electricity in Indonesia. Dissertation, The Faculty of the Department of Economics, University of Houston, Texas, USA. Amarullah, M. (1984). Electricity Demand in Indonesia: An Econometric Analysis. Publikasi LMK, No. 01-EP-84, Pusat Penyelidikan Masalah Kelistrikan, PLN, Jakarta. Bartels, R., and Denzil G. Fiebig. (2000). Residential End-Use Electricity Demand: Results from a Designed Experiment, The Energy Journal, 21 (2), 51-81. Garbacz, C. (1984). A National Micro-Data Based Model of Residential Electricity Demand: New Evidence on Seasonal Variation. Southern Economic Journal, 51 (1), 235-249. Guertin, C., Subal C. Kumbhakar, and Ananta K. Duraiappah. (2003). Determining Demand for Energy Services: Investigating Income-Driven Behaviours. International Institute for Sustainable Development, 161 Portage Avenue East, 6th Floor Winnipeg, Manitoba, Canada, (Online) Available: http://www.iisd.org/pdf/2003/energy determining-demand.pdf (October 13, 2010) Halvorsen, B., Bodil M. Larsen, and Runa Nesbakken (2003). Possibility for Hedging from Price Increases in Residential Energy Demand. Discussion Papers No. 347, April 2003, Statistics Norway, Research Department, http://www.ssb.no/publiskasjoner/DP/dp. 347.pdf (October 14, 2010) Halvorsen, R. (1975). Residential Demand for Electric Energy. The Review of Economics and Statistics, 57 (1), 12-18. Hosmer, D.W. dan Lemeshow, S. (2000). Applied Logistic Regression, New York: John Wiley and Son. Jung, T.Y. (1993). Ordered Logit Model for Residential Electricity Demand in Korea. Energy Economics, 15, 205-209. Kuswara, U.D. (1997). Kajian Ringkas Tentang Energi Listrik di Indonesia: Antisipasi Kebutuhan dan Mismanajemen dalam Pengelolaan (A Brief Study of Electricity Energy in Indonesia; The Needs Anticipation and Mismanagement). Kelola, Gadjah Mada University Business Review, 15/VI/1997, 105–114. Larsen, B.M., and Runa Nesbakken (2002). How to Quantify Household Electricity End-use Consumption. Discussion Papers No. 346, March 2002, Statistics Norway, Research Department, (Online) Available: http://www.ssb.no/publiskasjoner/DP/dp. 346.pdf (Oktober 14, 2011)

Academic Journal of Economic Studies Vol. 1 (2), pp. 79–92, © 2015 AJES
92
Maddigan, R.J., Wen S. Chern, and Colleen Gallagher Rizy (1983).Rural Residential Demand for Electricity. Land Economics, 59, 2, 150-162. McKean, J.R., and Wendell D. Winger (1992). Simultaneous Equation Estimates of Electricity Demand for the Rural South: Revenue Projection when Prices are administered. Journal of Forecasting, 11, 225-240. Nam, P. K., and Tran Vo Hung Son.(2005). Household Demand for Improved Water Services in Ho Chi Min City: A Comparison of Contingent Valuation and Choice Modelling Estimates. Research Report No. 2005-RR3, pp.1-23, Economy and Environtment Program foe Southeast Asia (EEPSEA), Singapore, (Online) Available: http://www.eepsea.org (Agust 9, 2010) PLN Statistics 2013 (Statistics of State Electricity Company). PT. PLN (Persero), Jakarta. Rab, M.A. (2001). Household Energy Demand in the South Asia: An Approach Towards Discrete/Continuous Models, Dissertation, the University of Texas at Dallas. Reiss, P.C., Matthew W. White (2001). Household Electricity Demand, Revisited. (Online) Available: http://www.nberg.org/ (May 12, 2009). RUPTL/Rencana Usaha Penyediaan Tenaga Listrik (Plan of Electricity Supply in Indonesia) Year 2006 – 2015. (Online) Available: http://www.pln.go.id.(March 24, 2008) Silk, J.I., and Frederick L. Joutz (1997). Short and Long-run Elasticity in US Residential Electricity Demand: A Co-integration Approach. Energy Economics (ENG), 19 (4), 493-513. Sweeney, J.L. (2004). Properties of Energy Resources and Energy Commodities. Economics Energy, 4(9), (Online) Available: http://www.Stanford.edu/jsweeney/ paper/energy%20economics.pdf (September 16, 2010). Wilder, R.P., and John F. Willenborg. (1975). Residential Demand for Electricity: A Consusmer Panel Approach. Southern Economic Journal, 42 (2), 212-217. Woro, Sus Liris (2011). Analisis Kepemilikan Sepeda Motor pada Rumah Tangga di Kabupaten Buleleng dengan Menggunakan Model Regresi Logistik (Analysis of Motorcycle Ownership on Household in District of Buleleng by Using the Model of Logistic Regression. Thesis, Program of PostGraduate, University of Udayana, Denpasar, Bali, Indonesia.