Chapter(10bus.emory.edu/scrosso/BUS512M/Module 7 Current Liabilities/ch10... · !4...
28
1
Transcript of Chapter(10bus.emory.edu/scrosso/BUS512M/Module 7 Current Liabilities/ch10... · !4...
§1

Chapter 10
Introduction to Liabilities: Economic Consequences, Current Liabilities and
Contingencies
§2

Liabilities
�What is a liability?
� FASB - “Probable future sacrifice of economic benefits arising from present obligations of a particular entity to transfer assets or provide services to other entities in the future as a result of past transactions or events.”
§3
§4
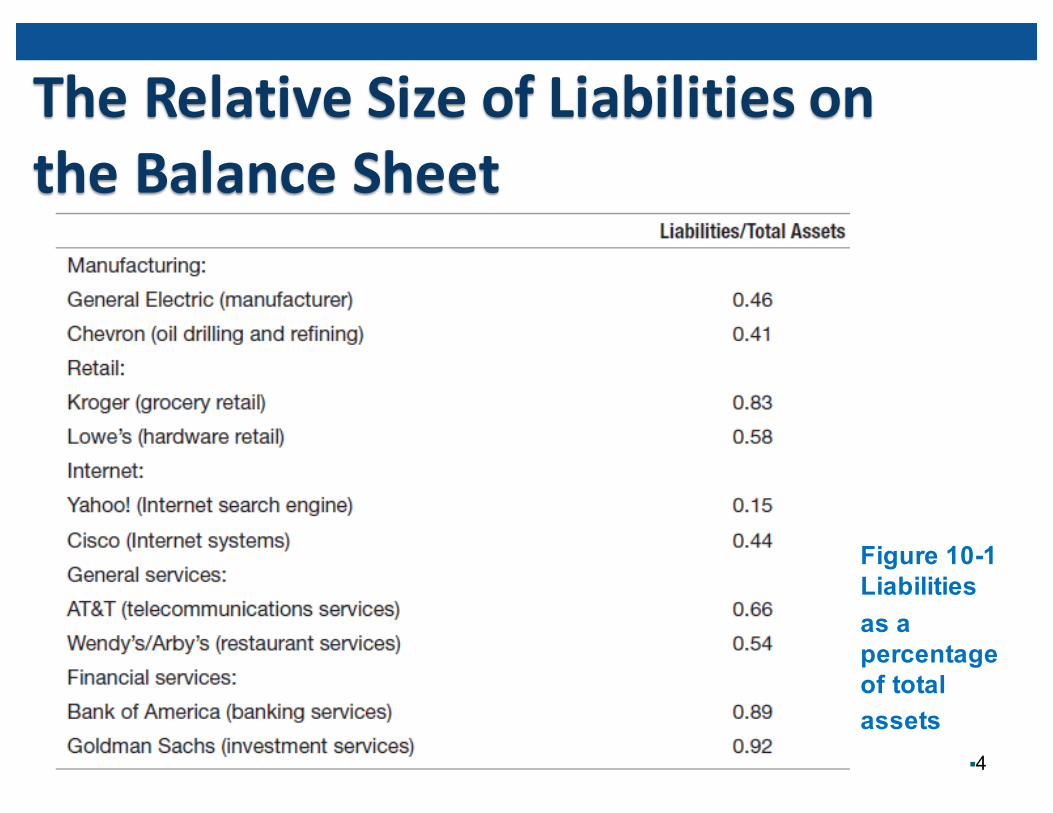
The Relative Size of Liabilities on the Balance Sheet
Figure 10-1 Liabilitiesas a percentage of totalassets

Reporting Liabilities on the Balance Sheet: Economic Consequences
� Shareholders and Investors� Interest expense is tax deductible, but more debt means more risk to shareholders
� Equity ownership is subordinated to creditors
� Creditors� Restrictive covenants regarding debt limits
� Management� When and how to borrow money are important decisions� Wants to minimize debt on the balance sheet� Often looks for “off-balance sheet” financing� Less debt now improves ability to borrow in the future §5

Current Liabilities
§6
Figure 10-2 Current liabilitiesas a percentage of totalliabilities

Current Liabilities� Classification
� Expected to require the use of current assets (or the creation of other current liabilities) to settle the obligation.
� Valuing current liabilities on the balance sheet� Ignore present value (report at face value)
� Reporting current liabilities� Primary problem is ensuring that all existing current liabilities are reported on the balance sheet.
§7

Determinable / Contingent Liabilities
§8
Figure 10-3 Outline of current liabilities

Determinable Current Liabilities� Accounts payable
� Short-term debts
� Short-term notes
� Current maturities of long-term debts
� Dividends payable
� Unearned revenues
� Third Party Collection
� Income taxes
� Incentive compensation
§9
The dollar value of theseliabilities is relatively straightforward – hence determinable
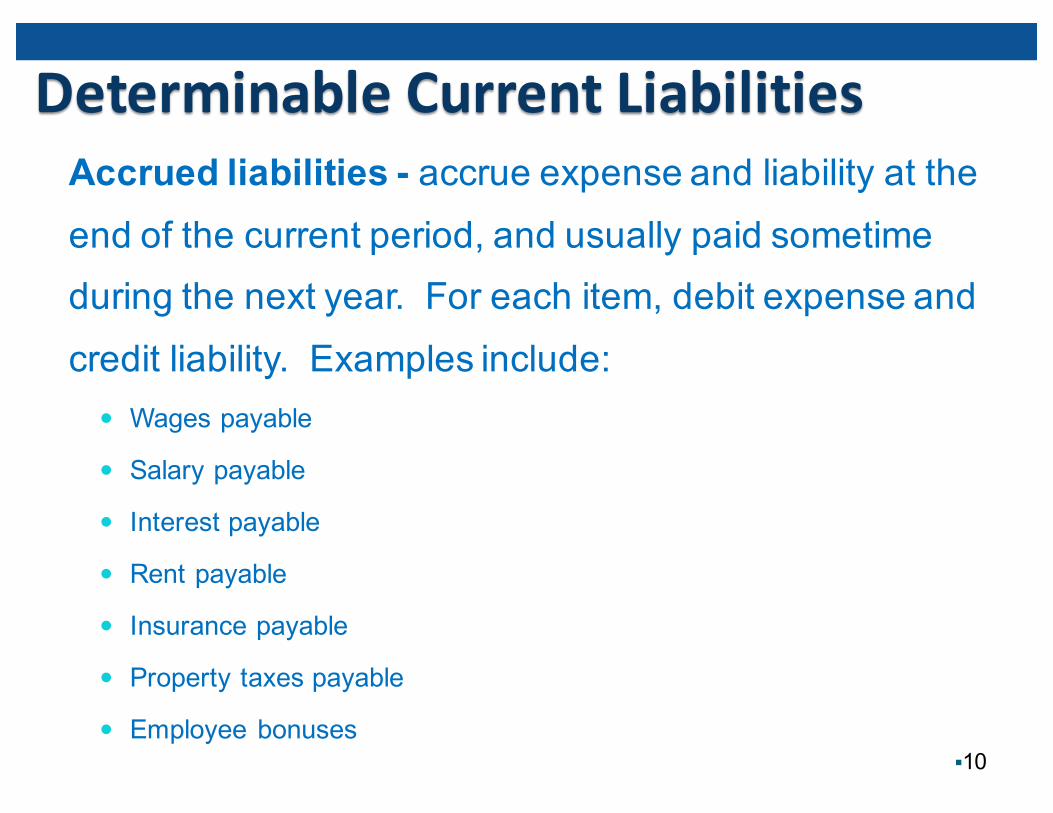
Determinable Current Liabilities Accrued liabilities - accrue expense and liability at the end of the current period, and usually paid sometime during the next year. For each item, debit expense and credit liability. Examples include:
� Wages payable
� Salary payable
� Interest payable
� Rent payable
� Insurance payable
� Property taxes payable
� Employee bonuses§10

Incentive Compensation
§11
Figure 10-4 Bonus formulas of selected large corporations for executive compensation pools

Contingencies and Contingent Liabilities� Contingent on some future event or activity in order to know the exact amount. � Examples: warranties, coupons and lawsuits
� Changes in estimate may be made in subsequent periods, when future event is concluded.
� Under IFRS, many of these transactions are reported in a balance sheet account called “provisions”.� Provisions are more readily booked than contingent liabilities because IFRS provisions are accrued when the obligation is “more likely than not,” while under US GAAP contingent liabilities are accrued when “highly probable,” which is a much higher threshold.
§12

Loss Contingencies
§13
Figure 10-5 Accounting for contingencies
• A promise by a manufacturer or seller to ensure the quality or performance of the product for a specific period of time
§14
Warranty
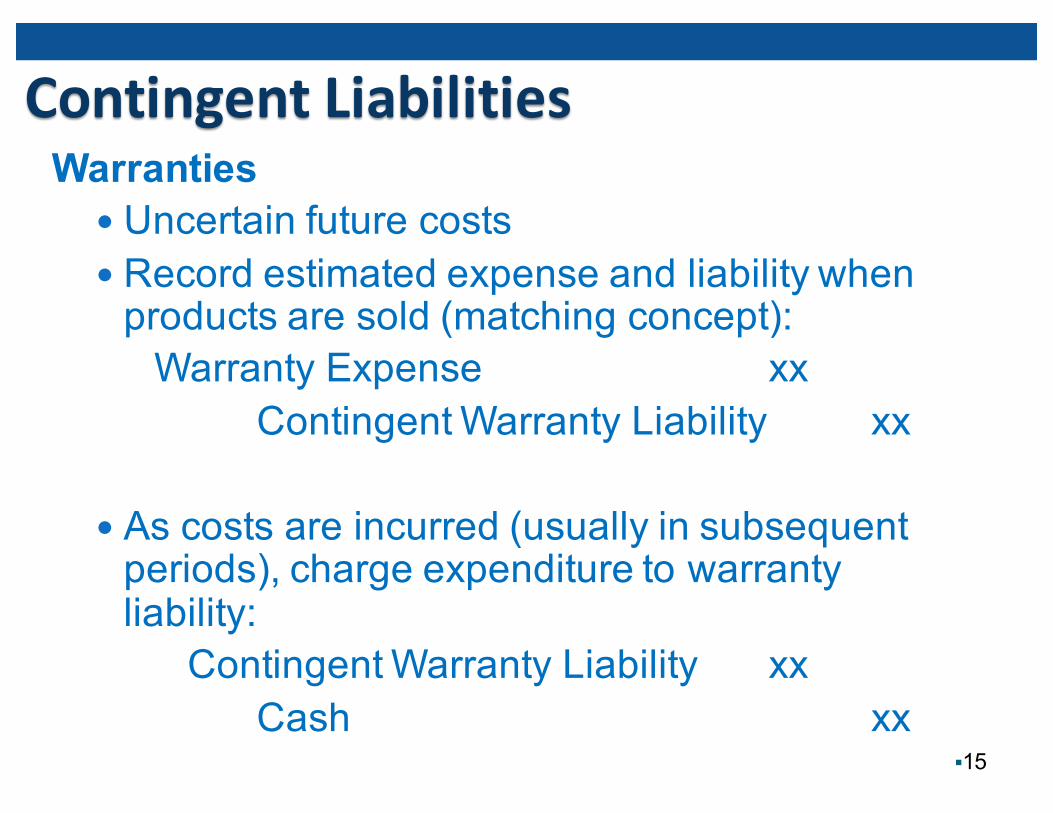
Contingent Liabilities Warranties
� Uncertain future costs� Record estimated expense and liability when products are sold (matching concept):Warranty Expense xx
Contingent Warranty Liability xx
� As costs are incurred (usually in subsequent periods), charge expenditure to warranty liability:
Contingent Warranty Liability xxCash xx
§15

Class Problem: P10-‐4, Parts a & b:Issues and recommendations:- Likelihood?
Probable- Disclose?
Yes- Disclosure?
Indicate range and level of probability(250,000 – 1.5 million)
- Accrue? Since probable (or greater) and
estimable, accrual is required, based onbest estimate.
§16
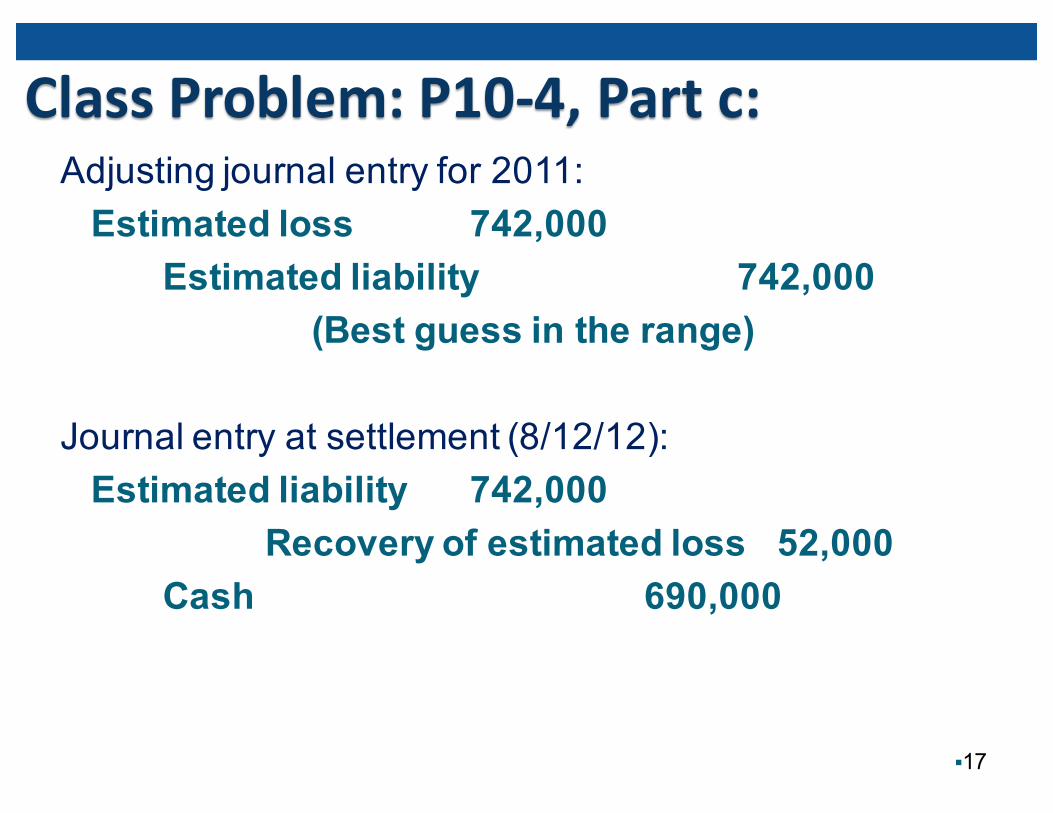
Class Problem: P10-‐4, Part c:Adjusting journal entry for 2011:Estimated loss 742,000
Estimated liability 742,000(Best guess in the range)
Journal entry at settlement (8/12/12):Estimated liability 742,000
Recovery of estimated loss 52,000Cash 690,000
§17
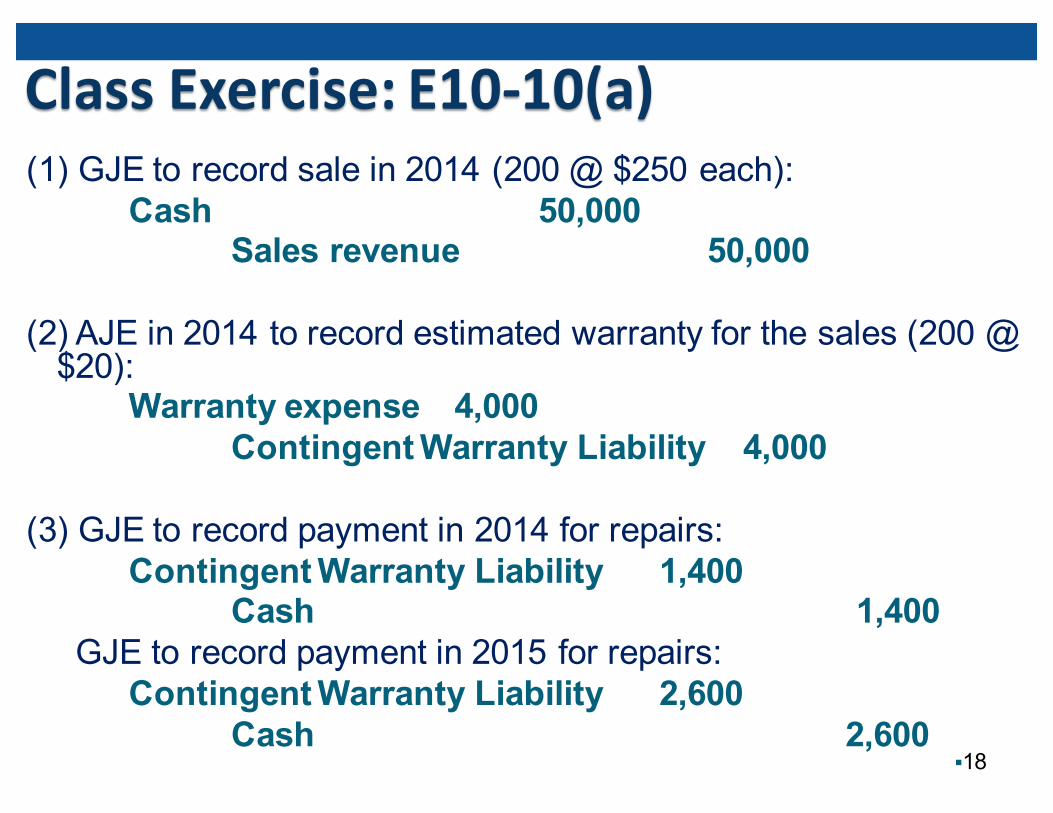
Class Exercise: E10-‐10(a)(1) GJE to record sale in 2014 (200 @ $250 each):
Cash 50,000Sales revenue 50,000
(2) AJE in 2014 to record estimated warranty for the sales (200 @ $20):
Warranty expense 4,000Contingent Warranty Liability 4,000
(3) GJE to record payment in 2014 for repairs:Contingent Warranty Liability 1,400
Cash 1,400GJE to record payment in 2015 for repairs:
Contingent Warranty Liability 2,600Cash 2,600
§18

Class Exercise: E10-‐10(b)Income effects for the revenue and warranty expense under the two alternative for recognition of expense :
Accrue Expense Expense as Paid2011 2012 2011 2012
Revenues 50,000 --- 50,000 ---Warr. Expense (4,000) --- (1,400) (2,600)
Note: the accrual method recognizes the expense in the same period as the revenues generated by the sale.
§19

Appendix 10A Retirement Costs: Pensions and Postretirement Healthcare and Insurance
� Defined Contribution Plans� Less expensive than Defined Benefit Plans� 401(k), 403(b), 457� The entry to record period contributions is very simple:Dr. Pension Expense
Cr. Cash
§20
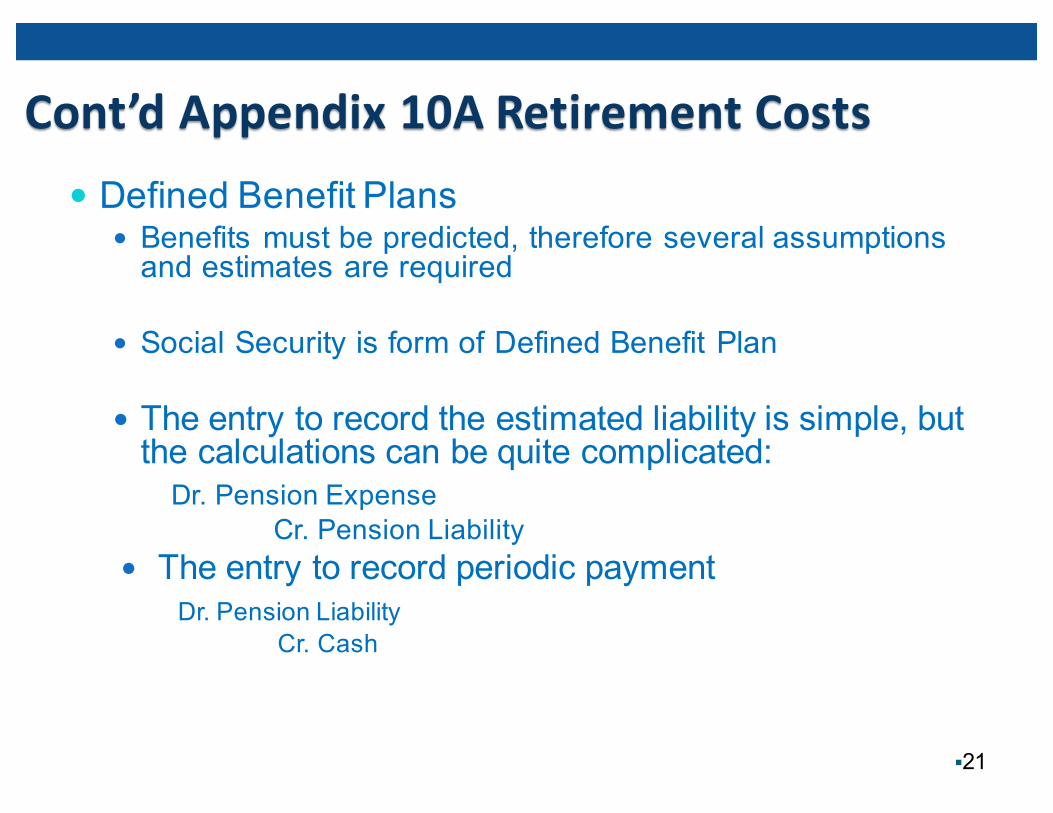
Cont’d Appendix 10A Retirement Costs� Defined Benefit Plans
� Benefits must be predicted, therefore several assumptions and estimates are required
� Social Security is form of Defined Benefit Plan
� The entry to record the estimated liability is simple, but the calculations can be quite complicated:Dr. Pension Expense
Cr. Pension Liability� The entry to record periodic payment
Dr. Pension LiabilityCr. Cash
§21
• Postretirement Healthcare and Insurance Costs• Most large companies provide some after retirement expenses for healthcare and insurance. These items must be estimated and expensed over the employees time of service. These entries are similar to pension entries.
§22
Cont’d Appendix 10A Retirement Costs

Appendix B -‐ Deferred Income Taxes� Generated by the discrepancy between income and expenses for taxation (specified by IRS) and financial reporting (specified by GAAP).
- Example:� Equipment purchased on 1/1/12 for $9,000� 3-year useful life� no salvage value� DDB for income tax purposes� SL for financial reporting purposes� Income tax rate of 30%
§23
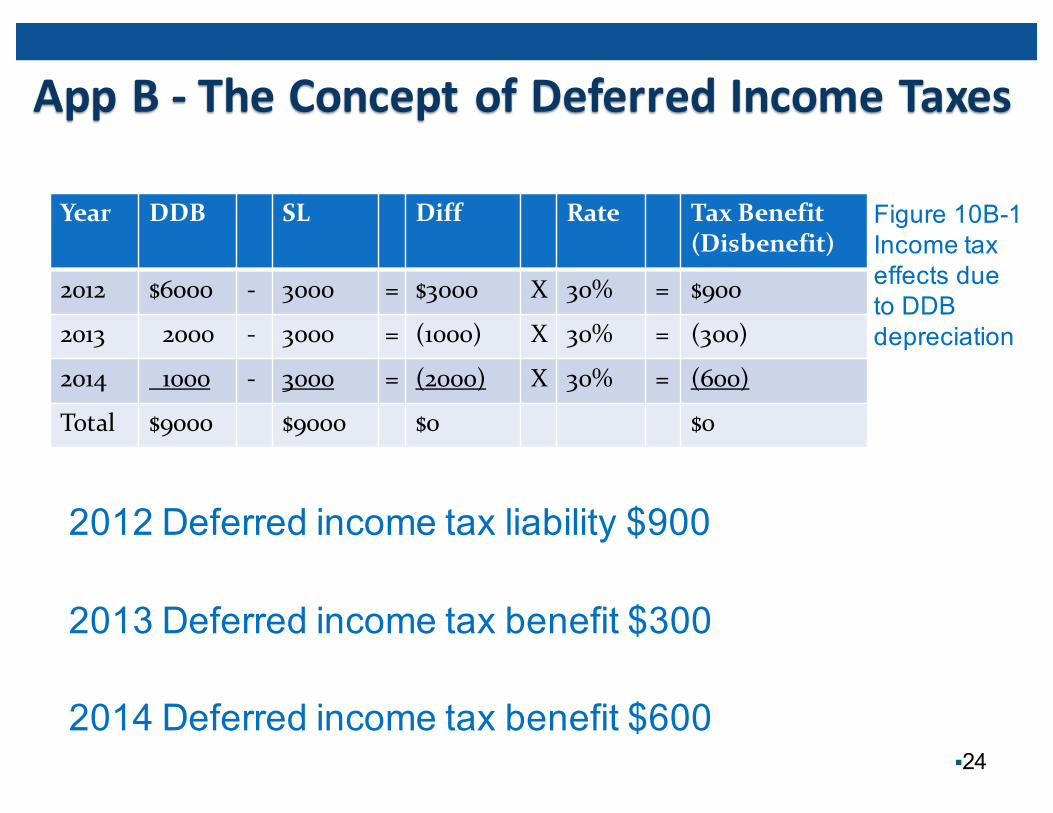
App B -‐ The Concept of Deferred Income Taxes
2012 Deferred income tax liability $900
2013 Deferred income tax benefit $300
2014 Deferred income tax benefit $600§24
Year DDB SL Diff Rate Tax Benefit(Disbenefit)
2012 $6000 -‐ 3000 = $3000 X 30% = $900
2013 2000 -‐ 3000 = (1000) X 30% = (300)
2014 1000 -‐ 3000 = (2000) X 30% = (600)
Total $9000 $9000 $0 $0
Figure 10B-1 Income tax effects due to DDB depreciation

App B -‐ Deferred Income Taxes: Additional Issues
§25
Figure 10B-3 Deferred income tax liability (selected U.S. companies)
Appendix B -‐ The Conservatism Ratio
§26
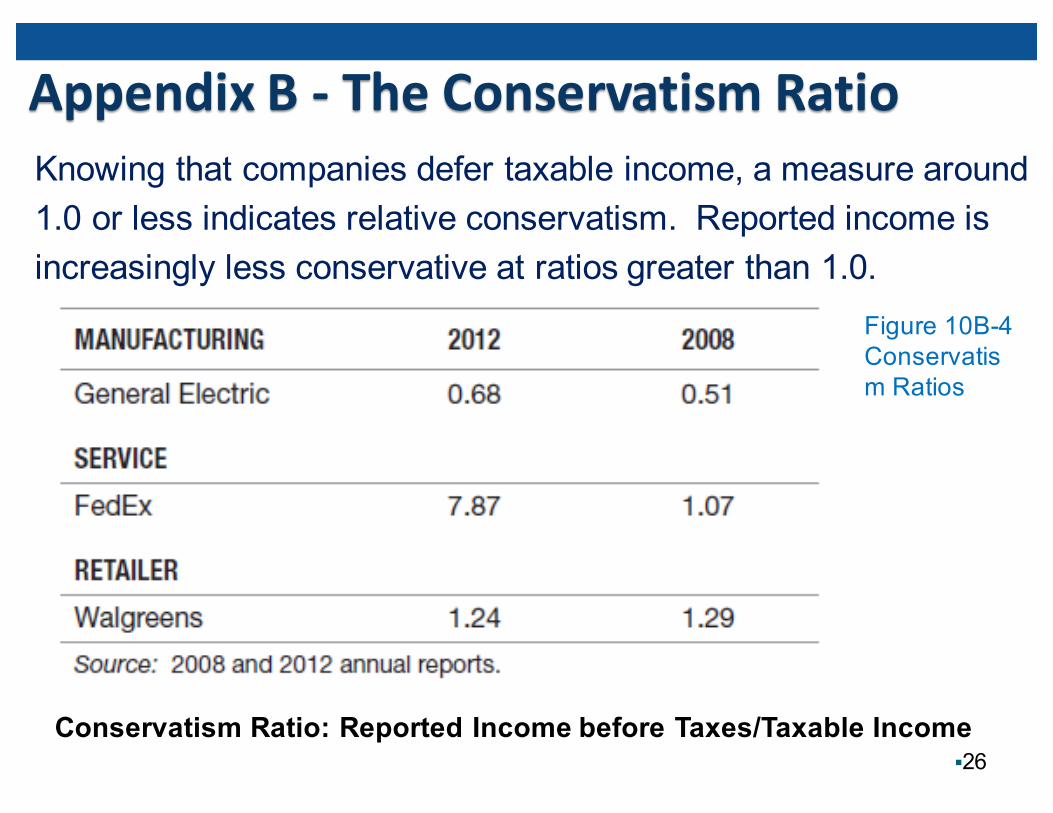
Figure 10B-4 Conservatism Ratios
Conservatism Ratio: Reported Income before Taxes/Taxable Income
Knowing that companies defer taxable income, a measure around1.0 or less indicates relative conservatism. Reported income is increasingly less conservative at ratios greater than 1.0.
Appendix B -‐ The Conservatism Ratio
§27
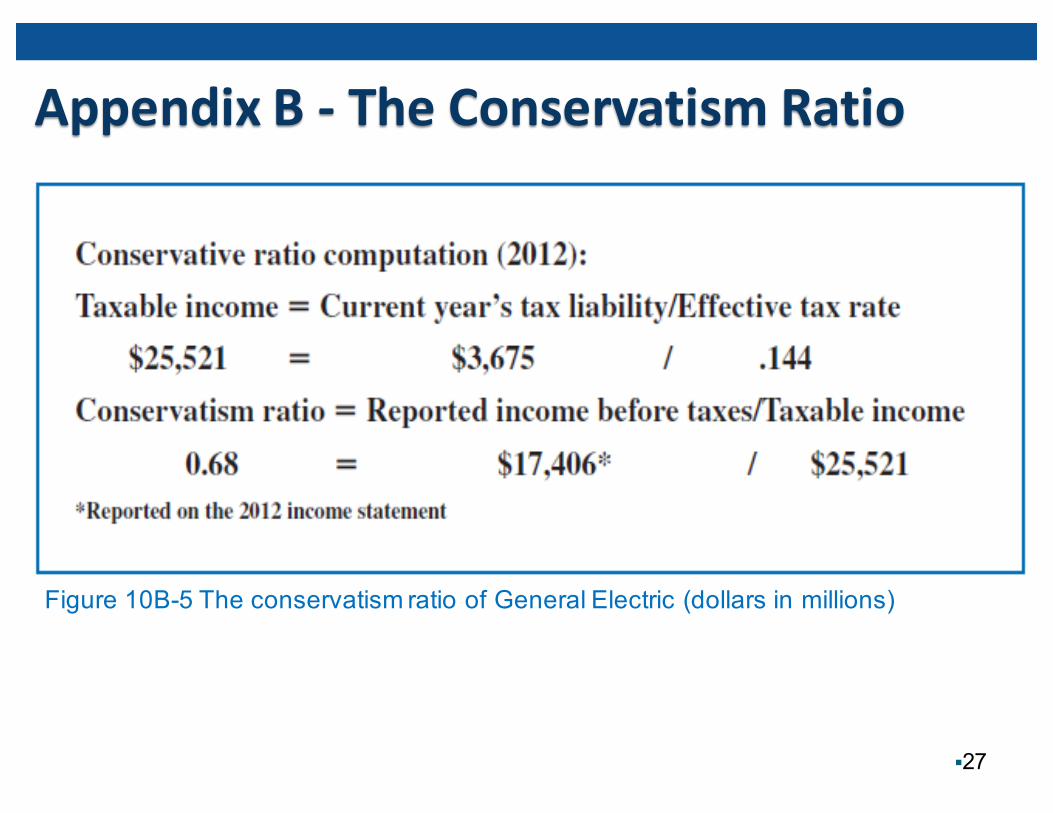
Figure 10B-5 The conservatism ratio of General Electric (dollars in millions)
Copyright © 2014 John Wiley & Sons, Inc. All rights reserved. Reproduction or translation of this work beyond that permitted in Section 117 of the 1976 United States Copyright Act without the express written permission of the
copyright owner is unlawful. Request for further information should be addressed to the Permissions Department, John Wiley & Sons, Inc. The purchaser may make back-up copies for his/her own use only and not for distribution or resale. The Publisher assumes no responsibility for errors, omissions, or damages, caused by the use of these programs or from the
use of the information contained herein.
§28