CHAPTER VIII REMOTE SENSING OF VEGETATION … VIII REMOTE SENSING OF VEGETATION FIRES AND ITS...
70
CHAPTER VIII REMOTE SENSING OF VEGETATION FIRES AND ITS CONTRIBUTION TO A FIRE MANAGEMENT INFORMATION SYSTEM Stéphane P. Flasse, Simon N. Trigg, Pietro N. Ceccato, Anita H. Perryman, Andrew T. Hudak, Mark W. Thompson, Bruce H. Brockett, Moussa Dramé, Tim Ntabeni, Philip E. Frost, Tobias Landmann and Johan L. le Roux 8.1 Background In the last decade, research has proven that remote sensing can provide very useful support to fire managers. This chapter provides an overview of the type of information remote sensing can provide to the fire community. It considers first fire management information needs in the context of fire management information system. An introduction to remote sensing then precedes the description of fire information obtainable from remote sensing data (such as vegetation status, active fire detection and burned areas assessment). Finally, operational examples in five African countries illustrate how the information can be used in practice. 8.2 Fire Management and Information Needs As indicated in previous chapters, fire management usually comprises activities designed to control the frequency, area, intensity or impact of fire. These activities are undertaken in different institutional, economic, social, environmental and geographical contexts, as well as at different scales, from local to national. The range of fire management activities also varies considerably according to the management issues at stake, as well as the available means and capacity to act. Whatever the level, effective fire management requires reliable information upon which to base appropriate decisions and actions. Information will be required at many different stages of this fire management system. To illustrate this, we consider a typical and generic description of a fire 'management loop', as provided in Figure 8.1. • Fire management objectives result from fire related 'knowledge'. For example, they may relate to sound ecological reasons for prescribed burning in a particular land management context, or to frequent, uncontrolled fires threatening valuable natural or human resources. Whatever the issues, appropriate objectives require scientific knowledge (such as fire impact on ecosystems components, such as soil and vegetation), as well as up-to-date monitoring information (such as vegetation status, fire locations, land use, socio-economic context, etc.).
Transcript of CHAPTER VIII REMOTE SENSING OF VEGETATION … VIII REMOTE SENSING OF VEGETATION FIRES AND ITS...

CHAPTER VIII
REMOTE SENSING OF VEGETATION FIRES AND ITS CONTRIBUTION TO A FIRE MANAGEMENT INFORMATION SYSTEM
Stéphane P. Flasse, Simon N. Trigg, Pietro N. Ceccato, Anita H. Perryman, Andrew T.
Hudak, Mark W. Thompson, Bruce H. Brockett, Moussa Dramé, Tim Ntabeni, Philip E. Frost, Tobias Landmann and Johan L. le Roux
8.1 Background In the last decade, research has proven that remote sensing can provide very useful support to fire managers. This chapter provides an overview of the type of information remote sensing can provide to the fire community. It considers first fire management information needs in the context of fire management information system. An introduction to remote sensing then precedes the description of fire information obtainable from remote sensing data (such as vegetation status, active fire detection and burned areas assessment). Finally, operational examples in five African countries illustrate how the information can be used in practice. 8.2 Fire Management and Information Needs As indicated in previous chapters, fire management usually comprises activities designed to control the frequency, area, intensity or impact of fire. These activities are undertaken in different institutional, economic, social, environmental and geographical contexts, as well as at different scales, from local to national. The range of fire management activities also varies considerably according to the management issues at stake, as well as the available means and capacity to act. Whatever the level, effective fire management requires reliable information upon which to base appropriate decisions and actions. Information will be required at many different stages of this fire management system. To illustrate this, we consider a typical and generic description of a fire 'management loop', as provided in Figure 8.1.
• Fire management objectives result from fire related 'knowledge'. For example, they may relate to sound ecological reasons for prescribed burning in a particular land management context, or to frequent, uncontrolled fires threatening valuable natural or human resources. Whatever the issues, appropriate objectives require scientific knowledge (such as fire impact on ecosystems components, such as soil and vegetation), as well as up-to-date monitoring information (such as vegetation status, fire locations, land use, socio-economic context, etc.).
Policies (long-term)
Strategies & Res. Allocations (short-term)
Operational Fire Management
& Research
27.0S Monitori
&
FireManagement Objectives
Information
Figure 8.1. Typical fire 'management loop'.
• Policies, generally at a national and governmental level, provide the official or legal
long-term framework (e.g., five to ten years) to undertake actions. A proper documentation of different fire issues, and their evolution, will allow their integration into appropriate policies, whether specific to fire management, or complementary to other policies in areas such as forestry, rangeland, biodiversity, land tenure, etc.
• Strategies are found at all levels of fire management. They provide a shorter-term
framework (e.g., one to five years) to prioritise fire management activities. They involve the development of a clear set of objectives and a clear set of activities to achieve these objectives. They may also include research and training inputs required, in order to build capacity and to answer specific questions needed to improve fire management. The chosen strategy will result from a trade-off between priority fire management objectives and the available capacity to act (institutional framework, budget, staff, etc.), and will lead towards a better allocation of resources for fire management operations to achieve specific objectives. One example in achieving an objective of conserving biotic diversity may be the implementation of a patch-mosaic burning system (Brockett et al. 2001) instead of a prescribed block burning system, based on an assumption that the former should promote biodiversity in the long-term than the latter (Parr and Brockett 1999). This strategy requires the implementation of early season fires to reduce the size of later season fires. The knowledge of population movements, new settlements or a coming El Niño season, should help focus the resources usage, as these factors might influence the proportion and the locations of area burned. Another strategy may be to prioritise the grading of fire lines earlier than usual based on information on high biomass accumulation. However, whatever the strategies, they need to be based on reliable information.
• Operational fire management concerns the implementation of the strategy. Daily
activities will also be most effective if based on reliable and up-to-date information. For example, an accurate knowledge of fire frequency, fuel load, fuel status and meteorological conditions across the management area will help to inform the choice
and timing of areas for ignition within a prescribed burning programme; early detection of active fires in relation to their potential impact will help prioritise the activities of fire fighting teams.
• Research activities may require a range of studies - from long-term to short-term/one-
off - in order to answer specific questions of concern to improving fire management. • Monitoring and evaluation activities are essential to close the 'management loop'.
They allow the assessment of the effectiveness of different strategies, to document the current situation, and to learn from the past in order to adapt and improve knowledge and management activities for the next loop.
• Repeating the loop is also an essential part of management, in order to evolve with the
natural, economic, and societal changes. Updated information will always be required to act appropriately.
A Fire Management Information System (FMIS) is an important tool to support integrated fire management. It allows for incorporating information and knowledge from various sources and integrating them into thematic information in direct support of specific decisions. FMIS can include information such as:
• Fire events over the years (e.g., where, when and how often have areas burned).
• Information that may be related to the fire events (e.g., what vegetation was burned, ecological knowledge obtained in the field, desired fire regimes, areas where fires are acceptable/unacceptable (under management or not), why fires are set, attitude of different people towards fire and fire prevention, population density, meteorological data, vegetation status, economical assets).
• Ancillary information (e.g., roads and river network, administrative boundaries,
protected areas, concessions, villages, fire towers, fire fighting units).
• Modelling tools, e.g. fire prescription models, fire danger models and fire spread models.
Fire is seen as an efficient tool in the management of (often) large areas of land (Bond and van Wilgen 1996). However, whilst field observations will always be a vital part of fire management, the very size of the areas often means that field observation alone cannot provide sufficient information with sufficient accuracy and regularity to provide a reliable basis for fire management. Such problems are compounded in countries and regions where resources and local staff are particularly constrained. Many studies have demonstrated the potential usefulness of remote sensing techniques for monitoring the Earth’s surface and providing fire related information in particular (e.g., Kaufman et al. 1990; Pereira et al. 2000).
Due to a high correlation between variations observed from remote sensors and variations on the Earth’s surface (Congalton and Green 1998), remotely sensed data provide an excellent basis for monitoring parameters of interest to fire managers, such as biomass, vegetation

status, the occurrence of active fires and the delineation of areas that burn. It works because the Earth’s surface reflects light and emits energy differently according to its land cover type, status, quantity and several other factors. The technology can give the geographical location of any point of an image, therefore allowing its combination with other geographic information such as roads, fire units, protected forest, plantations, villages and other fire-related information, as well as the cross-comparison of images taken at different times within and across seasons. The benefits that remotely sensed data provide to fire management include:
• It is often less expensive and faster than obtaining the same information on the ground over large areas.
• It permits the capturing of data across a wider range of the electromagnetic spectrum
than can be seen by humans. This can allow the extraction of a wider range of fire-related information.
• Observations are spatially comprehensive. They cover large areas of territory (e.g. the
whole of Ethiopia at once), including areas that are remote and difficult to access by land.
• In the case of satellite observations, observations are regular (e.g. daily), allowing for
frequent updates of the situation. • Because the satellite orbits the Earth continuously, observations are reliable,
systematic and objective (i.e. the same place can be imaged repeatedly with the same sensor).
8.3 Remote Sensing Data: Introduction 8.3.1 A Short Introduction to Remote Sensing One of the simplest, broad, definitions of remote sensing, is that given by Lillesand and Kiefer (2000): “Remote sensing is the science and art of obtaining information about an object, area, or phenomenon through the analysis of data acquired by a device that is not in contact with the object, area, or phenomenon under investigation”. You are therefore using remote sensing as you read these words! Your eyes are sensing variations in light from the page and your brain is interpreting these ‘data’ so that you can understand the information that the words convey (Lillesand and Kiefer 2000). Other definitions add that the information is usually derived about the Earth’s land, water and atmosphere from images acquired at a distance, based on the measurement of electromagnetic energy from these features (Campbell 1987).

In the context of Earth observation remote sensing, an image is generally a picture received from a satellite or an airborne sensor. Digital images from satellite remote sensing are useful for fire monitoring because they:
• Allow low cost, rapid and regular coverage of the often extensive and inaccessible areas affected by fire.
• Permit capture of types of data that humans cannot sense, such as the near-infrared and
thermal part of the electromagnetic spectrum, which may provide additional useful information.
Here we briefly introduce the general characteristics of digital images, mostly from space borne sensors, as a potential source of information for fire management. As different sensors provide images with different characteristics, we focus on criteria commonly used to evaluate and compare imagery from different sources. Appendix 1 summarizes satellite sensors currently providing data for Africa. Spatial Resolution An image may look, at first sight, like a photograph. However, enlarging the image reveals that it is actually made up of many small square blocks, called pixels (short for picture elements)

A) B)
C)
30 m 30 m 1 Pixel = Landsat TM:
Figure 8.2. In the overview image (A), a burned area is clearly evident in shades of medium to dark blue. Unburned vegetation appears green. With increasing magnification (B), the image appears more “grainy”, until in (C), individual pixels - that make up the image - can be seen. The image is made from TM data with a spatial resolution of 30 m. The intensity, or brightness with which each pixel is displayed, is proportional to the average brightness, or radiance, measured electronically over the ground area corresponding to each pixel.
All sensors have a limit on how small an object on the earth’s surface can be and can still be seen by a sensor. This limit is known as the spatial resolution and is related to the image pixel size. The 30 m spatial resolution of the Landsat-TM image, used in Figure 8.2, renders a detailed view of a burned area, with the complex perimeter and unburned islands of vegetation clearly visible.
The low spatial resolution NOAA-AVHRR sensor uses a pixel size of 1.1 km, which means that most objects smaller than 1 km cannot be detected reliably (with active fires being an important exception). Figure 8.3 shows how the same burned area was mapped from TM and AVHRR data, and reveals the degree of simplification inherent at coarse spatial resolution.

A) B)
Figure 8.3. The same burned area, (A) mapped from TM data with a spatial resolution of 30 m and (B) mapped from AVHRR data with a spatial resolution of approximately 1.1 km (at best). Although the burned area is approximately the same shape in both pictures, the AVHRR representation is highly simplified compared to using TM, illustrating the loss of detail at lower spatial resolutions.
8.3.2 Swath Width Sensors on polar orbiting platforms cover a ‘swath’ or ‘strip’ of the Earth’s surface, with the width of the swath, and hence the width of the image, depending on the particular sensor. In general, broad-swath imagery (e.g., 2700 km wide) is well adapted to the frequent observation of large areas, but at the expense of spatial detail, while narrow-swath imagery (e.g. 185 km wide) provides the spatial detail but is available less frequently. 8.3.3 Temporal Resolution The frequency with which a satellite is able to take an image of a particular area of ground is also important. The time interval between images is called the return period. The shortest reliable return period is known as the temporal resolution of the sensor. This usually varies between 15 minutes to over 30 days depending on the satellite.
The temporal resolution is largely determined by the orbit characteristics of the satellite, but the spatial resolution of the sensor will also affect this. For example, the NOAA AVHRR sensor scans a continuous swath 2700 km wide and can image the entire earth surface twice per day, but at a spatial resolution of only 1.1 km. A SPOT sensor covers a swath around 60 km wide with a spatial resolution down to 3m, but the narrow swath means that it takes 26 days to image all of the earth and therefore one place is only revisited every 26 days (see Annex 1).

8.3.4 Spectral Resolution The human eye can see many different colours that, taken together, make up visible light. Visible light is only one of many forms of electromagnetic energy. Radio waves, X-rays and ultraviolet rays are other familiar forms. All electromagnetic energy travels in waves at the speed of light. The distance from one wave peak to the next is called the wavelength. The electromagnetic spectrum is divided up according to wavelength (usually measured in micrometers - µm), although there are no clear-cut dividing lines between the different regions. Satellite sensors are sensitive to a much wider range of wavelengths than that of visible light. Sensors effectively ‘see’ at wavelengths that are invisible to the eye, and this often allows more information to be obtained about objects than would be possible by simply looking at them.
Objects reflect and emit different amounts of radiation at different wavelengths. In the visible to mid-infrared, this response is measured using reflectance. In practice, satellite sensors usually provide each image in a number of different bands or channels. Each band is sensitive to electromagnetic radiation over a restricted range of wavelengths. By strict definition, the narrowness of this range gives the spectral resolution of the band. However, in the context of satellite remote sensing, spectral resolution can be more usefully interpreted as the particular band used. The sensor makes measurements of the total response across the particular band used. No more precise reading can be made by this sensor within the band.
Comparing reflectance spectra of different surfaces can help to determine which bands are most appropriate for looking at each cover type. Figure 8.2 shows an example of reflectance spectra for a burned surface, green shrub and senescent grass. The approximate wavelength intervals (blue, green, red, near infrared (NIR), short mid-infrared (SMIR) and long mid-infrared (LMIR) are also shown. It is possible to distinguish both vegetation types from the burned surface in the near infrared, because the reflectance of the burned surface is low and the reflectance of the vegetation is high. Hence they will appear dark and light respectively on a near infrared image band. At visible wavelengths, the two vegetation spectra (particularly shrub) are similar to the burned surface, suggesting that visible bands do not provide good contrast between burned and unburned vegetation. In the SMIR, only grass contrasts strongly with the burned surface, whilst in the LMIR, only shrub has good contrast.

0
10
20
30
40
0.5 1.0 1.5 2.0 2.5
Red
Blue
Gr
een
NIR
SMIR
LMIR
Grass
Burned surface (1 hour post-burn)
Green shrub
Wavelength (µm)
Ref
lect
ance
(%)
KEY
Figure 8.4. Spectral response (variation of reflectance with wavelength) of a burned surface, compared to senescent grass and green shrub. The approximate wavelength intervals are also marked with dashed lines. Clearly, discrimination between surfaces depends on the band used. In fact, sensors that take measurements in few broad bands, offer less potential information than sensors that measure

EM energy in many bands positioned over a wider range of wavelengths. For example, panchromatic air photos (i.e. sensitive to all colours) are sensitive to light reflected from the surface (approximately analogous to having one band in the visible). Using these photos, some burned areas can only be interpreted reliably up to three days after the fire. In contrast, data from the Landsat-TM sensor, provided in seven bands over a much wider spectral range, can identify the same burned area for many months after burning. Similarly, other combinations of spectral bands can be used to derive other fire-related information such as active fires and fire risk. 8.3.4. Cost Data costs vary from free, unlimited access to all available images (as is the case with AVHRR data, so long as the necessary receiving equipment is in place), to costs of well over one thousand US dollars for each image acquired. In general, prices increase with spatial resolution. Low spatial resolution and free data (e.g., NOAA-AVHRR) can often be very useful for fire management. 8.3.5 Operational versus Research Satellite Programmes Operational satellite programmes are organized to guarantee the routine availability of particular kinds of remotely sensed data, from the same type of instrument, over extended or indefinite time periods. As such, they offer a very important resource for comparing patterns and trends in surface cover and processes between years. For example, the NOAA-AVHRR has provided data operationally since 1979, which has been used in studies of global change, and is a valuable resource for studying fire patterns over the years.
Research satellite programs do not place the same guarantees on prolonged availability of data, and are primarily aimed at demonstrating or using improved technology to provide better information. As such, they are important potential sources of improved fire management information, but there are less guarantees how long into the future the data will remain available. 8.3.6 Data Access Remotely sensed data have in general become easier, cheaper and quicker to access through time. Initially, all data had to be ordered from large, centralized receiving stations, usually far from the institutions requiring the data. Raw data was usually delivered on tape, or as hardcopy, which could mean having to wait several weeks to obtain data. The advent and rapid development of personal computers, combined with improvements in receiving hardware, resulted in PC-based receivers that allow local institutions to access low spatial resolution imagery themselves, in near-real time. For example, LARST (Local Application of Remote Sensing Techniques) receiving units currently provide direct access to AVHRR or Meteosat data in many organizations in over 40 different countries (Williams 1999; Downey 1994). Further advances in technology have resulted in portable, high specification receiving stations that can allow local institutions to collect their own images directly from high spatial resolution sensors such as Landsat-TM, ERS-SAR and SPOT-HRVIR (Downey 2000).

With the advent of the internet, organizations who launch satellites are increasingly aiming to provide images and other products online, for rapid access by end-users. For example, data from the MODIS sensor is obtainable over the internet free of charge and data from the operational SPOT VEGETATION sensor is already commercially available online. At the time of writing, most high spatial resolution satellite data are still received through a network of few grounds stations, and their distribution organized centrally.
Clearly, choosing a sensor and route to provide particular fire management information will require careful consideration of the above aspects, to identify a data source suitable for providing the desired information of the area of interest with sufficient detail, accuracy, regularity and economy, to support specific fire management objectives. Some of these issues are explored further in the section on burned area products (8.4.3). 8.3.7 Other Considerations It is worth mentioning some additional characteristics of remotely sensed data, that the fire manager will need to bear in mind. Thick cloud cover obscures the surface in most bands used in operational remote sensing for fire (only radar observation can go through clouds). The same is valid for thick smoke (except at the mid-infrared). Centralized receiving stations usually provide browse products of the images on offer that can be visually inspected for cloud and smoke, so that cloud-free images can be identified and ordered.
The accuracy of maps made from remotely sensed data is variable and depends on many factors, and quality control is therefore important at all stages of map production. It is extremely important to choose a data source that will register the different features to be mapped as having distinctly different levels of electromagnetic response. Spatial, temporal and spectral resolutions are all important in this regard. Secondly, having identified an appropriate data source, a robust method must be chosen and applied to extract the desired information and deliver the final map. Uncertainty in the accuracy of maps derived from remotely sensed data generally increases with decreased spatial resolution, spectral resolution and longer return periods. As we have seen, the accuracy of maps made from low spatial resolution data is inherently limited by the low spatial precision of the raw data.
Realization of the full potential of any maps made from remotely sensed data therefore requires the accuracy of the map to be assessed. This can be done quite simply by collecting a sample of reference data (assumed to be true) at representative locations, which are then compared with the same locations on the map. The overall accuracy can then be estimated, as well as other measures of accuracy, that are of direct interest to the producer and users of the map. This can then help to ensure the adequacy of the maps (and hence the data source and methods used), for providing the required management information. Congalton and Green (1999) provide a comprehensive introduction to the principles and practices of assessing the accuracy of remotely sensed data. 8.4 Remote Sensing Products fir Fire Management 8.4.1 Introduction Remote sensing data can assist fire management at three stages relative to fire occurrence:

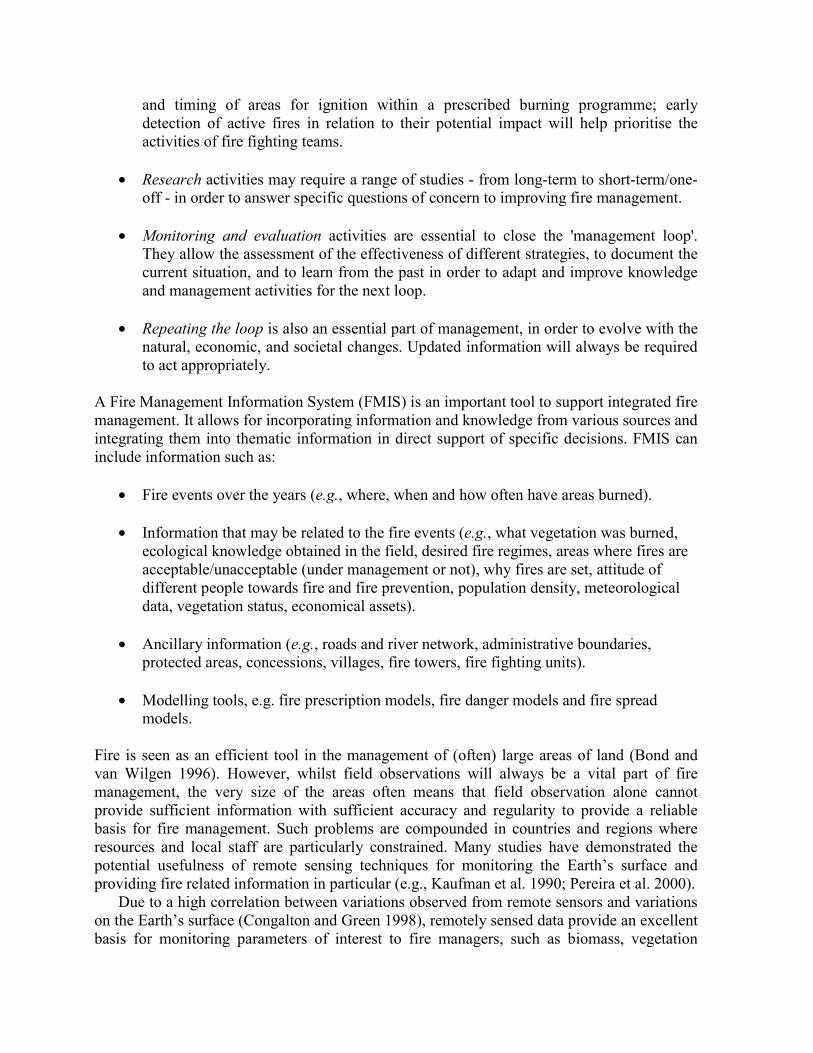
0 100 kmActive fire front
Smoke
Burnt area area
Vegetation
Okavango delta
(i) Before the fire: fuel load, vegetation status (e.g. degree of curing, moisture content) and
rainfall, (ii) During the fire: near real-time location of active fires, and (iii) After the fire: assessment of burned areas. Figure 8.5 gives a basic idea of how fire activity at the surface of the Earth is seen from space, in this case, using a thermal image that is presented so that hot areas appear relatively bright and cooler areas are relatively dark. As one might expect, active fire fronts and burned areas stand out as bright features that contrast well with cooler areas such as smoke and unburned vegetation. Figure 8.5. Thermal image from the AVHRR sensor, over northern Botswana. White is hot, and black is cold. From this simple example, we might conclude that the extraction of active fires, burned areas and other fire-related information from remotely sensed data should be straightforward. However, in reality, it is often far from trivial. In our example, are the observed bright areas definitely active fires or are they burned areas, and how do we distinguish between the two? Are cold areas smoke or vegetation or even water? Are the different features best distinguished using a thermal image alone?
The sensor on board a satellite platform (or a camera on board an aircraft) only observes Electromagnetic (EM) radiation coming from the surface of the Earth. Proper extraction of adequate information requires methods that are based on the knowledge of how fire-related features impose variations in radiation quantities that are measurable by remote sensors. The observed surface radiation can come from reflected sunlight or from emission by

the surface itself1. For example, a fire will be hot and reflective, whereas water will be relatively cold and unreflective, both leading to different quantities of radiation being measured by the sensor. Using these differences and variations, digital processing methods, known as algorithms, can be designed to extract (from the signal) information in terms of active fires, burned areas, fuel load, vegetation moisture, and rainfall. If appropriate methods for digital image processing are unavailable, images can alternatively be interpreted visually using similar techniques to air photo interpretation, with interpreted areas either digitised from a computer-displayed image, or drawn on hardcopy.
It is important to realize that the accuracy of fire information obtained from remote sensing will vary considerably, depending both on the characteristics of the sensor used to obtain the raw data, and on the precision or appropriateness of the algorithm or visual interpretation used to transform the raw data into fire information. It is therefore important that steps are taken to assess the quality or accuracy of any information obtained from remote sensing. This is a vital step to ensure that the best information extraction techniques are chosen, to allow accuracy to be improved where necessary, or to at least ensure that any inherent limitations are accounted for realistically when making decisions based on the remotely sensed information. In short, the right decisions can only be assured if the accuracy of the remote sensing technology is quantified and where necessary accounted for.
The next sections describe various remote sensing products useful to fire management, covering their use and the method for their extraction. 8.4.1 Active Fires Active fires can be detected from satellite data because fire fronts are very hot and emit large amount of energy that can be observed by thermal sensors on board satellites or aeroplanes. The identification of fires in an image is now relatively well mastered, and remaining limitations are mostly due to the sensor in itself. The basic active fire product is a list of locations (latitude and longitude) corresponding to pixels detected as having an intense source of heat in the area of land they cover. Active fire product in fire management Once integrated into a fire information system, the list of fire locations can be used in two main ways: a) In near-real time, to prioritise resources for fire fighting. Within minutes of the satellite overpass, the fire manager can locate active fires on the territory of responsibility. Introduced into the fire information system, the importance of a fire can be considered. For example, a fire in an agricultural area, at the time of land preparation, may mean a controlled good fire, presenting no risk. On the other hand an unexpected fire near a coffee or a young palm tree plantation for example may be more important to tackle. Fire locations can also be used, on a daily basis, to monitor for example that planned prescribed burning is actually taking place.
1 In the case of ‘active’ remote sensing (such as some radar systems), sensors actually measure the quantity of radiation, initially sent by the sensor itself, which bounces back from the earth surface. These are so far not used very much in the field of fire monitoring, and are not detailed here.
b) As post-fire information, the active fire product can be used in several ways. First it can support a policing role. When officers go out in the field to see farmers and villagers, fire maps can provide strong evidence that there is official monitoring and therefore can be useful to promote alternative or preferred fire practices. Secondly, active fire products can be used to document fire activity in a park, over a municipality or over a whole country. They have been used in this way since the mid 1980s. Due to the nature of active fire observation (see further discussion) as well as scientific progress, the direct mapping of burned areas is increasingly seen as a way of providing more complete fire figures. Nevertheless, active fire locations still remain valuable and complementary products in, for example:
• Documenting the extent of individual fire fronts and the size of fires that contribute to the burned area mosaic.
• Documenting trends over the years. • Documenting the type of fires according to the vegetation in which they occur. • Identifying areas of particular human pressure on natural forest. • Monitoring and evaluating fire strategies (prescribed burning, awareness campaigns,
etc.). Operational active fire products There are a number of satellite and airborne remote sensing systems which can contribute to fire monitoring from space, including NOAA-AVHRR, Landsat-TM and MSS, SPOT, GOES, DMSP, ERS-ATSR, and JERS. The temporal, spectral and spatial characteristics of these instruments provide a wide range of sensing capabilities (Justice et al. 1993) and some of them have been shown to be well adapted to fire detection applications. However, the usefulness of operational near real-time fire detection from space, is obviously very much dependent on observation frequency.
High spatial resolution satellites, such as Landsat and SPOT, can contribute to fire monitoring, but their cost, their centralized receiving stations and especially their low temporal resolution, limit their use on an operational basis. Meteorological satellites are more appropriate because of their high repetition coverage. The Meteosat geostationary satellite series2 cover Africa and Europe, and provide images every 30 minutes (Meteosat Second Generation satellite, to be launched in mid-2002, will provide an image every 15 minutes, with improved channels for fire information). The polar orbiting NOAA series acquires images over the same area every 12 hours by the same satellite, and cover the entire world. There are early afternoon and early morning passes available, as there are two operational satellites. High temporal frequency is especially useful if the data can be acquired, analysed and disseminated in near real-time. Satellites such as NOAA and Meteosat broadcast their data continuously and only require small receiving stations. A number of these stations are distributed all over the world. Local acquisition of data free of charge, analysis in situ, and fast dissemination of fire information is possible with these two satellite series (e.g., Jacques de Dixmude et al. 1999).
Several authors have developed algorithms for active fire detection with AVHRR data. The reader will find a good review and details on these algorithms in Martín et al. (1999). They are all based on using AVHRR mid-infrared channel, most suited to be sensitive to fire
2 Its sister, covering the Americas, is the GOES series.

fire pixel fire pixel fire pixel fire pixel fire l
|--2 fires--|--1 fire----|--forest--|----forest----|-----one large fire-------
front temperature level. There are many factors that can affect the detection, such as cloud and smoke, hot soil and sun glint on water. Flasse and Ceccato (1996) developed a contextual method designed to be robust and automatic, for operational use. It is used operationally in several tropical countries (e.g., Flasse et al. 1998). It has also been the basis for global fire detection activities such as the IGBP-Global Fire Product and the World Fire Web of the Joint Research Centre (see http://www.gvm.sai.jrc.it/fire/activities.htm).
Up to now, it is essentially NOAA-AVHRR that has provided long-term, continuous operational satellite-based systems, allowing low cost direct reception and near real-time fire information over Africa. However, when the documentation of the fire activity does not require long-term and continuous coverage, and when near-real time is not an issue, other sensors, as mentioned above, can provide a valuable contribution to practical studies. Product Interpretation There are several points that are important to take into account when interpreting and using active fire products from AVHRR data. Most of them are linked to the intrinsic characteristics of the satellite platform and its sensor. Detection algorithms are usually set to minimize the number of false detections. Consequently, some fires will also be missed. The main points to understand are described below: • Fire and pixel size. AVHRR was not initially designed to detect fires. The AVHRR signal over an active fire saturates quickly, and thus does not vary very much between small and large fires. Consequently:
o Very small fires are not detected. Pixel size conditions the minimum area that has to be burning to have a signal detectable from the satellite. Belward et al. (1993) demonstrated that a bush fire, with a burning front as small as 50 m, could be detected by AVHRR 1x1 km pixel.
o A pixel detected as fire could actually represent different situations. o There could be one or several active fires in the area covered by the pixel, or the pixel
area could all be covered by a large fire front, of which the pixel would only be a part.
Figure 8.6. Fire pixel interpretation.

• Location accuracy. The location of a fire can only be given within a variable range, which for AVHRR typically varies between 1 and 3 km. The term fire location refers to the central latitude and longitude of the fire pixel. It is easy to understand that - depending on the fire size and the pixel size as described above - the central point of the pixel may not exactly represent the position of the fire. In addition, errors can also come from the actual geographical registration accuracy of satellite image in itself. • Timing. Only those fires that are active at the time of the satellite overpass will be detected. Those fires starting after image acquisition will not be detected until the next image, or missed if they are extinguished prior to the acquisition of the next one. While this can be a constraint for fire fighting, because the NOAA satellite passes in the afternoon, local time, corresponding to high fire activity, active fire products will be representative of the general fire activity. • Clouds. Although AVHRR channel 3 can see active fires through smoke and thin clouds, fires under thick clouds are not visible from the satellite. Finally, it is important to note that products should be field validated where possible. However, it is very difficult to validate remote sensing products because of scale issues, as well as the cost associated with exhaustive validation campaigns. Experience shows that current algorithms perform well, and the existing imprecision is usually greatly outweighed by the advantages of remote sensing observations (large area, repeated coverage, etc.). However, users should always be aware of these issues and when possible adjust algorithms for their own region. 8.4.2 Burned Areas Burned area product principles Burned areas are detected from remotely sensed data based on three main changes in surface properties following fire:
• Vegetation is removed. • Combustion residues are deposited. • During the day, the burned surface is hotter than surrounding vegetation, with a
maximum contrast in temperature occurring around mid-day. As the above changes remain for some time after burning, a ‘memory’ is held of the affected areas. This ‘memory’ is unavailable to active fire detection, but enables burned areas to be mapped during entire fire seasons using relatively few remotely sensed images (Eva and Lambin 1998). The main downside is that at present, burned area detection methods are generally less automated than active fire-based methods.
The basic burned area product is an image, which shows burned areas in a different colour to unburned areas. Burned area products are usually provided in a standard map projection, so that the geographic coordinates (e.g., latitude/longitude) of any pixel are easily obtained.

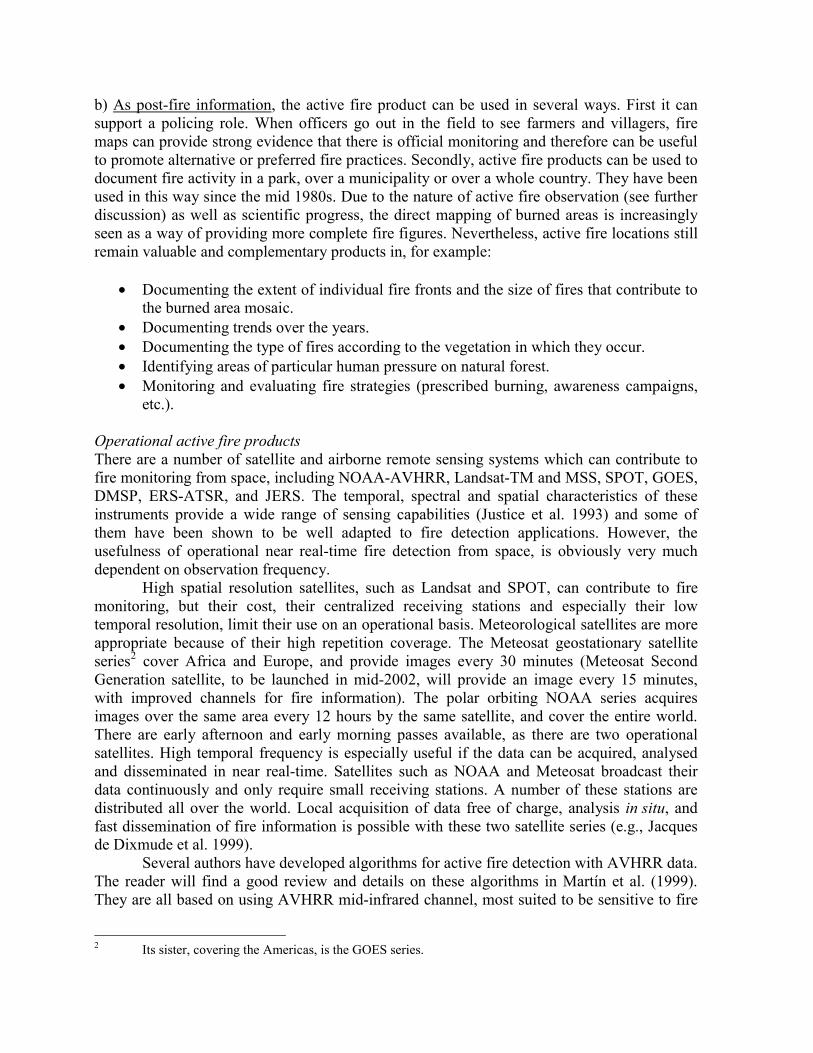
Burned area products in fire management Integrated into a Fire Management Information System, burned area products are useful at all stages of the fire management loop: Baseline Data Burned area products can provide important baseline information on fire regimes (i.e. frequency, season and intensity). Fire frequency maps are obtained by superimposing burned area maps for successive years. Seasonal fire maps are produced using a number of successive burned area products. Figure 8.7 shows a time series of burned area products for Caprivi, north east Namibia, which includes parts of Angola to the north, Botswana to the south, and Zambia to the west (Trigg et al. 1997). It was produced using NOAA AVHRR images acquired at regular intervals throughout the 1996 fire season. These images could be used to produce seasonal fire maps, by colour coding burned areas according to the time interval during which they were detected. The precision of seasonal fire maps (date-of-burn maps) is determined by the time interval between successive images.
Fire intensity and fire severity (i.e. the degree of vegetation change induced by fire) can often be inferred from the date and pattern of mapped burned areas. For example, homogenous burns occur late in the dry season and usually indicate high fireline intensity, whilst more patchy fires (early in the season) usually indicate lower fire intensities. Methods have also been developed to infer fire severity from the reflective properties of combustion residues (Jakubauskas et al. 1990; Thompson 1993). Figure 8.8(A) is an image of the Madikwe Game Reserve derived from Landsat TM images, and shows large, burned areas in shades of dark grey to black. A map of relative fire severity was derived from this image and is shown in Figure 8.8(B). Fire management Both the block and patch-mosaic fire management strategies of prescribed burning require accurate fire records to help plan ignitions (du Plessis 1997; Brockett et al. 2001; Parr and Brockett 1999). Burned area products are increasingly being used to provide this record (du Plessis 1997; Hetherington 1997, 1998). Mapping burned areas as the season progresses also allows areas that burn naturally to be incorporated into ignitions planning. Burned areas products can also be of value to fire suppression teams. For example, an undesired active fire may not require immediate suppression effort if it is burning towards a large area already mapped as recently burned. Monitoring and evaluation of management activities The products can also help to answer management evaluation questions such as: How well did management fire lines stop fires (i.e., by overlay of burned areas and fire lines)?; have management efforts reduced the areas that burn each year; or - more generally - how well are desired fire regimes realized?
By cross-referencing remotely-derived information on actual fire regimes with ecological information on desired fire regimes, it is possible to highlight areas where existing regimes are acceptable, or rather deviating, from the intention. This is a powerful tool for developing fire policies, modelling their outcomes and then formulating strategies, and for helping to direct fire management activities.

Refining Policy All the above are then used to refine fire management policies. Fire frequency maps can also help identify areas where high intensity fires are burning frequently, as foci for field visits to investigate the causes, and the fire effects.

18 April 1996
29 June 1996
23 August 1996
6 December 1996
0 50 150 200 km 50 N
Figure 8.7. Burned area products, showing the progressive accumulation of burned areas during the 1996 fire season in the Caprivi and Kavango regions, north-east Namibia, and surrounding areas. The products are based

on NOAA AVHRR images of the area, which were acquired at regular intervals throughout the fire season.
Figure 8.8. (A) An image of the area in and around Madikwe Game Reserve, made by applying multi-temporal principal components analysis to Landsat TM images, taken before and after a large part of the area burned in 1994. The burned area is clearly visible as a dark area surrounded by brighter unburned vegetation. (B) Map of relative fire severity in the burned areas apparent in the principal components image. In this landscape, soil type (see soil map inset) is the main determinant of patterns in vegetation communities, which is in turn coupled to their characteristic fire regimes through mutual feedback. Burned area products Figure 8.9 is a flow chart of the steps typically involved in preparing burned area products (although the flow may not be so linear). This procedure is important because one must chose the appropriate technique according to the product required. The steps are expanded below. 1. Specify format of the burned area products

It is first necessary to choose which burned area products are needed in order to provide information required by management. 2. Decide on appropriate scale of mapping Scale includes the dimensions of the area that is to be mapped, the level of detail (or spatial resolution) that is required, and how often the map needs to be updated, (i.e. the temporal resolution of the map). In Figure 8.7, the large area involved (145 000 km2) meant that small scale mapping was the only option. In Figure 8.8, the area is much smaller (604 km2), thus large scale mapping was attainable. The decision on the level of detail required for the map (spatial resolution) should be made carefully in relation to management needs. For example, block burning (du Plessis 1997; Stander et al. 1993) results in relatively large and homogeneous burned areas (Parr and Brockett 1999; Brockett et al. 2001). High detail is generally not crucial to map these adequately, and even AVHRR imagery (with a 1.1 x 1.1 km pixel size) can often yield more accurate results than the usual field-based method of driving block perimeters. An interpretation of a comparison between burned areas mapped using AVHRR and TM also found that AVHRR was mapping fires at the scale of the field mapping undertaken by section rangers in the Kruger National Park (Hetherington 1997, 1998). Data from sensors such as AVHRR (which can be accessed freely each day using a relatively low cost, PC-based receiver) and MODIS (data freely available over the Internet) become attractive choices. In contrast, fire that is prescribed using a patch mosaic system results, in numerous small but ecologically important burned areas (Parr and Brockett 1999). Higher detail is needed to resolve these accurately, so images from sensors, such as SPOT-HRVIR and Landsat-TM, are required. The downside is the much higher costs for covering smaller areas, which means that management will want to know the minimum number of images needed to map burned areas each season.
The regularity with which images need to be obtained depends on the product type and the temporal spacing of images required to ensure that burned areas are not missed. 3. Select suitable source of imagery Having weighed up the requirements of product format and scale, the image data source can be chosen. In making a choice, it is important to also confirm that this source will be adequately sensitive to the parameter of interest, perhaps via a pilot study or by conducting a literature review. It should also be remembered that, for monitoring purposes, it is important that scale is maintained. Hence budget constraints are very important considerations in making a final decision. 4. Decide on appropriate method for mapping burned areas Having chosen an appropriate data source, the accuracy of burned area mapping will depend on the method used. Burned areas contrast relatively weakly with unburned vegetation (compared to active fires), and so it is important to choose a robust method that is sensitive to changes caused by burning yet insensitive to changes from other sources of variation (Trigg and Flasse 2001). In general, burned areas that are smaller than the ground area covered by one image pixel cannot be detected.

Figure 8.9. Flow diagram showing the main steps and considerations in the preparation of burned area products. Burned areas are often obvious visually to an image interpreter because of the superior ability of the human mind, relative to current computer-based methods, in recognizing spatial patterns. Edwards et al. (1999) compared five burned area mapping techniques and found on-screen manual digitising to be more accurate than automated image processing techniques. However, the patchiness of burned areas makes manually digitising them very tedious and subjective. Further considerations of time, practicality, objectivity, and ability to repeat, make automated analysis techniques preferable for extracting burned areas from remotely sensed imagery. Most image processing techniques operate in the spectral domain, that is, they use differences in the amount of energy received from burned and unburned areas in the different spectral bands available, to discern between the two cover types. Visual interpretation uses both the spectral domain (manifested as variations in image brightness or colour) and the spatial domain (variations in pattern and texture). Multi-spectral imagery typically includes bands in the near- to thermal-infrared, which contain more spectral information indicative of
1. Choose format of burned area product, for example: - Dire frequency (annual maps post-fire) - Date-of-burn maps (multi-temporal maps during fire season) - Fire intensity - Fire severity
3. Select suitable source of imagery (SPOT HRVIR, Landsat TM, MODIS, SPOT VGT, AVHRR, etc.)
2. Decide on appropriate scale of mapping - Dimensions of area to be covered - Level of detail (spatial resolution) - How often (temporal resolution)
4. Decide on appropriate method for mapping burned areas and apply it to the imagery to produce the desired product.
18.0S 5

burned areas than the visible channels (Pereira and Setzer 1993; Pereira et al. 1999a; Trigg and Flasse 2000). For visual interpretation, any combination of three bands may be displayed for example using the red, green and blue colour guns of a computer screen, although no more than three bands may be displayed at once. On the other hand, there is no practical limit to the number of spectral bands that can be simultaneously processed by computer-based methods to detect burned areas.
Computer-based detection methods are usually based on identification of one or more of the physical changes mentioned in the introduction to this section:
• Methods sensitive to vegetation removal usually use Vegetation Indices (VIs – simple algebraic combinations of more than one band), whose values tend to decrease sharply after burning, providing a basis for detection. Historically, NDVI was the most commonly used VI for detecting burned areas, and it has been used on all fire-prone continents, although numerous inherent limitations have now been described. More recent VIs such as GEMI (and its variants) and atmospherically resistant VIs (ARVIs) are increasingly used in preference to NDVI (Pereira 1999; Miura et al. 1998). VIs are most useful for detecting burned areas if primarily photosynthesising vegetation burns (e.g., in pine and evergreen forests). However, in areas such as grassland, shrubland and deciduous woodland, widespread vegetation senescence can occur prior to burning, which can decrease the accuracy of VI-based detection (Trigg and Flasse 2000). Certain land management activities that alter vegetation abundance (e.g., tree felling) may also be mistaken for burning using VIs.
• Burned surfaces covered by char combustion residues usually appear much darker
than unburned vegetation, particularly in the near-infrared (NIR), providing a very good basis for detection (Trigg and Flasse 2000). However, this basis is short-lived in areas where char is removed rapidly by the wind and rain, making the burned area brighter and less distinguishable from unburned vegetation. Other cover types, such as water, may be indistinguishable from burned areas in the NIR, and so bands at other wavelengths are often needed to help resolve this confusion. NIR bands are less discriminating in areas where more efficient combustion results in bright ash residues that contrast less strongly with unburned vegetation.
• As one might expect, methods that detect burned areas as hot surfaces use bands in the
thermal infrared (TIR). While generally robust, thermal-based detection is not possible at times or in places where surface temperature exceeds the upper limit that can be measured by a particular sensor. For example, AVHRR band 3 images are useful for detecting burned areas, only as long as surface temperatures stay below around 51 degrees C, i.e. the highest measurable temperature. In Namibia, un-shaded surface temperatures usually exceed this limit around mid-day from August and October, rendering AVHRR band 3 images unusable. New sensors, such as MODIS, can measure much higher temperatures and so will avoid this problem of ‘saturation’. The utility of night-time thermal imagery is limited due to the poor thermal contrast between burned and unburned areas found at night. Another constraint is that smoke plumes present cool features that can conceal underlying burned areas at long-thermal infrared wavelengths.

In practice, burned area detection methods usually combine spectral bands to provide sensitivity to one or more of the fire-induced changes. Examples include multi-spectral image classification, principle components analysis (Hudak et al. 1998), and spectral indices designed specifically to detect burned areas (Trigg and Flasse 2000). Many of the available methods are reviewed in Pereira et al. (1999b) and Koutsias et al. (1999).
Detection methods can also be grouped depending on how many images they use. Single-image detection uses just one image, based on the assumption that all burned areas will be distinguishable in the spectral domain on this image. Although one image is quick and cheap to obtain and process, several other cover types, such as shaded slopes, water bodies, urban areas and bare soils may be indistinguishable from burned areas on imagery taken on a single date. Some of the confusion may be resolved by using spectral information from all of the available spectral bands in the image, sometimes in conjunction with sophisticated image transformation techniques (e.g. Koutsias et al. 1999).
Another approach, the multiple-image detection, is based on the assumption that a fire-affected area will appear spectrally different on a post-fire image compared to its appearance on an image taken before the fire. Due to the large changes caused by fire, methods that look for fire-induced changes between dates (“change detection” methods) usually detect burned areas more accurately than single-date methods (Thompson and Vink 1997; Hudak et al. 1998). For example, urban areas and bare soils can appear similar to burned areas on a single image, but will change little between image dates, in discernible contrast to most fire-induced changes.
Multiple-image methods, however, require stringent preparation of imagery. Images must be geographically registered to one another (“co-registered”) as accurately as possible to avoid “burned areas” appearing between dates that are really just due to inaccurate registration. Co-registration of images becomes less accurate with decreased spatial resolution. Images must also be radiometrically inter-comparable, i.e., the same band, band combination or index, from the same sensor, should be used for each image date.
Adjustments may also be necessary to normalize the sensitivity of each image prior to their comparison, to try to prevent changes in viewing geometry and atmospheric conditions between dates from generating spurious changes in pixel values that could be mistaken for burned areas (Viedma et al. 1997). Other disadvantages are that a minimum of two images per detection halves the chance of obtaining a cloud-free product and doubles the cost over single-image techniques. Other considerations relevant to all methods of detection Obscuration of burned areas Smoke is relatively opaque at visible wavelengths, can obscure burned areas at long-thermal infrared wavelengths, and has a small effect at NIR wavelengths, all of which can complicate burned area detection. However, at certain MIR wavelengths, even optically thick smoke plumes are transparent (Miura et al. 1998). MIR-based detection is therefore useful in areas where thick smoke is present for much of the burning season, as is the case over much of Africa.

Thick cloud obscures the surface at visible to thermal wavelengths and can confound remote detection of burned areas. This is a particular constraint when mapping large late dry-season fires, which can be obscured by cloud. In such cases, field mapping is still necessary.
Dense tree canopies can 'hide' fires that are burning in the grass-shrub layer below, as was noted in the Hluhluwe-Umfolozi Game Reserve (Thompson 1993). Post-fire regrowth and greenup Regrowth of vegetation following burning can also confound detection. This can be a major limitation in places where greening up begins within a few days of burning (e.g. in Côte d'Ivoire – Belward et al. 1993), or if pre-cured grass burns early in the season and has greened up before an image is obtained. This affected the accuracy of mapping of early season (pre-curing) fires in Pilanesberg National Park, South Africa in 1996 (Thompson and Vink 1997), with some small fires left detected using a multi-temporal approach.
Green up poses less of a constraint in areas where it is delayed until the onset of rains, as is the case over much of Namibia, parts of South Africa, and Botswana. Soil moisture High soil moisture levels and consequently patchy (low severity) fires can also confound detection in certain circumstances, e.g., Pilanesberg National Park in 1997 with late season rains (Thompson and Vink 1997). Wet soils can be much darker than dry soils, and may be misclassified as burned areas. Threshold variability Variations in viewing, atmospheric and surface conditions at different places and times, mean that it is not usually possible to use the same fixed numerical thresholds, to classify pixels as burned or unburned. Appropriate thresholds may be chosen using field validation data (but these are often lacking), by visual interpretation or using statistically based techniques. Visual determination is often superior to statistical methods, because it takes advantage of the superior pattern recognition ability of the human mind. For example, Salvador et al. (2000) attempted several objective techniques for detecting burned area thresholds, but found all to be inferior to visual assessment. Interactive methods, however, require the analyst to have a good knowledge of visual interpretation of burned areas from multi-band imagery. Research is ongoing to develop fully automated techniques, but it is likely that visual checking of burned area products will always be important. Assess map accuracy using reference data It is a good idea to check product accuracy by gathering a representative sample of independent reference data on burned and unburned areas, with which to validate the burned area product. Establishing map accuracy, gives decision makers confidence in using the remotely sensed products, and can identify areas where the mapping method needs further improvement. Congalton and Green (1999) provide a review of the main methods used to assess the accuracy of remotely sensed data. The upsides

Having discussed the pitfalls, it is important to state some of the upsides of burned area mapping using remote sensing. Existing semi-automated methods (e.g., Flasse 1999; Salvador et al. 2000), if chosen and applied with care, can rapidly and cheaply deliver products at sufficient accuracy for fire management. In fact, since it is only required to classify two classes (burned and unburned), product accuracy should routinely exceed, for example, the accuracy of remotely derived vegetation maps (since classification accuracy generally increases as the number of classes decreases [Sannier 1999]). Several studies have found remote mapping of burned areas to be much more accurate than ground-based mapping for capturing the patchy nature of burned areas - including the recording of unburned ‘islands’ within larger burns. For example, in the 48 000 ha Pilanesberg National Park, Thompson and Vink (1997) found that field maps overestimated by 8 500 ha (or approximately 17%) the actual area burned, resulting in an over-estimate of 39.5% compared with satellite-derived burned area maps. Paragraph 8.6 below will give example of use of burned area products in operational activities. 8.4.3 Vegetation Monitoring Vegetation products in fire management Vegetation monitoring provides important information for understanding fire behaviour, including ignition, growth and rate of spread (Cheney and Sullivan 1997), and is therefore crucial to help land managers optimise fire prevention and fighting activity. Preventive actions in the USA, Europe, Africa and Australia include the use of prescribed fires.
In grassland and savanna with seasonal drought, fires during the dry season are limited by grass fuel availability, and grass productivity is in turn a function of soil moisture availability from the preceding rainy season (Scholes and Walker 1993). Thus, fire frequency declines as precipitation declines through an indirect yet strong relationship. In forests, fuels accumulate over dekadal time scales, and fire frequencies are much lower, with fires occurring during episodic droughts. In grassland, savanna or forests, fire frequency and intensity depend on ignition sources, fuel characteristics (e.g., distribution, compaction, types, moisture content, accumulation and flammability (see Trollope 1992)), and the vegetation landscape mosaic (Christensen 1981). Shifts in fire frequency lead to changes in vegetation structure, which in turn modify the intensity of subsequent fires (Kilgore 1981).
The important vegetation characteristics to be taken into account in fire management are therefore: Fuel load (influencing fire intensity), moisture content (influencing both fire ignition and spread), continuity (influencing fire spread), and height (influencing height of flames and hence difficulty of suppression).
Fuel characteristics may be measured in the field, but such measurements only represent local conditions at a few locations. Remotely sensed data provide information at landscape, regional and global scales, and are therefore more useful for land managers. Vegetation monitoring systems Several different sensors currently on board Earth Observation System satellites are used to monitor vegetation in three different portions of the Electromagnetic (EM) spectrum.

1) Visible to Shortwave Infrared (0.40 - 2.50 µm, previously defined also as visible, NIR, SMIR and LMIR). Vegetation reflectance in this portion of the spectrum provides information on vegetation biophysical parameters such as chlorophyll, physiological structure and leaf cellular water content (Tucker 1980). Chlorophyll absorbs the red and blue elements of the EM spectrum; internal leaf structure makes vegetation highly reflective in the near-infrared and leaf cellular water absorbs radiation in the shortwave infrared. Satellite band combinations of different regions of the EM spectrum (also called Vegetation Indices) emphasise the spectral contrast between the different regions of the EM spectrum and allow hidden information to be retrieved. Vegetation indices are empirical formulae designed to produce quantitative measures, which often relate to vegetation biomass and condition (Gibson and Power 2000; Verstraete and Pinty 1996). The most commonly used vegetation index is the Normalized Difference Vegetation Index (NDVI),
( )( )redNIR
redNIRNDVI+−=
where NIR is the reflectance measured in the near infrared channel and red the reflectance measured in the red channel; the higher the NDVI value, the denser or healthier the green vegetation. Visible and near-infrared channels are available on most optical satellite sensors including NOAA-AVHRR, EOS-MODIS, SPOT-VEGETATION, SPOT-HRVIS, LANDSAT-TM, and LANDSAT-MSS. Other indices, such as the SAVI, TSAVI, ARVI, GEMI (see for example Flasse and Verstraete [1994], for more details), have been developed to identify the presence of vegetation and to be less affected by perturbing factors, such as soil colour and atmospheric contamination. To advance further the performance of such spectral indices, a method has now been proposed by Verstraete and Pinty (1996) to create optimised index for specific sensor characteristics. In any case it is important that users carefully choose the appropriate index to best respond to the requirement of their work.
Lidar is an active remote sensing system based on laser altimetry principles and operates in the near-infrared portion of the spectrum, where green vegetation is highly reflective. Lidar accurately measures tree heights and has been used to estimate forest canopy volume, which has been shown to be a good indicator of biomass and leaf area in high biomass forests of the U.S. Pacific Northwest (Lefsky et al. 1999b). No satellite lidar systems have yet been launched, but the Vegetation Canopy Lidar (VCL) satellite is currently being constructed. 2) Thermal Infrared (6.0 - 15.0 µm). Emittance in this portion of the EM spectrum provides information on the thermal properties of vegetation cover, such as sensible heat. Heat measured by satellite sensors is used to estimate evapotranspiration of vegetation canopies, which can be a good indicator of water stress (Moran et al. 1994). Thermal infrared bands are available on sensors such as NOAA-AVHRR, METEOSAT, and LANDSAT-TM. 3) Microwave (0.1 - 100 cm). Active and passive microwave approaches have been developed to sense soil water content, which can be highly relevant to vegetation monitoring (Du et al. 2000). Passive microwave sensors provide information on the thermal properties of water (Schmugge 1978). Passive sensor SSM/I is currently available on the Defense Meteorological Satellite Program (DMSP) platform. Active microwave sensors provide

information on the dielectric constant, which may be related to vegetation water content (Moghaddam and Saatchi 1999). Active sensors currently available include RADARSAT and ERS-2, and ENVISAT-ASAR from October 2001. Operational vegetation products The main vegetation products useful to fire management are: Fuel load: Estimation of biomass is performed using optical sensors. Biomass maps were derived in the grassland regions of Etosha National Park, Namibia, using NDVI computed from NOAA-AVHRR images (Sannier et al. 2002). Similarly, Rasmussen (1998) estimated net primary production in Senegal. However, these studies are spatially limited and more work is required on refining the relationship between biomass and the NDVI for different vegetation communities. Lidar data may one day prove useful for measuring and monitoring forest biomass, but are still mostly unavailable. Vegetation moisture content: Operational estimation of vegetation water content is performed using optical and thermal infrared sensors. The use of radar sensors to monitor vegetation water content requires further research before it will be operational (e.g. Moghaddam and Saatchi 1999). Three methods are used to estimate vegetation water content. The first method uses the Normalized Difference Vegetation Index (NDVI) to estimate live vegetation chlorophyll and moisture content (Burgan 1996). The NDVI is used to compute a Relative Greenness Index (RGI), which is incorporated with weather data to define a Fire Potential Index (FPI) (Burgan et al. 1998). The FPI is computed for assessing forest fire hazards in the Mediterranean climate region of southern California (USA) (http://edcsnw3.cr.usgs.gov/ip/firefeature/firepaper.htm).
Similarly, the Fire Potential Index has been adopted by the Natural Hazards project of the Space Application Institute, Joint Research Centre (Ispra, Italy), to evaluate forest fire risks in Europe (http://natural-hazards.aris.sai.jrc.it/fires/risk/). However, Ceccato et al. (2001a) recently showed that the relationship between degree of curing and vegetation moisture content is not applicable to all types of vegetation.
The second method estimates the moisture content through the measurement of evapotranspiration, an indicator of vegetation condition. Evapotranspiration, as measured by thermal sensors, may be estimated with several indices: the Crop-Water Stress Index (CWSI) (Jackson et al. 1981), the Stress Index (SI) (Vidal et al. 1994), and the Water Deficit Index (WDI) (Moran et al. 1994). However, it has been shown that many species may reduce evapotranspiration without experiencing a reduction of water content (Ceccato et al. 2001a).
The third method is based on direct measurement of vegetation water content and uses the absorption property of water in the shortwave infrared (spectrum between 1.13 µm and 2.50 µm). Using a combination of the shortwave infrared and infrared wavelengths from SPOT-VEGETATION, a Global Vegetation Moisture Index has been created to measure directly vegetation water content (Ceccato et al. 2001b). This method is currently being tested for fire management applications (Ceccato et al. 2001c).

Vegetation continuity and density: High-resolution satellites are needed to characterize the spatial structure of the vegetation canopy. Hudak and Wessman (2001) have shown that a textural index of high-resolution imagery serves as an accurate indicator of woody plant density in semi-arid savanna. Vegetation height: Estimation of vegetation height is still at a research stage. Synthetic Aperture Radar (SAR) studies are being developed to estimate vegetation height (Sarabandi 1997) but are not yet operational. Lidar provides direct, accurate measurements of canopy height but are currently limited in spatial extent and availability (Lefsky et al. 1999a). 8.4.4 Rainfall Estimation Derivation of Rainfall Estimates Rainfall is normally measured using rain gauges. However, the network of rain gauges may be sparse in those areas affected by fire. Satellite observations are used in combination with, and to augment, rain gauge data. Satellite data provide a spatially complete, uniformly distributed coverage that allows better estimation of rainfall where rain gauges are infrequently and irregularly sited.
Meteorological satellites in geo-stationary orbit (i.e., an orbit where the satellite appears fixed at the same point in the sky) are able to collect images of a large area frequently. For example, the Meteosat satellite collects an image of the whole of Africa and Europe every thirty minutes. Similar satellites are available for other parts of the Earth. The frequency of images collected by these satellites is important, as it allows rain clouds to be located and tracked, which is vital data for producing accurate rainfall estimations. Data from polar orbiting satellites (which move across the sky) can be used to estimate rainfall (e.g., using passive microwave data) but these data are available much less frequently for each location on the ground.
Geo-stationary satellite rainfall measurements are particularly appropriate for areas where rainfall comes mainly from convective clouds. Convective clouds are formed when small warm lumps of air (called thermals) rise up to produce clouds. On meteorological satellite images these clouds appear firstly as small and round and, as they grow, become colder. They cool down as they rise and thicken into storm clouds. The temperature of the cloud top can easily be measured (both day and night) using the thermal infrared waveband data. It is possible to predict whether particular clouds will produce rainfall because the colder (and thicker) the cloud, the more likely it is that rain will fall. The duration of the cold cloud in any particular location can be measured quite precisely as images are available so frequently. A simple linear relationship between cold-cloud-duration (CCD) and the amount of rain produced is used as the basis for a first indication of the quantity of rainfall. Local rain gauge data is used to calibrate the rainfall estimation for each location. This technique is called the cold cloud precipitation method.
The cold cloud precipitation method does not work so well for estimating rainfall from other types of cloud. For example, layer (stratiform) clouds form when air rises consistently, either by night-time cooling, or by clouds associated with weather fronts. For these types of clouds the relationship with rainfall is more complicated. Hence cold cloud precipitation

method of rainfall estimation works well in the tropics where most of the cloud is convective, but less well in mid and high latitudes, where other types of cloud are dominant.
The rainfall estimations are usually built up over a period of approximately ten days, called a “dekad” (this is a standard reporting period for meteorological data). There are three dekads in each calendar month. The first dekad of each month begins on the 1st; the second dekad begins on the 11th and the third dekad begins on the 21st (and hence will vary in length depending on the particular month). Figure 8.10 provides an illustration of dekadal CCD.
Figure 8.10. Example of a Dekadal Cold Cloud Duration (CCD) image (one slot equates to 30 minutes).
Sources of Rainfall Estimates The TAMSAT (Tropical Applications of Meteorology using SATellite and other data) group, at the University of Reading (UK), researches the use of satellite imagery for estimating rainfall. More details of the cold cloud precipitation method and how it can be applied, is given in Milford et al. (1996). They have produced a Rainfall Estimation Workbook (Grimes et al. 1998) to introduce practical rainfall estimation techniques. An extensive list of publications and the latest on-line dekadal rainfall estimate is provided on their website at http://www.met.rdg.ac.uk/tamsat/.

The United States Agency for International Development (USAID) Famine Early Warning System (FEWS) produces estimates of accumulated rainfall to assist in drought monitoring efforts in sub-Saharan Africa. Their methodology is based on the cold cloud precipitation method, but incorporates some other data where they deal better with non-convective rainfall (Xie and Arkin 1997; Herman et al., web publication). They use numerical models to produce wind and relative humidity information and take into account the contribution of orographic rainfall (where different rainfall patterns are produced by the structure of the terrain). Satellite passive microwave rainfall estimations are also incorporated.
FEWS rainfall estimation (RFE) data, including daily, dekadal and historical archives, are available for sub-Saharan Africa from the Africa Data Dissemination Service (ADDS) website at http://edcintl.cr.usgs.gov/adds/adds.html.
ADDS also hosts other data sets, including satellite-derived dekadal vegetation information, agricultural statistics and digital map data. Rainfall charts can be viewed on-line or downloaded. Software to store, analyse and display rainfall data can also be downloaded. Rainfall Data in Fire Information Systems Rainfall estimations can be produced for finely gridded areas, e.g., 5 x 5 km areas, but are often used as summaries over political or physical regions, for example, countries or catchments. Statistics can include total, mean and standard deviation of rainfall in millimetres, area of rainfall coverage within a region, etc. The rainfall data can be combined with other data to produce further information, for example, hydrological modelling or a fire information system.
Rainfall maps can be used to inform management, for example, recent rainfall could to be taken into account when deciding the timing of prescribed burns (Carlson 2001).
Rainfall estimation can also be integrated with other data, for example, as an input to fire risk assessment (Aguado et al. 2001). The rainfall information is incorporated in estimation of vegetation moisture content, which can then be combined with fuel data for assessing fire risk. 8.5 Implementing Remote Sensing in a Fire Management Context This section looks briefly at some of the resources typically required to run a small remote sensing component to contribute to fire management. Data produced by any remote sensing activities should then be integrated into a Fire Management Information System so that, through the combination of data from various sources, more information can be extracted to better support management decision-making.
A range of situations could occur, and some fire management teams may have access to their own remote sensing group or government-run remote sensing resources. Many others may find some existing local expertise in remote sensing, e.g., a local consultancy, scientific institute or university, who could assist in the setting up of a remote sensing group, provide training or even be contracted to do the work. Alternatively an in-house specialism could be developed.
It is important to have a general idea of what is wanted out of any remote sensing endeavours, so that sensible levels of resources can be allocated to achieve the desired outputs. A remote sensing expert should work with management to identify areas where

remote sensing can contribute and help design an overall remote sensing strategy. The following are some considerations for those who want to set up and run a remote sensing component for fire monitoring and management. Skilled personnel The person running the component should have a combination of remote sensing skills and field experience (perhaps in fire or vegetation ecology), or at least demonstrated aptitude and a willingness to learn new skills. He or she should have some input to design of a remote sensing strategy, decide which imagery will be used to obtain the information, and how often, and choose and implement the methods to extract information. The person should make every effort to assure quality control at all stages, including assessing the accuracy of final products wherever possible.
Once procedures are in place for preparing operational products, there will be routine image processing and data input tasks to complete. These tasks are essential to maintain a Fire Management Information System and allow use of the latest information. It is also important to have a person around who completely understands how the information system operates and can draw awareness to and help users to exploit the potential of the system. These functions are best served in-house. Hence, the most appropriate person may be someone with local knowledge of fire conditions, and the required outputs of a fire management information system. Most computer literate staff can be trained to maintain an information system. Access to relevant information Staff should ideally have access to publications on remote sensing, land mapping, fire ecology and other relevant information. Easy access to up-to-date literature is especially helpful in selecting appropriate methods to deliver particular information products and in avoiding common mistakes. Collaborative research with local and international scientific institutions can also help in product development. Infrastructure For in-house remote sensing clearly office space is required, and adequate remote sensing hardware and software must be acquired. Image processing and Geographic Information System (GIS) tools allow a fire information system to be built up with the objective of supporting operational fire management.
Computer hardware will typically include at least one Personal Computer with a high-speed processor, large hard disk and lots of memory. A large monitor is also useful, allowing images to be seen in reasonable detail without the need for excessive zooming. There will also be data archiving and retrieval capacity, e.g. CD read/writers are currently a very attractive option, since most receiving stations now provide remotely sensed images on CD, and due to the low costs for this media. A colour printer is essential for the presentation of the various products, while a Global Positioning System receiver can be very useful in collecting accurately located field data for plotting on geo-referenced images. A digitising table is also useful so that information held on topographic and other paper maps can be integrated with remotely sensed images and other data in a GIS.
Image processing software provides the tools required to pre-process imagery into usable form (e.g., to correct and calibrate raw imagery and transform it to a standard map projection) and to develop and apply algorithms to process data into information products.

They also have sophisticated tools for investigating, displaying and enhancing the appearance of imagery.
GIS software is also required for a sophisticated information system that allows integrated analysis of many layers of spatially registered information. GIS tools can allow remotely sensed products to be analysed in the context of any other geo-located information held by management, such as maps of infrastructure, administrative boundaries, planned ignition points, fire history and maps made in the field (e.g. vegetation type, fire severity etc.). Spatial models can be built up through the arithmetical combination of information in the different layers. For example, fire danger might be estimated by combining remotely sensed indicators of vegetation state and standing biomass with maps of roads and population centres and synoptic meteorological data. Adequate Budget to Maintain the Information System As well as personnel and initial set up costs for hardware and software, the budget should include allocations for recurrent expenses, such as image data costs and additional data acquisition. Maintenance and upgrade costs for hardware and software, and replacement of consumables, must be considered too. Fieldwork is necessary to validate remote sensing outputs, so a budget for transport (and maybe equipment) should be available. It should be remembered that, for monitoring purposes, it is important to maintain the scale of data and the frequency of acquisition, so that quality and consistency of information products are maintained. Hence, budget constraints are very important in developing an operational remote sensing strategy. 8.6 Examples of Application of Remote Sensing Products in Fire Management in
Africa 8.6.1 South Africa The use of remote sensing technologies for fire management in South Africa can be divided into three basic application areas, namely post-event burned area mapping (including associated fire intensity / severity analysis), active fire monitoring, and biomass estimation (in terms of fuel loads and potential fire risk assessment), and are primarily concerned with the fire-prone savanna, grassland and fynbos biomes.
Post-event burned area mapping is arguably the most common application area, and has generally been conducted as a parallel research orientated activity, in support of more operational, traditional field-based mapping. Many of the larger protected areas in the savanna biome have tested this kind of image-based fire mapping, with a fair degree of success, e.g. Kruger National Park (Hetherington 1997, 1998), Pilanesberg National Park (Thompson and Vink 1997), Madikwe Game Reserve (Hudak et al. 1998), Mkuze Game Reserve and Hluhluwe-Umfolozi Game Reserve (Thompson 1990, 1993).
Of key significance in many of these projects has been the obvious improvement in the accuracy of individual burn area delineation, and the identification of small isolated non-burned “islands” that are often missed during more generalized field-mapping. For example, field-mapped estimates of total fire extent differed from image derived estimates by 50.4 %, equivalent to 4 252 ha (4.5 % of total reserve area) in a study completed by Thompson (1990,

1993) in Hluhluwe-Umfolozi Game Reserve (although it was noted at the time that under tree canopy fire scar extents were difficult to define on the imagery). Similar results have been reported for studies in Pilanesberg National Park, were field maps over-estimated the total burned area by 8 500 ha (or 17% of the total reserve area - Thompson and Vink 1977). In this case field estimates were 39.5% higher than the satellite-derived estimate. In general, these historical fire-mapping exercises have used high resolution Landsat or SPOT multispectral imagery, for detailed mapping at scales in the order of 1:50 000 – 1:75 000.
Image classification problems tend to arise, as would be expected, when the image acquisition date is significantly different from the burn event date, especially if post-fire regrowth, or green-up of the vegetation has occurred in the interim period. Additional classification problems can also be experienced if the prevailing environmental conditions at the time of the burn did not result in a clean burn with a clearly definable extent. The compilation of end-of-fire season fire scar maps for the Pilanesberg National Park for the past several years has indicated that no single image processing technique or algorithm is optimal for all conditions (especially if it is necessary to use sub-optimal imagery in terms of acquisition date in relation to actual fire event or precipitation patterns). Rather a range of data processing techniques are necessary to cover all possible conditions. For example, post-event fire scar mapping for the years 1994 – 2000 in Pilanesberg has involved the use of both single and multi-date imagery, derived indices, simple level slicing, isodata clustering models, and principal component analysis to map fire scars. In most cases, this has been based on Landsat Thematic Mapper imagery (bands 3,4,5,7), or closest SPOT equivalents.
Research has been conducted in terms of fire severity and intensity mapping using near-real time imagery, linked to internal fire scar characteristics. A key area of activity being studies linked to South Africa’s contribution to the international SAFARI 2000 initiative. This has primarily involved the assessment of products derived from EOS-MODIS3, within the context of park fire management activities and the development of automated fire monitoring systems. Case studies are currently being conducted in both Kruger National Park and Madikwe Game Reserve, where to date over 80 fuel measurements involving prescribed burns have been recorded. The MODIS fire algorithms can be transitioned into an operational monitoring system to render accurate and timely information on the location, spatial distribution, intensity and timing of fires in South African conservation areas. These findings could support park management objectives that monitor and modify long-term fire management programmes in relevance to fire regimes.
This study involves validating MODIS burn scar data on a near-real time basis using co-located Landsat 7 ETM 30 m resolution fire maps, combined with field data on combustion intensity and completeness. Within the 2000 SAFARI field campaign, grey scale ash colour, biomass observations and field spectrometer recordings (using a hand held ASD radiometer) of burn scars were sampled, since ash colour is postulated as being a retrospective measurement of fire intensity (Stronach and McNaughton 1989).
3 In February 2000 Terra-AM, the flagship platform of NASA's Earth Observing System (EOS), began collecting what will ultimately become part of a new 18 year data set (Kaufman et al. 1998). The MODerate resolution Imaging Spectroradiometer (MODIS) onboard TERRA senses the earth's surface in 36 spectral bands and can provide daily coverage of South Africa at a nadir resolution of 250 m and 500 m in the visible to near-IR and 1 km resolution in the thermal spectral range.

Figure 8.11. NASA ER-2 aircraft image of a prescribed SAFARI fire over the Timbavati Reserve. Higher confidences on the position of the flaming front and fire emission factors can be determined from ER-2 MODIS simulator data at a resolution of 50 m. Fire ground variables such as flame

height, climate parameters and rate of spread are measured coinciding with TERRA and ER-2 overpasses.
Post-fire burned area mapping in the fynbos biome is somewhat different from that in the savannah (or grassland) biome, since individual fire scars in fynbos can remain visible for many seasons after the actual fire event, due to the slow regeneration of the local vegetation. Such conditions can make the temporal separation of both inter and intra-year fire scars problematical, although Thompson (1990, 1993) reported that the use of within-scar NDVI difference was successful for age and sequence determination of historical fire scars in this area.
Satellite imagery received a major boost locally as an operational tool during the Dec 1999 – Jan 2000 wildfires in the Western Cape, which burnt vast tracts of mountain and coastal fynbos communities on the Cape Peninsular and West Coast. During this period a series of SPOT images was specially acquired to provide near-daily coverage of the fires and their rate of spread in, often inaccessible, mountains. Although this information was not used for true real-time fire management activities, it proved a useful tool for public-level media instruction as well as post-event, disaster management assistance and planning.
Biomass monitoring is a key component of pre-fire risk assessment. Several case study examples illustrate the potential of remote sensing for this application, although as with post-fire mapping, these are primarily research rather than operational level studies. Studies in both the Hluhulwe-Umfolozi Game Reserve and Drakensberg mountains have indicated that pre-fire season predictions of potential fuel loads (tones / ha) can be achieved with a high degree of accuracy (i.e. r2 ≈ 0.8) in both savanna and grassland areas using Landsat and SPOT equivalent data. These are typically based end-of growing season NDVI-based biomass models, which have been calibrated with actual field-derived biomass data (Thompson 1990, 1993; Everson and Thompson 1993).
More recently a similar research project looked at using coarser resolution 1 x 1 km SPOT VEGETATION NDVI products for determining end-of growing season fire risk along power transmission lines on a national basis, since wildfire combustion effects can result in transmission interrupts in some instances (Thompson and Vink 2001).
Near-real time monitoring of local fire events is starting to become established as a viable technique at both local and national scales. For example, since November 2000 the ARC-ISCW4 has been part of the World Fire Web (WFW), participating as the Southern Africa node. WFW is a global network of computers that detect active fires using daily NOAA-AVHRR satellite data. The network is co-ordinated by the European Union’s Joint Research Centre (EU-JRC) in Ispra, Italy. The input data are daily NOAA-14 AVHRR afternoon passes (Ahern et al. 2000). Daily fire maps are compiled at each regional node and then made available in near real-time on the World Wide Web (WWW)5. The fire information can be downloaded in a text format giving latitude and longitude of each 1 km AVHRR pixel
4 Agricultural Research Council: Institute for Soil, Climate and Water. ARC-ISCW (Pretoria), houses a fully calibrated NOAA-AVHRR 1 km data set for Africa south of the equator with data from July 1984. Such an archive is ideally suited to the development of long-term fire frequency models for the region, and can contribute to the sustainable management of ecosystems as well as for global carbon management. 5 see http://ptah.gvm.sai.jrc.it/wfw/ or http://www.arc-Iscw.agric.za/main/fireweb/index.htm

50 0 50 100 150 200 250 kilometres
E
Kh
Oma
Otj K
Omu O
Ka
Oha
Osh C
KaCOmuOtjOshOmaOKhOhaKE
KavangoCapriviOmusatiOtjozondjupOshikotoOmahekeOshanaKhomasOhangwenKuneneErongo
Key to region names
N
Colour codes
Early burn (1/5 - 30/6)Mid-season burn(1/7 - 31/8)Late burn (1/9 - 31/12)
detected that contains a fire on that day. Improvements to the software will enable NOAA-16 imagery to be processed. 8.6.2 Namibia Introduction Namibia lies in the west of Southern Africa, bordering Botswana and South Africa to the east and south, the Atlantic Ocean to the west, and covers an area of approximately 824,000 km2.
Large areas burn each year. Almost 5 million hectares burned in 2000, whilst in years of lower rainfall this figure is significantly lower (le Roux 2001). Excessive indiscriminate burning is having highly negative effects on some ecosystems, whilst in other areas, fire frequencies are more in equilibrium with requirements for long-term stability of existing vegetation communities (Goldammer 1998).
Fires burn during Namibia’s severe dry season from April to October, mainly as surface fires that spread in the grass and shrub layer. Crown and ground fires occur over only limited geographical areas. The amount and connectivity of surface fuel is highly variable spatially and temporally, controlled by a severe rainfall gradient orientated in an approximately SW to NE direction. The most frequent, intense and extensive fires occur in the north and northeast, whilst fires occur infrequently in the south and west. Figure 8.12 shows a burned area map of the fire-prone areas of Namibia (derived from remote sensing) and demonstrates the general increase in the size and extent of burned areas from SW to NE.
Lightning ignited fire is the most significant natural cause, but accounts for only a small percentage of all fires. The majority of fires are anthropogenic, either set deliberately or accidentally (Goldammer 1998).

1
2
3
4 5
6
Figure 8.12. Fires in Northern Namibia, for the 1997-burning season, colour coded according to approximate date of burn.
Fire management issues in Namibia Figure 8.6.2b shows the six fire regime zones of Namibia (Trigg and le Roux 2001), as a framework for describing fire management issues in Namibia.
In zones 1 and 2, low rainfall means that fires occur only rarely, have low intensity and relatively insignificant impacts.
In zones 3 and 5, widespread pastoralism means that fires are generally not desired because they result in a loss of forage. Fires are suppressed by farmers' associations in zone 3 whenever possible, and occasionally by local communities supported by the Ministry of Agriculture in zone 5. In the Etosha National Park (zone 4), fire is managed by the Directorate of Resource Management (DRM) of the Ministry of Environment and Tourism (MET), using a park block burning programme intended to maintain or improve biodiversity (Stander et al. 1993; du Plessis 1998).
In areas of Kavango and Caprivi in the east of zone 6, very frequent fires pose a serious threat to large areas of wooded and forested land (Mendelsohn and Roberts 1997). In East Caprivi, communities were mobilized by the Directorate of Forestry (MET), with support from FINNIDA, to clear fire lines to retard fire spread and frequency in wooded and forested areas. In some areas, fire plays a more positive role, for instance in the regeneration of grasses used for thatching. Guidelines on burning are being prepared which recognize the need burn in some areas and to exclude fire in others (Trollope and Trollope 1999).
Figure 8.13. Six major fire regime zones of Namibia Fire information and management Fire statistics are not yet compiled or aggregated at a national level, and resources for obtaining them in the field are limited. The most comprehensive surveys of active fires and areas burned have been made using image data from the Advanced Very High Resolution Radiometer (AVHRR) sensor onboard the US NOAA (National Oceanic and Atmospheric Administration) satellite series, as indicated in Cracknell (1997). The AVHRR data are provided by a PC-based receiver, installed at the Etosha Ecological Institute (EEI-within zone 4) and run by Park management. Remotely sensed products and their uses Policy Level AVHRR-based maps showing the distribution and approximate timing of burned areas over the fire-prone areas of Namibia (e.g., Figure 8.12) have been incorporated into Environmental Profiles of the Caprivi and North Central regions. These documents are designed to place environmental information into the hands of politicians and other decision-makers (Mendelsohn and Roberts 1997; Mendelsohn et al. 2000). AVHRR-based maps have also been included in the latest fire policy document for Namibia (Goldammer 1999), to show the distribution of burning. AVHRR data were also integrated with maps of vegetation and land use to stratify Namibia into different fire regime zones. Fire frequency was then estimated from AVHRR imagery for the three most fire-prone fire regime zones (Trigg 1997; le Roux 2001). Figures 8.14 and 8.15 show that fire frequency is much higher in Zone 6 (Kavango and Caprivi) than elsewhere in the country, with the majority of Caprivi burning two to four times in just a four-year period (compare Figure 8.15[a] and Figure 8.15 [b]). Extensive areas of wooded and forested land in Caprivi and Kavango are particularly under threat from such frequent fire (Jurvélius, pers. com. 1998) These remote studies help to identify areas where fire frequency is too high for the intended land use, for refining fire policy and management strategies.
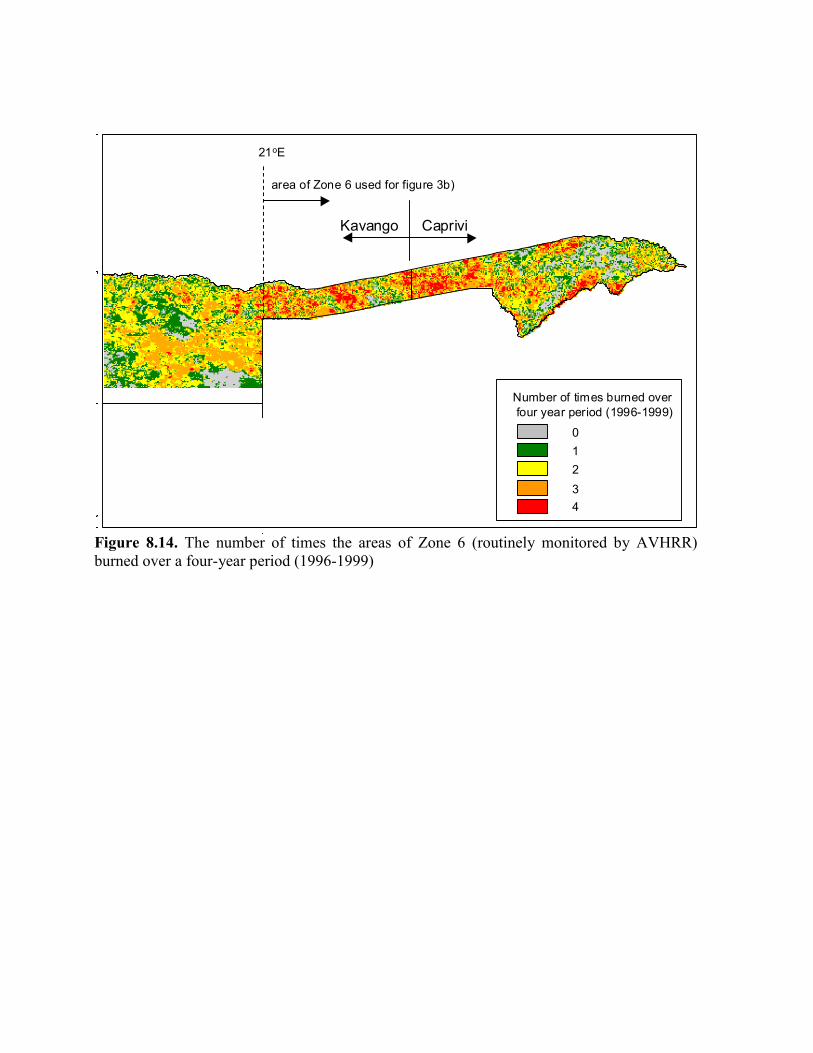
CapriviKavango
Number of times burned over four year period (1996-1999)
01234
area of Zone 6 used for figure 3b)
21oE
Figure 8.14. The number of times the areas of Zone 6 (routinely monitored by AVHRR) burned over a four-year period (1996-1999)

0
20
40
60
80
100
0 1 2 3 4 5
0
20
40
60
80
100
0 1 2 3 4
a) Zone 5
b) Zone 6 (East of 21oE)
Number of times burned
Number of times burned
Per
cent
age
of z
one
area
P
erce
ntag
e of
zon
e ar
ea
Figure 8.15. Percentage of land that has burned a different numbers of times within a set number of years: (a) shows the percentage of Zone 5 that burned between 0 and five times during a five year period (1994-1998); (b) shows the percentage of Zone 6 (east of 21oE) that burned between 0 and four times during a four year period (1996-1999).
Management Level • Etosha Ecological Institute (EEI) Active fires are usually visually interpreted from AVHRR channel 3 imagery within minutes of the satellite passing overhead, and their centre coordinates noted. This method has identified several undesired fires prior to their detection by management staff in the field, for more timely response.
Implementation of a block-burning programme requires mapping of all areas that burn within the park each year. During the 16 years of prescribed burning prior to the routine availability of AVHRR-based burned area products, this was done by either driving block perimeters, or by sketching extents onto a base map from airborne observations. These methods were regarded as reasonably accurate for large, cleanly burned blocks, but inaccurate for heterogeneously burned blocks containing large islands of unburned vegetation. These methods of mapping burned areas also required a lot of time and resources. Since 1996, AVHRR data have enabled burned areas to be mapped, in many cases more accurately, and

with significantly less expenditure compared to field-based methods. Using a simple change detection technique, it now takes about two hours per month to map burned areas over the park and adjacent areas.
To plan new ignitions, requires standing biomass to be estimated for each burn block, information that is very difficult to obtain for large areas using field-based methods alone. An AVHRR-derived image of the maximum NDVI attained at each pixel location during the previous growing season is used to identify candidate blocks with sufficient biomass for burning during the next dry season. The biomass of one or more candidate block is then surveyed using a disc pasture meter to assist the final selection. • Caprivi As part of their evaluation of the success of the community-based fire control project, the Directorate of Forestry (DoF) wanted to assess the impact of fire lines (cut by local communities) in reducing the annual area of burn in East Caprivi. An AVHRR-based study was commissioned and found that less of the area had burned in the years since the onset of fire-line construction, supporting the assertion that the fire control efforts had been worthwhile (Trigg 1997). Burned area maps were also used in public awareness campaigns designed to educate people about the detrimental effects of very frequent fire. Research and Development Ongoing research at EEI and in Caprivi (Trigg and Flasse 2000, 2001), is aiming to quantify and improve the accuracy of the remote sensing of burned areas in Namibia. Combined, these studies involve the use of field and Landsat TM-based surveys to assemble accurate reference data on burned areas. The various reference data are then used to assess the accuracy of existing burned area products from AVHRR and to develop new algorithms to detect burned areas using data from other sensors such as SPOT VEGETATION and MODIS (launched December 1999). 8.6.3 Botswana Botswana's terrain consists almost entirely of a broad, flat, arid subtropical plateau, though there are hills in the eastern part of the country. In the north-west, the Okavango River runs into the Kalahari sands. The Chobe National Park is a beautiful grassland reserve, popular for its abundant elephant population. The Kalahari Desert, a varied environment of sand, savanna, and grassland, covers large parts of the country. This is an important wildlife area, in which Botswana's two largest conservation areas, the Central Kalahari Game Reserve, and the Kgalagadi Transfrontier Park (including the Gemsbok National Park in Botswana, and the Kalahari Gemsbuck National Park in South Africa), are located. The country has a sub tropical climate arid in the south-west. Maximum daily temperatures vary from 23-32° C. During the winter months, May to September, there are occasional overnight frosts. The majority of the rain falls in the north and the east, almost all in summer between October and April. The fire issues in Botswana Fire is a natural occurrence in Botswana. The vegetation types and ecosystems across most of the country have evolved, with fire as a major shaping force. With the correct frequency,

timing and extent of burning, fires can have many positive effects including maximizing range productivity, promoting species diversity and controlling bush encroachment. Many rangeland vegetation types actually require a combination of fires, grazing or browsing to maintain species diversity and productivity.
However, too often, fire seems to be used inappropriately, or to get out of control, resulting in undesired effects. Fire monitoring has shown that large areas of Botswana burn every year with an average of 8-15% (48-90,000 km2) of the country affected each year. These large and frequent wildfires cause damage to property and threaten lives, damage forest, reduce grazing availability, change vegetation ecology, increase the impact of drought, increase soil erosion and land degradation and cause increased wildlife and livestock mortality.
The management and control of bush fires in Botswana is a critical issue for the sustainable development of the livestock, forestry and wildlife sectors. Fire is already extensively used as a range management tool throughout the southern African region for maximizing rangeland productivity. The Ministry of Agriculture and other government departments have recently put fire management as a priority on their agenda and are developing policies to improve knowledge on the potential problem and strategies to tackle the issues. It is recognized that many issues need to be addressed, such as improving knowledge on fire and wildland ecology, knowledge on the socio-economic causes and consequences of fires, and community education on fire management. Fire information and management In Botswana, the Agricultural Resources Board (part of the Ministry of Agriculture) has overall responsibility for fire management. Information is typically required at two levels: (a) on an operational basis (mostly active fires and vegetation status) to react to actual conditions and act appropriately, and (b) to document the situation. The latter is used to improve knowledge of the potential problem, to assist strategic decision-making, and eventually to assist in evaluating the effectiveness of actions. Good archives are essential to monitor trends and evolution of fires and burned areas. While there are mechanisms for fire reporting in Botswana, the documentation of fire events is incomplete. For example, when vehicles are available, the extent of burned areas is estimated by driving around them. This operation is time consuming and can be highly inaccurate due to the heterogeneity of the burned areas.
Countries as large as Botswana, that contain extensive areas of fire-prone rangeland, could not justify the expenditure needed to install and maintain observational networks for collecting fire information regularly at a national level (over the entire territory). This is where remote sensing data such as NOAA-AVHRR can be used as a substitute to fill in gaps where data are not available, or at least to prioritise action where resources are limited.
While the Government of Botswana intends to improve strategies on fire management nationally, current resources are limited. When undesired active fires are discovered in the field in time, village resources are combined with any available district resources, to combat the fire. However, most effort is put in to prevention, such as the establishment and maintenance of firebreaks. There are currently 6 000 km of firebreaks in Botswana, which require regular maintenance to be effective, and there are plans to bring the extent of the network up to 10 000 km. NOAA-AVHRR products and their uses

The Government of Botswana, through the Department of Meteorological Services (DMS), requested the UK-Department for International Development’s assistance in developing the capacity to access and utilize data from satellite remote sensing in order to complement the monitoring of weather, climate, vegetation and fires. With a PC-based NOAA receiver, maintained and run by local staff, DMS has been monitoring vegetation status and burned areas since 1996, working closely with the Botswana Rangeland Inventory Monitoring Project. They then feed the information to decision-makers in the Agricultural Resources Board and Inter Ministerial Drought Committee.
While the data are potentially very useful, it takes time and iterations of the products that are delivered for product-users to appreciate the potential and product-developers to meet decision-makers requirements.
Vegetation status maps, as designed by Sannier et al. (1998), have been used operationally by the drought committee for the early identification of problem areas. The usefulness of fire information from NOAA-AVHRR was not directly perceived. Initial burned area maps attracted attention of decision-makers. Obtained by visual analysis and digitisation on the screen, their production was time consuming and the results missed most small burned areas. Demand arose for an operational approach to automatically detect burned areas from the AVHRR data acquired daily. Current knowledge in burned area detection was applied to create an operational prototype to produce maps automatically (Flasse 1999). While providing very sensible results (Figure 8.16), additional issues rose, underlying the complexity of automated burned area detection from AVHRR data.
As complete daily coverage of Botswana is available, burned area products can be produced, using the region and frequency that best suit users' requirements. For example, daily data are sometimes used to monitor evolution of large fires lasting several days, while monthly synthesis are used by the Central Statistics Department of the Ministry of Finance. Perhaps of greater importance is the accumulation of data on burned areas over a number of years, particularly for monitoring the frequency of fire occurrence (Figure 8.17). This is of value to range land management because of the strong link between the frequency and impact of fire. It is also an important indicator to contribute to risk assessment of fire occurrence. In addition, firebreaks will be maintained with priority in areas where fuel load is not reduced by fires in the past years.
While the burned area product from AVHRR data, even thought not perfect, is slowly entering into the routine of fire management, the Agricultural Resources Board is increasingly interested in the AVHRR data potential. For the 2000 fire season, they requested and received information from DMS on detected active fires, in near-real time.
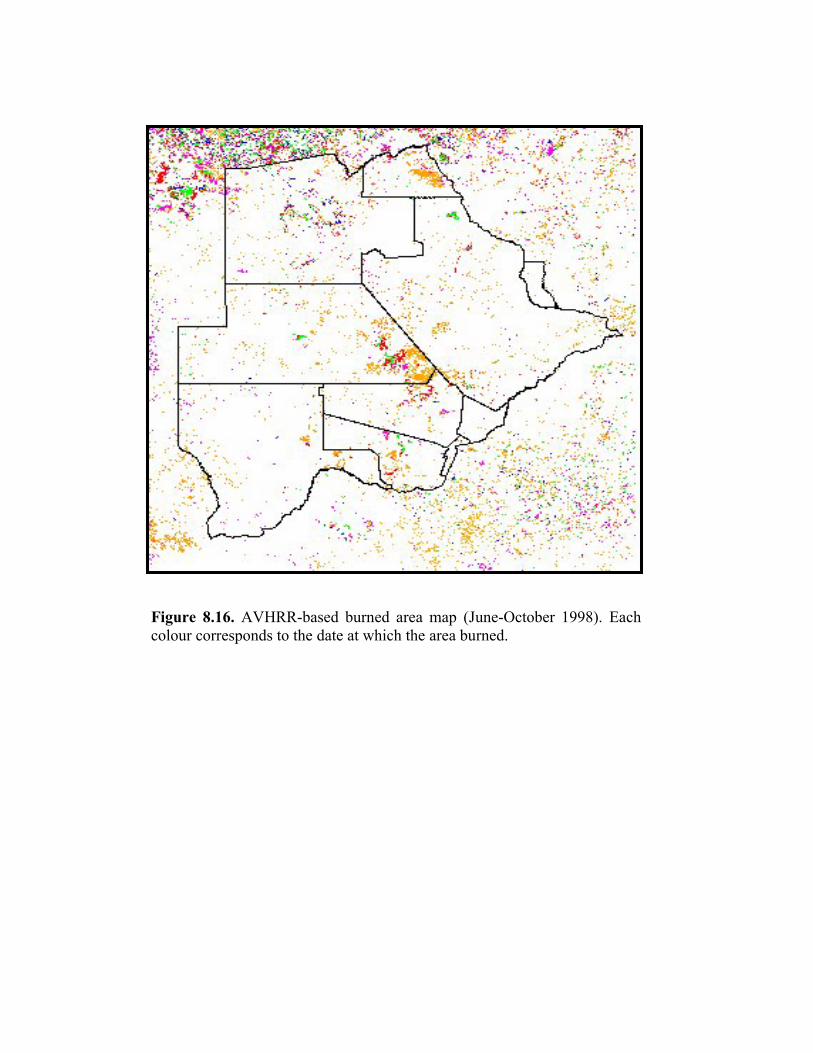
Figure 8.16. AVHRR-based burned area map (June-October 1998). Each colour corresponds to the date at which the area burned.

Figure 8.17. AVHRR-based fire frequency map for Botswana 1996-1998 (Ntabeni 1999).
Finally, local staff is currently working on a first prototype method to produce 10-day fire potential maps for Botswana (Ntabeni 1999), an example of which is given below (Figure 8.18). The model uses various inputs, such as AVHRR NDVI, from the wet season as an indicator of fuel load, AVHRR RGI (Relative Greenness Index) during the dry season as an indicator of vegetation status, AVHRR burned area maps, roads and settlements, land use and vegetation maps.
20.0
27.0
29.0
18.0

Figure 8.18. AVHRR-based prototype fire danger map for Botswana (Ntabeni 1999).
The fire products obtained from NOAA-AVHRR provide a very valuable contribution to improved knowledge and fire management decision-making. Some of the existing products are already used operationally. The more decision makers see and use these products, the more they learn about their potential and gain useful insights as to how it would best support them. 8.6.4 Senegal The fire issues in Senegal The fire season extends from October to May. Overall, the critical fire period in Senegal is variable between seasons. It depends on several factors, including the rainfall (quantity and length), the fuel production, vegetation status, spatial distribution, awareness of population and prescribed burning practices (CSE 1999). Particularly in the Sahelian part of Senegal, fire occurrence contributes to increasing pressure on agricultural and rangeland systems through the destruction of natural pasture equilibrium and the weakening of agricultural land. The fire activity on the forests of the southern part of the country results in a decrease in the wood
20. 29.
18.
27.0

productivity as well as a threat on regeneration. Bush fire is one of the main causes for the degradation of natural resources, and often results in changes in vegetation as well as the living conditions of the local populations. These fires are characterized by their frequency, their unpredictability, and their variable intensity. These are linked in turn to the state of the vegetation or fuel, the variety of existing ways to exploit natural resources and to the social conditions of local communities (Mbow 1997; CSE 1999).
The Government of Senegal put means in place to fight the bush fires in the principal eco-geographic zones of the country. Where organized, communities are provided with equipment to fight the fires (active activities). Passive activities consist more of awareness campaigns, in order to help local communities to avoid conditions favourable to wild fires. In the Sahelian part of the country a network of firebreaks was established in order to reduce fire spread or even stop it in areas where natural obstacles are rare. However, firebreaks tend not to be maintained, because of the cost associated with the operations, and therefore their efficiency is reduced. One of the most important strategies was introduced in 1965, consisting of early season prescribed fires to reduce fuel load and therefore to prevent late fires (much larger, more difficult to control and more destructive). When applied appropriately, this method is very efficient. The effectiveness of those strategies goes together with an appropriate use of fire information by the public services as well as the general public. Traditionally, fire information consisted of field reports of observed or fought fires. However, the delay in providing active fire information is usually proportional to the distance between the fire and the fire-fighting unit. In addition, the spatial and temporal variability of the bush fire activity often exceeds the current means to react. Fire monitoring The estimation of burned areas and the fire frequency are fundamental aspects to try to manage the natural resources with respect to fire activity. To complement traditional fire information and government initiatives, the Centre de Suivi Écologique (CSE) of Dakar has implemented a methodology to monitor fire activity using NOAA-AVHRR satellite data received locally through their own station installed in 1992. Fires are identified using night-time imagery and simple threshold techniques (see section 0 on active fire detection). In 1999, the CSE became one of the nodes of the World Fire Web of the Joint Research Centre (EU), which provides operationally active fire information during daytime. The fire information is introduced, via GIS, into its geographical context, allowing improved interpretation and therefore support to management.
While not exhaustive, it is now well accepted that fire information obtained from AVHRR data provides good indication of the fire activity over large territory. Initially only the territory of Senegal was covered, and information operationally used by the Forestry, Waters, Hunting and Conservation Department, the Livestock Directorate and the National Parks Directorate. Now CSE monitoring activities are also contributing to providing fire information for the neighbouring countries. Fire activity during 1993-1998 The analysis of the fire information over the period 1993 to 1998 resulted in a description of the fire activity in Senegal and the identification of important issues. The problematic period is often January to February, when remaining high volume of vegetation is senescent and the weather very dry. During that period large uncontrolled wild

Evolution mensuelle des superficies brûlées au Sénégal de 1993 à 1998
0
100000
200000
300000
400000
500000
600000
nov dec jan fev mars avril mai
Mois
Supe
rfic
ies
brûl
ées
(ha)
1993-94
1994-951995-961996-97
1997-98
Monthly burned area for Senegal from 1993 to 1998
Nov Dec Jan Feb Mar Apr May Months
Burn
ed a
rea
(ha)
fires can be very destructive. The spatial and temporal distribution is generally heterogeneous and variable.
Figure 8.19 illustrates this variability and clearly indicates peak fire activity in February 1994 and January 1996. In 1994, these can probably be explained by the absence of prescribed fires. In 1995-96, high rainfall continued until November , increasing fuel loads and delaying the application of prescribed fires. This is believed to be the main cause of the recrudescent fires of January 1996.
Figure 8.19. Monthly burned area for Senegal between 1993 and 1998 (source: CSE)
The regression period is characterized by a sharp decrease in area burned due to a corresponding decrease in fuel load (vegetation already burned or grazed). It takes place between March and May. However, during that period, the data quality is affected by increased cloud cover over the south of the country. It is also in this area that the late season fires are observed. Slash and burn agriculture is practised in the south-east, which usually sees an increase in fire activity at the end of the dry season, corresponding to fields preparation for the coming crop season.

Figure 8.20. Fire frequency in Senegal between 1996 and 1998 (source: CSE)
Spatially, as is illustrated in Figure 8.20, fire activity occurs in the centre, south and south-west. Most of the fire activity takes place in the regions of Kolda, Tamba and Ziguinchor, because of their continuous herbaceous cover combined with human activities such as honey and gum collection, hunting and charcoal production. In the north of the country, the lower biomass is usually used by the cattle and consequently fire activity is very low. Partners The Forestry, Waters, Hunting and Conservation Department (DEFCCS) is responsible for fire control activities. It puts into place the policy of fire prevention and fire fighting, however, it lacks means. CSE provides the DEFCCS with fire information that is used to identify the locations and size of fires. This information helps the managers to focus on fragile areas as well as to allocate resources appropriately.
The Livestock Directorate is responsible for the management of rangeland, indispensable to feed the cattle. Since bush fires destroy valuable forage, often resulting in over-grazing, fire information provided by the CSE is used to better organize pastoral movements.
However, with the recent decentralization processes, fire control responsibilities and pastoral movements have been transferred to local communities. Unfortunately, the newness of the process combined with scare resources prevents local communities from playing their role suitably.
The National Parks Directorate receives from CSE, in near-real time, information on the fire activity in the Parc National de Niokolo Koba, important heritage for its flora and fauna. Fire information is used by the managers of the Park to assess awareness campaigns in the neighbouring villages, as well as to prescribe burning activities.
Burned areas Between
1996 and 1998
1996 1997 1998 1996 & 1997 1996 & 1998 1997 & 1998 1996, 1997 & 1998 Administrative boundaries
m

Finally, through international collaborations, the impact of radio campaigns in Guinea has been assessed using remote sensing fire information from CSE. The study showed a reduction of fire activity in areas covered by the radio campaigns (Kane 1997).
Clearly the fire issues are interdisciplinary and must be tackled as a common and integrated effort, where satellite data can positively contribute to efficient fire management. 8.6.5 Ethiopia In February-March 2000, Ethiopia experienced damaging large forest fire events impacting on the only remaining significant natural forest areas of the Eastern Highlands. These areas are an important part of the Protected Areas System of Ethiopia, for their biodiversity as well as resources for the local communities. In Bale alone, these fires affected 45 forest priority areas, damaged 53 000 ha of forest and 1 000 ha of wild coffee, killed 30 head of livestock and 49 of wildlife, destroyed over 5 000 beehives and 43 houses. Whether for the short term or the longer term, these fire events clearly affected resources important to people's livelihoods.
However, the wider issues linked to fire are complex, and people are usually at their origin. Mainly pastoralists, farmers, hunters, and honey gatherers are starting the fires in Ethiopia. There is an increased demand for farmland to sustain the livelihood of the fast growing population. Given the backward agricultural techniques with low productivity, expansion of farmland is the only option for many families. In addition, activities by immigrants with no cultural affiliation with the forests, and therefore little knowledge on the ecology of forest, represent an important threat to the sustainability of their main natural resources.
Through the Global Fire Monitoring Centre, the Government of Ethiopia received emergency support from the international community (Germany, USA, South Africa, Canada, UNEP). In particular, the United States National Oceanic and Atmospheric Administration (NOAA), National Environmental Satellite, Data, and Information Service (NESDIS), International and Interagency Affairs Office, on the request of the Government of Ethiopia through its embassy in Addis Ababa, provided the following remote sensing fire information:
• Images from the DMSP (U.S. Air Force Defence Meteorological Satellite Program) images at 2.7 km resolution for the East Africa region. A special survey area where the fires occurred (Goba and Shakiso Regions - 5-9°N, 38-42°E), were produced daily (weekdays).
• Images from the NOAA-AVHRR (Advanced Very High Resolution Radiometer) at
1 km resolution (recorded onto NOAA-14 spacecraft), from 8 to 10 March 2000 and occasionally later. Restrictions were due to the fact that the satellite's orbital track changed and the spacecraft did not image directly over Ethiopia due to other commitments for recording 1 x 1 km resolution data.
Fire maps were particularly useful during the emergency period to assess the evolution of the situation and help flying crews identifying active fire locations. Fire information and management

West Ethiopia - 12 November 1996(NOAA-AVHRR / NDVI+fires)
GambelaGore
7.73N 34.13E
Dembi Dolo
Low vegetation High vegetation Cloud/no data Fire
The Government of Ethiopia recently decided to start the development of integrated fire management strategies in order to prepare for catastrophes, and most importantly to prevent them through improved awareness and integrated fire management in order to benefit in the long term both the local communities and the forest ecosystem. The first step was a Round Table Conference on forest fire management, in September 2000, in order to learn from the past events and from experiences in other countries in order to define recommendations for the coming years (Ministry of Agriculture, Ethiopia, with GTZ and GFMC 2001).
The Round Table clearly recognized the importance of taking into account all aspects relating to the fires, with particular attention given to the status of the people initiating them., The development of a fire information system and the use of fire remote sensing capabilities were recommended, and particular emphasis was placed on the existing remote sensing capabilities of the Ethiopian National Meteorological Services Agency (NMSA), in Addis Ababa (Flasse 2000).
Figure 8.21. Vegetation (NDVI) and active fire information from NOAA-AVHRR data over west Ethiopia.
NOAA-AVHRR products and their use The NMSA hosts receiving stations for the NOAA-AVHRR and Meteosat satellites. Initially implemented in 1990 in support of drought preparedness (Tsegaye et al. 1995), the same data can be interpreted for fire management. NMSA already operates the systems and collect

satellite data daily. In December 2000 - further to the Round Table recommendations - those capabilities were upgraded to cover fire information. Both NMSA and Ministry of Agriculture staff were trained to use active fire detection software, to extract active fire locations and to integrate the information into the forestry GIS. The forest and fire community in Ethiopia is now starting to build on this new expertise to benefit from timely and national fire information from satellite data. An example is given in Figure 8.21. 8.7 Future expectations The NOAA-AVHRR, Landsat, and SPOT satellite systems have been the workhorses for land cover applications until recently; several new remote sensors have been developed for the "new generation" of satellites reflecting the trend in remote sensing towards increasingly specific applications and higher sensor resolution. This leads to a tremendous increase in the amount of data in need of processing and storage, but concurrent advances in computer hardware and software are keeping pace with requirements. There is greater emphasis on making remote sensing products more accessible to a wider range of users. This means that, not only will raw imagery be available, but also derived information products that are more user-friendly, for those without a remote sensing background. Some of these new data products include maps of net primary production, leaf area index, land cover change, and fire. Furthermore, new data and data products are increasingly available for free (e.g., EOS data) or at substantially lower cost than ever before (in the case of Landsat 7).
The first and second Along Track Scanning Radiometer (ATSR) instruments, ATSR-1 and ATSR-2, have been operating since 1991 and 1995 on board the ERS-1 and ERS-2 satellites, respectively. The Advanced ATSR (AATSR) instrument will be launched on ESA's Envisat platform in the near future. ATSR-2 and AATSR have green, red, and NIR channels for vegetation monitoring, in addition to the two SWIR and two TIR channels on ATSR-1. Swath width is 500 km, and spatial resolution at nadir is 1 km. The key feature of ATSR is that it can deliver both nadir and "along track" views of the same surface location, where the latter view passes through a longer atmospheric path, thus enabling improved corrections for atmospheric effects.
The Meteosat Second Generation (MSG) programme will continue the Meteosat programme begun in 1977, and will be particularly useful for regional/continental-scale monitoring of fires, much like the AVHRR. In addition, it will provide data every 15 minutes, allowing the monitoring of fire progression and fire temporal distribution. The launch of MSG-1 is scheduled for mid- 2002. The MSG satellites will operate from geo-stationary orbits, and provide multi-spectral imagery in 12 spectral channels, at 1 km spatial resolution in the visible channel and 3 km for the others, 8 of which will be in the TIR. Most National Meteorological Services in Africa are expected to be equipped with the relevant receivers, allowing near-real time monitoring in-country.
The two principal EOS (Earth Observing System - NASA) platforms are Terra (EOS AM-1) and Aqua (EOS PM-1). Both Terra and Aqua feature the Moderate Resolution Imaging Spectrometer (MODIS). The MODIS instrument on board Terra promises to be more useful for land surface applications due to its morning flyover time, especially in the tropics, where clouds usually develop by afternoon. MODIS has a swath width of 2 330 km and a repeat cycle of 1 - 2 days, which will make it the principal sensor for monitoring the Earth
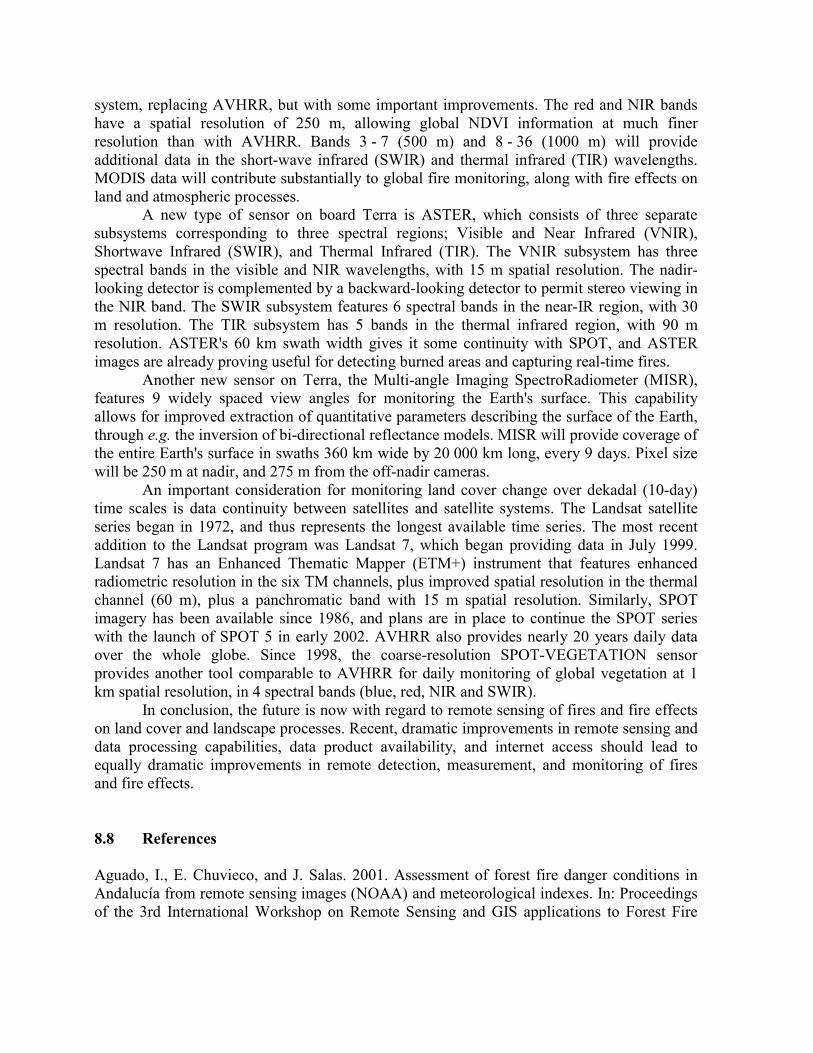
system, replacing AVHRR, but with some important improvements. The red and NIR bands have a spatial resolution of 250 m, allowing global NDVI information at much finer resolution than with AVHRR. Bands 3 - 7 (500 m) and 8 - 36 (1000 m) will provide additional data in the short-wave infrared (SWIR) and thermal infrared (TIR) wavelengths. MODIS data will contribute substantially to global fire monitoring, along with fire effects on land and atmospheric processes.
A new type of sensor on board Terra is ASTER, which consists of three separate subsystems corresponding to three spectral regions; Visible and Near Infrared (VNIR), Shortwave Infrared (SWIR), and Thermal Infrared (TIR). The VNIR subsystem has three spectral bands in the visible and NIR wavelengths, with 15 m spatial resolution. The nadir-looking detector is complemented by a backward-looking detector to permit stereo viewing in the NIR band. The SWIR subsystem features 6 spectral bands in the near-IR region, with 30 m resolution. The TIR subsystem has 5 bands in the thermal infrared region, with 90 m resolution. ASTER's 60 km swath width gives it some continuity with SPOT, and ASTER images are already proving useful for detecting burned areas and capturing real-time fires.
Another new sensor on Terra, the Multi-angle Imaging SpectroRadiometer (MISR), features 9 widely spaced view angles for monitoring the Earth's surface. This capability allows for improved extraction of quantitative parameters describing the surface of the Earth, through e.g. the inversion of bi-directional reflectance models. MISR will provide coverage of the entire Earth's surface in swaths 360 km wide by 20 000 km long, every 9 days. Pixel size will be 250 m at nadir, and 275 m from the off-nadir cameras.
An important consideration for monitoring land cover change over dekadal (10-day) time scales is data continuity between satellites and satellite systems. The Landsat satellite series began in 1972, and thus represents the longest available time series. The most recent addition to the Landsat program was Landsat 7, which began providing data in July 1999. Landsat 7 has an Enhanced Thematic Mapper (ETM+) instrument that features enhanced radiometric resolution in the six TM channels, plus improved spatial resolution in the thermal channel (60 m), plus a panchromatic band with 15 m spatial resolution. Similarly, SPOT imagery has been available since 1986, and plans are in place to continue the SPOT series with the launch of SPOT 5 in early 2002. AVHRR also provides nearly 20 years daily data over the whole globe. Since 1998, the coarse-resolution SPOT-VEGETATION sensor provides another tool comparable to AVHRR for daily monitoring of global vegetation at 1 km spatial resolution, in 4 spectral bands (blue, red, NIR and SWIR).
In conclusion, the future is now with regard to remote sensing of fires and fire effects on land cover and landscape processes. Recent, dramatic improvements in remote sensing and data processing capabilities, data product availability, and internet access should lead to equally dramatic improvements in remote detection, measurement, and monitoring of fires and fire effects. 8.8 References Aguado, I., E. Chuvieco, and J. Salas. 2001. Assessment of forest fire danger conditions in Andalucía from remote sensing images (NOAA) and meteorological indexes. In: Proceedings of the 3rd International Workshop on Remote Sensing and GIS applications to Forest Fire

Management: New methods and sensors (E. Chuvieco, and P. Martín, eds), 45-48. European Association of Remote sensing Laboratories (EARSeL), Paris, France. Ahern, F., J.M. Gregoire, and C. Justice. 2000. Forest fire monitoring and Mapping: A component of Global Observation of Forest Cover. Report of a Workshop, 3-5 November1999, JRC, Ispra, Italy, EUR 19588 EN, 256p. Belward, A.S., J. M. Grégoire, G. D'Souza, S. Trigg, M. Hawkes, J. M. Brustet, D. Serça, J. L. Tireford, J. M. Charlot, and R. Vuattoux. 1993. In-situ, real-time fire detection using NOAA/AVHRR data. In: Proceedings of the 6th European AVHRR Data Users' Meeting, 29 June to 2 July 1993, Belgirate, Italy. Eumetsat, Darmstadt, Germany, 333-339. Bond, W.J., and B.W. van Wilgen. 1996. Fire and Plants. Population and Community Biology Series 14. Chapman and Hall, London, 263 p. Brockett, B.H., H.C. Biggs, and B.W. van Wilgen 2001. A patch-mosaic burning system for conservation areas in southern African savanna. Int. J. Wildland Fire 10, 169-183. Burgan, R.E. 1996. Use of remotely-sensed data for fire danger estimation. EARSeL Advances in Remote Sensing, 4(4), 1-8. Burgan R.E, R.W. Klaver, and J.M. Klaver 1998. Fuel models and fire potential from satellite and surface observations. International Journal of Wildland Fire 8,159-170. Campbell, J.B. 1987. Introduction to remote sensing. Guildford Press, New York. Carlson, J. D. 2001. Review of user needs in operational fire danger estimation: The Oklahoma example. In: Proceedings of the 3rd International Workshop on Remote Sensing and GIS applications to Forest Fire Management: New methods and sensors (E. Chuvieco, and P. Martín, eds.), European Association of Remote sensing Laboratories (EARSeL). Ceccato, P., S. Flasse, S. Tarantola, S. Jacquemoud, and J. M. Grégoire. 2001(a). Detecting vegetation leaf water content using reflectance in the optical domain. Remote Sensing of Environment 77(1), 22-33. Ceccato, P., N. Gobron, S. Flasse, B. Pinty, and S. Tarantola. 2001(b). Designing a spectral index to estimate vegetation water content from remote sensing data. Part I: Theoretical approach. Remote Sensing of Environment (submitted). Ceccato, P., S. Flasse, and J. M. Grégoire. 2001(c). Designing a spectral index to estimate vegetation water content from remote sensing data. Part II: Validation and applications. Remote Sensing of Environment (submitted). Cheney, P., and A. Sullivan. 1997. Grassfires fuel, weather and fire behaviour. CSIRO Publishing, 102 p.

Christensen, N.L. 1981. Fire regimes in southeastern ecosystems. In: Proceedings of the Conference: Fire Regimes and Ecosystem Properties, December 11-15, 1978. U.S. Department of Agriculture General Technical Report WO-26, 112-136. Congalton, R., and K. Green. 1999. Assessing the accuracy of remotely sensed data: Principles and practices. Florida, CRC Press, Inc. Cracknell, A.P. 1997. The Advanced Very High Resolution Radiometer (AVHRR). Taylor and Francis, London. CSE - Centre de Suivi Ecologique 1999. Etude diagnostic sur les feux de brousse dans les régions de Kolda et Tambacounda. Stratégies alternatives. Rapport de consultation pour le compte du Programme de Gestion Durable et Participative des Energies Traditionnelles et de Substitution, 63p. Downey, I.D. 1994. Remote sensing activities at the Natural Resources Institute for measurement of geophysical parameters. In: The Determination of Geophysical Parameters from Space, N.E. Fancey, I.D. Gardiner and R.A. Vaughan ed., SUSSP Publications, 33-44. Downey, I.D. 2000. Data feast, information famine - Operational remote sensing in developing countries. GeoInformatics, July/August 2000, 24-26. Du Plessis, W.P. 1997. Refinements to the burning strategy in the Etosha National Park, Namibia. Koedoe 40(1), 63-76. Du, Y., F.T. Ulaby, and M.C. Dobson. 2000. Sensitivity to Soil Moisture By Active and Passive Microwave Sensors. IEEE Transactions on Geoscience and Remote Sensing 38(1), 105-114. Edwards, A., G. Allan, C. Yates, C. Hempel, and P. Ryan. 1999. A comparative assessment of fire mapping techniques and user interpretations using Landsat imagery. Proceedings of the Australian Bushfire Conference, Albury, July 1999. Eva, H., and E.F. Lambin. 1998. Burnt area mapping in Central Africa using ATSR data. Int. J. Remote Sensing 19, 3473-3497. Everson, C.S., and M. Thompson. 1993. Development of spectral-biomass models for mapping and monitoring montane grassland resources. CSIR Internal Report FOR-I 345 p. Flasse, S. 1999. Semi-Automatic AVHRR Burn Scar Detection for Botswana Department of Meteorological Services, Prototype Version 2.0, User Guide. The University of Greenwich, 24 p. Flasse, S. 2000. Remote sensing of vegetation fires and its contribution to a national fire information system. In: Ethiopia Round Table Workshop on Forest Fire Management (19-20

September 2000) (Ministry of Agriculture, Ethiopia, with GTZ and GFMC, ed.), Proceedings, 85-94. Ministry of Agriculture, Addis Ababa, 166 p. Flasse, S., and M.M., Verstraete. 1994. Monitoring the environment with vegetation indices: comparison of NDVI and GEMI using AVHRR data over Africa. In: Vegetation, Modelling and Climatic Change Effects (F. Veroustreate, and R. Ceulemans ed.), 107-135. SPB Academic Publishing bv. The Hague, The Netherlands. Flasse, S.P., and P. Ceccato. 1996. A contextual algorithm for AVHRR fire detection. Int. J. Remote Sensing 17(2), 419-424. Flasse, S.P., P. Ceccato, I.D. Downey, J.B. Williams, P. Navarro, and M.A. Raimadoya. 1998. Remote sensing and GIS tools to support vegetation fire management in developing countries. In: Proceedings of the 13th Conference on Fire and Forest Meteorology, 27-31 October 1996, Lorne, Australia, International Association of Wildland Fire, USA, 209-214. Gibson, P.J., and C. H. Power. 2000. Introductory remote sensing: digital image processing and applications. London, Routledge. Goldammer, J.G. 1998. Development of national fire policy and guidelines on fire management in Namibia. Report, Directorate of Forestry, Ministry of Environment and Tourism, Republic of Namibia. Goldammer, J.G. 1999. Namibia Round Table Meeting on Fire, Windhoek 10-11 November 1998. Report to Directorate of Forestry, Ministry of Environment and Tourism, Republic of Namibia. Grimes, D.I.F., R. Bonifacio and H.R.L. Loftie 1998. Rainfall Estimation Workbook. Chatham, UK. Natural Resources Institute. Herman, A., V. Kumar, P. Arkin, and J. Kousky (no publicaion date). Objectively Determined 10 Day African Rainfall Estimates Created For Famine Early Warning Systems, published on the web at http://edcintl.cr.usgs.gov/adds/data/rfed/rfedtext.html. Hetherington, D.S. 1997. Geographic information and remote sensing tools to assist fire management protocols in the National Parks of South Africa. MSc thesis, The University of Greenwich, United Kingdom. Hetherington, D.S. 1998. The utilisation of satellite remote sensing and GIS techniques in the generation of post fire alteration mapping in the Kruger National Park, South Africa. In: ASPRS-RTI 1998 Annual Conference Proceedings, ASPRS, Bethesda, Maryland. Hudak, A.T., and C.A. Wessman. 1998. Textural analysis of historical aerial photography to characterize woody plant encroachment in South African savanna. Remote Sensing of Environment 66(3), 317-330.
Hudak, A.T., and C.A. Wessman. 2001. Textural analysis of high resolution imagery to quantify bush encroachment in Madikwe Game Reserve, South Africa, 1955-1996. Int. J. Remote Sensing 22, 2731-2740. Hudak, A.T., B.H. Brockett, and C.A. Wessman 1998. Fire scar mapping in a southern African savanna. In: Proceedings of the International Geoscience and Remote Sensing Symposium, Seattle, Washington, CD-ROM. Jackson, R.D., S.B. Idso, R.J. Reginato, and P. J. Pinter 1981. Canopy temperature as a crop water stress indicator. Water Research 17, 1133-1138. Jacques de Dixmude, A., P. Navarro, S. Flasse, I. Downey, C. Sear, J. Williams, P. Ceccato, R. Alvarez, F. Uriarte, Z. Zúñiga, A. Ramos, and I. Humphrey. 1999. The use of low spatial resolution remote sensing for fire monitoring in Nicaragua: A survey of three successive burnings seasons. International Forest Fire News 20, 64-72. (http://www.ruf.uni-freiburg.de/fireglobe/other_rep/research/ni/ni_re_1.htm) Jakubauskas, M.E., K. P. Lulla, and P.W. Mausel. 1990. Assessment of vegetation change in a fire-altered forest landscape. Photogrammetric Engineering and Remote Sensing 56, 371-377. Justice, C., J.P. Malingeau, and A.W. Setzer 1993. Satellite remote sensing of fires: potential and limitations. In: Fire in the Environment: The ecological, atmospheric, and climatic importance of vegetation fires (P.J. Crutzen, and J.G. Goldammer, eds.), 77-88. John Wiley and Sons, New York. Kane, R. 1997. Suivi satellitaire des feux en Guinée et de l’impact des campagnes de sensibilisation de la radio rurale. In: Comptes Rendus du Xième Congrès Forestier Mondial, Antalya, Turquie 13-22 Octobre 1997. Kaufman, Y.J., A. Setzer, C. Justice, C.J. Tucker, M.C. Pereira, and I. Fung. 1990. Remote sensing of biomass burning in the tropics. In: Fire in tropical biota. Ecosystem processes and global challenges (J.G. Goldammer, ed.), 371-399. Ecological Studies 84, Springer-Verlag, Berlin-Heidelberg-New York, 497 p. Kaufman, Y.J., C.O. Justice, L.P. Flynn, J.D. Kendall, E.M. Prins, L. Giglio, D.E. Ward, W.P. Menzel, A.W. Setzer 1998. Potential global fire monitoring from EOS-MODIS. J. Geophys. Res. D103, 32215-32238. Kilgore, B.M. 1981. Fire in ecosystem distribution and structure: western forests and scrublands. In: Proceedings of the conference: Fire Regimes and Ecosystem Properties, December 11-15, 1978. U.S. Department of Agriculture General Technical Report WO-26, 58-89. Koutsias, N., M. Karteris, A. Fernández-Placios, C. Navarro, J. Jurrado, R. Navarro, and A. Lobo. 1999. Burnt land mapping at a local scale. In: Remote Sensing of Large Wildfires in the

European Mediterranean Basin (E. Chuvieco, ed.), 157-187. Springer-Verlag, Berlin Heidelberg. Le Roux, J.L. 2000. Fire scar mapping in north-eastern Namibia. Report to the Directorate of Forestry, Ministry of Environment and Tourism, Namibia. Le Roux, J.L. 2001. Mapping fire scars and estimating burned area acreage for Namibia - 2000/01. Report to the Atlas of Namibia project, Windhoek, Namibia. Lefsky, M.A., D. Harding, W.B. Cohen, G. Parker, and H.H. Shugart. 1999(a). Surface Lidar Remote Sensing of Basal Area and Biomass in Deciduous Forests of Eastern Maryland, USA. Remote Sensing of Environment 67, 83-98. Lefsky, M.A., W.B. Cohen, S.A Acker, G.G. Parker, T.A. Spies, and D. Harding. 1999(b). Lidar remote sensing of the canopy structure and biophysical properties of Douglas-fir western hemlock forests. Remote Sensing of Environment 70, 339-361. Lillesand, M., and R.W. Kiefer 2000. Remote sensing and image interpretation. 4th ed. John Wiley & Sons, Inc., New York. Martín Pilar, M., P. Ceccato, S.P. Flasse, and I. Downey. 1999. Fire detection and fire growth monitoring using satellite data. In: Remote Sensing of Large Wildfires in the European Mediterranean Basin (E. Chuvieco, ed.), 101-122. Springer-Verlag, Berlin Heidelberg. Mbow, C. 1997. Méthodologie d’identification et de Cartographie des feux de brousse par télédétection, utilisation des images satellitaires NOAA-AVHRR et LANDSAT. Dakar UCAD - Mémoire de fin d’étude pour l’obtention du DEA en sciences de l’environnement, 88 p. Mendelsohn, J., and C. Roberts. 1997. An environmental profile and atlas of Caprivi. Windhoek, Ministry of Environment and Tourism, Environmental Profiles Project, 44 p. Mendelsohn, J., S. Obeid, and C. Roberts. 2000. A Profile of North-Central Namibia. Directorate of Environmental Affairs, Windhoek. Milford, J.R., V.D. McDougall, and G. Dugdale. 1996. Rainfall estimation from cold cloud duration: experience of the TAMSAT group in West Africa. In: Validation problems of rainfall estimation methods by satellite in intertropical Africa (B. Guillot, ed.). ORSTOM. Publ. in Colloques et Seminaires, Proceedings of the Niamey Workshop, December 1994. Ministry of Agriculture, Ethiopia, with GTZ and GFMC (ed.) 2001. Round Table Conference on Integrated Forest Fire Management in Ethiopia. Proceedings of the Workshop, Addis Ababa, Ethiopia, 19-20 September 2000. Ministry of Agriculture, Addis Ababa, 166 p.

Miura, T., A.R. Huete, W.J.D. van Leeuwen, and K. Didan. 1998. Vegetation detection through smoke-filled AVIRIS images: an assessment using MODIS band passes. J. Geophys. Res. 103, 32001-32011. Moghaddam, M., and S.S. Saatchi. 1999. Monitoring Tree Moisture Using an Estimation Algorithm Applied to SAR Data from BOREAS. IEEE Transactions on Geoscience and Remote Sensing 17, 901-916. Moran, M.S., T.R. Clarke, Y. Inoue, and A. Vidal. 1994. Estimation crop water deficit using the relation between surface-air temperature and spectral vegetation index. Remote Sensing of Environment 49, 246-263. Ntabeni, T. 1999. Fire potential modelling using NOAA-AVHRR data and other spatial data of Botswana. MSc Dissertation, The University of Greenwich, 83 p. Parr, C.L., and B.H. Brockett. 1999. Patch-mosaic burning: a new paradigm for savanna fire management in protected areas? Koedoe 42(2), 117-130. Pereira, J.M. 1999. A comparative evaluation of NOAA/AVHRR vegetation indices for burned surface detection and mapping. IEEE Transactions on Geoscience and Remote Sensing 37, 217-226. Pereira, J.M.C., A.C.L. Sà, A.M.O. Sousa, J.M.N. Silva, T.N. Santos, and J.M.B. Carrieras. 1999(a). Spectral characterisation and discrimination of burnt areas. In: Remote Sensing of Large Wildfires in the European Mediterranean Basin (E. Chuvieco, ed.), 123-138. Springer-Verlag, Berlin Heidelberg. Pereira, J.M.C., A.M.O. Sousa, A.C.L. Sà, M. Pilar Martin, and ,E. Chuvieco 1999(b). Regional scale burnt area mapping in Southern Europe using NOAA-AVHRR 1 km data. In: Remote Sensing of Large Wildfires in the European Mediterranean Basin (E. Chuvieco, ed.), 139-155. Springer-Verlag, Berlin Heidelberg. Pereira, J.M.C., S. Flasse, A. Hoffman, J.A.R. Pereira, F. González-Alonso, and S. Trigg. 2000. Operational use of remote sensing for fire monitoring and management: regional case studies. In: Forest Fire Monitoring and Mapping: A Component of Global Observation of Forest Cover, Report of a Workshop, November 3-5 1999, Joint Research Centre, Italy, F. Ahern, J-M. Grégoire and C. Justice, ed. European Commission - Joint Research Centre, EUR 19588 EN, 98-110. Pereira, M.C., and A.W. Setzer. 1993. Spectral characteristics of fire scars in Landsat 5 TM images of Amazonia. Int. J. Remote Sensing 14, 2061-2078. Rasmussen, M.S. 1998. Developing simple, operational, consistent NDVI-vegetation models by applying environmental and climatic information: Part I. Assessment of net primary production Int. J. Remote Sensing 19, 97-117.

Salvador, R., J. Valeriano, X. Pons, and R. Diaz-Delgado. 2000. A semi-automatic methodology to detect fire scars in shrubs and evergreen forest with Landsat MSS time series. Int. J. Remote Sensing 21, 655-671. Sannier, C. 1999. Strategic monitoring of crop yields and rangeland conditions in Southern Africa with Remote Sensing. PhD Thesis, Cranfield University: Silsoe College. Sannier, C.A.D., J.C. Taylor, W. du Plessis, and K. Campbell. 1998. Real-time vegetation monitoring with NOAA-AVHRR in Southern Africa for wildlife management and food security assessment. Int. J. Remote Sensing 19, 621-639. Sannier, C.A.D., Taylor, J.C., W. du Plessis. 2002. Real-Time Monitoring of Vegetation Biomass with NOAA-AVHRR in Etosha National Park, Namibia, for fire risk assessment. Int. J. Remote Sensing 23, 71-89. Sarabandi, K. 1997. Delta k-radar equivalent of interferometric SARs: A theoretical study for determination of vegetation height. IEEE Transactions on Geoscience and Remote Sensing 35, 1267-1276. Schmugge, T. 1978. Remote sensing of surface soil moisture. J. Appl. Meteorology 17, 1549-1557. Scholes, R.J., and B.H. Walker. 1993. Synthesis of the Nylsvley Study. Cambridge University Press, Cambridge, United Kingdom. Stander, P.E., T.B. Nott, and M.T. Mentis. 1993. Proposed burning strategy for a semi-arid African savanna. African J. Ecology 31, 282-289. Stronach, N.R.H., and S.J. McNaughton. 1989. Grassland fire dynamics in the Serengeti Ecosystem, and a potential method of retrospectively estimating fire energy. J. Appl. Ecology 26, 1025-1033. Thompson, M. 1990. Pilot study to evaluate multitemporal LANDSAT Multispectral Scanner data for mapping seasonal burns in woody savanna type vegetation. SA Forestry Research Institute Centre Report P2/89. Thompson, M. W. 1993. Quantitative biomass monitoring and fire severity mapping techniques in savanna environments using Landsat Thematic Mapper imagery. External Contract Report FOR-DEA 587, Division of Water, Environment and Forest Technology, CSIR, Pretoria. Thompson, M.W., and E.R. Vink. 1997. Fire scar mapping in Pilanesberg National Park. External Contract Report ENV/P/C/I 97157, CSIR, Pretoria, South Africa. Thompson, M., and E.R. Vink. 2001. Biomass Determination for predictive Burn Risk Assessment. CSIR External Client Report ENV/P/C 2001-013, March 2001.

Trigg, S.N. 1996. Fire monitoring in the Caprivi. Report to Directorate of Environmental Affaris, Ministry of Environment and Tourism, Namibia. Trigg, S. 1997. Fire scar mapping in Northern Namibia. Report to Directorate of Forestry, Ministry of Environment and Tourism, Namibia. Trigg, S., and S. Flasse. 2000. Characterising the spectral-temporal response of burned savannah using in situ spectroradiometry and infrared thermometry. Int. J. Remote Sensing 21, 3161-3168. Trigg, S., and S. Flasse. 2001. An evaluation of different bi-spectral spaces for discriminating burned shrub-savannah. Int. J. Remote Sensing (in print). Trigg, S., and J. le Roux. 2001. Hot Spot Contribution to the FAO Special Report on Forest Fires. In press. Trigg, S. et al. (in preparation). Developing reference data for the accuracy assessment of burned area maps made from coarse spatial resolution, high temporal resolution data. Trollope, W.S.W. 1992. Fire behaviour and its significance in burning as a veld management practise. In: Prestige Farmers Day Proceedings (C.R. Hurt, and P.J.K. Zacharias, eds.). Grassland Society of Southern Africa, Scottsville. Trollope, W.S.W., and L.A. Trollope. 1999. Technical review of the integrated forest fire management component of the Namibia-Finland Forestry Programme in the East Caprivi Region of Namibia. Report, Directorate of Forestry, Ministry of Environment and Tourism, Republic of Namibia. Tsegaye Tadesse, C.B. Sear, T. Dinku, and S. Flasse. 1995. The impact of direct reception of satellite data on a small African meteorological service: operational use of NOAA AVHRR and METEOSAT products in Ethiopia. In: Proceedings of the 1995 Meteorological Satellite Data Users Conference, Winchester, UK, 4-8 September 1995, EUMETSAT, Germany, 485-489. Tucker, C.J. 1980. Remote Sensing of Leaf Water Content in the Near Infrared. Remote Sensing of Environment 10, 23-32. Verstraete, M.M., and B. Pinty. 1996. Designing optimal spectral indexes for remote sensing applications. IEEE Transactions on Geoscience and Remote Sensing 34, 1254-1265. Vidal, A., F. Pinglo, H. Durand, C. Devaux-Ros, and A. Maillet. 1994. Evaluation of a Temporal Fire Risk Index in Mediterranean Forests from NOAA Thermal IR. Remote Sensing of Environment 49, 296-303.

Viedma, O., J.Melia, D. Segarra, and J. Garcia-Haro. 1997. Modelling rates of ecosystem recovery after fires by using Landsat TM data. Remote Sensing of Environment 61, 383-398. Williams, J. 1999. Towards coherence in developmental decision-making: the decision support roles of remote sensing and GIS - Lessons from the LARST approach. In: Decision tools for sustainable development (I. Grant, and C. Sear, eds.), 210-224. Natural Resources Institute, Chatham, UK. Xie, P., and P. A. Arkin. 1997. A 17-year monthly analysis based on gauge observations, satellite estimates, and numerical model outputs. Bull. Amer. Met. Soc. 78, 2539-2558.

Annex 1: Table of some satellite sensors and data providers, Textbooks, Useful Web Pages and Acronyms, Abbreviations and Explanations List
Satellite Sensor
Spatial resolut.
Temporal resolut.
Spectral Bands
Cost indication per Scene (approx.)
Data Access Address
Contact/Internet Information
Geostationary Satellites: for example for Africa, Meteosat MSG
2.4-5km 1-3km
30 min 15 min
Visible, infrared, water vapour 12 bands
Free with receiving equipment and license (variable cost, free to some users) from Eumetsat
LARST Natural Resources Institute University of Greenwich Central Avenue Chatham Maritime Kent ME4 4TB United Kingdom Eumetsat
Tel: +44 (1634) 883286 Fax: +44 (1634) 883917 [email protected] http://www.nri.org/RAPIDS/larst.htm http://www.eumetsat.de/
Polar Orbiting Satellites (low/medium resolution): for example, NOAA-AVHRR
1100m < 1 day 5 bands: red, NIR, MIR, 2xTIR
Free with receiving equipment or Basically cost price if ordered
Satellite Applications Centre (SAC) P.O Box 395 Pretoria 0001 Republic of South Africa LARST GSFC DAAC
Tel: +27 (12) 334 5000 Fax: +27 (12) 334 5001 [email protected] http://www.sac.co.za/ (see above) http://daac.gsfc.nasa.gov/CAMPAIGN_DOCS/BRS_SRVR/avhrrbrs_main.html
SPOT –VEGETATION
1150m 1 day 4 bands: blue, red, NIR & SMIR
Contact SPOT image Spot Image, France http://www.vgt.vito.be/
Terra MODIS 250m 500m 1000m
1-2 days 36 bands [visible to infrared]
Free EOSDIS GES DAAC
http://redhook.gsfc.nasa.gov/~imswww/pub/imswelcome/plain.html http://daac.gsfc.nasa.gov/CAMPAIGN_DO

CS/MODIS/index.shtml MODIS User Services: Phone: +1 (301) 614 5473 Fax: +1 (301) 614 5304 [email protected]
Polar Orbiting Satellites (high resolution): for example, SPOT 10m
20m 3m
26 days or less
green, red, NIR & SMIR Panchromatic /visible
Spotimage prices: € 1250 - € 5100
SAC SPOT image, France
(see above) http://www.spotimage.fr/home/proser/listscen/welcome.htm
Landsat TM 30m 120m/ 60m 15m
16 days 7 bands: blue, green, red, NIR, SMIR, LMIR & TIR Panchromatic: 1 band: visible/NIR
Landsat 5 TM: $ 2870 Landsat 7 TM: $ 600
SAC USGS (Landsat 7)
(see above) [email protected] http://landsat7.usgs.gov/
ERS SAR 12.5-30m 26 days Radar Eurimage: $ 1200 (discounts for multiple images)
Eurimage SAC LARST
http://www.eurimage.com/Products/ps_home.html (see above) (see above)
IRS 23m 5.8m
24 days green, red, NIR, SWIR Panchromatic/visible
Spaceimaging Europe: € 2500
Spaceimageing EOSAT LARST (see Meteosat)
[email protected] http://www.si-eu.com/ (see above)
Ikonos 4 m
blue, green, red, VNIR Panchroma
Expensive (varies with product and quantity of data)
SAC Space Imaging EOSAT
(see above) http://www.spaceimaging.com/default.htm

1m tic: visible
Other useful sites, Vegetation (NDVI) and Rainfall (CCD)
Free
ADDS African Dada Dissemination Service
http://edcintl.cr.usgs.gov/adds
Fire products Free WFW World Fire Web Iona Fire See also GFMC-remote sensing
http://ptah.gvm.sai.jrc.it/wfw/index.html http://shark1.esrin.esa.it/ionia/FIRE/ http://www.fire.uni-freiburg.de/inventory/rem_pro.html
For more detailed information on the channels available, etc. please refer to web pages listed in the last column.
243
Introductory Textbooks Wilkie, D.S., and J.T. Finn 1996. Remote Sensing Imagery for Natural Resources Monitoring - A Guide for First-Time Users. Columbia University Press, 295p.
Sabins, F.F., Jr. 1996. Remote Sensing: Principles and Interpretation, 3rd ed. Freeman, New York.
Lillesand, T.M., and R.W. Kiefer 1999. Remote Sensing and Image Interpretation, 4th ed., John Wiley & Sons, New York.
Barrett, E.C., and L.F. Curtis 1999. Introduction to Environmental Remote Sensing. 4th ed., Nelson Thornes.
Campbell, J.B. 1996. Introduction to Remote Sensing. 2nd ed., Taylor & Francis.
Gibson, P., and C. Power 2000. Introductory Remote Sensing Principles and Concepts. Routledge. State-of-the-Art Review Ahern, F., J.G. Goldammer, and C. Justice (eds.). 2001. Global and regional vegetation fire monitoring from space: Planning a coordinated international effort. SPB Academic Publishing bv, The Hague, The Netherlands, 302 p. World Wide Web Pages on Remote Sensing The following are good places to start from as they contain lots of links to other remote sensing pages:
The Remote Sensing and Photogrammetry Society: http://www.geog.nottingham.ac.uk/~mather/useful_links.html WWW Virtual Library: Remote Sensing http://www.vtt.fi/aut/rs/virtual/ Universiteit Utrecht http://www.frw.ruu.nl/nicegeo.html#gis
Acronyms, Abbreviations and Explanations List AATSR Advanced Along-Track Scanning Radiometer (visible/infrared sensor
on Envisat series, successor of ATSR)
AMI Active Microwave Instrument (SAR sensor on ERS series)
Aqua EOS satellite (formerly known as EOS PM-1)
ARVI Atmospherically Resistant Vegetation Index
ASAR Advanced Synthetic Aperture Radar (microwave sensor on Envisat; successor of AMI)

244
ASTER Advanced Spaceborne Thermal Emission & Reflectance Radiometer (sensor on Terra satellite) website: http://asterweb.jpl.nasa.gov/
ATSR Along-Track Scanning Radiometer (visible/infrared sensor on ERS series) website: http://earthnet.esrin.esa.it
AVHRR Advanced Very High Resolution Radiometer (sensor on NOAA satellite series)
DAAC Distributed Active Archive Center (US data collection points, these can usually be easily accessed via the Internet)
DMSP Defense Meteorological Satellite Program (USA)
EDC EROS Data Center (part of United States Geological Survey), data sales (hosts a DAAC)
Envisat Satellite, successor to ERS programme
EOS Earth Observing System (NASA's Earth Science satellite programme)
EOSDIS Earth Observing System Data and Information System. The EOS Data Gateway provides a central search and order tool for accessing a wide variety of global Earth science data and information held at 8 different EOSDIS data centres and a growing number of international data providers.
ERS European Remote Sensing Satellite series
ETM+ Enhanced Thematic Mapper (sensor on Landsat-7)
website: http://landsat7.usgs.gov/
Geostationary A type of satellite orbit (at 36 000 km above the equator) where the motion of the satellite matches the speed and direction of the Earth's rotation so that the satellite remains over a fixed point on the Earth's surface. Also called geosynchronous.
GEMI Global Environment Monitoring Index
GES GSFC (Goddard Space Flight Center) Earth Sciences (hosts a DAAC with MODIS data)
GFMC Global Fire Monitoring Center
website: http://www.fire.uni-freiburg.de/
GOES Geostationary Operational Environmental Satellite - meteorological satellite programme (USA)
HRV High Resolution Visible (sensor on SPOT-1, -2 and -3)
HRVIR High Resolution Visible Infrared (sensor on SPOT-4 and -5)
Ikonos Space Imaging EOSAT high resolution visible satellite series
IRS Indian Remote Sensing Satellite series

245
JERS Japanese Earth Resources Satellite (visible/near infrared and microwave sensors)
Landsat Land use studies satellite series (USA) (variously carries sensors MSS, TM and ETM+)
LARST Local Applications of Remote Sensing Techniques (programme of Natural Resources Institute, satellite reception hardware sales)
LMIR Long Mid-Infrared (waveband or sensor channel)
Meteosat European meteorological satellite series
MIR Mid-Infrared (waveband or sensor channel)
MISR Multi-angle Imaging Spectro-Radiometer (sensor on Terra satellite)
website: http://www-misr.jpl.nasa.gov/
MODIS Moderate Resolution Imaging Spectrometer (sensor on Terra satellite) website (info): http://ltpwww.gsfc.nasa.gov/MODIS/
MSG Meteosat Second Generation (satellite series, successor to Meteosat)
website: http://www.esa.int//msg/
MSS Multispectral Scanner System (sensor on Landsat series)
NASA National Aeronautics and Space Administration (USA)
NDVI Normalized Difference Vegetation Index
NIR Near Infrared (waveband or sensor channel)
NOAA National Oceanic and Atmospheric Administration (USA, also the name of their satellite series)
OrbView OrbImage high resolution visible satellite series
PAN Panchromatic (often used to refer to sensor data with a single waveband visible channel, e.g. SPOT PAN)
Polar orbit An orbit where the satellite flies around the Earth travelling approximately north to south (or south to north) so that it's path goes over the polar regions.
Radarsat Canadian radar satellite (with SAR sensor)
SAC Satellite Applications Centre (South Africa, data sales)
SAR Synthetic Aperture Radar (microwave sensor)
SAVI Soil Adjusted Vegetation Index
SMIR Short Mid-Infrared (waveband or sensor channel)
SPOT Satellite Pour l'Observation de la Terre (SPOTImage (French) satellite series) website: http://www.spotimage.fr/spot-us.htm
SSM/I Special Sensor Microwave Imager (passive microwave sensor on DMSP)

246
Terra EOS satellite (formerly known as EOS AM-1)
TIR Thermal Infrared (waveband or sensor channel)
TM Thematic Mapper (sensor on Landsat-4 and -5)
TSAVI Transformed Soil Adjusted Vegetation Index
USGS United States Geological Survey (includes EROS Data Center, data sales)
VGT Vegetation (AVHRR-like sensor on SPOT-4 and -5)
VIS Visible (waveband or sensor channel)
XS Often used to refer to SPOT multispectral data