ISSN 1985-8574 Selaku Penasihat PUSP ANITA Cawangan …...kepentingan senaman, telrnil
CHAPTER IV
PERFORMANCE OF DICs IN KERALA
(A Non-Theoretical Analysis)
ln an attempt to industrialize the country, it has been noted in the foregoing
chapters that the Central as well as the State Govemments have been taking a series of
measures from time to time in a planned manner. The DIC is a step in this direction.
With a view to assess the performance of DICs on the industrial scenario of the state, it
would be in the fitness of things to examine in greater detail the organizational structure
of DICs, to make a macro analysis of performance of DICs and make an analysis of the
performance of DIC assisted SSI units. Thus, this Chapter is divided into three parts.
Pan 4.1 is an examination of the organizational structure of DICs. Part 4.2 is the
Performance of DICs in Kerala - A Macro Analysis on the basis of secondary data. Part
4.3 highlights Performance of DIC assisted SSI units on the basis of primary data.
4.1. Organizational structure of DICs
As the DIC is one of the most important agencies for planning, organising
and implementing industrial development programmes at the district level it need hardly
be emphasised that its success depends upon the existence of a sound organisational
stmcture. The analysis about the organisational structure is largely based on thediscussions held with the officials of various DICs and also with those at state level.
The nature of the functions performed by DICs is two pronged, i.e. (1) Developmental
and (2) Regulatory.
The developmental role covers (i) Industrial extension services, which
include planning for industrialization in the context of Village and Small Industries
(VSI) with respect to the district and subunits. (ii) Building up an information base of
relevance to existing and prospective entrepreneurs and dissemination of data and
counselling services.
Regulatory responsibilities cover a wide range of services such as
registration of SSI units, recommending the cases for raw material allotment, processing
93
application for import of machinery, allotment of factory shed, and appraisal of loan
applications etc.
The regulatory functions should subserve and should be used as instruments
for making the development role more wide-spread and effective.
4.1.1. General Manager
Each DIC is headed by a General Manager who is responsible for the
overall coordination and development of SSI including village industries in the district
and ensure the implementation of action plans drawn up for promoting and developing
small scale, cottage and village industries in the district. General Manager is the
kingpin of the DIC programme. He has to provide leadership to the team operating
under him. He should be an effective instrument in initiating the massive programme of
rural industrialisation and identification of growth centres in the district.
Four functional Managers assist the General Manager. They look after four
disciplines, viz (i) Economic Investigation - Information & Infrastructure (2) Credit (3)
Raw Materials & Marketing (4) Village Industries & Training (VI&T). They are to be
assisted by Technical Supervisors, Assistant District Industries Officers and clerks.
Besides, in all DICs in Kerala there is a co-operative wing comprises of
Deputy Registrars, Assistant Registrars, Senior Co-operative Inspectors and Junior Co
operative Inspectors. At Taluk level, there is a Taluk Industrial Office, which helps
DICs in their functioning.
4.1.2 Manager Economic Investigation, Information & Infrastructure (EI, 1&1)
4.1.21. Functions and duties
4.1.211. To conduct the survey of industrial potential of the district with a view to
make fuller and better utilization of the available raw materials and skills
and creation of maximum employment opportunities.
4.1.212. To prepare action plans for future development of the district.
4.1.213. To coordinate with the existing medium and large scale industries
4.1.214. Disbursing various incentives and subsidies to eligible units.
94
4.1.215. Collection, storage and dissemination of vital information relating to the
industrial activities in the district.
4.1.22. _0bservations
Thus an examination of the performance of El1&I Manager brings out the
following observations:
4.1.221. The manager EIl&I is burdened with too many functions and responsibilities to
be discharged.
4.1.222. Most of the time, manager is engaged in compilation and filling up of elaborate
statistical retums and preparation of progress reports.
4.1.-223. Very often action plans are not implemented properly and timely.
4.1.224. There is neither scientific methodology nor norms followed in the preparation
of industrial surveys and action plans.
4.1.225. The EH&I manager is not vested with enough power, to provide power, water,
factory accommodation etc. His power is limited in recommending and
pleading with the departments concemed.
4.1.226. The people appointed as managers (EII&I) are mostly promoted from the
department of industries having no personal zeal or motivation to do good
work. They lack the necessary technical expertise and carry on their activities
as matter of routine that defeat the very purpose.
4.1.23. Recommendations
4.1.231. The manager EII&I should be assigned the responsibilities of only economic
investigation and entrepreneurial guidance and be relieved of other
responsibilities.
4.1.232. Scientific techniques and methodology are to be developed and vigorously
followed for preparing industrial potential surveys. action plans, bankable
projects etc.
4.1.233. Enough powers should be delegated from various departments like KSEB,
Municipality, and Water Supply Department etc. to the General Manager of DIC.
95

O
4.1.234. Proper facilities and enough number of assistants should be kept at the disposal of
the manager (EH&I) for proper documentation and upkeep of records in the DIC.
4.1.3 Manager-Credit
4.1.31. Functions and duties
The important functions and duties of the Credit Manager are the following:
4.1.311
4.1.312
4.1.313
4.1.314
4.1.315
4.1.316.
4.1.317
To prepare annual credit plan for the industrial development of the district.
To coordinate the lead bank in the district this is also charged with the
responsibility of preparing credit plans for the entire district. That is credit
manager has to see that the credit plans prepared by the lead bank for industrial
development synchronize with the credit plans prepared by the DIC.
To ensure that the various commercial banks implement the credit plans of the
lead bank.
Lapses in the implementation of credit plans by the commercial banks should
be brought to the notice of District Level Consultative Committee.
Identification and rehabilitation of sick industrial units is yet another area to
which the credit manager has to attend.
Sanctioning and disbursing of seed money / margin money assistance to the
beneficiaries.
To help the beneficiaries, who are incapable of filling up the application form
and those who are not in a position to fulfil the cumbersome formalities ofcredit.
4.1.32. Observations
From the observation and analysis the following issues emerge:
4.1.321. The credit manager often fails in preparing realistic action plans and credit
plans.
4.1.322. There is lack of co-ordination between the DIC, Lead Bank and other related
agencies.
96
4.1.323
4.1.324
4.1.325
4.1.326
4.1.327
4.1.328
4.1.329
The credit plan prepared by DIC and the Lead bank is not in conformity with
each other.
The credit managers are helping the beneficiaries only in filling up the
application form rather than in assisting them in securing credit from banks.
There are no scientific criteria adopted in conducting project appraisals thereby
leading to ambiguity and large scale rejection of application by the banks.
Bank officials complained that the DICs are not nelping them in the recovery
of loans and also in monitoring the utilization of credit leading to misuse. The
credit managers, on the other hand, complained that the beneficiaries are not
co-operating with the DIC officials, once the credit is sanctioned and the unit is
launched.
Most of the beneficiaries complained that they have to approach the banks
directly and make their own arrangements to secure the credit. They opined
that the DIC has become yet another hurdle in getting loan assistance.
Banks are sanctioning loan assistance to units situated in and around the urban
centres and credit is not flowing in to backward and rural areas.
There is concentration of credit amongst the larger of the small-sized units and,
moreover, banks are insisting on collateral security.
4.1.33. Recommendations
4.1.331
4.1.332
4.1.333
4.1.334.
4.1.335
Credit managers should maintain proper liaison with the lead banks and
prepare the credit plans in coordination rather than in isolation.
Scientific criteria should be evolved for preparation of action plans, credit plans
and also for project appraisals.
Non-implementation of credit plans should be viewed seriously.
RBI should further liberalize the sanctions of credit and see that the banks do
not insist on collateral security.
The SS1 units who avail bank credit should be compelled to get their balance
sheets audited by qualified auditors and submit a copy of the auditors report to
97
the DIC. If necessary statutory compulsion should be introduced. This will
ensure proper utilisation of credit.
4.1.336. For proper distribution of credit among different blocks in the district the credit
plans should be bifurcated and targets fixed for each block making sufficient
provision for development of backward blocks in the district.
4.1.4 Manager Raw Material and Market (RM&M)
4.1.41. Functions and duties
4.1.411. To prepare the resources data and all statistics pertaining to raw materials,
marketing machinery and equipment.
4.1.412. To identify the availability of raw materials within the district and also the
neighbouring areas of the district.
4.1.413. To establish close liaison with managers of EH&I and credit.
4.1.414. To establish close liaison with SIDCO, NSIC, SISI and other agencies.
4.1.415. To assess and monitor the smooth and equitable distribution of scarce and
imported raw materials to all SS1 and rural industrial units.
4.1.416. The manager (RM&M) should arrange for the establishment of at least one raw
material depot by SIDCO in the district and watch their proper utilisation
4.1.417. He should conduct market intelligence surveys and identify the products for
which the demand exists in the district.
4.1.418. To devise appropriate marketing strategies for selling small industry products
manufactured in the district.
4.1.419. Assisting small entrepreneurs in identifying and procuring the appropriate
machinery and equipment.
4.1.420. Identify technological problems faced by small industrialists and assist them in
finding solutions.
4.1.421. To help unitholders in obtaining machinery under hire purchase scheme of
NSIC and KSIDCO
98
O\@\()
4.1.422. To organize industrial co-operatives to ensure the flow of raw materials,
machinery and marketing assistance to the smallest of small entrepreneurs and
artisans.
4.1.42. Observations
4.1.421. DICs do not have accurate infonnation about the availability of raw materials
within the district.
4.1.422. Raw materials service centres are ineffective and could not supply critical raw
materials at the appropriate time and the required quantity.
4.1.423. The lists of suppliers of raw materials and machinery available with the DICs
have become old and obsolete. So the beneficiaries were not in a position to
get correct infonnation about the suppliers.
4.1.424. The Manager (RM&M) reported that the inordinate delay in the supply of raw
materials in due to the non-availability of these resources with RMSCs.
4.1.425. The marketing assistance rendered by the DICs is also not upto the satisfaction
of the beneficiaries. Some of the state government departments are issuing
open tenders for the purchase of various commodities, which are cornered by
the large industrial undertakings.
4.1.426. Some entrepreneurs complained that they were not in a position to deposit the
eamest money deposit to the government departments.
4.1.427. Some entrepreneurs complained that the Price Preference Scheme was not
helpful to them as their products were rejected on the grounds of inferior
quality.
4.1.428. The- entrepreneurs who were fortunate in getting the government orders for
their products complained that there was inordinate delay in receiving the
payments from government departments for their products; they have to go
from pillar to post for getting payments, even by leaving the factory work.
4.1.429. In the case of the supply of machinery and equipment the DIC assistance also
seems to be very little. §\\‘“lH3O3 *gr4-di
‘.
\O\O
"§Q$ 4:05?
ZZU Z39 “ @4393
at I Q‘$9 ~e~&&¢?!] A _$‘$3*$‘
Noiotst
4.1.430. The hire purchase scheme of NSIC and KSIDC is also not considered attractive
by the small units, as they have to deposit the eamest money, bank guarantee
etc. in advance. The cost of the machinery supplied to them is also very high
as the transit charges and demurrage charges were also included in the cost of
the machinery. Some of them complained that the price fixed for the
machinery by NSIC and KSIDC is much higher than the actual price of the
machine in the market.
4.1.43. Recommendations
4.1.431. The DIC should immediately update the data regarding the availability of raw
materials.
4.1.432. The DICs should persuade the KSIDC to establish Raw Material Service
Centres (RMSC) per district with one or two branches at the block level and
ensure adequate suppliers or raw materials based on the estimated requirements
of the units.
4.1.433. The practice of advanced payments for raw materials should be dispensed with
and substituted by payment at the time of delivery of raw materials.
4.1.434. Delays in the supplies of raw materials should be avoided and the transport cost
of bringing the raw materials to the raw material service centres should be
borne by the government itself.
4.1.435. The Manager (_RM&M) should periodically inspect the units and ensure proper
utilization of scarce raw materials.
4.1.436. The government departments should be strictly instructed to purchase the
materials in the reserved list of the SSI and artisan units and any violation
should be viewed seriously.
4.1.437. DIC should establish their own Quality Control Mechanism and the SS1
products tested and certified by the DIC should not be rejected by the
government departments.
100
4.1.5 MANAGER Village Industries & Training (VI&T)
Manager (V I & T) is specially designed to look after the needs of cottage
and village industries. He is supposed to look after the activities dealt with by
organizations of handlooms, handicrafts etc.
4.1.51. Functions and duties
4.1.511
4.1.512
4.1.513
4.1.514
4.1.515
4.1.516
4.1.517
4.1.518
To prepare block level surveys on artisan activities, focussing on the problems
faced by individual artisans, trades and crafts man, type of assistance needed,
scope for upgradation of technologies. tools and equipments needed and
opportunities for diversification and enlargement of markets served by them.
The Manager (V I &T) assists the beneficiaries by processing their applications
for assistance and forward them to the appropriate agencies like KVIB,
Directorate of Handlooms and SC/ST Corporations etc.
He assists DRDA in the implementation of IRDP/TRYSM, JRY, and in
identifying the beneficiaries for assistance and helping them to set up industry.
He is also vested with the responsibility to look after various training
programmes under self-employment schemes and artisan and entrepreneurial
development programmes.
He enables the beneficiaries to take up self-employment avenues and helps
them to cross the poverty line.
He is also charged with the responsibilities to look after RIP and RAP.
He has to co-ordinate with various agencies like DRDA, KVIB, SISI," SC/ST,
Corporations etc.
It is the responsibility of the manager to help KVIB & DRDA in the
preparation of imiovative schemes / projects. In this area not much headway
has been made, as most of the assistance provided to the artisans isconcentrated in the traditional industries.
101
4.1.52. Observations
Some of the artisan beneficiaries have complained that there was
proliferation of too many institutions like DRDA, KVIC, SC/ST and Backward
Community Corporations, DIC, etc. As a consequence they were confused as to which
agency they have to approach for assistance.
Another lacunae observed during the research Survey is that Manager (Vl&T)
have not conducted any survey at the village level to identify village craftsmen and
artisans for assistance. But assistance was rendered only to those who approach DIC.
But Extension Officers (EOs) explained that the intensive campaigns undertaken by them
at the village level to bring the artisans at a common place and inform them about the
assistance available from DIC and other agencies was a failure due to poor response.1
4.1.521. Not much co-ordination existed between DIC and agencies like DRDA, KVIB,
SC/ST/BC Corporation.
4.1.522. The Manager (V I & T) failed in preparing any imiovative schemes ofassistance and assistance was concentrated in traditional industries and
products.
4.1.523. Existence of too many agencies to assist village industries, artisans and socially
depressed classes added confusion.
4.1.524. The tools supplied to the beneficiaries are outdated and are not suitable for
product diversification.
4.1.525. The subsidy provided to the trainees is too meagre and training at far away
places dislocated their regular work.
4.1.526. The industrial units to which the trainees were assigned were misusing them to
extract routine work than providing training.
4.1.527. Intensive campaign has not succeeded in attracting large number of ruralmasses.
4.1.528. Inordinate delay in providing subsidies and other assistance by the DICs were
reported by the beneficiaries.
102
4.1.53. Recommendations
4.1.531. For effective functioning of the Manager (VI&T) there must be proper
delegation of powers and greater co-ordination among the manager (Vl&T)
and the other agencies working in the fields of rural industries.
4.1.532. There is a proliferation of too many agencies leading to confusion and the
single window approach has not taken root in rural industries. This calls for
establishing yet another agency at the block level, with proper delegation of
powers from all the related agencies, which should act as a single window.
4.1.533. Whenever the DIC assists the beneficiaries under different programmes in the
form of loan, subsidy, tools etc. the assistance should be given only to those
beneficiaries or units, which produce non-traditional products for which the
ready market outlets exist. Assistance for producing traditional products is no
answer for uplifting the rural poor and for bringing them above the poverty
line. If possible, research institutes should be set up exclusively for the
purpose of developing new products and innovating new techniques.
4.1.534. Training to rural youth/artisans under different programmes should be provided
within the village without dislocating their regular work and suitable incentives
should be provided.
Mini Industrial Training Institutes (ITI’s), and Co-operative Production
Centres should be established at block / village level. Mobile Training units / vans like
SISI mobile training units will be of great help in this respect.
4.2. Performance of DICs in Kerala - A Macro Analysis (A Non-theoretical
Analysis based on Secondary Data)
This part deals with the progress of DICs and their achievements based on
the analysis of secondary data. An attempt is made to make a comparative assessment
of the working of DICs at the all India level vis-:21-vis Kerala. An analysis of inter
regional and inter-district perfonnance in the state is also attempted.
The DIC concept has come into prominence in India through the Industrial
Policy Statement of 1977 and the Central Government subsequently issued guidelines
103
for establishing DICs in the states. In Kerala the DIC programme was implemented
with effect from 1978.
The rationale behind establishing DICs is to make district a focal point of
industrial development. The DICs are supposed to assist the growth of industry in the
district with special emphasis on cottage, village and small scale industries. They are
expected to provide a host of services in order to facilitate the growth of small industry.
The extent of success of the DIC programme in assisting the SS1 sector can
be noted by looking at the number of SSI units established, employment generated and
investment made which were collected for the period from 1956 to 2001. In order to
know the growth of the small industry before and after the establishment of DICs the
time period has been classified into two periods, i.e., 1958--78, 1979--2001. The first
period indicates the growth of small industry in the state under the pre-DIC period and
the second period 1979-2001 represents DIC period. On the basis of this data it is also
attempted to identify whether any structural changes occurred in the growth of SSI, after
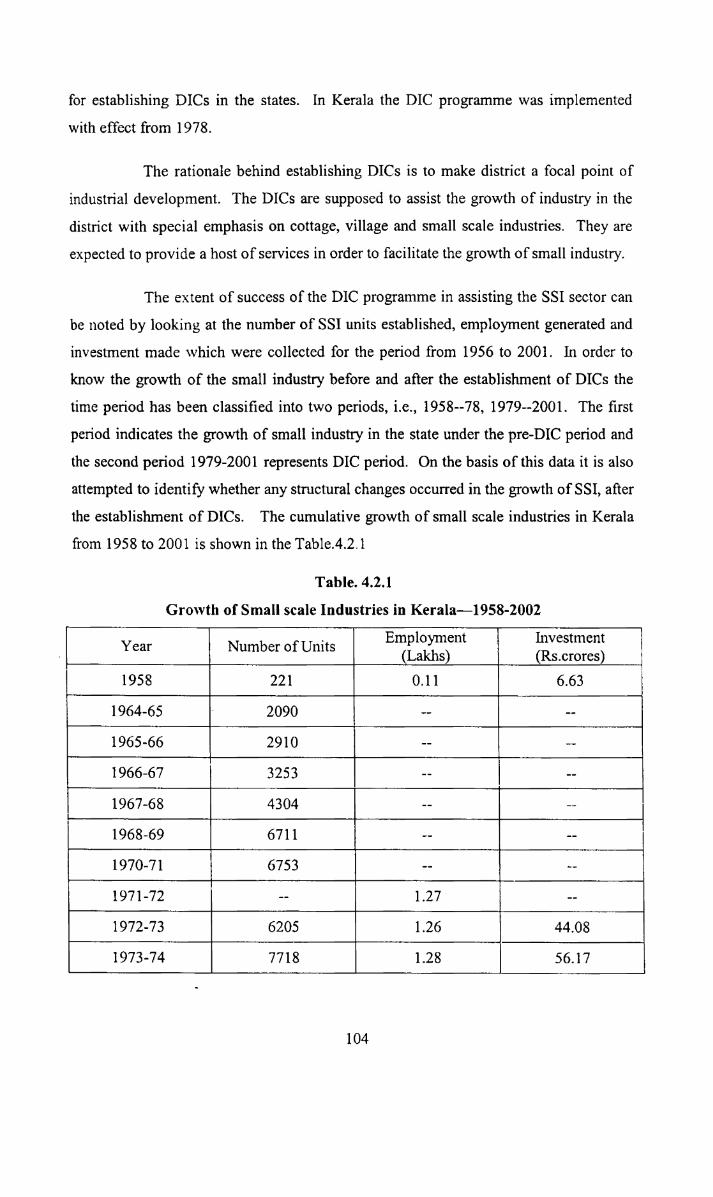
the establishment of DICs. The cumulative growth of small scale industries in Kerala
from 1958 to 2001 is shown in the Table.4.2.l
Table. 4.2.1
Growth of Small scale Industries in Kerala-—1958-2002
Year I Number of Units Employment Investment| pg I g(TLakhs) 1' (Rs.crores) I
I
1958 221 0.11 663 5!
J
1964-65 2090
1965-66 2910
1966-67 3253 7- 7
1967-68 11304
7'1“
1968-69 6711.i
1970-71 76753
1
1971-72 -- 1.27 I‘; -1972-73 6205 1.26 ' 44.081973-74 7718 1.28 56.17
104

1
_1
19741-75 9105-.1
q-gm -._I
|
_1
1975-76 9377 1.321
g-an
1
1976-77 10873I
2.16,1
I
1977-78* ‘1
121181
1 1.32 76.800
.
|T_...__.
1979-8F1 15974 2.04 190.82
fii -_-
T _____
0
1980-81 18954 2.39 228.01
1
1981-82 21977 1.60 249.08
1982-83 24884 1.83 273.11
uh;
1983-84 28117 2.12 302.32
,_., —
>
|
1
1984-85 31499 2.35 335.08
1985-86 35365 . J2.63 384.91
ii-—v——-—
1986-87 40342 2.93 451.6
1987-88 47191 3.32 546.01 1
1
1988-7897 55427 333 659.67
1989-90 63968 4.22 773.81I
1
1
1990-91 73522 4.65 871.83 1
1
1991-92 84460 5.27 1002.89
1992-93 958718 5.68 1127.91
1 104041
1
'| 5.29 1175.15
1 _. . +*.—.*__—.;_-_~ -- -~ '-~_~__—_n-,-_>:_ -_;:—_ 7-1: -' '-‘mfi ' ~_'~_ '1 7_'"“TI7' ' ' -71993-94'
125910 7.03 1367.331994-95 1 7 1
, ——4_i
1995-961
1
1
143123 7.75 1591.87
1996-97 160544 8.40 1922.69
1997-98
1199836 1
180097
199827
1
1
-I
9.10
9.81
1
2351.33
2653.43
._ .1
11 999-2000 220068 10.54_,.i____ ——
3050.96
1
‘*1
2000-2001 240141 11.15 3467.61 1
Thiruvananthapuram
105
1 ___Source: Compiled from Economic Reviews of various years, State Planning Board,
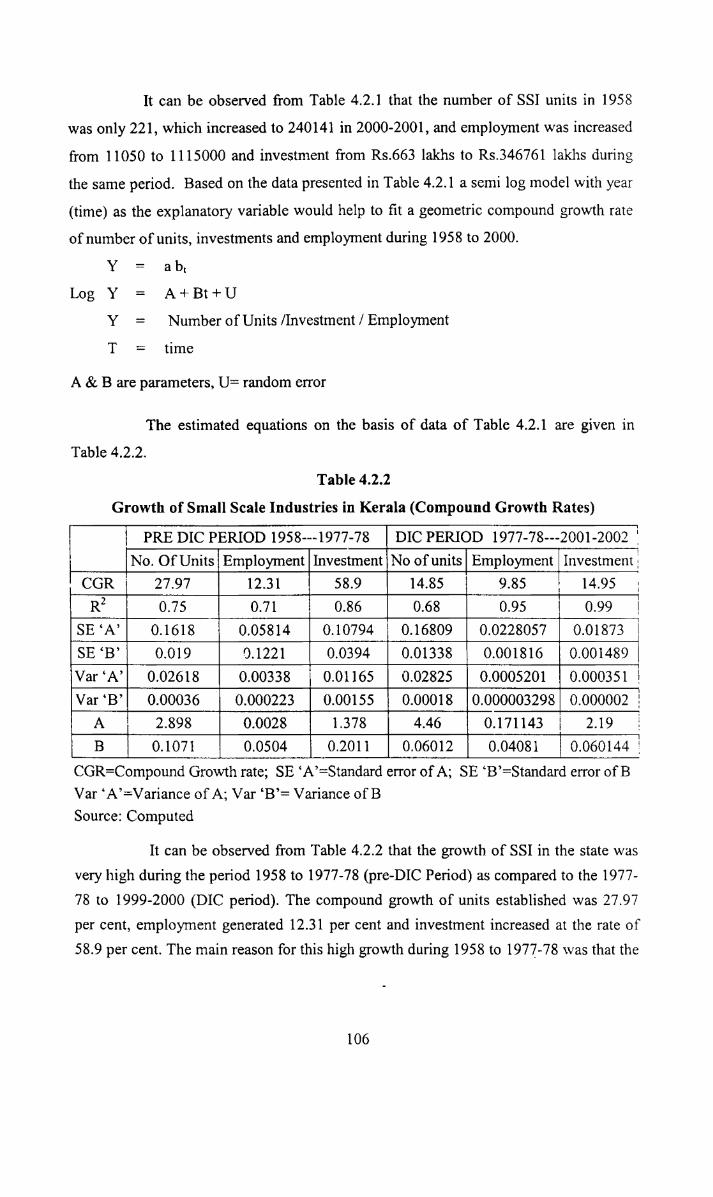
It can be observed from Table 4.2.1 that the number of SSI units in 1958
was only 221, which increased to 240141 in 2000-2001, and employment was increased
from 11050 to 1115000 and investment from Rs.663 lakhs to Rs.34676l lakhs during
the same period. Based on the data presented in Table 4.2.1 a semi log model with year
(time) as the explanatory variable would help to fit a geometric compound growth rate
of number of units, investments and employment during 1958 to 2000.
Y a biLog Y A + Bt + U
Y
T:Number of Units /Investment / Employment
time
A & B are parameters, U= random error
The estimated equations on the basis of data of Table 4.2.1 are given inTable 4.2.2.
Table 4.2.2
Growth of Small Scale Industries in Kerala (Compound Growth Rates)
PRE DIC PERIOD 1958---1977-78 DIC PERIOD 1977-78---2001-2002“
.,,_k-is
___ 4 .
i
.
.
1
I
1
1
l.l
1
i
|
11
1
1
1
1
1
1
1
l
1
p No. Of Units ll Employment Investment i No of units i Employment InvestmentI .. 2 .- QGR ‘ 27.97 A 12.31 58.9 A 14.85 9.85 14.95
.9soso
7 R---» 0-75 0-71 i 0-00 0-08 M0-.95813 ‘A’ 0.1018 1 0.05814 0.1g0794_7_g0.1g6809 0.0228057 0.01873SE‘B’ 0.019 0.1221 0.0394 0.01338 ‘y 0.001816 7 0.001489
!'Var‘A’\ 0.02618 0.00338 10.01165 0.02825 0.000520110000351Var *135=0.00036_ 1 0.000223 _ 0.00155 3 0.000180.000003298 0.000002
eal
1
_______1_.____._
F‘)1-~\O
L13 0 0.1071 l 0.0504 0.2011 0.06012 ' 0T040i8ilM 0.060144ly A71 2.898 0i'lll0.0028T'i 1.378 l 4.450 l 0.171143CGR=Compound Growth rate; SE ‘A’=Standard error of A; SE ‘B’=Standard error of BVar ‘A’=Variance of A; Var ‘B’= Variance of B
Source: Computed
It can be observed from Table 4.2.2 that the growth of SSI in the state was
very high during the period 1958 to 1977-78 (pre-DIC Period) as compared to the 1977
78 to 1999-2000 (DIC period). The compound growth of units established was 27.97
per cent, employment generated 12.31 per cent and investment increased at the rate of
58.9 per cent. The main reason for this high growth during 1958 to 1977-78 was that the
106
1
state was in its fonnative stage and there was a strong industrial base in Travancore
Cochin area and the importance given to industry in the Second Five Year Plan. The
other obvious reasons for phenomenal growth in small scale sector was the satisfactory
performance of agriculture and the existence of better power surplus.
During the period 1977-78 to 2000-2001, i.e. after the DICs came into
existence, the growth of SSI sector did not show a better perfonnance, though itprovided many incentives and assistance under a single roof. In this period the number
of SSI units increased at a compound growth rate of 14.85 per cent only, as compared to
the 27.97 per cent during the pre-DIC period; employment in the DIC period increased
at a rate of 9.85 per cent only as compared to the 12.31 in the pre-DIC period; and
investment at current value increased at the rate of 14.95 per cent in the DIC period, but
during pre-DIC period, it increased at the rate of 58.9 per cent. Thus in the case of
investment also pre-DIC period showed a better performance compared to DIC period.This is due to the increase in the investment levels in the definition of small scale
industries from five lakhs in 1950 to 300 lakhs in 1997 and reduced to 100 lakhs in
1998. This resulted in more capital-intensive units coming under the purview of small
scale industries during the pre-DIC period.
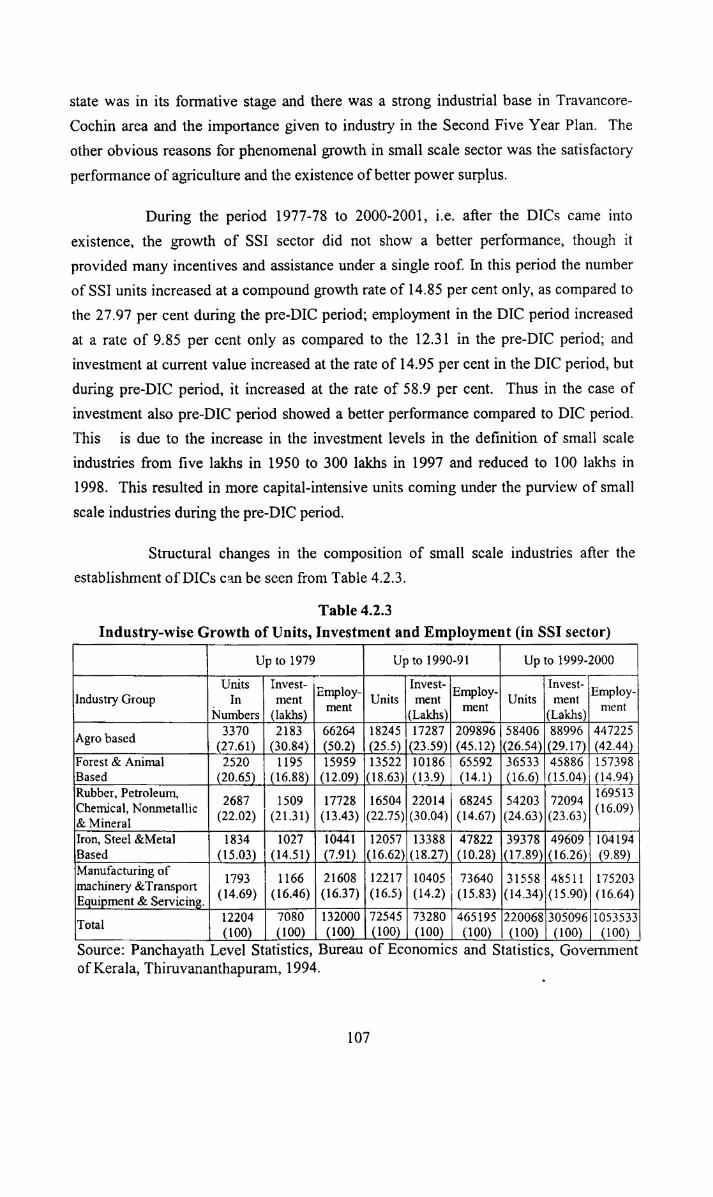
Structural changes in the composition of small scale industries after theestablishment of DICs can be seen from Table 4.2.3.
Table 4.2.3
p Industry-wise Growth of Units, Investment and Employment (in SSI sector)— 7:’ VT: "‘ ‘L 5| ' - -r irrwim“ ' 11 Up to 1979 1 Up to 1990-91 Up to 1999-2000
1 _, Numbers g, _(1§1g15) 1 (Lakhs) "‘°“ . (Lakhs) ‘“e“‘
__ _ 7 Tjnits Invest- i 1 1 InyeSt0;:1_—“i—m7 1.InduS11')' Group 1 In ment En1_;1:3y_ Units! ment Empkly Units 1 ment ‘Employ
A mbased 3370 2183 166264 18245117287 2098961558406 88996447225)1 g )_,(2].61) ((30.84) 1’ (50.2) (25,.;5),_g(23.59)\, (45.12) 1(26.54)(29,17) (42.44):Forest&Animal 2520 1 1195 115959 f 13522 10186 1. 65592 365331458861 157398Based (10-§§l,_§i.(16-88) .(1-109) (18-63) .(..1..3a-.9) (14.1) (16-6) ‘.1115-050.1(1.4-94)Rubber, Petroleum, _ '17 1 5 1 169513 1Chemical Nomnetamc 2687 1509 17728 16504 22014 68245 54203 172094&vMinem’] A (22.02) (21.31) (13.43) (22.75)p(30.04) (14.67) (24.63) (23.63) (16091.1166, s1¢61&1~/16161 1 1834 1 31102771044107120571 13388 T417822 1139378 496091 1041941
Manufacturing of T 1 1 _machinery &TranSpOl_t 1793 1 1166 21608 12217 . 10405 _ 73640 31558 . 48511 175203EqgiPmnt&SeWicing_ (14.69) (16.46)(16.37),(16.5) (14.2))(15.83) (14.34)1(15.90)(16.64)Total 12204 708703 13200017254573280746519522006853050961053533
1
194564 -0593.) 1 11.4-.§.11...17_~_9_.1_).-116.62>.<18-17100.28) 11.1]-89> (16.26)) (9-89) =
. _ (100) -__(100) , (100) 1. (100) (100) . (100) (1.00) 1(100) (100)Source: Panchayath Level Statistics, Bureau of Economics and Statistics, Governmentof Kerala, Thimvananthapuram, 1994.
107
A close look at Table 4.2.3 indicates that agro-based industries and forest
and animal-based industries together accounted for 48.26 per cent of units, 47.72 per
cent of investment and 62.29 per cent of employment as on 31-3-1979. In other words,
nearly half of the industrial activity was dominated by these two sectors. But by 1999
2000 it can be observed that the percentage of units in these industries showed only a
slight change; their share is 43.14, 44.21, and 57.38 per cent in the case of units,
investment and employment respectively. In the case of Rubber, Petroleum. Chemical
and Non-metallic, Mineral industry it is 22.02 per cent of units, 21.31 per cent of
C.‘
pi.L)J;L.)
“Ci
investments an er cent of employment as on 31-3-1979. But this increased
only to 24.63 per cent of units, 23.63 per cent of investments, 16.09 per cent
employment as on 31-3-2000; i.e. significant shifts cannot be observed in this sector
also. The shares of Iron and Steel and metal-based industries and manufacturing of
machinery and transport equipment and servicing and repairing industries have also
showed a slight increase in case of all the three indicators between 1979-2000. Thus, it
can be inferred that, agro-based and forest and animal-based industries constitute nearly
half of the total industrial activities. Thus after the establishment DICs, it failed to make
a structural shift in favour of industries other than agro-based and animal and forest
based industries.
Evaluating on the basis of growth of small industry, the researcher felt that
the performance of DICs are not satisfactory. To evaluate DICs only on the basis of
growth of SSIs may not be adequate: because, the DICs are vested with numerous
responsibilities for facilitating growth of village, cottage and SS1 units. However, to
evaluate the performance of DICs no objective criterion is readily available. Through
informal discussions with the officials of the DICs and other academics the researcher
has identified nine indicators to assess the perfonnance. The nine indicators are:
1. The number of entrepreneurs identified
2. The number of new registration given
3. The number of project profile prepared
4. The number of units provided with technical assistance
5. The number of artisan units established
6. The number of SSI units established
108

7. Additional employment generated
8. Amount of credit assistance given
9. Amount of subsidy sanctioned.
To assess the performance DICs in Kerala, a comparative study has been
made at all India level. For this purpose the secondary data published by Development
Commissioner, Small Scale Industries (DC, SSI), for the period of 1980-81 to 1995-96
has been collected for the all India level and data for Kerala was collected from the DIC
offices for the same period. Table 4.2.4 presents achievement of DIC in terms of all the
nine indicators for the period of 1980 to 1996.
It can be noted from the Table 4.2.4 that the number of entrepreneurs
identified. SSI units established, New provisional registration done, Credit provided,
Additional employment generated, project profiles prepared, and technical assistance
provided out of nine variables, eight mentioned is less in Kerala when compared to the
All India average for most of the years. As regards the cash subsidy in ’8l-82, ’82-83,
’84-85, ’85-86 and ‘94-95, Kerala averages per DIC are higher than All India DIC
averages. This shows that in terms of eight variables Kerala DICs performance is much
lower than All India performance of DICs. But in the distribution of subsidies, Kerala is
somewhat at par with All India averages of DICs. This may be due to the misutilization
of subsidies. The poor performance of DICs may be due to non-existence of trained,
experienced and skilled functionaries in the DICs in Kerala.
Standard deviation and coefficient of variations were calculated for all the
nine selected indicators, both for all India as well as Kerala and presented in Table
4.2.5. It can be observed from table 4.2.5 that the average performance of DICs in
Kerala is much less than that of the DICs at all India level. Table 4.2.5 also reveals that
the all India achievements of DICs show much consistency, as the co-efficient of
variation in relation to the majority of indicators is less than that of Kerala.
109

Table 4.2.4
Physical Achievements of DIC Pr0gramme--- All India & Kerala(Average per 11101,- eidentifiedei egistration, shed ' F \ e
1 1 ‘ E 1‘ ‘ W|ENo'0f JSSI units PNCVY A6t1.S?n Credit Additional‘! Cash ‘Project Technica11A niifien Estab1- 1, 521:3‘ ‘ESt:};l?S_ Provided Employmen Subsidy Profiles Asstances%
1ished 1R A Rs crorese Generated 1Rs crores[Prepared1 provided1 ,1 1 , 1 71”’ :v AI -KL AI KL- AI KL 1AI KL AI KL AI KL 1AI KL1AI KL1AI1KL11 ' 1 1
12381 NA NA\9651 NA NA NA 1179,NAp.75 NA 1, 792 M NA NA NA NA1NA NA NA1 11 1 1 1 11'19-80LNA 1NA1053 NA 1, NA NA 403879607 NA 17741 NANANANANA NA 1 NA11 1_.._11 A re" 1 he in 1 1 180-811 767 NA’11l721275 14731 NA »466i4121.75 NA 3973 NA 1.23 .19 254é122
1_._. ,524 95 1
1
1' 1 118 ,289 174 5661 88
2-831
81-82 706 QNA 13582741565 NA 61815301 1.1 NA142101 2343 .14 .
929 NA’ 1242 1712 NA 740 56561 42‘ NA 1 141 115451- 1 . 1 1 4990 20021. . 1 11
1913361971107 1041 1 I _. _ 1 i_ ._ ._ ._ _ .__ .-_ . _--____-_- .11 .1 1, ’ 1 ---~~ -22 4961168 108‘, 1093-8411302 6581723 24917601 NA 690605115 NA 5496 22131 23
-85. ——- -1 - - F----~ 1 5 . 1 1111-4 41 __. T 1 1
H131556561190112421964.NA72017921.5-111.0157791686.191.24 552 2341128 1191
5-8611691736 149 276 1 811 668 9 \ 221 1 2937* 1540 .79, .8 724219701. 335641215121120
i ___ _ 1. . 1 _ ._____7‘_ 1 1 1' . _ t __.__\.._ _ 1 1 1t 1'. _..._.__._ __ .1 . I. ___.__ .1 5 '1
7-886-8712201501E2633562895 869 754,777 .13 .98 712812133 NA; .43 iNA254i 74 112“
12548612500 489 27681 854 851338 .59 NA 16325 27321NA .38’NA203 13611281- 1
7 1
_2“. 1.. H2t-._ A ' 1 i 1 ._.A.2__- .M.l _ LAM 1 .____ ___"W" _ 1 _ ‘ 1__H-M5 . . ‘‘A 1. , 1 E . 1 1 18-891256~NA'277215882938, 894 713 4443.141 NA 737312941 NA1.45 1NA2641241,1591
9-901204,NA3002|590 3102“ 921 7136411409 .95 .7745 3063,54 .48 58912881196 1680-91
I
1
1156 574 \ . . _. . 1 1 . - » a ~ -~~--——~--1.-—— .-.._..._.__-1 .. . . . :132651, 632 P3488 984 1742 360 0311.338 7868113771 .62 1.53 1614 254 2031 17?..__i§'—' -— e 11 - ' - ' --~— —~ ._.__....1 . .. :1 111 86116823111381 F11-9211079 .356J3533 780 36991174 769251P3.9711.575 7913 3615.55 .5212-93 977 279 1V __ .._ .. .. .. .. .. 1 . . :1 ‘ _1 1 1 " '
‘$868,815 1399911171770 203 3.916851827714353 1.59 .56 679 1761' 256 171__.. .1 1 I 11 1
_L
1 ll.__ _.... l 1 1'1
3-941984 124241501038 4344? 1260 784.‘ 55 43.871644! 8881 5258 .61 571568 349 277189!4-951050544]-15701113.4610 1522 ,796 66 ,3.921.725£9651 5127.65 .66 6401392264144
I95-96, 950 853148011230 49041 17727661143’3.9811.94l NA 14619 .671.65 i593 284 NA 182
. . . . _ .. _.... .. _ _ ._____..____ _____. ____......._._____. __ _ ..._J.__ 1- '-— F - Q: 1 P 7————~ ~"- —'-'-- -~
F96-97 973 1883 503902-14]15143,1849 NA NA1NA1.842 NA 50191.71 .69 637,197 NA124197-98, 989 77653211396 5439 1977 NAKNANA1719 NA 1 547 .68 -52 NA 199 NA 1961
7___ __ _, _ _ M77 _ . 1 .|- - --_-_-_-HT__i7%__7___-___- ---_----_---- - - - 1 - 1
1 8-99 NA 856 NA 14091 NAJ2l08NANA1NA 1.614, NA 5146 ,NA .45 NA176 NA .11471
9-001 NA 91 171 NA 1429 NA“2077NANA NAl.603 NA 14354NA-NANA1871NA 210
0-01 NAM1631 NA 11433 NA NA NA NANA 1.669 NA NA NANANA,NA NA 1 NASource: 1 A11 India data are compiled from, Development Commissioner, SSI, Dept. of SSI,
2.
A&RI, Govt. of India, New Delhi, Jan.1994 and from Vasant Desai, Management_o_fsmall- scale industries,_S. Chand. Publications, 1995, P.P.10l.
Kerala data are compiled from Economic Reviews, 1978-79 to 2000-20018, StatePlanning Board, Thiruvananthapuram, and from the Progress Repoits of DICs in Kerala.
110

Table 4.2.5
Mean, Standard Deviation and Co-efficient of Variation
g For selected indicators (Kerala &All India) s it it 6 7S1. No. Indicators - n iAI /KL X ; SD CViit 4|
l
1 Entrepreneurs identified 13 AI 17 111° 127'71“'51I M M ._ KL ll 625 227.89 36.46)
____i-..,.,_i.-.->4-Q.
| ‘ ‘ A,.
2 New Registration (provisional) given 13 4‘ AI 3867 901'74i23'32g I KL 1271.415.s1l32.71,3 Project profiles pre- pared (No. Units) 14 AI 7 534 15315 2868. KL 225 679.46 35.32.Ii i ~ A A ' "I"i not .- I I r
‘ 4 Artisan units established KW 16NI‘2£ !252U;358;151;)997 . . 3049 *733.39 24.051L 5 SSIun1tsestabl1shed 18 I 657 386.6 5880
E2
4 1063 1475 20.856 6} |Additional Employment generated 14 308 p 1134 A 3 6.75
7 l§Technical Assistance Provided 7 15 . 228 i139'47i61'17ip lb 4 KL g 138 i79.46 35.32
Efii
|WU _ ,,, _ , __ __ _ _.__, I ..__._. . ..Ii ' G |- vat . . . 7 4 AI y 3.3 0.85325“;L 8 Credit Assistance given (Rs. Crores) p 10 KL 1 L4 0.357 $25.949 ‘ . AI 0.45337 0.22 48.22M yCash subsidy (Rs. Crores) g l5 KL p 0.435 I 0.183 42.0%KL=Ker§ja_ AI=A11 mdia My A A TWASource: Calculated on the basis of Table 4.2.4.
4.2.1. Achievements of DICs by Different Classes
The DICs were assigned a special responsibility to provide assistance
particularly to the SC / ST and other socially oppressed sections of the community and
also women entrepreneurs in order to enable them to take recourse to small industry and
to join the main stream in course of time. Hence detailed analyses of the achievements
of DICs of Kerala by classes are presented in Table 4.2.6.
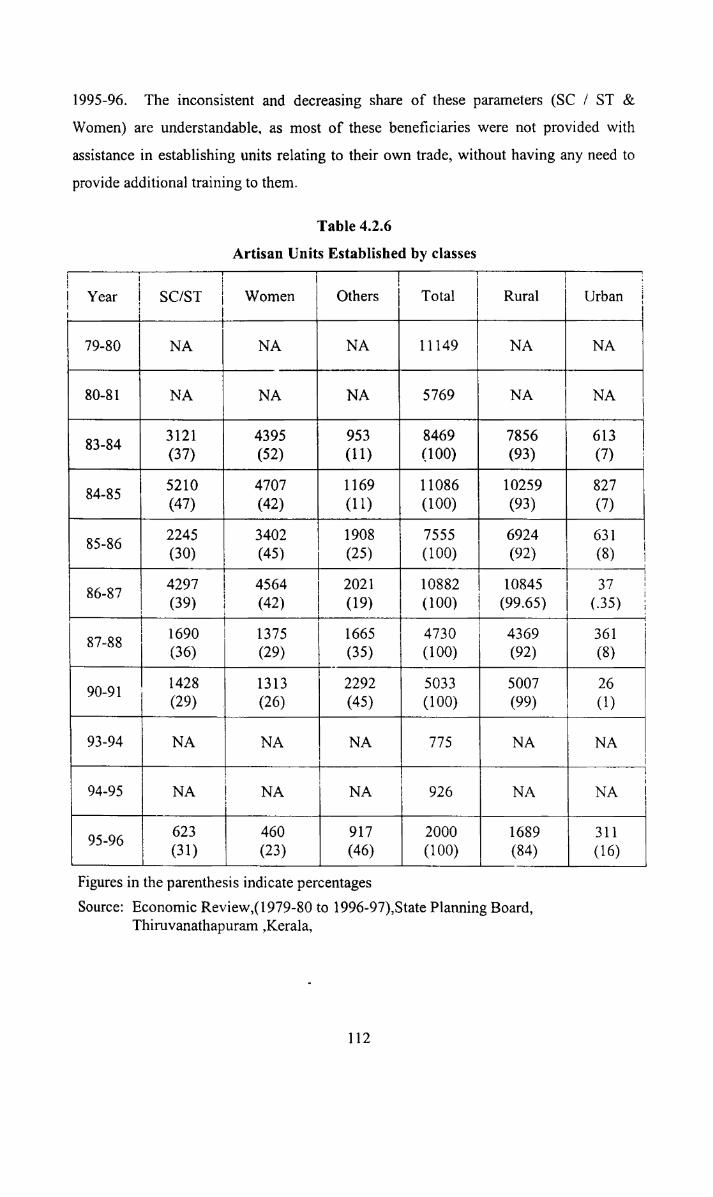
Table 4.2.6 shows the number of artisan units established by different classes. It
can be noted that the number of artisan units established has gone down steeply between
1979-80 and 1995-96, i.e. from ll 149 to 2000 units. Number of artisan units
established class wise, indicate that the share of SC /ST beneficiaries varied from 37 per
cent in 1983-84 to 47 per cent in 1984-85, declined to 30 per cent in 1985-86 and in
1986-87 it increased to 39 per cent. After that it declined to 31 per cent in 1995-96.
The women artisan units steadily declined from 52 per cent in 1983-84 to 23 per cent in
lll
provide additional training to them
Table 4.2.6
Artisan Units Established by classes
1995-96. The inconsistent and decreasing share of these parameters (SC / ST &
Women) are understandable, as most of these beneficiaries were not provided with
assistance in establishing units relating to their own trade, without having any need to
II1
¢_
Year
i
SC/ST
—“_1
i--w-—
Womeni
Others1
'Total
— — —¢-A-3 -1
T _I
Rural Urban
a-11 n in
1
79-80
44-1’;
NA
.
—-<-v
NA
1
NA 11149 NA NA
80-81 NA NA NA11
5769 NA NA
1
11
L.11
83-843121
(37)4395
1 (52)1 953
(11)
8469(100)
7856(93)
613
(7)
-ii-1?
84-85
1
I
1
1
5210(47)
4707(42)
1169
(11)11086
(100)10259(93)
827
(7)
85-862245(30)
_-w
3402(45)
1908
(25)
7555(100)
6924(92)
__ ___¢
631
(8)
i-.-n
1
1
1
1
1
1
86-871
4297(39)
-..-.---1-1-_-1
4564(42)
2021
(19)10882(100)
T‘1 10845
(99.65)1
37
(35)
87-881
1
1690
(36)
ii..
1375
(29)
‘NT1
1665
(35)
---—La-,
4730(100)
1
I1 4369(92)
361
(8)
1
I
1
1
90-911428
(29)1313
(26)2292 9(45)
5033
(100)5007
(99)26
(1)
1
93-94 NA NA NA_____g _ _H_lV_____
775 NA NA
-_..i_
1
94-95 NA
--_-i——.i
NA 1 NA1
1
I
1,
[1
1
926
1
1
I
NA NA
95-96623
(31)460 917(23) (46)
2000(100)
1689
(84)
311
(16)
Figures in the parenthesis indicate percentages
Source: Economic Review,( 1979-80 to 1996-97),State Planning Board,Thiruvanathapuram ,Kera1a,
112
I 11
Table 4.2.7
SSI Units Established by Classes
|| _ .I
I
Year 1 SC /ST Women 1 Others1
Total
1 1985-86 " gs), 112
(2103499(9010
3866
(100) ,11‘86-87 302
1 (61-97)130
A (262)1 4545
(9131)
T 4977(100)
‘87-88142
11 @108)690
(u107)6017
(87.85)6849(100)
1
1
1 88-89 1 473( ):575
293 74701 1
1% 78236
1 11 ~89-90 1 (578
1
‘.
(538)7248
(87.64)
I (3.56) T (90.69) (100)445 8271
(100)
1
‘90-91(610
1398)_579
1
.1
588(70)
7684(87)
0*. ;'
8847(100)
11 *7 7 7 71 191-92 339
(3101 7 780
(10)9799(90)
10918
(100)
‘92-93898
(81072669
(23107844(69)
11411
(100)
1 60994 1230
(8103742
(26109561
(66)14533
(100)
‘94-951053
(7.0)3619(23.0) 1
11164
(70)
I _15836
(100)
‘95-967267
(410
1
I
3711
(22)
12466
(74)16903
(100)
‘96-97
‘97-98
698(410883
(410
1
I
F1
1 1
3238
(19)4666(24)
13485
((77)13998
(72)
17421
(100)19547
(100)
1 -.___--it
I
1
‘98-99 565 0(310
4459
(22)
14712
(75)19736
(100)
1 ‘99-00 543 0
(310251
3929
(20)15534
(77)
20006
(100)‘00-01
(110 _1.
3304
(17)16518
(82)
20073
(100)Figures in the parenthesis indicate percentages.Source: Economic Reviews, 1985 to 2001, State Plamnng Board, Thiruvananthapunn7
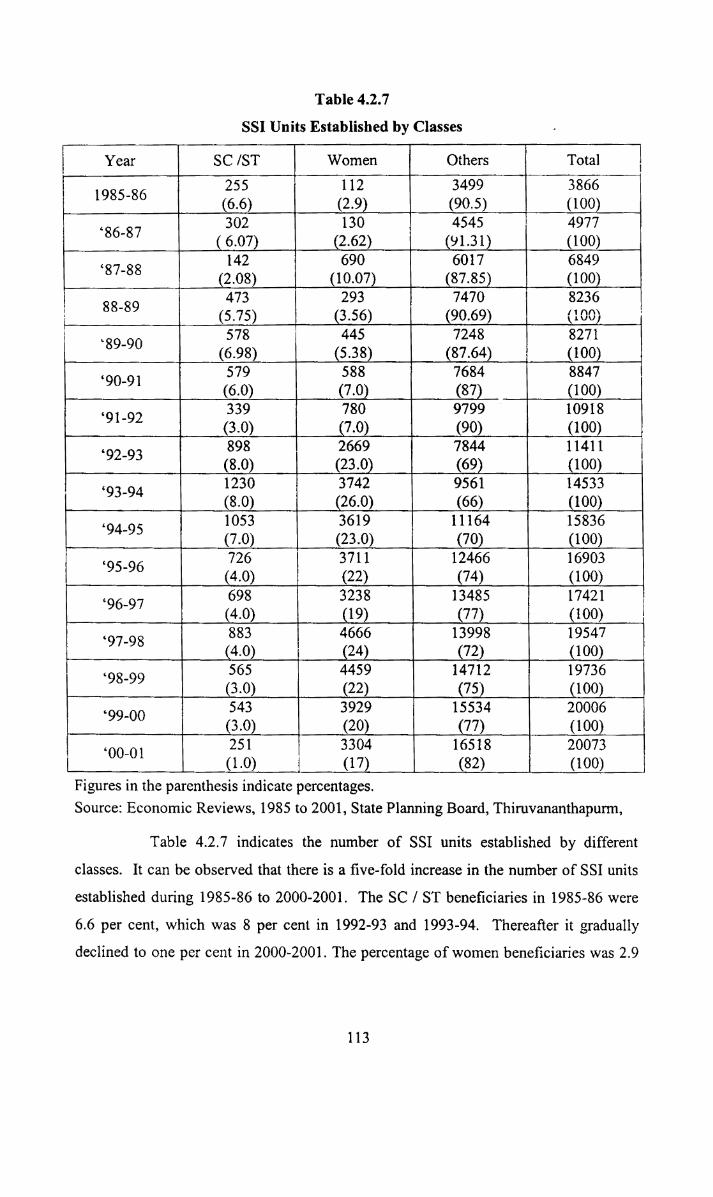
Table 4.2.7 indicates the number of SSI units established by differentclasses. It can be observed that there is a five-fold increase in the number of SS1 units
established during 1985-86 to 2000-2001. The SC / ST beneficiaries in 1985-86 were
6.6 per cent, which was 8 per cent in 1992-93 and 1993-94. Thereafter it gradually
declined to one per cent in 2000-2001. The percentage of women beneficiaries was 2.9
113
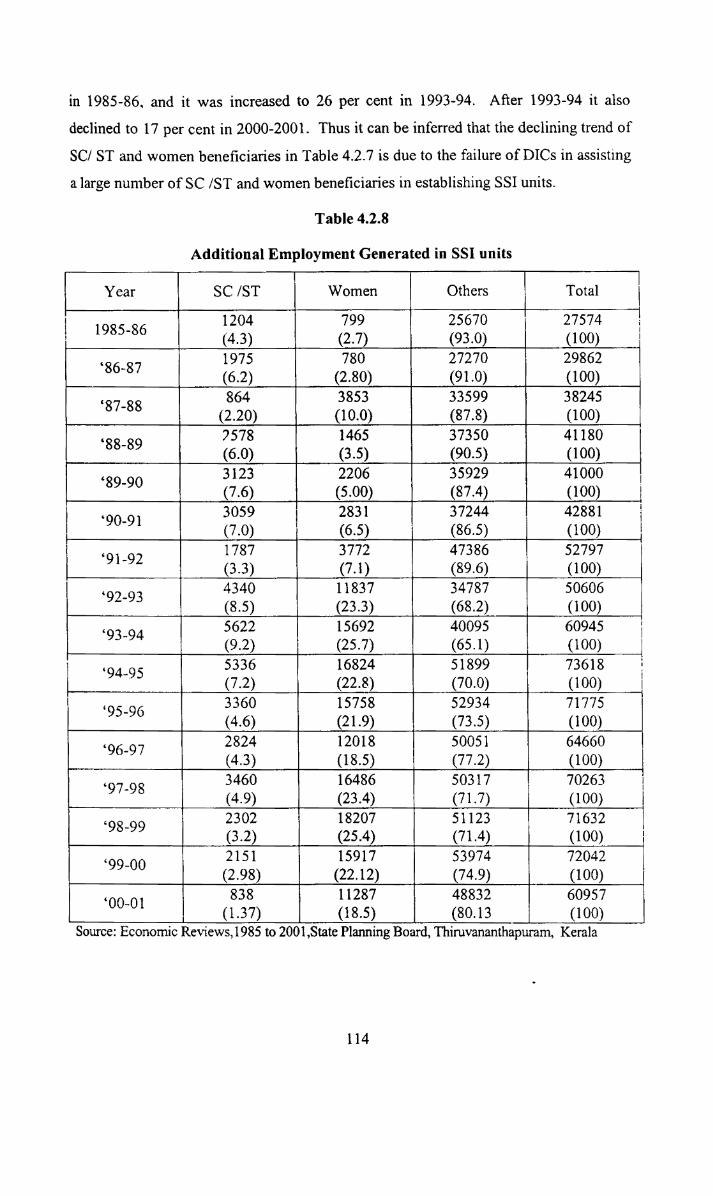
in 1985-86. and it was increased to 26 per cent in 1993-94. After 1993-94 it also
declined to 17 per cent in 2000-2001. Thus it can be inferred that the declining trend of
SC/ ST and women beneficiaries in Table 4.2.7 is due to the failure of DICs in assisting
a large number of SC /ST and women beneficiaries in establishing SSI units
Table 4.2.8
Additional Employment Generated in SS1 units
1 Year 2 SC /ST Women Others Total
; 1985-861
1204
013) _._1_
799
GL7)
25670(93tn
27574
(100)
u__ A
*86-871975
(6.2)g_
780
@280)
27270(9140
29862(100)
87-883853 3359. 864 % 9 1
1 _._.. it 1 (2-2.9) l_ (10.-.0) 4 (37-3) (100)38245
‘88-897578(6.0)
1465
C15)37350 751 41180
(100)
1
1
‘89-90
-Q.
3123(7.6)
2206@500)
(901935929(8770
41000(100)
J-b-—-at I
1 *90491
—-q1.__ 1
3059(7.0)
n--b- fix‘.
2831
(6.5)
37244(86.5)
42881
(100)
-___-
‘91-921787
C13)
3772(7.1)
52797
89 6_ (100)
-1
) ‘92-93 4340(8.5)
11837
(23.3)
47386
( ,)34787) 1 50606 7
(100)
t ‘93-94 5622
032)15692
(25.7)4009(651)
(68.25 60945
(100)i1I
. *94-95 5336(7.2) (2239 (70.0)
TM 16824 Tm 518899 Tm 73618(100)
1 ‘95-96 3360646)
15758
(215052934(73.5)
71775
(100)
—-|
1 ‘96-97 2824013)
1 12018
(181050051
(77.2)
64660
(100)
_.L.______i-_
‘ *97-98 3460649)
16486
(23.4)50317(717)
70263
(100)
A ‘98-991
1| 7”” ' U K 2302 ll 18207 51123 71632
I_. .
99-00Ti
6
(3.2) gg (25.4)g (71.4) 1 (100)w ,.2151 15917
(2.98_) (22.12)53974
(743n L72042
(100)
-,,i.._._1
1 838 177 11287 (‘"17‘00431 1I (L37) (185)48832(8013
60957
(100)
I, 1-I44
s =5 3 ' ' 5 ‘MTource conomic Reviews, 1985 to 2001,State Planning Board, Thimvananthapuram,
114
Kerala

The additional employment generated in SS1 units by classes is displayed in
Table 4.2.8.
Table 4.2.9
New Provisional Registration given by Classes
Year SC / ST 1 Women Others Total1‘ 1 6811985-86_ (6.0) 10163
(895)11354
(100)
*86~87 ‘ 912
510
J lgets)729
(6)
10525
(86.5)12166
(100)
ii
F g_ ____g (7.5). Twwmn it 1 A‘ ’87-88 Y.- “. , C10). 1315 10414 119561“ 0
-111) (37).1n 11 (100)
‘
‘ 6251’88-89(5.0)_g 1 5637
015)11328
(90.5) g “W
12516
g__ _ (100)1 9151 ’894x)1 (C10) 774“
1(6)
11205
(37)TTSSS12894
(100)7 " 8267 ’90-91_(( (6tn 1581
(11.5)11369(82.5)
13776
(100)‘ 6251 @n,92(4.9) 938
1_(6)14075
(90)
15638
..(100)1 1751.92.93 11 ‘$25?
A ’934w1 1 614)
l; 3000(19.2)
5065‘ (2830
10890
(691010925
(61.9)
7 T715641
511190)17644
(100) \1
7 1 :28 4479
1 121)14921
(70) 1 (100)21316
.._J1240
’95-96~ (§1D 5458(22)
18109
(73)24807
(100) H M I
-11 1113~ '96497“ 5 to (4.3) 4414(171)
20358(7819
25885
g WWg(100)1383pg (5.0)'97-98 1 ' : 6366
<23) (72) gg_
19930TTTS 27679(100)1' I1' 737’98-99
(2.4), 5902
(201)22866
-f7l5)i.T295051
(100)7 ’994x) 378
(13)
{ ._ :17‘1 4625(15.9)
24079 i(8210
iii"29082(100)
Source: Economic Review, State Planning Board, Thiruvananthapura1n:T{erala;1986 to2001. (Figures in the parenthesis show percentages)
It can be observed from Table 4.2.8 that the share of SC and ST, in
additional employment generated by the SSI units varied below 9.2 per cent upto 1993
94. After 1993-94 it gradually declined to 1.37 per cent in 2000-01. The share of
115
women in the additional employment generated varied from 2.7 per cent in 1985-86 to
25.7 per cent in 1993-94. After that it gradually declined to 18.5 per cent in 2000-01.
Table 4.2.9 indicates the number of registration given to SSI units by
classes. It can be observed that the numbers of provisional registration given by DICs
per annum are increasing from1985-86 onwards. The number of provisional
registration given by DICs in the state has gone up more than two and half times, i.e.
from 11354 in 1985-86 to 29082 in 1999-2000. This suggests that more and more
entrepreneurs are approaching DICs for registration. This may be due to the insistence
of DIC registration by agencies for providing assistance to the units. However, it can be
observed from Table 4.2.9 that the percentage of registrations given to SC /ST
beneficiaries varies from 6 per cent to 11.2 per cent in 1992-93. After that it declined to
1.3 per cent in 1999-2000. The number of registrations given to women entrepreneurs
varied between 4.5 per cent and 11.5 per cent between 1985-86 and 1990-91. In 1992
93 and 1993-94 the percentage of registration given to women entrepreneurs increased
to 19.2 per cent and 28.7 per cent respectively. After that it declined to 15.9 per cent in
1999-2000.
Thus it can be observed that the number of registration given to SC /ST and
women entrepreneurs together declined after 1993-94. Registrations given to SC /ST
and women beneficiaries show an inconsistent trend upto 1993-94 and a downward
trend afler 1993-94.
The above analysis shows that SCs / STs were not benefited by the DICs, as
their share in the number of registration given, SS1 units established, artisan units
established and employment generated are decreased. This suggests that the socially
oppressed classes could not get any consistent assistance from the DIC programme to
the desired extent. Ln the case of women their per cent share in the number of
registration, SSI units established, and employment generated increased, but there is a
decline in the share of artisan units established. Thus we can conclude that the DIC
programme made some benefit to women, but leaves much to be desired.
116

4.2.2. Inter-Regional Analysis of Performance of DICs
An inter-regional analysis of the performance of D1Cs is presented in Table
4.2.10. The Kerala State is traditionally divided into three regions. Firstly, Travancore
region, which comprises of southern six districts, i.e., Thiruvananthapuram, Kollam,
Kottayam, Pathanamthitta, 1dukki_,and Alappuzha. The Emakulam and Thrissur
districts comprise of Cochin State, and northern six districts (Malappuram, Palakkad,
Kozhikode, Wayanad, K8.I1I1LlI‘ and Kasargode ) comprise of Malabar region. It can be
observed that the performance of DICs in Cochin Region is far better than that of the
other regions. The DIC achievements in Cochin region i.e. in Thrissur and Ernakulam
districts are higher than the state averages in all the nine indicators.
Table 4.2.10
Region-wise Position of Performance Indicators & Kerala Average_ K (Average pe1f,DIC perannum)~--1985-8,6 to 2000-2001 H pg pg
Indicators Travancore 4: Cochin Malabar Kerala Average105 101 i 87 98Entrepreneurs identified
Project profiles prepared 186 217 146 1701
y Artisan units established y 250 1734 489 582
1 SS1 units registered , 1405ii l *' - s I 7 12247 1 990 K 1390
‘ SS1 units established F 10301 I 1497 A 629 924I
Employment generated 4604 7431 2775_ 7
4226
redit (Rs.Lakhsi) 1 1 "39
_Jr__22.‘ O
102 I 34_!
1
39
5 Subsidy (Rs.1akhs) 31i . ,,Fr ' ‘ ' — — ‘ 1 —— 56. _27 32
; Technical assistance provided 136 180 119 134
Calculated on the basis of above tables PM
Travancore region also fared better when compared to Malabar region as the
achievements per DIC in relation to seven indicators are higher than the state averages.
But in terms of the number of artisan units established and subsidy provided,
achievements in the Travancore region are below the state averages.

4.2.3. Inter-District Analysis
To assess the performance of DICs in the districts of Kerala and to identify
the DICs that fared better, a performance index has been prepared, based on nine
indicators. They are 1) Entrepreneurs identified 2) Registrations given to SS1 units 3)
Artisan units established 4) SSI units established 5) Additional employment generated
6) Technical assistance provided 7) Project profiles prepared 8) Credit assistance given
9) Cash subsidy sanctioned. These are the key indicators wherein the DICs were
assigned a special role and responsibility. Time series data from 1985- 86 to 1999-2000
have been collected and aggregated for all the nine indicators and from which yearly
averages were calculated for all 14 districts. As the achievements in respect of differed
indicators differ among DICs and in order to measure the overall performance, scores
were allotted ranging between 1 to 14. The DIC with highest average in a particular
indicator was given the maximum scores of 14 and so on in descending order for each
indicator. The total scores obtained by each DIC for all the nine indicators were
aggregated in order to find out the overall perfonnance of the DICs. The performance
index was used to identify the DICs which performed well. The average achievements
for the nine indicators and the scores obtained by each DIC are presented in Tables
4.2.11 and 4.2.12.
The total score being 110, DICs which scored 55 and above are considered
as successful. while the rest are not so. From Table 4.2.11 it can be observed that
Thrissur DIC tops the list with 110 points followed by Emakulam, Kollam, Palakkad,
Thiruvananthapuram, "Alapuzha, Kozhikode, Kottayam and Malappuram. Performance
of DIC Kasarkode was at the bottom with 22 points followed by Wynad.Pathanamthitta, Idukki, and Kannur.
From the above analysis it can be noted that performance of DICs in
Thrissur, Ernakulam, Kollam and Palakkad districts were impressive. This may be due
to the agglomerative advantages enjoyed by these districts. A careful perusal of Table
4.1.11 also shows that DICs in the districts with strong industrial base and relatively
developed) performed well. The performance of three DICs in the Malabar and
Travancore region are below the average and have failed to provide the desired level of
assistance to the entrepreneurs.
l 18

Table 4.2.11
District Performance Indicators——Averages per annum
1dentified1profiles1 .1 . Artisan‘? SS1 Tech’1 SSI iEmpl. Creditnt. Pro_1ect . 1 . 1 . . 1umts ~ un1ts Ass1st. un1ts1 enerSubsidy
Rs.Lakh
1
S .
Thiruvananthapuram‘ 102 1304208 1 286 22381 162 1417 6373 n_
,g Rs1 est’d Reg’diProvided Est’d1 ated Lakhs
53 2 39.8
14611461 264 1 296 2195 294 --12116s18 53 43.5
Pathanamthitta 40
—-+
O\O\
164 _ 811 42 1768126361 15.2Allappv-Zha
.-.-i..-....-_
134 11371 96 11198 594518.1 145 52.3155 24
1Kottayam 108 1 152i "1
"65 i'1i9i50_ii165 41314142545 342 15.3Idukki 88
7i
173,,,,283,_,,703, 109 355118931. 1 .
18 10.3
Tl1rissur11.=.:1-11;-1771;-‘.£1.111%.~. £1391 193 1 285 2552M1,__,1_90 116831 881 65 47.7
126 221 12523 274211681131059731 63 6 52.
F.Pa1é.1¢1<=§<i 1 =_1=5,0__,,_,217 1 1487 __11 _-. 63 213 7 1063“ 4812 156 57.5
Hi
1Malappuram 1 78 189 159 11276 2851 22 36.8
L.i_+-hi
_ , __.,_,,,_____,,_,_____,,___..._ Z_ —-1 ~ . ..[Kozhi1<ode ______ _,89 177 303 "1225 119 ‘918 3760 “E34 25.5
flayanad _ 106 121 . 273 1301 72 123271105 10 8.5
Kannur 1, 92 1 107 1 140 924 80 177160572664 32 26.3
1<44g81¢ 19 -_26j1.if1i-173‘fif561 51 1112941 31 8.22
Source: Calculated from the secondary data 8 M7757
Table 4.2.12
Scores allotted to each indicators and total scores obtained by each district in Kerala1 .3 Ent. ; . ‘Anis-an SS11 . .1 PI'O_]€CI 1 . .1 1dent 1 mfiles umts un1ts1 ifiedl p estd. ~ regd. "1. . ,. _ ._.- .. rovi- Lint“; ated L kh ,1 . I . t11144.3“ “‘ 11141111 1
1 _1 1 ,TecThl' SS1 Empl'Credit S.ub Over “assist. . gener- RS 1 sldy Tot- anp , Rs a1 1
‘Thimvan1 7 10 1 1 12 1 9=1111h11P915=111111 10 1 .ll 14 E13
12 ll 9 19315 1
Kollam 1 14 7 14 1' 10 13 10 10 1111241FiPathanai it 2 1 5 4 11
(II
6 4 31.
-I;
U931-T\-7
I1
1A11appuzha 13 13 1 8 1
I\J
LII
1. 9 10
O0
12
O0O
O\
. ,__ 1 _ _ ._ 1 1|LK919yam 9 ’ 19 9
LII
gi
121 8
\J
5.“8 63
O0 .
1<1111<1<1,11 4 1 3
O\
O0
7 3 .1
3
l\)
3 39Ernakulam H ,1 W13 12
\O
\O
141 14 14 ll111 .... __MT11rissuri1 10 1 14 1 ll
11-1
l\J
4
____. 77: _____1. __ . _ . . ..
I-1L»-A
11 11 13 14 ill
P 11
10712.5 10 1
F-u-I
Qgl
1Pa1akkad 12 _ 1 "9 1 13 9 L12 it 13 100 4 .Malapp 1 ‘Uram L 3 8 1 47 1 7 10 51 6 9 8 .60-19’.
1462611666 , 12 it 1
U!
\.l
O\
O0
\I
\l
C\
O’\
1 64 7iwaydnédt ,
X
Q
r—~
DJ
H
. |
E
l\-J
28J
13 1liannur ; 3 3 1
O\
1»
U1
-A
1
1
1
->
Ln
LII
\l
142 10_1Kasargode 1 ; 6 1 2 2
l\->
1
l\J
IQ
-B
)1!
1
._1_. ,.
22 141Source: Calculated on the basis scoring technique.Ent. = Entrepreneurs, Estd= Established, Regd = Registered, Techl = Technical,Assist = Assistance, Empl = Employment
119
4.2.4. Self Employment Scheme
This portion gives a brief account of the self-employment programme. The
Government of India, Ministry of Industry, launched the scheme_in August 1983 for
providing self-employment to educated unemployed youth. The main objective of the
scheme is to encourage the educated unemployed youth to undertake self-employment
in industry, service and business through the provision of package of assistance. The
scheme will cover all the educated unemployed youth who are matriculates (l0‘h class
passed) and above with-in the age group of 18 to 35 years and whose family income
does not exceed Rs.l0000 per annum. Further there is reservation of 30 per cent for
scheduled castes/tribes. In the modified scheme, the beneficiaries for industrial and
service ventures will include ITI passed young persons. The limit of loan for industrial
ventures has been increased from Rs.25000 to Rs.35000, in the case of service ventures
the limit remains at 25000; while in the case of business ventures the limit has been
reduced from Rs.25000 to 15000. However, of the types of ventures, the subsidy for
which are fixed at 25 per cent in 1993 this project has been modified as Prime Ministers
Rozgar Yojana (PMRY) and the matriculation pass was reduced to Vlllth standard and
whose family income does not exceed Rs.24000.
In Kerala, under PMRY 22.5 per cent and 27.5 per cent of State target is
reserved for SC/ST and OBC respectively. For business purpose maximum amount will
be one lakh and for other activities it is upto Rs. 2 lakhs. An individual gets l5 per cent
(Rs.7500) as subsidy of his loan amount. The rate of interest of the loan under the
scheme will be normal bank interest without any collateral security except assets
brought by using loan amount. The repayment of instalments would spread over 3 to 7
years depending upon the nature and profitability of the venture.
4.2.41. Role of DIC in the implementation of the Scheme
The District Industries Centers are assigned operational responsibility of the
scheme at district level over and above the present normal activities. The DIC in
consultation with the Lead Bank of the respective area acts as the Nodal Agency for the
formulation of Self Employment Schemes. It plans and monitors their implementation
120

under the overall guidance of the state government. The SISI will assist the DIC in
carrying surveys, assessment of potentialities and preparation of projects and schemes.
4.2.42. Progress
Under the PMRY programme the state government fixes the target to be
achieved by the DICs every year. The DICs, in tum, are supposed to execute the
programme in liaison with banks and other government agencies. In order to evaluate the
progress made under this programme the researcher collected data relating to the targets
fixed, number of cases cleared, amount ot‘ credit disbursed and the number of units
sanctioned, along with the total amount of credit sanctioned and amount disbursed. The
data was collected from the Director of Industries for the State as well as the three selected
districts during the period fiom 1983-84 to 2000-01. This is shown in Table 4.2.13.
It can be observed from Table 4.2.13 that the number of beneficiaries
selected from the state as a whole is 779. But in selected districts Malappuram is the
only district among the selected districts below the state average per annum i.e. 505 in
the case of number of beneficiaries selected. Ernakulam and Thiruvananthapuram are
above state average; i.e. 1389 and 1325 respectively.
It can also be observed from Table 4.2.13 that the number of beneficiaries
selected for assistance the perfomiance of DICs in Emakulam and Thiruvananthapuram
are better than Malappuram; because they achieved more than 70 per cent higher than the
state average, whereas Malappuram could achieve only 64 per cent of the state average.
As to the number of beneficiaries to whom the loan amount is disbursed;
Malappuram is below the state average and Emakulam and Thiruvananthapuram are
above the state average. Malappuram showed poor performance in relation to these two
indicators.
121

Table 4.2.13
Targets/Achievements/Credit Sanctioned and Disbursed
(Average perwannum per DIC) 1983-84 -----2000-01
. No. of No.ofun1ts 1 ercemagf:1, . . . f tTarget beneficiaries to which Amount Amount O amoun 1
. Dlsmct units 1 Selected 1 credit H sanctioned idisbursed dlSburSed=. y 1 % . * ‘P to amount 11 sanct1oned 1 y ., 1r 1 sanctioned 1Mala mm 19351 505 352 276.24 192.5771 69.71 g
PP 472.711 (64.8) 1.11.1718) 1 (73.5) 1 (62.4);22001 1389 1 sos 1 793.3 1416.28Emakulam 1 1 ~ 1 1 52.47 ,171 17.3 165 211 183 1Thimvanamha uram()“(1325) 1 (837) 6i)1.4i53§5.0()>3 1 641 1’ 1 - 7 (179) 11211__.._(160.)_-....1._<170>t1_2._g-11 Ke al *12s5 779 490 T375422 1 226.95
..- -Q. qo-vi
1'
__~i_
Q -099) . (199) 1199) . (199) 6°“Figures in the parenthesis indicates percentages to state averageSource: Calculated on the basis of figures obtained from the Directorate of Industriesand Commerce, Thiruvananthapuram, 2001.
The average amount of credit sanctioned to beneficiaries by the DICs in the
state is Rs.375.48 lakhs per armum. A comparison of this indicator with Ernakulam and
Thiruvananthapuram shows that these two districts are far better than the state average,
but in Malappuram the average amount of credit sanctioned per year is less than the
state average. The average amount disbursed also has the same feature. The percentage
of the amount of credit disbursed to credit sanctioned shows that the perfonnance of
DIC Malappuram is better than the rest.
The inadequacy of finance is also observed under PMRY, which is
considered as an important scheme in order to motivate the educated unemployed youth
for the establishment of their own units. Table 4.2.14 reveals that the unitholders
immensely suffer from inadequacy of finance under PMRY Scheme. It reveals the
disheartening position that only 53 to 67 per cent of DIC recommended amount is
sanctioned by financial institutions. Then after sanctioning the disbursed amountis
only 44 to 47 per cent of the recommended amount. Table 4.2.14 reveals that the
approach of financial agencies has remained negative towards the unemployed trying
for self-employment. The difference between amount recommended, sanctioned and
disbursed is very high in all the districts.
122

Table 4.2.14
Amount Recommended by DICs and sanctioned and disbursed byFinancial Institutions (Rs. Iakhs)_ _'__7______ ______ y _ __ . .r:_—;-'.- .-T __~-_;_;__‘ "7 '' 1996-97 1997-98
-.-_—— 1 -o
p-.—-i--6.
4
‘
1998-99“ "7 1Name ‘, . .‘Amount1 1 Amountijiwiii 7 1Amount7
ended by‘ ° id ; by 1endeiby‘1lone 1 by ended by ‘°“°d
1 1 Amount , Amount 1 Amount Amount Amount 1 Amountof the 1 1 Sanct- . ~ Sanct- D. b d R Sanct- D. 11‘ district Recomm-1 in 1D1sbursed:Recomm-L . d g 1s urse ecomm- . 1sbursed_ybybyte 1 1 bythe 1 bythe 1 1
A DIC Bank . the Bank DIC 1 Bank the Bank DIC Bank 1 the Bank 1
ty thapmm 7L156p7.7p5p1 (6p2)L (38),? 1520.59 1505.05T11iI1.1Van3- 3972.55 603.29 973.49 777644.756 110689
. -_--....(64)‘." (42)*** (73)*1737.97(49):|=**
1
1 I 753.187 55911‘ 3777” 725.71 522.74 1132.9181'5.63K11 1200.56 11122.67. .... 1 .__. .° am __1 <62) 1 146) 1 (641 14» 1 1536.37
1'47)
1
1-. - . .. i 3 I .. ---1. "1Pathana 403.11 307.92 4 1428.46 291.5 468.5-.-_1h.i44 1 597" 1-160 <51) 596'“ 1 <71) 1 <48) 656"‘ <70
343.07(52)
1 Alappuazha1 1111 0. 1 -1-t65). 1 <44) 4 (67) ,_--.-147) 1894'” 1 (72)= 1 5]729.52 492.74 879.87 .595.721"417.86717 it 1647.57 7160.51(51)
Kottayam 781.26 537.07 1 37757.62 502.12 * A 1754.911229.7 (63) (43)mppg1219p.01 (62) (41) 1081.031 (69) 1' 1" 1 7 2 1
y Idukki 37334 266.56: 209.85 1 365 21 1233.66 172.56 1 321.86 256.677 . (7111).; (5§).__--1 .1 (63) ~ (47) (79)
470.00(43)
13797.763"71
(43)11 1994.78 727.9 11033891 737.81 7 1165.81718 1611 1295.2 . 1296.49 1 1664.77 .1 "““ 1'“ 1 <76) <56) 11-179) 1 (56) <79)503.57
(30),
“"‘““’ 1 1 06> 3>_n1.2.*§3"2'1 00 156) 1 (78)916.93 762.31 1985.571 727.7027)“ 12287.71 968.3 11199.8 (39)487.74
Z1.
1504241 33123 1 6444 32237 i 912.16\ Palakkad 1 578.556 (82) (51) 903.44 U1") (35) 11170.3 Ugh
150.65
(12)
.__¢_..—
\.Malappuram\. _ 1.1 "
/—\Q\l\J\_/
14522517196975) 1 378 00 7730600 5313702711.1 | . 11 . . . . . 1727.61 1 ypp_p(27) 594.97 A (63) Jpplsl) 691.03 . (74) 1
293.28(42)
1
952 36 823 11 11. 1649.31 416.89 1625.32)"7325.06 71607.02. Ca.“°“‘ 959'” 1 <67)..---<43) ' 1 (651 (34) <73)
305.9
(37_),._-_“1 77 A A ' ; j 5wynad 173-02 1 124.3 110.4 1 236.64 197.9 1 128.55 227.29 5170.001- . 1 (71) . (63) 1 (33)._1 (54) _ 1 (74)
127.00(55)
1.
496.561408.42 1 497092" 256.8 71537.09.1 annur 766.17 ‘I (64) (53) 4 782.52 (32) 691.46; (.77) i
-_. TA w
---1L-..-...
344.23 . . 1 1Kasargode. if (64) (48) 326.07 . (62) (39) 11 356.87 (69)
220.38 1 167.2 202 28 128 5 1 1 249.391
223.03
(33)108.87
1
48339 22 8252 94 9192 96. _-. . (30)7; 1 - 5831.27 11 . 5486.45 T 4887.591461818 112401.56 ' (67.52)**g12079.461 ' (66.48)**11090.46 ' 153.16)" 3
-‘67'24)*1<47-.92)***1 ..‘.6_’_‘."32)*1<45.41)**t-. 1‘82"89)1(44.971***1
1
* Percentage of amount sanctioned to amount recommended** Percentage of amount disbursed to amount sanctioned*** Percentage of amount disbursed to amount recommendedSource: Directorate of Industries and Commerce, Thiruvannathapuramm, 2001.
4.2.5. Summary
4.2.51. After the establishment of DICs in Kerala SSI did not show improved
performance as the compound growth rate of units, employment and
investment under pre-DIC period is higher than the post-DIC period. It was
123
4.2.52
4.2.53
4.2.54
4.2.55
4.2.56
4.2.57
27.97 per cent, 12.31 per cent, and 58.9 per cent in pre-DIC period and 14.85
per cent, 9.85 per cent and 14.95 per cent in Pre-DIC period in the growth of
number of units, employment and investment respectively.
Structural changes have not taken place in the composition of small scale
industry in the state as the importance of agro and forest and animal-based
industries did not show a pronounced decline. Their share in units,
employment and investment declined from 27.6 to 30.8 per cent, 50 to 26.5 per
cent and 29 to 42 per cent respectively and the importances of rubber,
petroleum chemical non-metallic mineral industry have not shown a
pronounced increase.
Analysis of the performance of DICs based on nine selected characteristics
shows that the DICs in Kerala are not relatively better than the all: India
averages in respect of all eight variables and in the cash subsidies Kerala
averages is at par with all India averages. The co-efficient of variation in
Kerala is very high in respect of most of the indicators compared to the all
India performance.
The DICs has not succeeded in assisting the socially downtrodden classes. The
number of registration given, SSI units established and employment generated
not increased gradually over the years.
Inter-regional comparisons of the performance of DICs show that the
performance of DICs in Cochin region is better than the rest. The DICs in
backward Malabar region failed to provide the desired level of assistance.
District-wise performance of DICs measured through perfonnance index
indicates that Thrissur district stands first, whereas, Kasargode is at the bottom.
Better performance of DICs in Thrissur and Emakulam is due to the
agglomeration advantages enjoyed by the industrial units.
It can also be noted that performance of DICs in districts with strong industrial
base and relatively developed is better than the rest.
124
4.2.58. Inadeq_uacy of finance is observed under PMRY or Self Employment Scheme,
which is considered as an important scheme to motivate educated unemployed
youth to set up industrial units.
4.2.59. The study also reveals that the approach of financial institution towards
educated unemployed youth trying for self employment is not positive.
It is clear from the analysis that the performance of DICs in Kerala is far
below comparing the all India perfonnance. An inter-regional analysis of the
perfonnance of DICs also suggests that in backward region like Malabar DIC failed to
accelerate the process of industrialization. Across the districts, the perfonnance of DICs
in developed districts is better than in backward districts. This shows that the benefits
of industrial development, after commencement of DIC programme, could not percolate
down to the backward region and districts adequately. Therefore it is suggested that
efforts should be made by DICs to concentrate on the development of backward districts
and regions. If necessary more funds are to be allocated and DIC personnel should
work with greater vigour and zeal. It can also be noted that the DICs, no doubt, have
not succeeded in assisting and motivating SC, ST beneficiaries in establishing SSI and
artisan units.
125

4.3. Performance of DIC-Assisted SSI Units
(A N on-theoretical Analysis Based on Primary data)
The performance of DIC-assisted industrial units in the selected districts is
evaluated by using structural ratios, linkages with the hinter land. The views and
reaction of sample beneficiaries about DIC assistance were also taken into account. The
main objectives of the sample survey are:
l. To identify whether the DICs have succeeded in attracting new entrepreneurship
into the field of industry.
2. To know the performance of industrial units established after the DlCs.
3. To find out the linkage effects generated by the industrial units with the hinterland.
4. To measure the degree of assistance received by the entrepreneurs from DICs, and
also their views and reactions.
4.3.1 Sample Design
The sample survey was conducted in three selected districts, of which one
district is industrially developed in the state, second one is industrially most backward
in the state and third one is lying between these two. The districts are drawn from the
three economic regions, namely, Travancore, Cochin and Malabar. The sample districts
include Thiruvananthapuram from Travancore region, Emakulam from Cochin region,
and Malappuram from Malabar region. The total number of SSI units in the entire three
sample districts is 63062 and its 37 per cent is situated in Thiruvananthapuram, 46 per
cent in Emakulam, and 17 per cent in Malappuram. The three districts were selected on
the criteria of ranking of districts on the basis of district-wise per capita income at
current prices, which is shown in Table 4.3.1.
126

Table 4.3.1
Ranking of Districts on the basis of District wise Per Capita Income at current prices
Year E T‘90-1‘9117792i4ii“i‘93-2‘94- i‘*957§"9'6"- ‘97- ‘98- 1,ii‘99l—99 ,101311101 91 192 93 W; 94 95 , 96 1 97 98 1 00
jThiruvananthapuramg 8 8 6 5 , 4 1 4 6 1 7 1 6 7 i_____ __ _ 1—I 1 1 777777 7 7 "__' 7'71
\1
7
O\
U’!
\-O
.:;,:\1
Kollam 105 818'89l018‘}Pathanamthitta if k 4 5 1_ 9 7 I I “ 11ltalappuzha 7 1 if 12 12 9 12 = 32"11,13, 1 ]13s1 | iKottayam 917 11 10110110 14 j’, 3 y 4 , 4. .1 ,_ . ,._ ,.,_..______ .______V ____ r_ _v__H_r_ r _Hr _ _ _ __ _ ___ :____ _____._______i_..____7_%?__331;. . ____ .;ii_.. ,, 1,Idul<ki 12 2 2 313i3, 2 2 0 3 ” 61iErnakulam 111111 1 1‘1 1112_ g ‘E L’ ‘0 -0" 1“""“"]Y " M iiiii if mm“Thrissur 1344455 7y;55}5i1Palakkad ' 13 1 9 , 12 13 13 13 12 1 13 3‘___ _ _— _:-_*:_.l[:7_ _ ‘ f’ ’ I ‘ '—":_i
“'3 -l>~ to 1+-——-——-—~—--
ytn jib 1‘ ll %l 9'--*L») M A O____1____._______ _.__--_4
JMalappuram I 14 14 14 ‘ 14 14 14 W 14 14 ,iKozhikode 10 12 3 9 9 1 9 10 I 11 ” 91 1 :1 ' 1 9 “"""'Wayanad 166,7 21212314110!iKannur 3 Dal 0 ‘ 11 12 xi:§Kasargode 1, 121 13 10 11 11 , 11 8 A 6 A zlSource: Economic Review, 1996 to 2000, State Planning Board, Thiruvananthapuram, Kerala.
From the Table 4.3.1 Emakulam, Malappuram and Thiruvananthapuram are
selected as sample districts because Emakulam tops, and Malappuram, the most
backward district and Thimvannathapuram a medium, in the level of per capita income
in ranking districts on the basis of last ten years district wise per capita income at
current prices.
A pilot study was conducted through a structural questionnaire by selecting
five SSI units from each of the three districts. Based on the responses, the questionnaire
was modified and administered on 43 SS1 units in Malappuram district, 115 units in
Emakulam district and 92 in Thiruvananthapuram district, covering different
geographical areas on a random basis. Despite the efforts of the researcher the response
from the units has not been very encouraging. In some units it is only after three to four
personal visits that the researcher could get the entrepreneur for a personal interview.
For the purpose of analysis, using the resource-based classification; these sample units
127
were classified into five industry groups, viz. 1) Agro-based 2) Forest and animal
based 3) Rubber, Petroleum, chemical, non-metallic and mineral-based 4) Iron and
Steel and metal-based and 5) Manufacturing of machinery and Transport Equipment.
The distribution of Sample units - industry-wise - can be noted from Table 4.3.2.
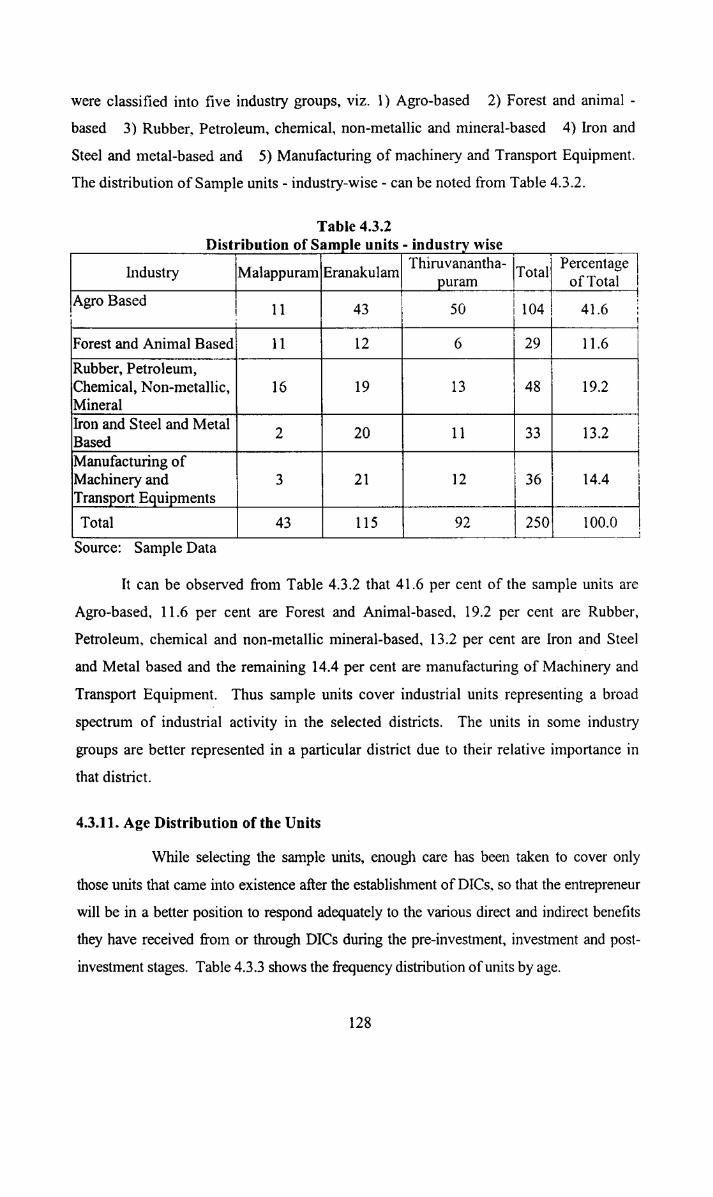
Table 4.3.27 pg Distribgugtiogn of ,,Sa,n3pI§ units - industry wise1 2 "2" * —'— 1-" 2 ' * _“ 0
Industry ‘MalappuramEranakulam Thimvanamha- ‘Total PercentageI 11
-1-.———w---—'_
1 129rf<_1rr1-. 1 of TOta1_\Agro Based 43 L 41 _61.--». .. 1 14 41Forest and AnimalBased} 11 % 12 11.6 '
II!%5
V1<7‘ 0
~ 5.\o Js.]_-___
Rubber, Petroleum, l itChemical, Non-metallic, 16 19 l l3 5 48 4 19.2.Min°Ial. 1 1 . 4Tron and siee1andMe151ii4 20 q H 33.Ba$¢§1 ll
llManufacturing of S § l i
soto
M Ltoan
iMachinery and , 3 21 12 36 15 14.4Transportfiquipments n,Total 43 115 4 1 0! 100.0. ' I-_V______ .. . .| 1 .| . 1Source: Sample Data
It can be observed from Table 4.3.2 that 41.6 per cent of the sample units are
Agro-based, 11.6 per cent are Forest and Animal-based, 19.2 per cent are Rubber,
Petroleum, chemical and non-rnetallic mineral-based, 13.2 per cent are Iron and Steel
and Metal based and the remaining 14.4 per cent are manufacturing of Machinery and
Transport Equipment. Thus sample units cover industrial units representing a broad
spectrum of industrial activity in the selected districts. The units in some industry
groups are better represented in a particular district due to their relative importance in
that district.
4.3.11. Age Distribution of the Units
While selecting the sample units, enough care has been taken to cover only
those units that came into existence afler the establishment of DICs, so that the entrepreneur
will be in a better position to respond adequately to the various direct and indirect benefits
they have received fro1n or through DICs during the pre-investment, investment and post
investment stages. Table 4.3.3 shows the fiequency distribution of units by age.
128

Table 4.3.3
Frequency Distribution of Units by Age*
Age in Year alappuram ‘ Emakulam‘Thiruvananthapuram rTotal Percentage
E_.1
-__‘_.__...
1
<2 years L 25 128 51 2 I
-l>- Aup y 0
ml- -:
>—-B l_ Q\(J1 ; U)
__r___._
2-6 years 1‘ 5 63 ‘ Z5-2 _7-11 years 4 5
as T2
H .to
tn
_._Lu
to .to
9°o-o
W 7 ' *__ ___...11_7 ,_ ;—— __ _—;- —-—-— '112-20 years 6 u 16 4 ii 26 ' 10.4W
:_-L
1
1
E >20 years 2 2 1
-Q
kl!
P—‘r—l
-P-l>~
Total 250 100.0
.1-Bgt»)
151-I'|—~
U1
\OIQ
L...
Source: Sample data* Age of the Units.
It can be noted from Table 4.3.3 that 11 out of 250 sample units have been
functioning before or at the time of establishment of DICs. Among 250 sample units 85
per cent of the units are in the age group below 12 years. It reveals that more units
have come into existence in the later half of the emergence of DICs.
4.3.12. Distribution of Units by Nature of Organization
Table 4.3.4 shows the distribution of sample units by nature of organization.
Table 4.3.4
Distribution of Units Based on the Pattern of Organization
1, 7**" *"2 in 6 ~ —~—-~——~ ———j-" —*—— —~~ * ‘**” 1 *"“—t*7* I **"—|JNature of Organization |Malappuram Emakulam Thinlvananthapuram Total Percentage‘if. .._______ Tt 74]-— I VT — I —V
U)LII
/"“\\OIi
%w’
~ U» 24
» L»)O0 ‘ @____%__ =._|,
II-I5
CD L») ~ DJ i
_-._...__._.._.__J_____.
I .1 . 1 2021§°~p"e‘a‘Y 1 (81.4) (79.1) I (82.6) 3 808Partnership 1 7 1 8 5 A_l (16-3) (15-7) -.-------.(_5_~.4) 3U . a 1 i 3 1 4 A 8 fjPr1vate Ltd.Company gggg ‘((2.3) 1 (2.6) ‘ 4.4 y ; ...i 1. . 1 3 1Co-operative soc1ety ; 0 I 2.6 5'4 1 . L‘Otherstciiamable ' 0 A 7“Institutions) ‘ H 7 (2.2) 'A _ 43 A 115 I 92 ITotal Q0000) (100.0)Mp%p (plpopoto) H 1% 250 100.0Source: Sample dataFigures in the brackets indicate percentages.
1\>
__i_
129

A perusal of Table 4.3.4 shows that the proprietary concems are dominant
in the sample. Of the 250 samples units 80.8 per cent are proprietary concems, 12 per
cent partnership concems, 3.2 per cent private limited companies and 3.2 per cent co
operative society. The 038 per cent comes under the category of “others” includes the
units run by charitable institutions. A comparison of sample units across the districts
shows the domination of proprietorship concerns in all the three districts.
4.3.13. Distribution of sample units based on the classification of Small Scale Industries
Table 4.3.5 shows the distribution of industrial units based on the
classification of Small Scale Industries. It can be observed that 53.2 per cent of the
sample units are tiny units, 35.6 per cent units are SSI units and 11.2 per cent units are
Small Scale Service Business Enterprises. The inter-district comparisons also show the
dominance of tiny units.
Table 4.3.5
Classification of Small Scale Industriesf ---1 4 —-I-~— ~ ~ re-=4-=~ — "=1
z_
Classificationof SS1
___._
alappuram Emakulam l Thimvananthapuram Total Percentage!
!
lI
12. l . . .19 A 53 61 A 133 53.2
_
Tiny
SS1 22 4s 19 E 89 1_ V_H_ I L 35.6
$ i.
11.2SSSBE . 2 14 12 2s 1
-._-—a 1-1-_v
Total 100.0
-J5DJ
1-I-3Lb
\O(Q
IQL/ICD
1 _ _ L,_ _ __ . l _ Source: Sample data if4.3.14. Location of the Units (Within or out side industrial Estate! Industrial
Development Areas).
One of the functions of the DIC is to assist the entrepreneurs by providing
factory accommodation. The availability of ready infrastructure in the form of
developed plots/1 constructed shed with all facilities like availability of power, water,
roads, sheds etc in Industrial
130
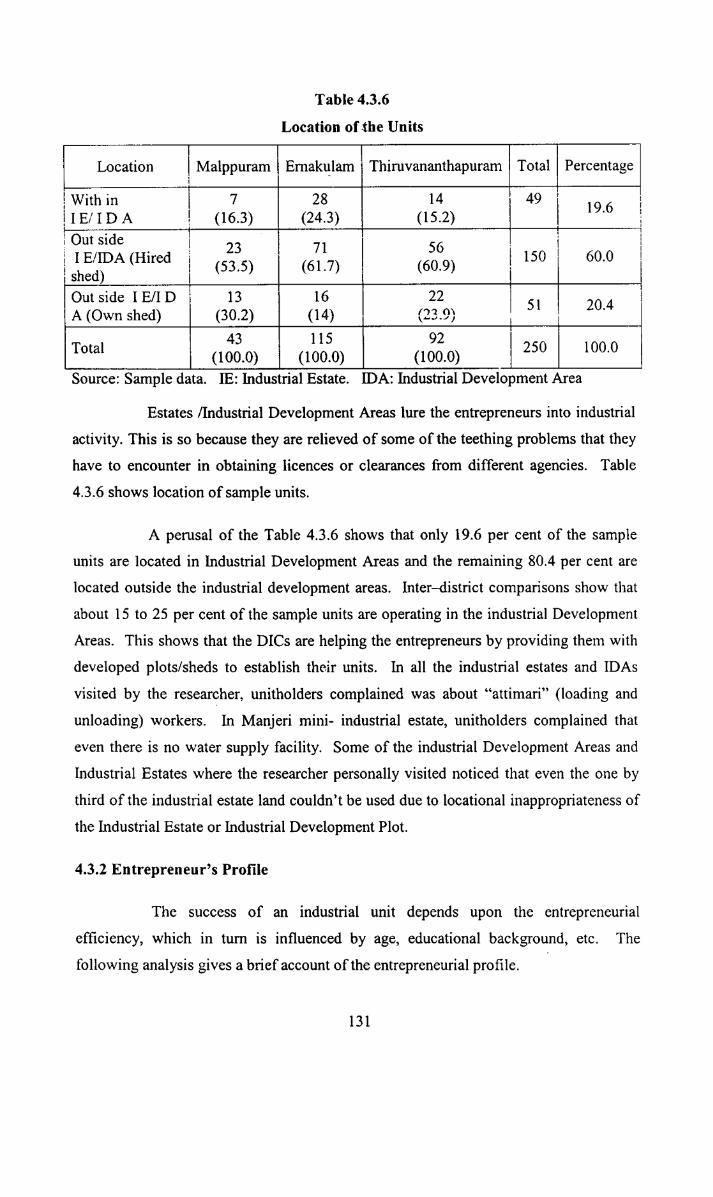
§With in I 7 I 28 14 1 49 .1 E1’ 1 D A = (16.3) (24.3) I (15.2) Ii Out side _IIE/IDA (Hired 23 " 71 56 Iished)J A (Own shed)
Table 4.3.6
Location of -the Units. .._.--_ I ‘ _. t -__.--. \ _.1 Location I Malppuram Emakulam I; Thiruvananthapuram 1 Total Percentagel
1 ‘ 1 II
lI—\
>0o\
iii -iiI
I
.
I
I
I
-11‘;
.
,.
,.
I11
1
__._-_
(s3.5) ' (61.7) ) (60.9) 515° 600Out side I E/I D 1 ,(30.2) I (14) 2. WI‘ 204
iiDJ
it!O\
to :3 Y\O\.-/
an7-ll
ikn-1-iw----i1—
43 . 115 I 92 II .ma‘ (199-.9) I.-_.<.1<><>~<>> -<199~9>, I 25° ‘°°"°Source: Sample data. IE: Industrial Estate. H)A: Industrial Development Area
Estates /Industrial Development Areas lure the entrepreneurs into industrial
activity. This is so because they are relieved of some of the teething problems that they
have to encounter in obtaining licences or clearances from different agencies. Table
4.3.6 shows location of sample units.
A perusal of the Table 4.3.6 shows that only 19.6 per cent of the sample
units are located in Industrial Development Areas and the remaining 80.4 per cent are
located outside the industrial development areas. Inter—district comparisons show that
about 15 to 25 per cent of the sample units are operating in the industrial Development
Areas. This shows that the DICs are helping the entrepreneurs by providing them with
developed plots/sheds to establish their units. In all the industrial estates and IDAs
visited by the researcher, unitholders complained was about “attimari” (loading andunloading) workers. In Manjeri mini- industrial estate, unitholders complained that
even there is no water supply facility. Some of the industrial Development Areas and
Industrial Estates where the researcher personally visited noticed that even the one by
third of the industrial estate land couldn’t be used due to locational inappropriateness of
the Industrial Estate or Industrial Development Plot.
4.3.2 Entrepreneur’s Profile
The success of an industrial unit depends upon the entrepreneurial
efficiency, which in turn is influenced by age, educational background, etc. The
following analysis gives a brief account of the entrepreneurial profile.
131
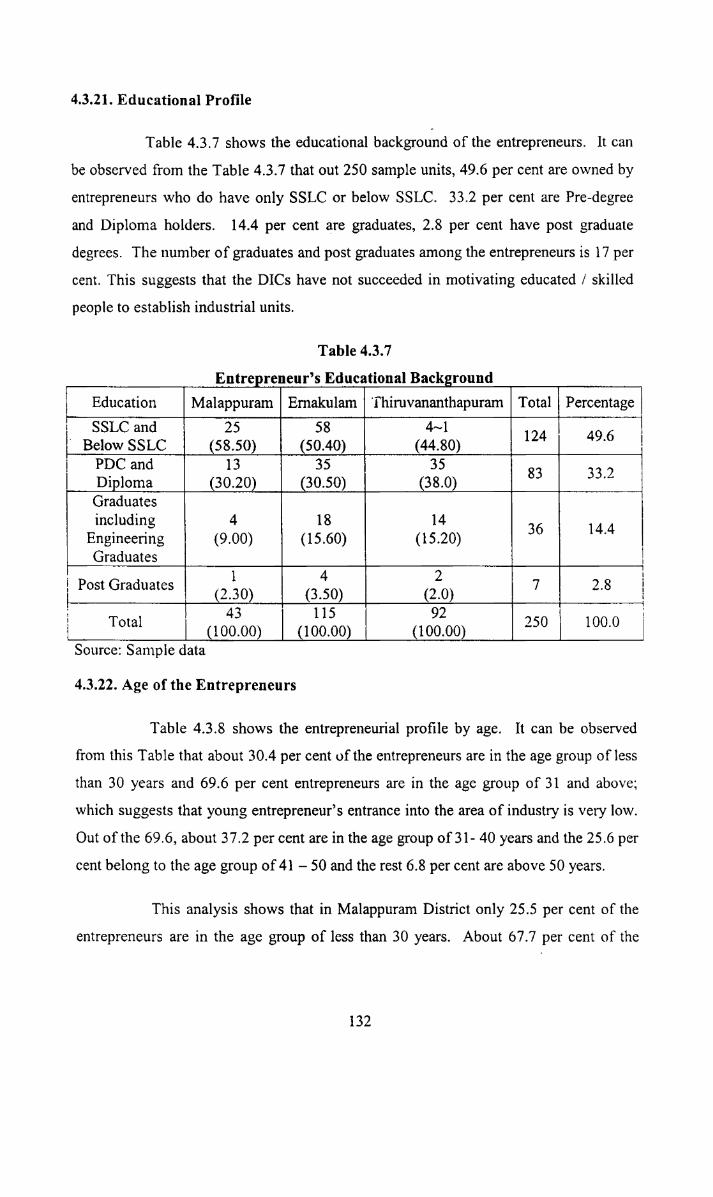
_-|.-.__._-..-.
4.3.21. Educational Profile
4
Table 4.3.7 shows the educational background of the entrepreneurs. It can
be observed from the Table 4.3.7 that out 250 sample units, 49.6 per cent are owned by
entrepreneurs who do have only SSLC or below SSLC. 33.2 per cent are Pre-degree
and Diploma holders. 14.4 per cent are graduates, 2.8 per cent have post graduate
degrees. The number of graduates and post graduates among the entrepreneurs is 17 per
cent. This suggests that the D1Cs have not succeeded in motivating educated / skilled
people to establish industrial units.
Table 4.3.7
,_ _Entrepreneur’sg Educational Background gThiruvananthapuram Total ( Percentage
'
Diploma“ (30.20) ; g (38.0) 4
Education Malappuram Emakulamtd . ___,C 4 .
0 Below $5 (58-50) ),,,(§0~4Q1,,,,,‘),,,,,, ,(€14~30).- 1;)1
L
PDCand 13 2* 35 pl 35 83 332—-4 .. -1--4 in .4-J - - a a ._..-.-_:..-_-2-.._-.2
Graduates 1includin 1) 4 ; 18 G3 . 14 )1Engineering 1 (9.00) 7 (15.60) (15.20) , 36 1 “'4
SGraduate 4 P 1_. »____. i... - ___.___ 1,
11
i
|
ost Graduates 1 4 1 2 F
"U
(2.0) (L 7%: g 2'8l‘I W ll
11-aw —¢--
_,b.-_
1. (2.30) 1 0.50) , .0» 43 T 115 92 1T 1 * 2501 100.0. °““ 090.00) (100.00) ) <1.<>0-0.0)
._ __4.-
data WSource: Sample
4.3.22. Age of the Entrepreneurs
Table 4.3.8 shows the entrepreneurial profile by age. It can be observed
from this Table that about 30.4 per cent of the entrepreneurs are in the age group of less
than 30 years and 69.6 per cent entrepreneurs are in the age group of 31 and above;
which suggests that young entrepreneur’s entrance into the area of industry is very low.
Out of the 69.6, about 37.2 per cent are in the age group of 31- 40 years and the 25.6 per
cent belong to the age group of 41 — 50 and the rest 6.8 per cent are above 50 years.
This analysis shows that in Malappuram District only 25.5 per cent of the
entrepreneurs are in the age group of less than 30 years. About 67.7 per cent of the
132
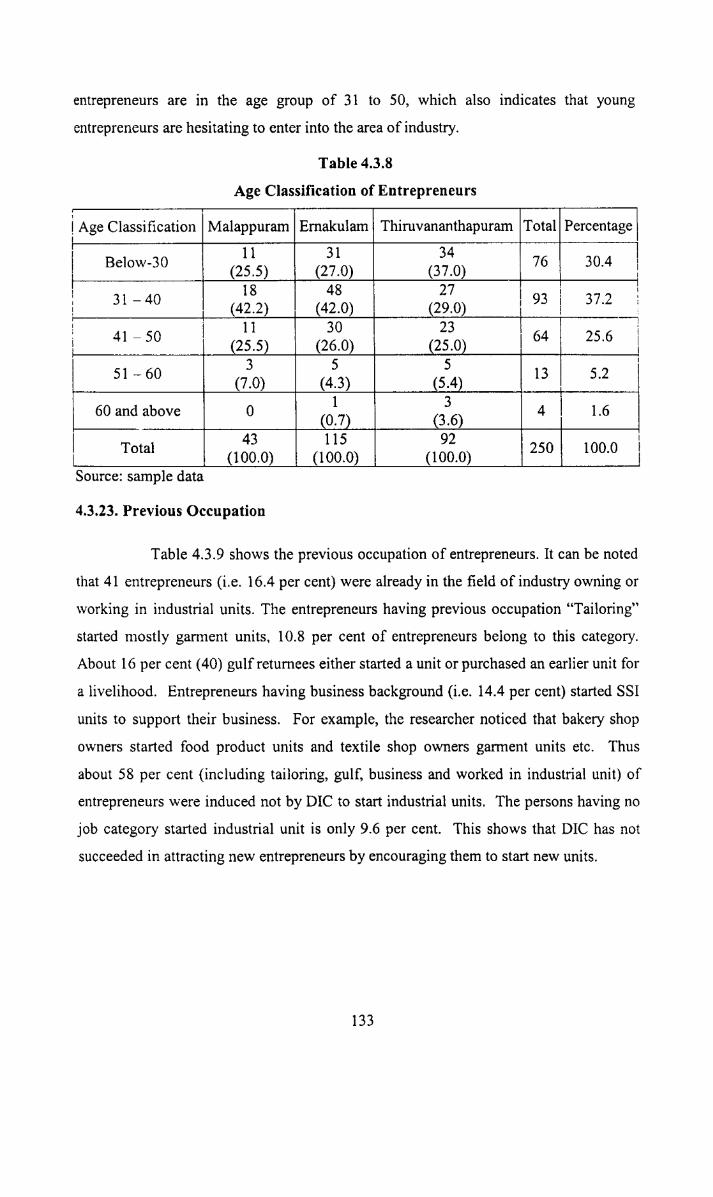
entrepreneurs are in the age group of 31 to S0, which also indicates that young
entrepreneurs are hesitating to enter into the area of industry.
Table 4.3.8
Age Classification of Entrepreneurs
ijjfljmi T T T i 1 T1B°‘°‘”‘3° gt (25 5) 1 (27.0) (37.0) '4
_ _....?i|
iAge Classification Malappuram Ernakulaml Thimvananthapuram Total Percentage31 34 76 3048 27
D-llm
\.c>an
u.)>3to
_ 1 | i3‘ 4° .____-(12-2) , (420) .;. 11 30 23 ; y §1 4*” (25.5) (26.0) 1 _--r25~9). .6“ -1 “"6 .‘ 5 ‘ 5 " T T__ _.___ .i__ _ __..___.__i_.L._ 3 “"60 (7.0) (4-3) Q3.| 1 l 1. “°t“*‘???*° ° <3-0 4) "6
4*---—
_ _—— __
1 43 115 92 1 E 1T°““ (100.0) (100.0) (100.0) ' 2501 100” ISource: sample data T it T it T4.3.23. Previous Occupation
Table 4.3.9 shows the previous occupation of entrepreneurs. It can be noted
that 41 entrepreneurs (i.e. 16.4 per cent) were already in the field of industry owning or
working in industrial units. The entrepreneurs having previous occupation “Tailoring”
started mostly garment units, 10.8 per cent of entrepreneurs belong to this category.
About l6 per cent (40) gulf retumees either started a unit or purchased an earlier unit for
a livelihood. Entrepreneurs having business background (i.e. 14.4 per cent) started SSI
units to support their business. For example, the researcher noticed that bakery shop
owners started food product units and textile shop owners garment units etc. Thus
about 58 per cent (including tailoring, gulf, business and worked in industrial unit) of
entrepreneurs were induced not by DIC to start industrial units. The persons having no
job category started industrial unit is only 9.6 per cent. This shows that DIC has not
succeeded in attracting new entrepreneurs by encouraging them to start new units.
133
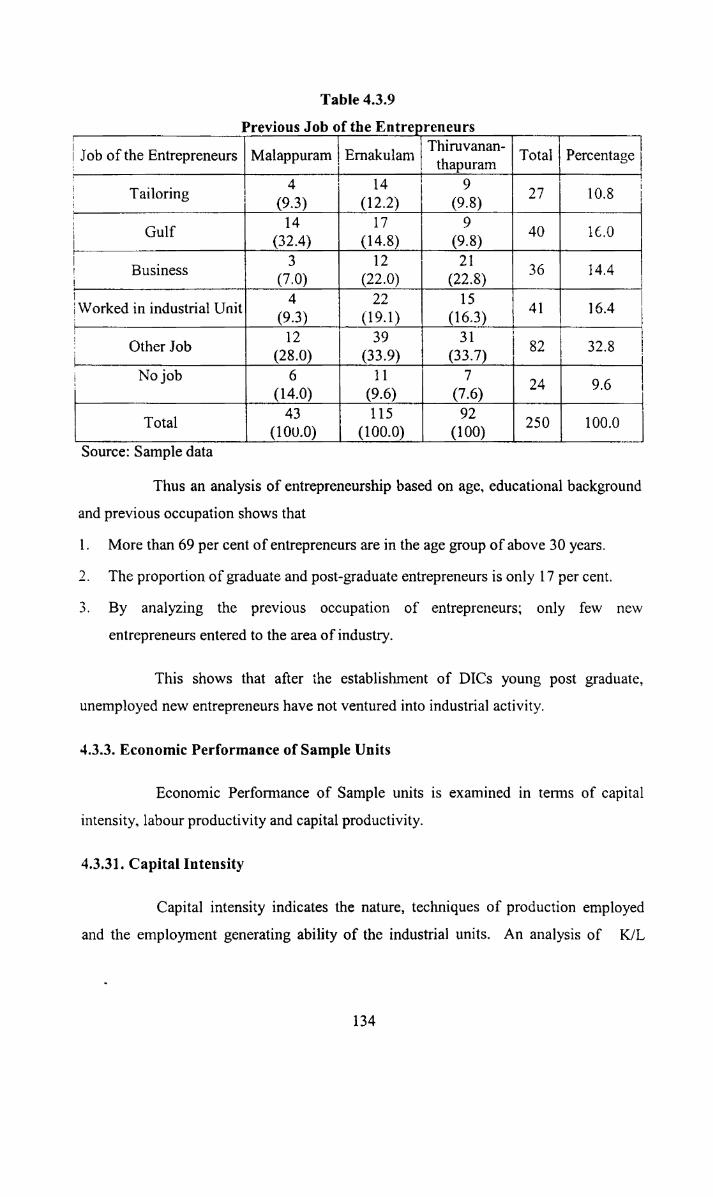
Table 4.3.9
e- 3 .-P5¢vi<>11S Job gfthe Entrz J ob of the Entrepreneurs Malappuram Ernakulam Total 1 Percentag
BI‘€ll€lll‘S_ 4 _- 1Th1ruvanan- 1 ,thtitmrflm
(‘D
1 9
(9.8)»27)1
ic—qnu—u- -r u——b-u
10.8
G“ 1.- <32-4) 1 (14.8).-
Tailoring g 4 ' 14my ' (9.3) J___(_1Z.2)14 17 9 40
(9.8) 16.0 \
iqy
I
' Business 1 3 12(22-0)
1+»
ii 21(22.8)
36 14.4 y
-P
IQIx)
iiworked in industrial Unit (9.3) 4 (19.1)15
(16.3)
|1. 41 16.4 .= 12 39= om J b 1
(__((__ 551° 1 <28-0) .1 133.91
1
1
1
1
1
313“
(33.7)
4-.i_i-_--_ __._
82I_...
-3- vIuo—ivw—v—5- _
32.8
1 No job 6 11 7
(7.6)24 9.6
‘
1 43 5 115T°‘a1 (100.0) , (100.0)@ y (14.0) (9.6)
Source: Sample data“
7 l|"""""' ‘ ""_:'92
(100)250
>
1». I.
100.0
Jim---_
Thus an analysis of entrepreneurship based on age, educational background
and previous occupation shows that
l. More than 69 per cent of entrepreneurs are in the age group of above 30 years.
2. The proportion of graduate and post-graduate entrepreneurs is only 17 per cent.
3. By analyzing the previous occupation of entrepreneurs; only few newentrepreneurs entered to the area of industry.
This shows that after the establishment of DICs young post graduate,
unemployed new entrepreneurs have not ventured into industrial activity.
4.3.3. Economic Performance of Sample Units
Economic Performance of Sample units is examined in terms of capital
intensity, labour productivity and capital productivity.
4.3.31. Capital Intensity
Capital intensity indicates the nature, techniques of production employed
and the employment generating ability of the industrial units. An analysis of K/L
134
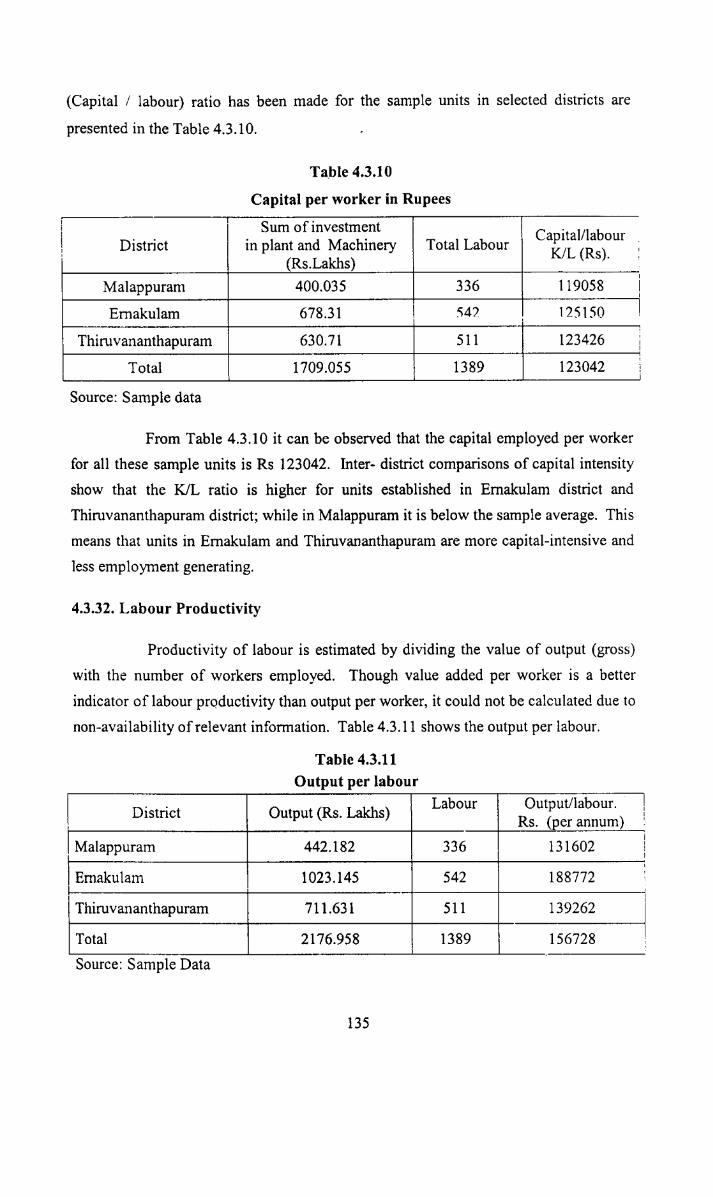
(Capital / labour) ratio has been made for the sample units in selected districts are
presented in the Table 4.3.10. .
Table 4.3.10
Capital per worker in Rupees
_ _....-1----
_. i__Tf—;'.T;_:—"‘__ " '“ ‘; Z'.'_ __ ' ii -ll- -—— [ 7-'-" - " ' '7 7 '24‘ T7 7 77' 8 7 7 7Sum of investment 1 Ca ital/labo
District in plant and Machinery 1 1 IE/L (Rs)1 (Rs.Lakhs) p 8, 'Total Labour ur
Malappuram 400.03 5 336 1191015939 AEmakulam 618.31 542_ 125150
---._::-.:4:_:.:T:tTi.3 ~ 34333:;-3334.4.-- . e.__._<~_—.=-1-6———1Thiruvananthapuram M 630.71 51 1 1 123426
1II
_ __ __ _ii__ 2.1771
I 1389Toralii 1705655 0Source: Sample data
123042
From Table 4.3.10 it can be observed that the capital employed per worker
for all these sample units is Rs 123042. Inter- district comparisons of capital intensity
show that the K/L ratio is higher for units established in Emakulam district and
Thiruvananthapuram district; while in Malappuram it is below the sample average. This
means that units in Emakulam and Thiruvananthapuram are more capital-intensive and
less employment generating.
4.3.32. Labour Productivity
Productivity of labour is estimated by dividing the value of output (gross)
with the number of workers employed. Though value added per worker is a better
indicator of labour productivity than output per worker, it could not be calculated due to
non—availability of relevant information. Table 4.3.11 shows the output per labour.
Table 4.3.11
Output per labour. . , Labour j Output/1abour.iD‘S“E.t--_. _ 1 Omput(RS' S) i 1 RS- (n@I%IJm1m.)
.1
Malappuram 442.182 A 336 ‘t 131602 ‘
1-q‘-,1
Emakulam \ 1023. 8 542 i 18877299Thiruvananthapuram 71 1.63 I 51 1 139262Total 2176.958 it 1389 1* 156728Source: Sample Data n
135
1
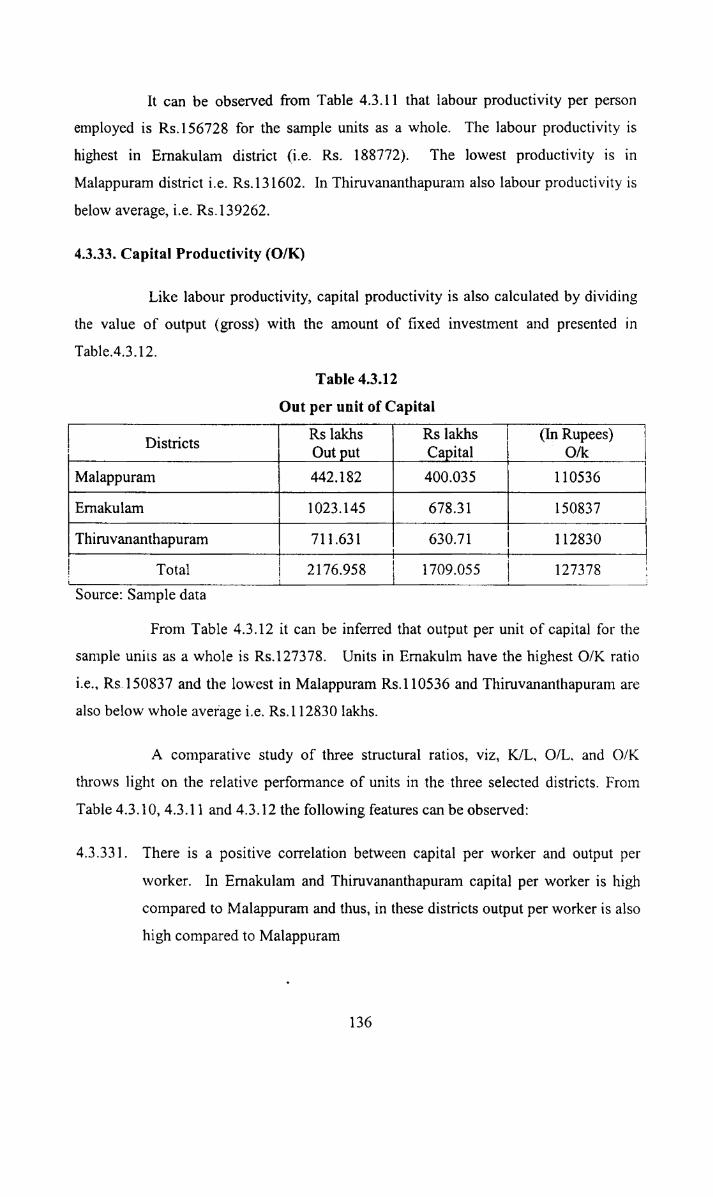
It can be observed from Table 4.3.11 that labour productivity per person
employed is Rs.156728 for the sample units as a whole. The labour productivity is
highest in Emakulam district (i.e. Rs. 188772). The lowest productivity is in
Malappuram district i.e. Rs.13l602. In Thiruvananthapuram also labour productivity is
below average, i.e. Rs.l39262.
4.3.33. Capital Productivity (O/K)
Like labour productivity, capital productivity is also calculated by dividing
the value of output (gross) with the amount of fixed investment and presented inTable.4.3.12.
Table 4.3.12
Out per unit of Capital, _ , _ _ ___ ,__ _,_,_,________7—— —-L — ---— I I | , ,,__________~_--~~~ --I I
Districts Rs lakhs Rs lakhs I (I11 Rupees)l Output _CarpiIa1Malappuram J 442.182 400.035 it 110530Ernakulam 1023.145 678.31 150837:1 ____ I A I __~~_Thiruvananthapu_ram 711.631 630.71 ' 112850
_1q
-Q-o--_-_1_¢..._
_ ,,_ __ _ ___ _, _ 7 g_____7____ _7 D _ _, __Total 2176.958 1709.055 127378._ __ __-. 1. _ ._ 1 __.______ . __....Source: Sample data
From Table 4.3.12 it can be inferred that output per unit of capital for the
sample units as a whole is Rs.l27378. Units in Ernakulm have the highest O/K ratio
i.e., Rs..l50837 and the lowest in Malappuram Rs.110536 and Thiruvananthapuram are
also below whole average i.e. Rs.l12830 lakhs.
A comparative study of three structural ratios, viz, K/L. O/L. and O/K
throws light on the relative performance of units in the three selected districts. From
Table 4.3.10, 4.3.11 and 4.3.12 the following features can be observed:
4.3.331. There is a positive correlation between capital per worker and output per
worker. In Emakulam and Thiruvananthapuram capital per worker is high
compared to Malappuram and thus, in these districts output per worker is also
high compared to Malappuram
136
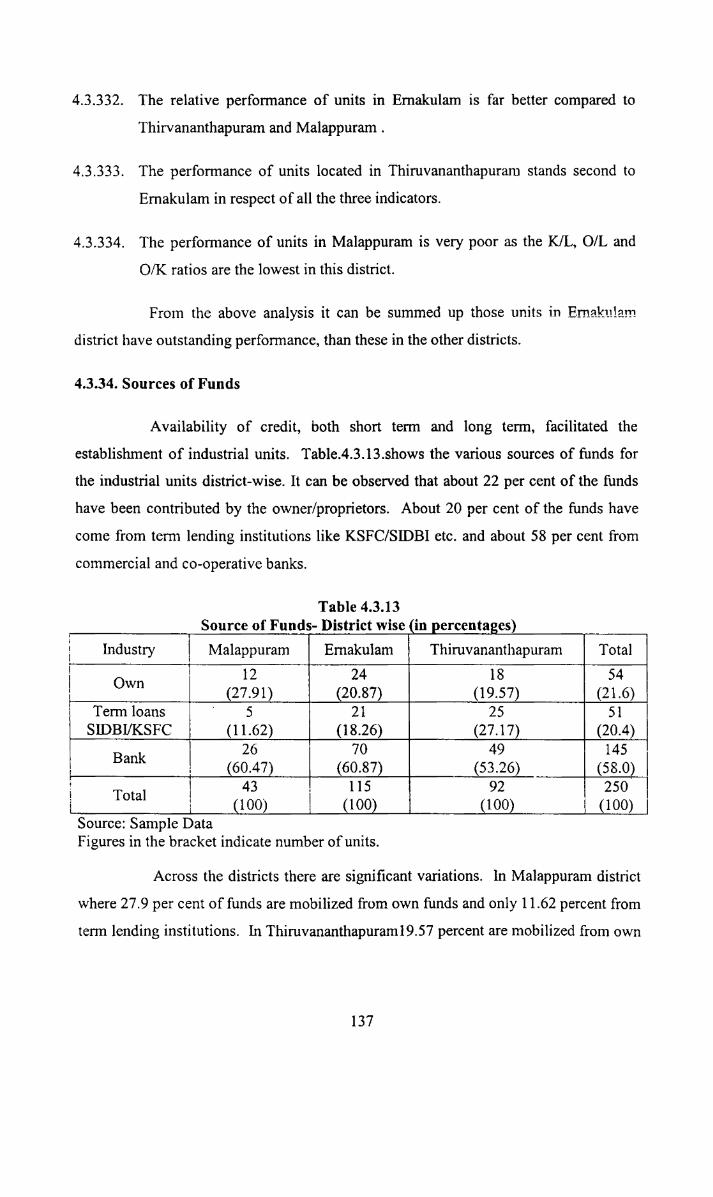
4.3.332. The relative perfonnance of units in Emakulam is far better compared to
Thin/ananthapuram and Malappuram .
4.3.333. The performance of units located in Thiruvananthapuram stands second to
Emakulam in respect of all the three indicators.
4.3.334. The performance of units in Malappuram is very poor as the K/L, O/L and
O/K ratios are the lowest in this district.
Fro1n the above analysis it can be summed up those units in E.rna.ku.1am
district have outstanding performance, than these in the other districts.
4.3.34. Sources of Funds
Availability of credit, both short term and long tenn, facilitated theestablishment of industrial units. Table.4.3.13.shows the various sources of funds for
the industrial units district-wise. It can be observed that about 22 per cent of the funds
have been contributed by the owner/proprietors. About 20 per cent of the funds have
come from tem1 lending institutions like KSFC/SIDBI etc. and about 58 per cent from
commercial and co-operative banks.
Table 4.3.13
A .
l
pg Source of Funds-_Distgrict wise (in percentages)Industry \Own I ‘y Malappuram Emakulam Thiruvananthapuram Total12 1 24 18 54_ (27.91)?) 1 (20.87) p_g_(l9.57) (21.6)Term loans ‘ 5 A 21 25 51
>
$1931/KSFC...Bank \
(11.62)) I (18.26) (27.17) g_ (203)26 70 49 I 145
I
-L--..1
(6O.47)__ 1 (60.87) g(53.26)W (58.0)l
-I5L»)
P1‘4U1
\oto
toui©
T°‘a1 1 (100) 1 (100) j (100) 1 (100)Source: Sample Data T 8 7Figures in the bracket indicate number of units.
Across the districts there are significant variations. ln Malappuram district
where 27.9 per cent of funds are mobilized from own funds and only 11.62 percent from
term lending institutions. In Thiruvananthapuraml9.57 percent are mobilized from own
137

funds and only 27.17 per cent from term lending institutions. These figures for
Emakulam are 20.87 per cent and 18.26 per cent respectively
4.3.4. Linkages
The linkage effects generated by industrial units in the selected districts are
estimated by adopting the methodology of the IDBI Report “IDBI assisted Industrial
Estates in Karnataka and Andhra Pradesh”1, i.e. when inputs are purchased within the
district, income and employment will be created to the local people and hence it is
dccmed to have strong backward linkages. Similarly when output is sold in the same
market it creates a strong forward linkages as some units, which otherwise would have
purchased these products outside the local areas, have access to them within the local
area itself. Purchase of inputs and sale of output outside the district represent leakages.
Table 4.3.14 shows the sources of inputs and place of sale of output for the
three selected districts. A close look at the table shows that only 20.8 per cent of the
inputs purchased by the units are from within the district and the remaining 79.2 per
cent of the inputs are purchased from outside the districts. Similarly, 34.4 per cent of
the sales by the sample units are made within the district and the remaining 65.6 per
cent of the sales are affected outside the districts. This suggests that the backward as
well as the forward linkages of sample units with the hinterland are very weak. The
leakages are more than the linkages.
Table 4.3.14
Source of Inputs and sale of Output__ _ _ ___ .. _ ,.__ __ *'_ '~ __ - - ~~ .4 .Inputs Sale of Output ii
_ District State State District 1 State State 1. l l ‘. . ‘ Within Same 1 Outside 1 Same Same 4 Outside 1Districts 1: 2 7 WMalappumm z 8 21 14 11 20 . 125 118.6) (48.8) <31-6), (126) (46-5>1 1179) 1_ 1 i A pi iEmakulam i 24 62 p 29 l 44 49 22
'_ 1‘1 sh . 1 28 W ig _ f _(20.9) (53.9) (25.2)m p_g (38.3) g_ (42.6);g(19.l) 5. 1 20 1 44 7% 28 1 31 1 33 AThiruvananthapumi 1Total 1 52 17 127 , 62 ,
S (20.8) (50.8) { (28.4), (34.4) (40.8) 4, (24.8) '1
(21.7) (47.8) 1 (30.5) (33.7) (35.9) (30.4) _71 l 86 102 ‘Source: Sample Data.
138

Comparison across the districts suggests that units established in
Thiruvananthapuram and Emakulam districts have higher backward as well as forward
linkages with 21.7 and 20.9 per cent of inputs purchased, 33.7 per cent and 38.3 per cent
of the sales made within the districts respectively. In contrast leakages are very high in
Malappuram district, where only 18.6 per cent of the inputs purchased and 25.6 per cent
of the sales made are within the district. The main reason for a high degree of leakages
in Malappuram district is the poor economic development and lack of purchasing and
sale facilities.
From the above analysis it is inferred that
4.3.41. The units in Emakulam and Thiruvananthapuram districts are generating
maximum linkages, both forward as well as backward, with the hinterland.
4.3.42. The units in Malappuram are having more leakages than linkages.
4.3.43. The linkage effects generated by the sample units with the state are high, as
more than 70 per cent of the inputs purchased and output sold is in the state
itself.
4.3.5. Employment (Linkages)
The employment linkages generated by the SSI units district-wise can be
noted from Table 4.3.16:
Table 4.3.15
Employment — district wise —- Labour Nativity.
Districts Same District Same State Outségtithe Total~' ' ' ‘.'~._ "; ~ T *—' y _i-i¢— .-._ '- - ‘> -- 7' 7'l it '3 3 |Malappuram » 257 42 37 336, 7 (76.5) (12.5) 11.0) (100.0)(1‘ D | ‘ZEmakulam ii 56 1 5421 423 p 63_ K p g _ “ p (78.0) Ma 411.7) (10.3) (100.0)1 379 46 .Thiruvananthapuram M 86 if i 5114 _ (74.0) (9.0) ‘ (17.0) (100.0)
Total E 1059 151 179 gr 1389. . - , __za.--_ (76-0) U1-0) lg (13-0) 1 (100-9)Source: Sample DataFigures in the parenthesis are percentages.
139

It can be observed that employment linkages created by sample units are
very strong with 76 per cent of the total labour is drawn from the same district and only
ll per cent from the same state (other than the district) and the remaining 13 per cent
from outside the state. Comparison among the districts suggests that barring
Thiruvananthapuram. Malappuram and Emakulam between 10 and ll per cent of the
employment created by the labour are outside the state, whereas inThimvananthapuram, it is about l7 percent. The main reason for a high degree of
leakages in employment compared to Malappuram and Eranakulm is that the district is
located on the 'oordcr of Tamil Nadu state and some of the industries are dependent on
Tamil Nadu for labourers.
4.3.6. Factors Influencing Location of the Units
The success of an industrial unit depends on the right choice of location.
Therefore an analysis of the factors influencing the location of the unit is analyzed by
using scaling technique. Weightages were given based on the degree of importancez.
Table 4.3.16 A&B shows the degree of importance of various factors influencing the
location of the unit. (Refer Tables: l, 2, 3, & 4 in Appendices)
Table 4.3.16 (A)
Motivational Factors for Selection of Location
‘ 1 in Avai1.6f' ;,;3X;nI;it :.Av.i1. 1 .Districts 5 Personal ready Of of raw yt Proximity of lncer '‘Preference shed infrast- . ll of market skilled tivet 1 l 6*1 /plot tmcture ma ena S ! 1 labor 2
—_—-3-l_rl_W' "'—“““zri
5-"C)U1
ii 5»-11 CD: Ln
E“O’\oo
5*’c\
1 iMalafipumn‘ 2.42 2.91 1.88 l 3.00 ’n—43 1. Emakulam 4 8 ‘ 5 I '
._.
_ 4.2 3.74 3.48 1 2.65 3.12 l l.83 I 1.90n—1l5 *m_ ggmlgiu g g j ‘ i““’a:i';‘;‘aP“‘a 3.65 2.86 2.62 2.50 1 4.61 2.10
r—*
\£>-$§~
I :1 NAvfggfie ‘ 4.2 4” 3.32 1 3.04 2.61 1 3.60 2.35l'l— 1 '1
:I
1
Source: Sample data Avail. =Avai1abilityDegree of influenceBelow 2 — LOW
2 to 3.99——MODERATE
4 to 6.00——HIGH
l40
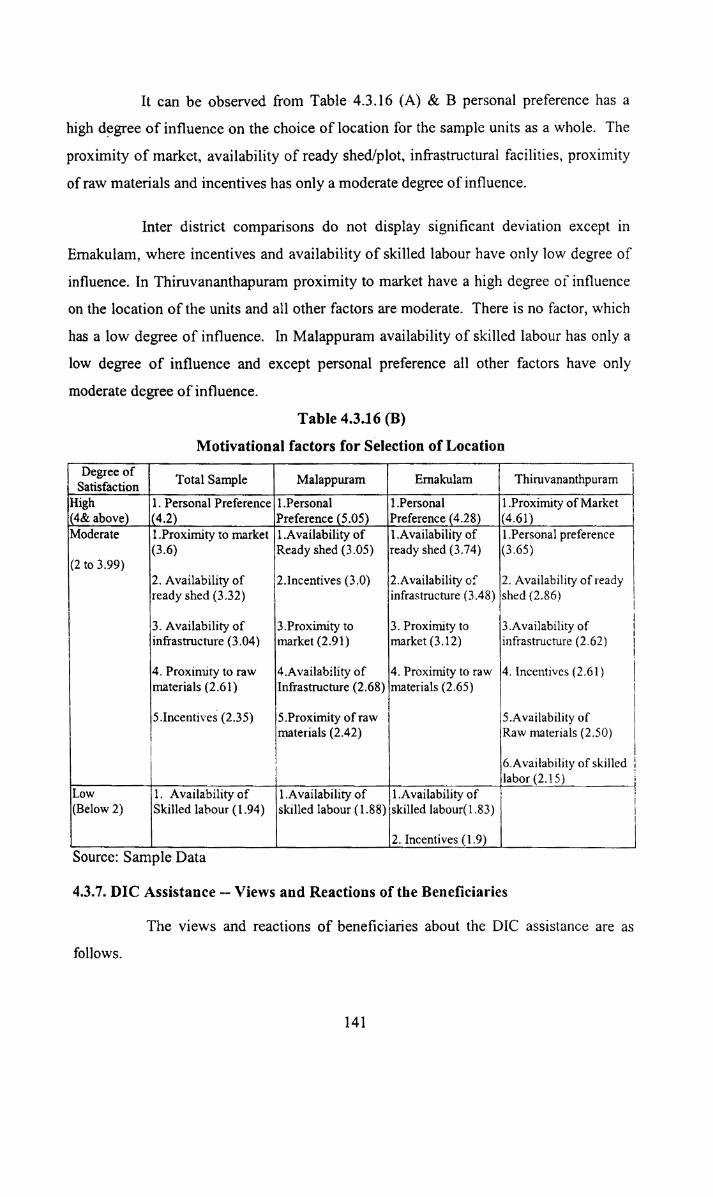
It can be observed from Table 4.3.16 (A) & B personal preference has a
high degree of influence on the choice of location for the sample units as a whole. The
proximity of market, availability of ready shed/plot, infrastructural facilities, proximity
of raw materials and incentives has only a moderate degree of influence.
Inter district comparisons do not display significant deviation except in
Emakulam, where incentives and availability of skilled labour have only low degree of
influence. In Thiruvananthapuram proximity to market have a high degree of influence
on the location of the units and all other factors are moderate. There is no factor, which
has a low degree of influence. In Malappuram availability of skilled labour has only a
low degree of influence and except personal preference all other factors have only
moderate degree of influence.
Table 4.3.16 (B)
Motivational factors for Selection of Location.. _ W ,_ _ _ ~— ___ ~' ____,*--~ , __ _—~ *'- ir1 Degree of 1 ;{ l
Lsafisfacfion A Total Sample E/lalappurarn Y I I§.rnakulam. pg Thiruvananthpuram },High '1. Personal Preference l.Personal l.Pers0nal 1.Proximity of Market '1(4&above) p(4.2)_ W Kg _g Preference (5.05) Preference_(4.28) gg(4.61)_M 5
l
Moderate l.Pr0ximity to market 1 1.Availability of il.Availability of 1 Personal preference ‘(3.6) (Ready shed (3.05) ready shed (3.74) (3.65)(2 to 3.99) ; . ,2. Availability of §2.lncentives (3.0) l2.Availability of Availability of ready1ready shed (3.32) l {infrastructure (3.48) Fshed (2.86). i \ .
aii ‘Ail
--w-1-1.1.-._ ._Z
I ,3. Availability of 3.Pr0:-timity to 3. Pfoximity IO [3.Availability of\ ‘infrastructure (3.04) market (2.91) market (3.12) infrastructure (2.62)l ' l
4. Proximity to raw 4.Availability of 4. Proximity to raw 4. Incentives (2.61)materials (2.61) Infrastructure (2.68) materials (2.65) 1 Il 1 ;; Il I I t
| 1 1I .5.Incentives (2.35) ii5.Proximity of raw ll . 5.Availability ofy imaterials (2.42) §Raw materials (2.50)I i l )6.Availability of Sklllff1 . _ g P: it llabor (Z15) _. i
Low l 1. Availability of 1.Availability of l1.Availability of Y(Below 2) Skilled labour (1.94) skilled labour ( 1.88) lskilled lab0ur( 1 .83)
O
; I- _ _. 2-gI_n¢¢ntiv§$.(1-9) ISource: Sample Data
4.3.7. DIC Assistance -- Views and Reactions of the Beneficiaries
The views and reactions of beneficiaries about the DIC assistance are as
follows.
141
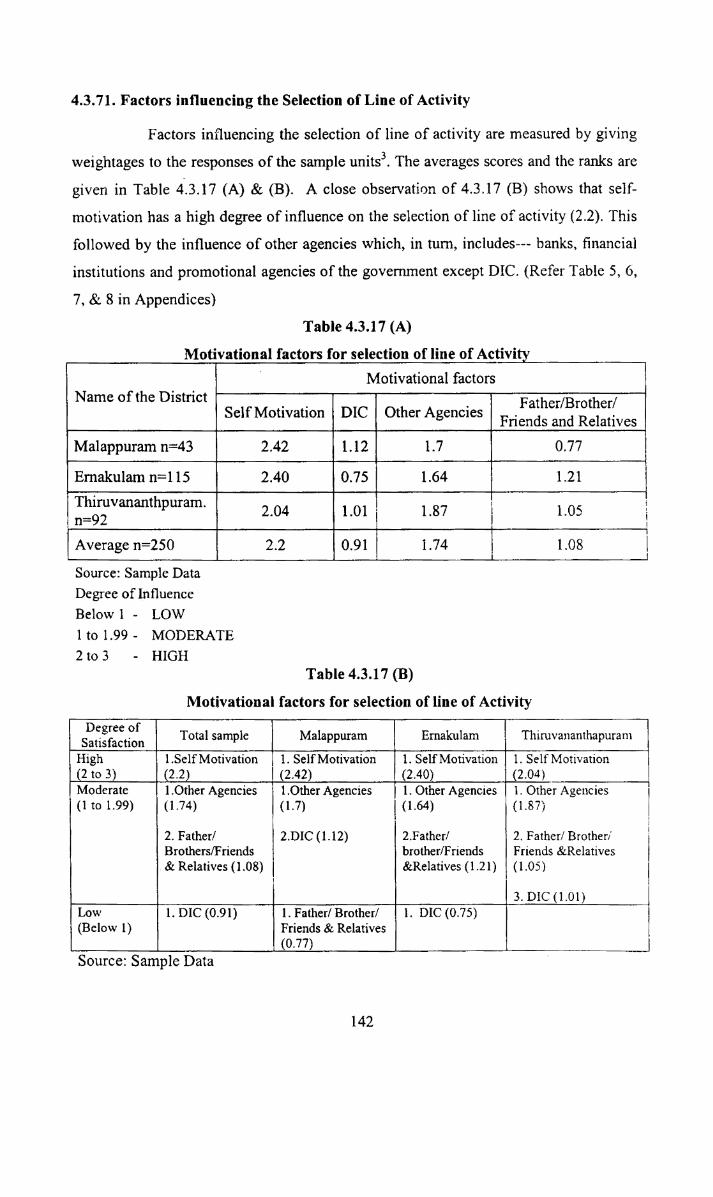
4.3.71. Factors influencing the Selection of Line of Activity
Factors influencing the selection of line of activity are measured by giving
weightages to the responses of the sample units3. The averages scores and the ranks are
given in Table 40.3.17 (A) & (B). A close observation of 4.3.17 (B) shows that self
motivation has a high degree of influence on the selection of line of activity (2.2). This
followed by the influence of other agencies which, in tum, includes-- banks, financial
institutions and promotional agencies of the government except DIC. (Refer Table 5, 6,
7, & 8 in Appendices)
Table 4.3.17 (A)
Motivational factors for selection of line of ActivityY Motivational factors
NameoftheDistrict. it is it is 7 2 1 "T= Self Motivation 1 DIC Other Agencies Father/Brothefl
Friends and Relatives
Malappuram n=43 . 2.42 ) 1.12 1.7 0.77
Ernakulam n=1l5 f 2.40 1 0.75 1.64 1.21
-1,-¢--—
Thiruvananthpuram.n=92 PD _ _ . _ ___ 1. ____ _I _
2.04 1 1.01 ,- 1.87 1.05i|
Average n=250 H 2.2 E 0.91 ' 1.74 _1 1.08|_ , _,_ _
___i._-\-—
Source: Sample DataDegree of InfluenceBelow 1 - LOW1 to 1.99 - MODERATE2 to 3 - HIGH
Table 4.3.17 (B)
Motivational factors for selection of line of Activity
Satisfaction, W
. T" 1 "ST 1 T7A Degree of ‘ Total sample 1 Malappuram I Ernalculam Thiruvananthapuram; High it 1.Se1f Motivation 1 1. Self Motivation 1 1. Self Motivation A 1. Self Motivation‘ (2 to 3) M_ (2.42) (2.40) mj (2.04)‘Moderate . l.Othcr Agencieshiv l.Other Agencies 7 1 l.Other Agencies 1 l. OtherAgencies ‘*7(1 to 1.99) (1.74) (1.7) 1 (1.64) (1.87)
2. Fathcr/ j 2.1)1c(1.12) 2.Father/ ‘~ 2. Father/Brother/’5 Brothers/Friends 4 *1 brother/Friends Friends &RelativesI & Relatives (1.08) &Re1atives (1.21) Y (1.05)
l
1 item H . 1 _ . 3+._D1C (101)
I
I
I
i
Low 1. DIC (0.91) 1. Father/Brothefl 1 1. D10 (0.75)1 (Below 1) F Friends & Relatives.. (0-77) T
i
Source: Sample Data 9142
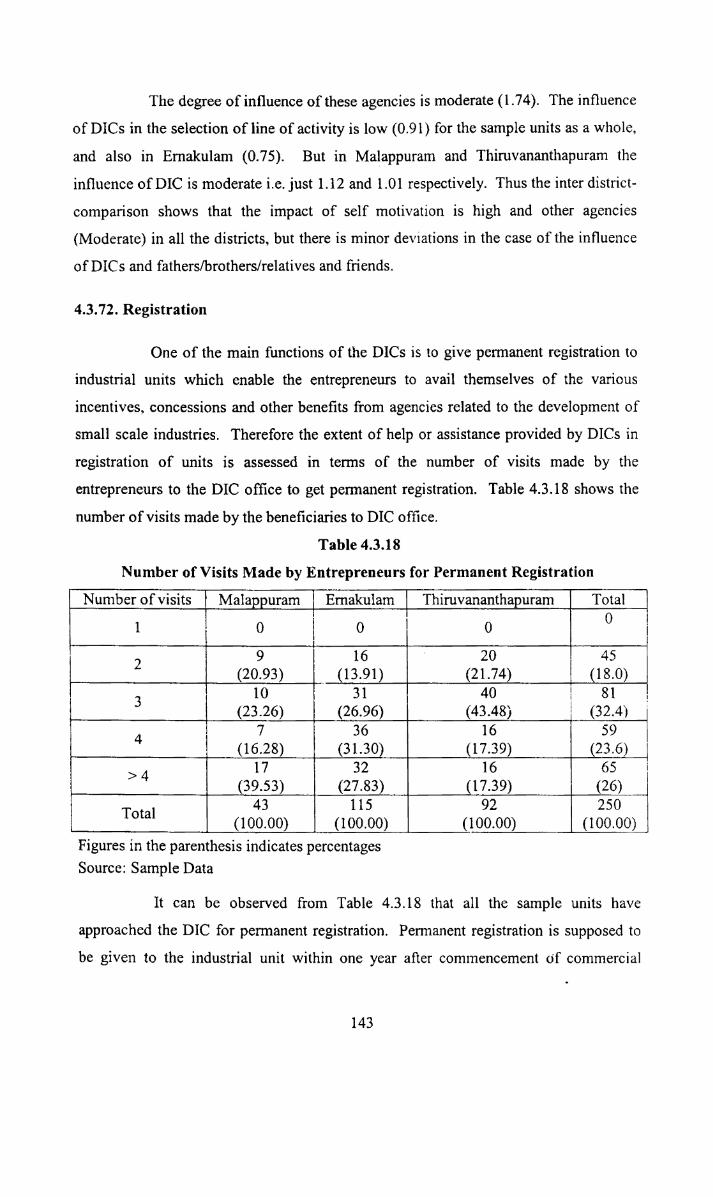
The degree of influence of these agencies is moderate (1.74). The influence
of DICs in the selection of line of activity is low (0.91) for the sample units as a whole,
and also in Emakulam (0.75). But in Malappuram and Thiruvananthapuram the
influence of DIC is moderate i.e. just 1.12 and 1.01 respectively. Thus the inter district
comparison shows that the impact of self motivation is high and other agencies
(Moderate) in all the districts, but there is minor deviations in the case of the influence
of DIC s and fathers/brothers/relatives and friends.
4.3.72. Registration
One of the main functions of the DICs is to give permanent registration to
industrial units which enable the entrepreneurs to avail themselves of the various
incentives, concessions and other benefits from agencies related to the development of
small scale industries. Therefore the extent of help or assistance provided by DICs in
registration of units is assessed in terms of the number of visits made by the
entrepreneurs to the DIC office to get permanent registration. Table 4.3.18 shows the
number of visits made by the beneficiaries to DIC office.
Table 4.3.18
Number of Visits Made by Entrepreneurs for Permanent Registration
Number of visits if 1 lvlalappuram ifiliirnakulam Thiruvanantha uram Total
____-‘Z
5 Tl 01 ;( 0 0 I 01
_7 "*“
\O
2 1 1 20 y 2 745118-0)
16 y(20.93) (13.91) “ _ (21.74) 1 g31 81
___T_
'7.
is 7 13 i 10 i , 40 \(23 26) (26 96 (43 48 ) 4)
_ ____T_
h—l
ON
:/5t/11$@5
’ 7 ‘ 364 E I (31.30) _(l7.39) i (23.6)- gt. 416.28) . .> 4 1 17 32 16. (39.53) 1 (27.83) 3 (17.39) | (26)
_i.___.._i_
1
J
Total 43 115 92 250_ 3 (190-00) (100-09)- (.190-00) (190.-.00)
1
1
Figures in the parenthesis indicates percentages KSource: Sample Data
It can be observed from Table 4.3.18 that all the sample units have
approached the DIC for permanent registration. Permanent registration is supposed to
be given to the industrial unit within one year after commencement of commercial
143
1
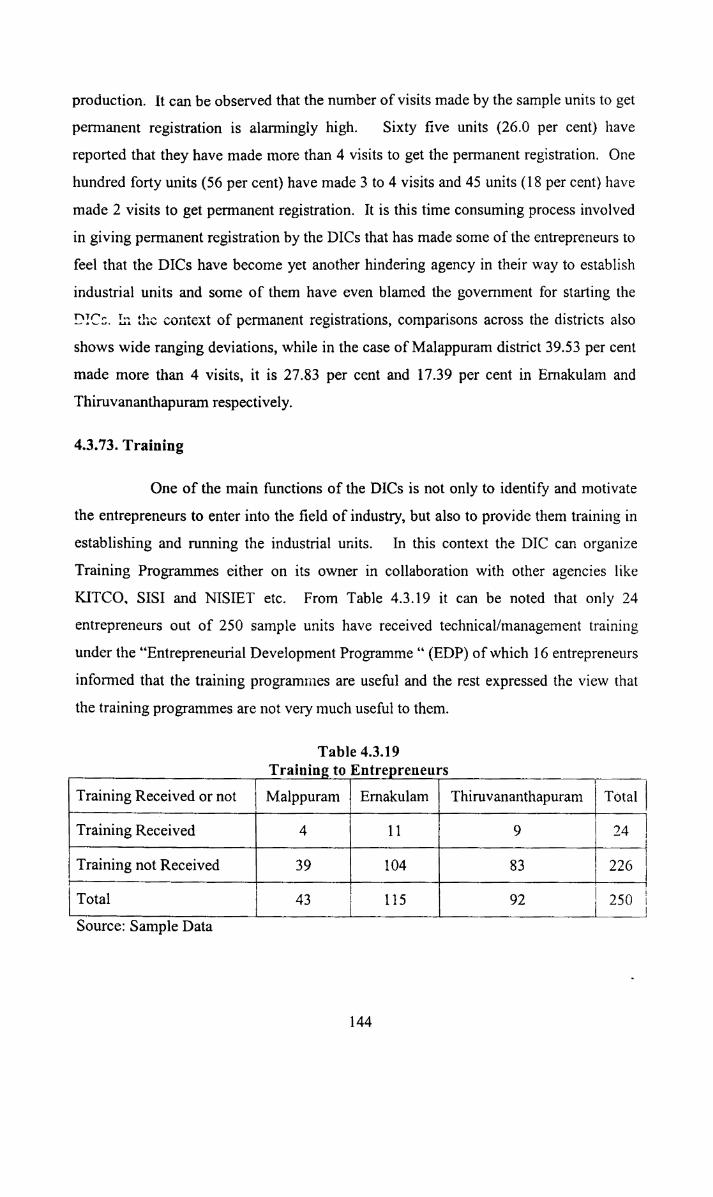
production. It can be observed that the number of visits made by the sample units to get
permanent registration is alarmingly high. Sixty five units (26.0 per cent) have
reported that they have made more than 4 visits to get the permanent registration. One
hundred forty units (56 per cent) have made 3 to 4 visits and 45 units (18 per cent) have
made 2 visits to get permanent registration. It is this time consuming process involved
in giving permanent registration by the DICs that has made some of the entrepreneurs to
feel that the DICs have become yet another hindering agency in their way to establish
industrial units and some of them have even blamed the government for starting the
DICs. In the context of permanent registrations, comparisons across the districts also
shows wide ranging deviations, while in the case of Malappuram district 39.53 per cent
made more than 4 visits, it is 27.83 per cent and 17.39 per cent in Emakulam and
Thiruvananthapuram respectively.
4.3.73. Training
One of the main functions of the DICs is not only to identify and motivate
the entrepreneurs to enter into the field of industry, but also to provide them training in
establishing and running the industrial units. In this context the DIC can organize
Training Programmes either on its owner in collaboration with other agencies like
KITCO. SISI and NISIET etc. From Table 4.3.19 it can be noted that only 24
entrepreneurs out of 250 sample units have received technical/management training
under the “Entrepreneurial Development Programme “ (EDP) of which 16 entrepreneurs
informed that the training programmes are useful and the rest expressed the view that
the training programmes are not very much useful to them.
Table 4.3.19
Training Received or not § Malppuram Emakulam
g _ g g Traininggto Entrepreneurs U pgThiruvananthapuram § Total
-_ In9 24. _ I ‘lTraining Received 4 I l l ;'
-.-.~i.__
Training not Received p 39 104 83 i 226
-—|_ii—--on
T lTotal 7‘. 43 1 115 92 . 250Source: Sample Data“ 7 W7 7
144

4.3.74. Credit
Finance is the lifeblood of industry. The success of industrialization
programmes mainly depends on easy availability of financial assistance, both for fixed
capital investment and for working capital needs. Apart from easy availability,
adequacy of financial assistance at the right time, at reasonable rates of interest
facilitates the growth of industry. In this context this researcher tried to elicit
information about the sources of credit and also the views of the entrepreneurs and their
reactions, which are presented in Table 4.3.20 and 4.3.21.
It can also be observed from Table 4.3.20 that 58 per cent of the
entrepreneurs availed credit assistance from commercial banks, l0 per cent availed
loans from Kerala State Financial Corporation (KSFC), and only 1.6 per cent availed
credit assistance from NSIC (National Small Industries Corporation), for the purchase
of machinery under the Hire Purchase Scheme. Eighteen entrepreneurs availed financial
assistance from Kerala State Small Industries Development Corporation ( KSSIDC), 4
entrepreneurs also availed credit assistance from SIDBI (Small Industries Development
Bank of India) and fifty-eight per cent of the sample units (i.e.l45 units) availed
financial assistance from agencies like SBT, SBI, other nationalised and scheduled
commercial banks. cooperative bank etc.
Table 4.3.20
Agencies Approached for Financial AssistanceI , I - - _. SDistricts KSFC 1.: KSSIDC I NSIC " SIDBI Ba“.k““d. .W _ 7 | A g_ Cooperatlvesocieties.
__l
| Malappuram 3 2 0 O 26
-_- w---w_1
.. ,..,_ . __ '-_ *7 ‘ 'Eranakulam ‘ 12 8 l 2 5 70V ‘ __ .,. - - __77 __ _ _. _:. I __. _ ;Thiruvananthapuram , 10 8 3 4 1 497 W _ _. _t_._ __ _ma‘ I (10.9), _(7.2) , (1.6) ll (2.4) (58.0)
I I25 18 4 » 6 145 ISource: Sample Data I
Table 4.3.21 shows the reactions of entrepreneurs on the adequacy of loan,
time taken for appraisal, procedural difficulties, repayment schedules etc. It can be
I45
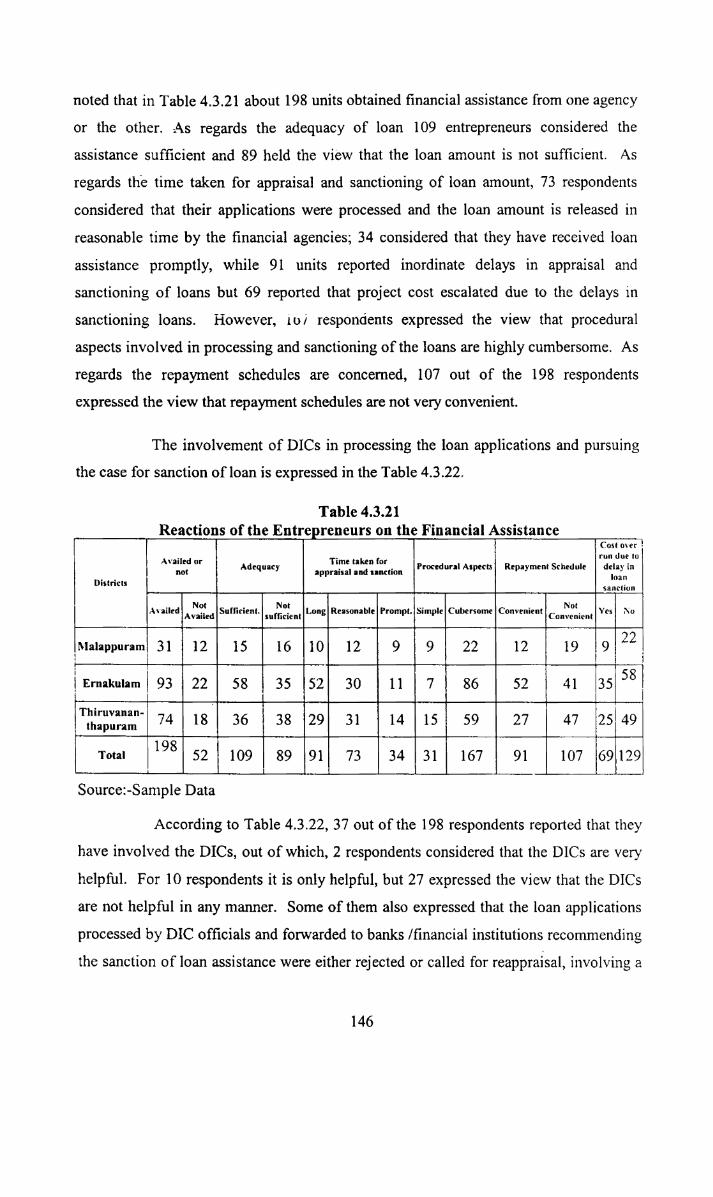
noted that in Table 4.3.21 about 198 units obtained financial assistance from one agency
or the other. As regards the adequacy of loan 109 entrepreneurs considered theassistance sufficient and 89 held the view that the loan amount is not sufficient. As
regards the time taken for appraisal and sanctioning of loan amount, 73 respondents
considered that their applications were processed and the loan amount is released in
reasonable time by the financial agencies; 34 considered that they have received loan
assistance promptly, while 91 units reported inordinate delays in appraisal and
sanctioning of loans but 69 reported that project cost escalated due to the delays in
sanctioning loans. However, io) respondents expressed the view that procedural
aspects involved in processing and sanctioning of the loans are highly cumbersome. As
regards the repayment schedules are concerned, 107 out of the 198 respondents
expressed the view that repayment schedules are not very convenient.
The involvement of DICs in processing the loan applications and pursuing
the case for sanction of loan is expressed in the Table 4.3.22.
Table 4.3.21
_ I Reactions of the Entrepreneurs on the Financial Assistance ‘"WTZT ' ' ”— 1 A ”'_ C A , | ostmer 1, . - . 12 run due to 1' A‘ “ltd or i Adequacy Tiim taken for . Procedural Aspectsi Repayment Schedule delay innot , 3[)|)l'3lS2I| and sanction 1 loan\ 1
‘T441 _
1 Districts 1 .-2 _._._11 . _ __.._,_..._~. 5?.'!¢l'°"' ' 1 1_ . Not . Not 1 i .. . Not _* .A\a1led%iAvaikd Suffienent. wrficiem Long Reasonable Promptnpbnmple Cubersome Convement gcomwnicm Yesi 1\o- A ‘H - ... . . .__;:" 1, 7*." ._._'. I 7-._.' . ..___..1 ~ 11 ,1 '1 11 1Malappuram%31 1 16 10 12 ; 9 91 22 12 19 19122
|Ernakulam1 93 22 58 §35 152 30 111 1 86 52 41 35 58 ;
v--I|\-3
r-4Q13
in.-... ——.___.._.1
1.
i.
1
J
I1 11
ll _ _
1
1 1!.a__.. -,____ W.-. .1 , -1i Thiruvanan- 1 1 1 1 1 '1
Lthapmm 74 18 36 138129 31 114 15 59 27 47 2549L - .. 1 _. ,. - _.__. 1 i iI 1I T0181 198 521* 109 89 1911 73 34 31 167 , 91 107 169,1291 1 1 11——...-_ 3-_._1 i _ __ , I i__ . 1. . 3.. . f, _ . . .1 _'Source:-S ample Data
According to Table 4.3.22, 37 out of the 198 respondents reported that they
have involved the DICs, out of which, 2 respondents considered that the D1Cs are very
helpful. For 10 respondents it is only helpful, but 27 expressed the view that the DICs
are not helpful in any manner. Some of them also expressed that the loan applications
processed by DIC officials and forwarded to banks /financial institutions recommending
the sanction of loan assistance were either rejected or called for reappraisal, involving a
146
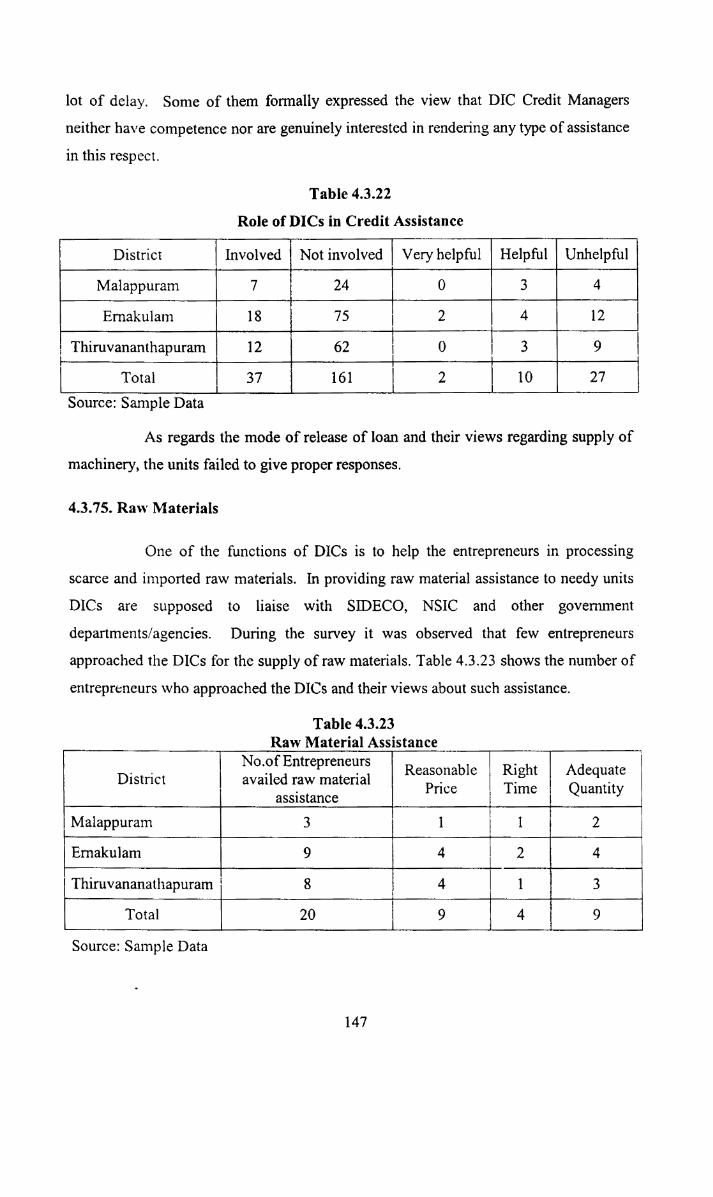
lot of delay. Some of them formally expressed the view that DIC Credit Managers
neither have competence nor are genuinely interested in rendering any type of assistance
in this respect.
Table 4.3.22
Role of DICs in Credit Assistance
! District ‘ Involved l Not involved Very helpful Helpful UnhelpfulI Ti 'I ___._ _ . 1_ l I|
____ _ i ___ __‘i ** ' -' 1* - *—'— "'-' 7Malappuram 7 24. "1 --___..__. ,,.__|
®
DJ
A
A -77 Ki | —WiEmakulam l 18 2 A 4 i2
T »-i
_J?;
\1I U1
hiruvananthapuram= 12 2 62 0 | 3 9Total i 37 E 161 2 IO 27___ M; I li _.,, . l___ ___.
iii
4-1-ii
Source: Sample DataAs regards the mode of release of loan and their views regarding supply of
machinery, the units failed togive proper responses.
4.3.75. Raw Materials
One of the functions of DICs is to help the entrepreneurs in processing
scarce and imported raw materials. In providing raw material assistance to needy units
DICs are supposed to liaise with SIDECO, NSIC and other governmentdepartments/agencies. During the survey it was observed that few entrepreneurs
approached the DICs for the supply of raw materials. Table 4.3.23 shows the number of
entrepreneurs who approached the DICs and their views about such assistance.
Table 4.3.232 Raw MaterialAssiswn¢§-., _i i No.of Entrepreneurs “ R bl 2 R. h. . Ad t; District availed raw material eaaina 6 4 igt y equae1 . Pnce ; Time . Quantity. , __ assistance llalappuram 3 i 1 l l gt 2-_ is ._ __l[ . , 2 . __ iEmakulam 9 } 4 L 2 4I H 7' 7 IMSD 7 7- ‘ flu I‘ U Wl Thiruvananathapuram 8 ll 4 l l 3Total 20 9 1 4 9
Source: Sample Data
147
It can be noted from 4.3.23 that only 20 units approached DICs for raw
material assistance, of which 9 units held that the raw materials were supplied to them
at reasonable prices. But the rest of them were not happy as regards the DIC’s role in
the supply of raw materials. The major complaints in this regard are inordinate delays
and inadequate supplies. In informal discussions, some entrepreneurs expressed the
view that the functional managers in charge of raw material assistance were not helping
them in any manner. They also criticized that the SIDCO are not following any clear
norms for the supply of raw materials and also are more biased in favour of large and
medium scale units. Some of the entrepreneurs criticized the policy of supplying
agencies calling for advance payments before the supply of raw materials, which is
locking up their working capital and in case of any delay the units are not in a position
to purchase them from the open market. Some other entrepreneurs complained that
government raw material price is higher than the open market price; and SIDCO is not
bothered. even though we reported this, because, they are interested only in their salary.
4.3.76. Marketing
DICs are expected to assist the small entrepreneurs in marketing their
products by way of supplying the necessary information to the units about the market
potential, price preference schemes offered by the State and Central govemments,
export possibilities and also liaise with the KSIDC which makes purchases on behalf of
the State Government. During the course of the survey none of the entrepreneurs
reported that they have availed marketing assistance through the DICs. But some
entrepreneurs reported that the DICs helped them in displaying their products by
allotting stalls freely in the trade fairs or exhibitions. In the freely allotted stalls, there is
no lighting facility and sales are very poor; because they allots stalls which lie in the
corner position of exhibition field. But if we pay, we will get much better stalls, where
sales are much better, and thus we abandoned freely allotted stalls and purchasedanother one.
4.3.77. Incentives
In order to attract industries and encourage growth of industrial units the
Central and State governments have announced a package of incentives. The various
incentives offered to industrial units include state / central investment subsidy, concessional
finance, interest subsidy, seed capital/margin money loan, power subsidy etc. Table 4.3.24
shows the number of units, which availed themselves of these incentives.
148
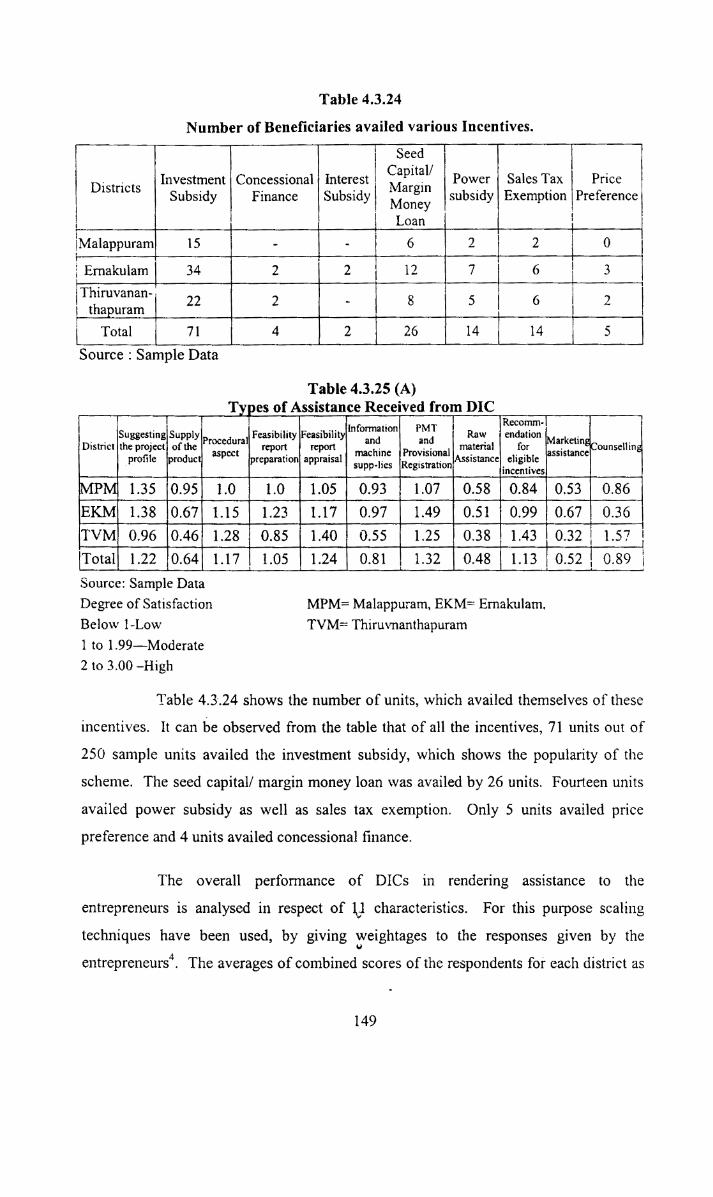
Table 4.3.24
Number of Beneficiaries availed various Incentives.
w- —._Li _Z-__
1
11.___ _ 1. __ .I ___ _ . . J
Districts 1Investment:ConcessionaltllnterestQ Mar in 1 Power A Sales Tax Price iiSubsidy Finance Subsidyl g subsidy i Exemption Preferencel
3 Capital/ A '
1 Money7 L989 1 1 *lMalappuramy 15
ii o\
é l\J
_L.___i ;_
3 .
re be so T 7*Emakulam 34
1 W1 2 3 .2
ii‘l\J
\l
C\
_[__.._
Thiruvanan 022
_ thapuram H
1--.1—.-.._.-,_
2 ‘ - =-6 "11
0° l.
U‘ .
O\
1+
fn-—_-v
1
l
Total 1 71 4
ow
t_._J_
1N1cm
l,__._
"32. .
1;.
K11 to
Source : Sample Data
V Types of Assistance Received from DIC 1 W
Table 4.3.25 (A)V F T“ T V . .1. 1 . . .. . .. lnformation PMT *1 .Rec0n-1m FSuggesting Supply Proccdum Feasibility Feasibility and and 1 Raw - endation “Marketing.District the projecti of the report ' report . . . material for . Counselling
iproduct. aspect preparation appraisal , "“‘°h'?‘° Pr°Y'sw'?al;Assistance eligible asslstancciprofile
_|
- supp-lies Registration.
P 1.35 10.95g A __ N _g g __ H W 1_H g (incentives, at ;l_ !
1.0 1.0 1.05. 0.93 1 1.07 0.58 0.84 0.53" 0.86 ‘. __ 1. _ _ |. .. _, _EKM 1.38 $0.67 1. 15
_
1.23 0.360‘1.17 70.971 1.49 0.51 10.99 10.670l 1, .. l__ .1~~ -- 1 ' f| ' 1 "r ' 1' ‘ iTVM 0.96 0.46.-~ _ 1 1- ' 1 1.28 0.85 1.40 0.55 1.25 1 0.38 . 1.43 0.32 '71___ _ _l ._ iv _ V L A . 1 1 5
g 10.641‘Total 1.22~ *1
1.17 J 1.05 . 1.24 0.81 1.32 0.481 1.13; 0.52 1
lo‘Q
1
__._
0.89 1f.Source: Sample DataDegree of SatisfactionBelow I-Low1 to 1.99-Moderate
2 to 3.00 —High
MPM= Malappuram, EKM== Ernakulam.
TVM= Thiruvnanthapuram
Table 4.3-.24 shows the number of units, which availed themselves of these
incentives. It can be observed from the table that of all the incentives, 71 units out of
250 sample units availed the investment subsidy, which shows the popularity of the
scheme. The seed capital/ margin money loan was availed by 26 units. Fourteen units
availed power subsidy as well as sales tax exemption. Only 5 units availed price
preference and 4 units availed concessional finance.
The overall performance of DICs in rendering assistance to the
entrepreneurs is analysed in respect of 1;/1 characteristics. For this purpose scaling
techniques have been used, by giving weightages to the responses given by theU
4entrepreneurs . The averages of combined scores of the respondents for each district as
149
0 Seed it 0 it 1 1'

well as for the four districts for these ll characteristics can be observed from Table
4.3.25 (A). The Degree of Satisfaction is measured by taking the range of average
scores of 2 to 3, 1 to 1.99 and below one are considered as high , moderate and low
degree of satisfaction respectively, and this can be noted from Table 4.3.25 (B). (Refer
Tables 9, 10, 11, & 12 in Appendices)
Table 4.3.25 (B)
Types of Assistances Received From DIC
:1 Degree .of i Total Sample Malappuram ; Emakulam iThiru\/anantliap-uramlsfltlsfast ~ a ll ' I . . ul ..A 5'5‘; V p Nil Nil g p nit % 1\1lM -3. .ion H pp g_ J g H . g
3 Moderate 31.Permanent& 1.Suggesting the l1.Permanent and iil.C0unselling(l.57)1 to 1.99 (provisional registration Project Profiles (1.35) Provisional 1(1.32) 5; 1 registration. (1.49)
l
2.Feasibility Report 12. Permanent and i2.Suggesting the l2.Recommendations iAppraisal 1.24 I rovisional Project Profiles (1.38) A of eligible incentivesP .registration (1.07) l (1.43).3.Suggesting The l3.Feasiblity Report l3.Feasibility Report 13.Feasibili1'y ReportProject Profiles (1.22) Appraisal (1.05) 3 Preparation (1.23) Appraisal (1.40)
.; 4.Procedural ‘4.Procedural Aspect T4.Feasbility Report 4.Procedural aspect§Aspect (1.17) (1.0) .Appraisal (1.17) ((1.8)5.Recommendationsof i5.Feasibility Report p5.Procedural Aspect 5. Pemianent andeligible 7Preparation (1.0) l(l.l5) provisionaliincent1ves( 1.13) A i (registration ( l .25)l l 1t6.Feasibility Report E E) .
_,_,,i-.-.- i-ii __
A P[CE1I'E1Ii0I1 1 O5
‘Below l A Product (0.95) of the eligible lPr0ject Profile (0.96)1 ; incentives (0.99) =l §2.lnformation and 2.lnf0rmation ‘2.Infomiation & l2.Feasibility Report l
iMachine supplies .&Machine Supplies Machine Supplies Preparation (0.85) i(0.81) l(0.93) (0.97)
,,_,l..-.-—-—
l‘3. Supply of the 3.Counselling (0.86) .3.Mz-irketing §3.I.I1fOITl13.lI1011'£111(i iProduct (0.64) A Assistance (0.67) Machine supplies (0.55)
?(0.52) “of eligible Incentives ‘Product (0.67) Product (0.46)1 (0.84) .5.RawmaterialE 5 @ assistance (0.3 8)1 ;‘5.Raw material i5.Rawmaterial l5.RawmaterialAssistance (0.48) lAssistance (0.58) 5 assistance (0.51) ‘ \
6.Marketing _6.Counsell1ng(0.36) [6.Marketing& 1 M M 1 ;AssiS§an<=@ (0-53) - si fl$Si$tan¢¢(0-32).-.(_Source:- Sample Data _
150
. (- - - on . ..-.-a-_ 1Low l1.Counselling (0.89) l.Supp1y of the p l.Recommendations 1.Suggesting the ‘
||I
l
‘4.Marketing Assistance 4.Recommendations *4.Supply of the ll4.Supply of the l
l