Chapter 7: Pediatric ESRD 2014 A NNUAL D ATA R EPORT V OLUME 2: E ND -S TAGE R ENAL D ISEASE.
29
Chapter 7: Pediatric ESRD 2014 ANNUAL DATA REPORT VOLUME 2: END-STAGE RENAL DISEASE
-
Upload
brennan-gillham -
Category
Documents
-
view
218 -
download
3
Transcript of Chapter 7: Pediatric ESRD 2014 A NNUAL D ATA R EPORT V OLUME 2: E ND -S TAGE R ENAL D ISEASE.
Chapter 7: Pediatric ESRD
2014 ANNUAL DATA REPORTVOLUME 2: END-STAGE RENAL
DISEASE
2Vol 2, ESRD, Ch 7
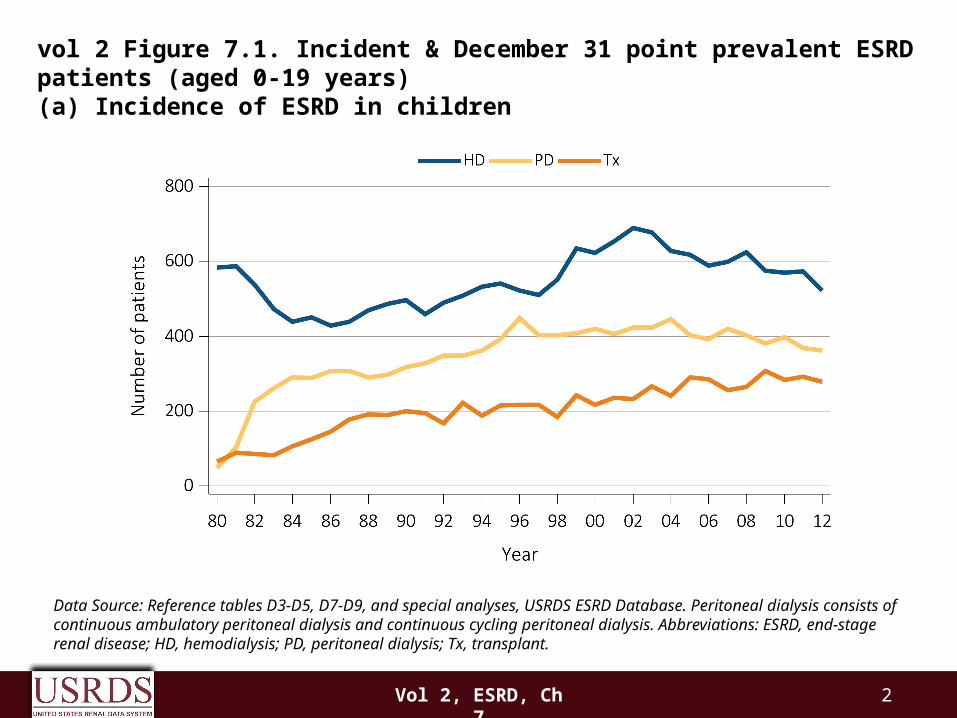
Data Source: Reference tables D3-D5, D7-D9, and special analyses, USRDS ESRD Database. Peritoneal dialysis consists of continuous ambulatory peritoneal dialysis and continuous cycling peritoneal dialysis. Abbreviations: ESRD, end-stage renal disease; HD, hemodialysis; PD, peritoneal dialysis; Tx, transplant.
vol 2 Figure 7.1. Incident & December 31 point prevalent ESRD patients (aged 0-19 years)(a) Incidence of ESRD in children

3Vol 2, ESRD, Ch 7
Data Source: Reference tables D3-D5, D7-D9, and special analyses, USRDS ESRD Database. Peritoneal dialysis consists of continuous ambulatory peritoneal dialysis and continuous cycling peritoneal dialysis. Abbreviations: ESRD, end-stage renal disease; HD, hemodialysis; PD, peritoneal dialysis; Tx, transplant.
vol 2 Figure 7.1. Incident & December 31 point prevalent ESRD patients (aged 0-19 years) (b) Prevalence of ESRD in children
4Vol 2, ESRD, Ch 7
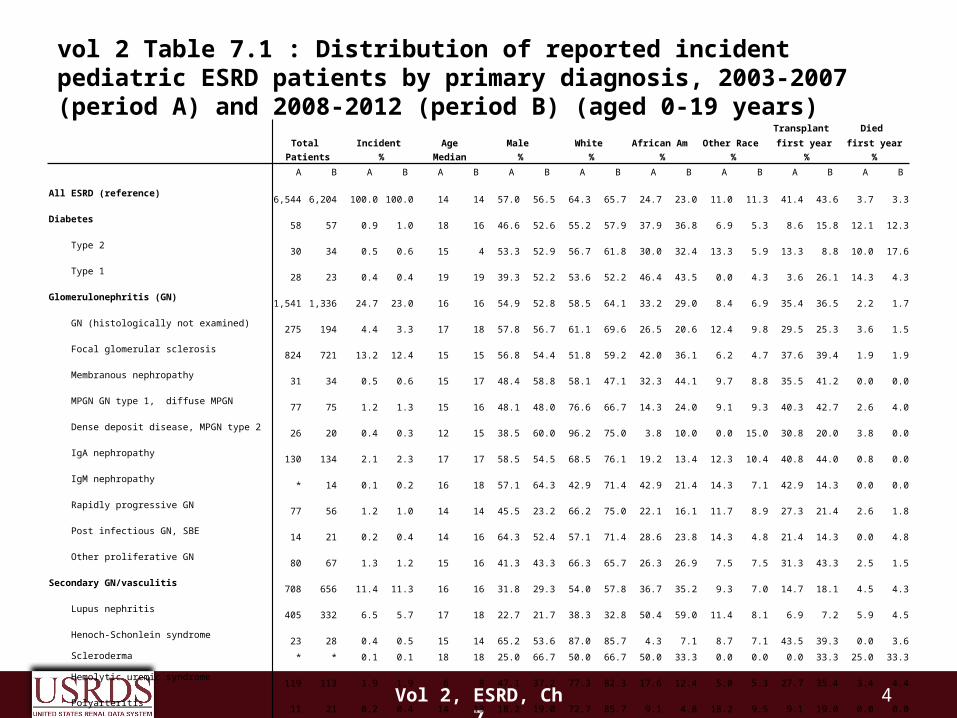
vol 2 Table 7.1 : Distribution of reported incident pediatric ESRD patients by primary diagnosis, 2003-2007 (period A) and 2008-2012 (period B) (aged 0-19 years)
Transplant Died
Total Incident Age Male White African Am Other Race first year first yearPatients % Median % % % % % %
A B A B A B A B A B A B A B A B A B
All ESRD (reference) 6,544 6,204 100.0 100.0 14 14 57.0 56.5 64.3 65.7 24.7 23.0 11.0 11.3 41.4 43.6 3.7 3.3Diabetes 58 57 0.9 1.0 18 16 46.6 52.6 55.2 57.9 37.9 36.8 6.9 5.3 8.6 15.8 12.1 12.3 Type 2 30 34 0.5 0.6 15 4 53.3 52.9 56.7 61.8 30.0 32.4 13.3 5.9 13.3 8.8 10.0 17.6 Type 1 28 23 0.4 0.4 19 19 39.3 52.2 53.6 52.2 46.4 43.5 0.0 4.3 3.6 26.1 14.3 4.3
Glomerulonephritis (GN) 1,541 1,336 24.7 23.0 16 16 54.9 52.8 58.5 64.1 33.2 29.0 8.4 6.9 35.4 36.5 2.2 1.7 GN (histologically not examined) 275 194 4.4 3.3 17 18 57.8 56.7 61.1 69.6 26.5 20.6 12.4 9.8 29.5 25.3 3.6 1.5 Focal glomerular sclerosis 824 721 13.2 12.4 15 15 56.8 54.4 51.8 59.2 42.0 36.1 6.2 4.7 37.6 39.4 1.9 1.9
Membranous nephropathy 31 34 0.5 0.6 15 17 48.4 58.8 58.1 47.1 32.3 44.1 9.7 8.8 35.5 41.2 0.0 0.0 MPGN GN type 1, diffuse MPGN 77 75 1.2 1.3 15 16 48.1 48.0 76.6 66.7 14.3 24.0 9.1 9.3 40.3 42.7 2.6 4.0 Dense deposit disease, MPGN type 2 26 20 0.4 0.3 12 15 38.5 60.0 96.2 75.0 3.8 10.0 0.0 15.0 30.8 20.0 3.8 0.0 IgA nephropathy 130 134 2.1 2.3 17 17 58.5 54.5 68.5 76.1 19.2 13.4 12.3 10.4 40.8 44.0 0.8 0.0
IgM nephropathy * 14 0.1 0.2 16 18 57.1 64.3 42.9 71.4 42.9 21.4 14.3 7.1 42.9 14.3 0.0 0.0 Rapidly progressive GN 77 56 1.2 1.0 14 14 45.5 23.2 66.2 75.0 22.1 16.1 11.7 8.9 27.3 21.4 2.6 1.8
Post infectious GN, SBE 14 21 0.2 0.4 14 16 64.3 52.4 57.1 71.4 28.6 23.8 14.3 4.8 21.4 14.3 0.0 4.8 Other proliferative GN 80 67 1.3 1.2 15 16 41.3 43.3 66.3 65.7 26.3 26.9 7.5 7.5 31.3 43.3 2.5 1.5Secondary GN/vasculitis 708 656 11.4 11.3 16 16 31.8 29.3 54.0 57.8 36.7 35.2 9.3 7.0 14.7 18.1 4.5 4.3 Lupus nephritis 405 332 6.5 5.7 17 18 22.7 21.7 38.3 32.8 50.4 59.0 11.4 8.1 6.9 7.2 5.9 4.5 Henoch-Schonlein syndrome 23 28 0.4 0.5 15 14 65.2 53.6 87.0 85.7 4.3 7.1 8.7 7.1 43.5 39.3 0.0 3.6 Scleroderma * * 0.1 0.1 18 18 25.0 66.7 50.0 66.7 50.0 33.3 0.0 0.0 0.0 33.3 25.0 33.3
Hemolytic uremic syndrome 119 113 1.9 1.9 6 8 47.1 37.2 77.3 82.3 17.6 12.4 5.0 5.3 27.7 35.4 3.4 4.4
Polyarteritis 11 21 0.2 0.4 14 13 18.2 19.0 72.7 85.7 9.1 4.8 18.2 9.5 9.1 19.0 0.0 0.0 Wegeners granulomatosis 60 56 1.0 1.0 15 16 56.7 42.9 70.0 89.3 23.3 7.1 6.7 3.6 20.0 23.2 3.3 1.8 Other vasculitis and its derivatives 58 54 0.9 0.9 15 13 25.9 33.3 69.0 72.2 25.9 16.7 5.2 11.1 24.1 29.6 1.7 5.6
Goodpasture syndrome 14 33 0.2 0.6 16 17 28.6 27.3 85.7 93.9 7.1 3.0 7.1 3.0 21.4 18.2 0.0 3.0
Secondary GN, other 14 16 0.2 0.3 14 17 42.9 37.5 78.6 81.3 7.1 18.8 14.3 0.0 21.4 25.0 0.0 6.3
5Vol 2, ESRD, Ch 7
Transplant Died
Total Incident Age Male White African Am Other Race first year first yearPatients % Median % % % % % %
A B A B A B A B A B A B A B A B A B
Interstitial nephritis/pyelonephritis 391 289 6.3 5.0 15 15 52.7 50.9 81.3 81.3 12.8 11.1 5.9 7.6 47.8 54.7 2.0 4.8 Nephropathy caused by other agents 41 37 0.7 0.6 15 14 56.1 56.8 82.9 83.8 14.6 10.8 2.4 5.4 53.7 29.7 9.8 10.8 Nephrolithiasis * 11 0.1 0.2 12 16 44.4 27.3 100.0 90.9 0.0 0.0 0.0 9.1 100.0 81.8 0.0 9.1 Acquired obstructive uropathy 48 30 0.8 0.5 15 14 77.1 76.7 66.7 80.0 22.9 16.7 10.4 3.3 45.8 46.7 0.0 0.0 Chronic pyelonephritis, reflux nephropathy 201 143 3.2 2.5 15 15 44.3 45.5 88.6 84.6 6.5 7.0 5.0 8.4 48.3 60.8 0.5 2.8 Chronic interstitial nephritis 75 60 1.2 1.0 14 16 57.3 46.7 73.3 73.3 20.0 16.7 6.7 10.0 46.7 56.7 2.7 3.3 Acute interstitial nephritis * * 0.0 0.1 11 11 33.3 100.0 33.3 50.0 66.7 50.0 0.0 0.0 0.0 50.0 0.0 50.0 Disorders of calcium metabolism * . 0.1 . 15 . 20.0 . 80.0 . 20.0 . 0.0 . 20.0 . 0.0 .Hypertensive/large vessel disease 283 260 4.5 4.5 17 18 55.8 57.3 52.3 54.6 41.3 41.5 6.4 3.8 23.7 19.6 5.3 3.8 Unspecified with renal failure 266 244 4.3 4.2 18 18 56.8 57.4 50.0 52.9 43.6 43.4 6.4 3.7 22.9 18.0 5.3 4.1 Renal artery stenosis * * 0.1 0.2 14 14 57.1 66.7 85.7 77.8 14.3 11.1 0.0 11.1 42.9 55.6 0.0 0.0 Renal artery occlusion * * 0.1 0.1 0 17 22.2 20.0 88.9 80.0 0.0 20.0 11.1 0.0 22.2 20.0 11.1 0.0Cystic/hereditary/congenital diseases 2,088 2,229 33.5 38.3 10 10 68.1 67.4 75.2 74.8 18.0 18.5 6.8 6.6 51.1 51.1 3.2 2.8 Polycystic kidneys, adult type (dominant) 30 33 0.5 0.6 14 15 43.3 57.6 83.3 72.7 13.3 27.3 3.3 0.0 60.0 51.5 0.0 0.0 Polycystic, infantile (recessive) 142 150 2.3 2.6 9 1 56.3 44.7 76.1 78.0 16.9 16.7 7.0 5.3 53.5 39.3 7.0 11.3 Medullary cystic disease, inc. nephronophthisis 97 106 1.6 1.8 11 13 36.1 50.0 84.5 84.9 4.1 7.5 11.3 7.5 69.1 70.8 1.0 0.0 Tuberous sclerosis * * 0.1 0.1 17 18 37.5 40.0 50.0 40.0 50.0 60.0 0.0 0.0 25.0 20.0 0.0 0.0 Hereditary nephritis, Alport's syndrome 152 133 2.4 2.3 16 17 83.6 83.5 74.3 64.7 20.4 24.1 5.3 11.3 50.0 48.9 1.3 0.0 Cystinosis 62 49 1.0 0.8 12 13 51.6 59.2 90.3 91.8 9.7 8.2 0.0 0.0 77.4 75.5 0.0 0.0 Primary oxalosis 17 * 0.3 0.2 8 2 52.9 80.0 82.4 80.0 11.8 10.0 5.9 10.0 47.1 70.0 0.0 0.0 Congenital nephrotic syndrome 136 131 2.2 2.3 2 3 55.9 54.2 71.3 80.2 19.9 12.2 8.8 7.6 50.7 48.9 8.1 4.6 Drash syndrome, mesangial sclerosis 15 29 0.2 0.5 1 0 60.0 58.6 80.0 82.8 0.0 17.2 20.0 0.0 26.7 34.5 13.3 6.9 Congenital ureterpelvic junction obstruction 31 43 0.5 0.7 11 13 80.6 86.0 77.4 60.5 16.1 39.5 6.5 0.0 51.6 48.8 0.0 2.3 Congenital uretrovesical junction obstruction 25 50 0.4 0.9 13 11 88.0 86.0 72.0 70.0 28.0 20.0 0.0 10.0 52.0 50.0 0.0 2.0 Other congenital obstructive uropathy 514 514 8.2 8.8 11 10 84.6 81.5 68.5 71.8 23.5 23.7 8.0 4.5 45.1 48.2 2.7 1.2 Renal hypoplasia, dysplasia, oligonephronia 698 691 11.2 11.9 10 9 62.3 62.4 76.9 75.5 15.9 16.9 7.2 7.5 50.0 52.2 3.4 2.9 Prune belly syndrome 82 80 1.3 1.4 7 5 97.6 98.8 75.6 67.5 22.0 27.5 2.4 5.0 56.1 55.0 0.0 1.3 Other (congenital malformation syndromes) 79 204 1.3 3.5 14 12 50.6 56.4 83.5 78.9 13.9 10.3 2.5 10.8 55.7 51.0 2.5 4.4
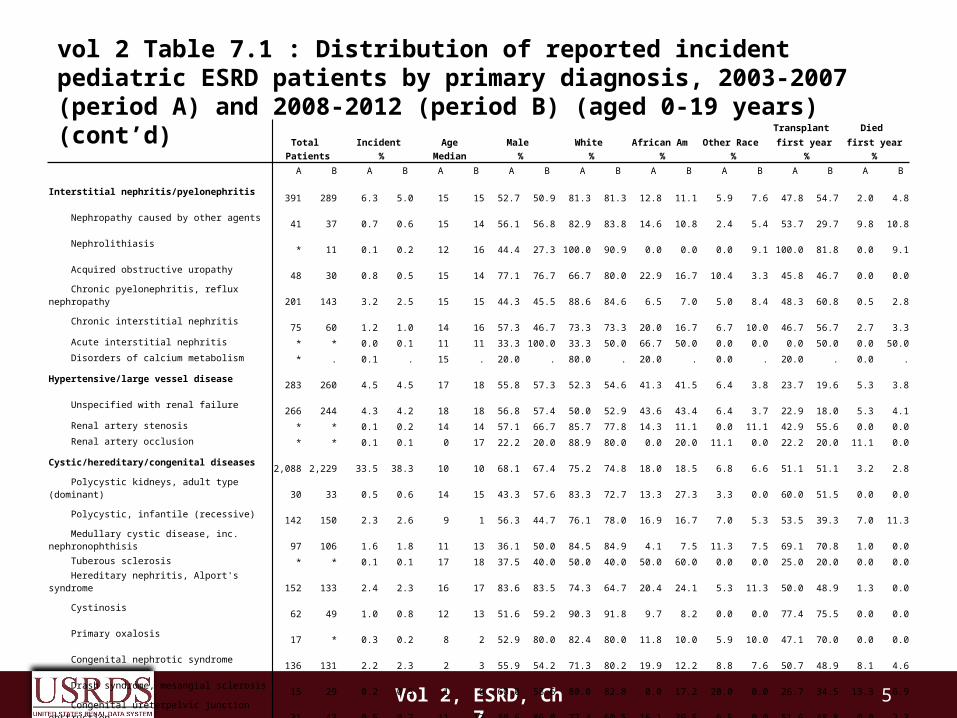
vol 2 Table 7.1 : Distribution of reported incident pediatric ESRD patients by primary diagnosis, 2003-2007 (period A) and 2008-2012 (period B) (aged 0-19 years) (cont’d)
6Vol 2, ESRD, Ch 7
Transplant Died
Total Incident Age Male White African Am Other Race first year first year
Patients % Median % % % % % %
A B A B A B A B A B A B A B A B A B
Neoplasms/tumors 161 122 2.6 2.1 14 14 50.9 50.8 71.4 68.0 21.1 22.1 7.5 9.8 32.3 32.0 14.3 15.6
Renal tumor (malignant) 38 33 0.6 0.6 5 5 44.7 39.4 63.2 66.7 28.9 27.3 7.9 6.1 7.9 18.2 26.3 15.2
Renal tumor (unspecified) * * 0.1 0.0 17 1 0.0 100.0 50.0 0.0 25.0 100.0 25.0 0.0 50.0 100.0 0.0 0.0
Transplanted organ complication, unspecified 21 * 0.3 0.0 14 16 47.6 50.0 71.4 50.0 23.8 50.0 4.8 0.0 28.6 50.0 19.0 0.0
Transplanted kidney complication 46 13 0.7 0.2 15 17 58.7 76.9 73.9 84.6 19.6 15.4 6.5 0.0 58.7 23.1 0.0 0.0
Transplanted liver complication * * 0.1 0.1 17 15 62.5 25.0 62.5 62.5 25.0 12.5 12.5 25.0 50.0 87.5 0.0 0.0
Transplanted heart complication 20 25 0.3 0.4 14 15 55.0 52.0 80.0 64.0 15.0 24.0 5.0 12.0 30.0 48.0 20.0 16.0
Bone marrow transplant complication 12 25 0.2 0.4 12 17 50.0 60.0 91.7 64.0 8.3 28.0 0.0 8.0 8.3 12.0 33.3 12.0
Miscellaneous conditions 406 389 6.5 6.7 13 13 55.4 55.3 66.7 73.8 28.1 18.3 5.2 8.0 36.2 36.2 8.9 6.9
Sickle cell disease/anemia 14 * 0.2 0.2 18 18 64.3 90.0 0.0 10.0 100.0 90.0 0.0 0.0 14.3 10.0 21.4 0.0
Post partum renal failure * * 0.1 0.1 17 19 11.1 0.0 66.7 71.4 33.3 14.3 0.0 14.3 33.3 0.0 0.0 0.0
AIDS nephropathy 44 15 0.7 0.3 16 18 47.7 53.3 13.6 0.0 86.4 100.0 0.0 0.0 0.0 0.0 13.6 20.0
Traumatic or surgical loss of kidney(s) 15 * 0.2 0.2 8 13 66.7 60.0 93.3 50.0 6.7 40.0 0.0 10.0 40.0 20.0 13.3 10.0
Hepatorenal syndrome * * 0.1 0.1 11 16 25.0 50.0 75.0 66.7 25.0 0.0 0.0 33.3 0.0 50.0 75.0 16.7
Tubular necrosis 114 131 1.8 2.3 2 11 51.8 60.3 78.9 79.4 14.0 14.5 7.0 6.1 15.8 20.6 9.6 10.7
Other renal disorders 205 210 3.3 3.6 13 12 60.5 52.4 74.1 80.0 19.5 11.0 6.3 9.0 57.6 51.4 5.4 3.8
Etiology uncertain 600 476 9.6 8.2 15 15 58.5 57.1 71.8 70.2 20.3 21.8 7.8 8.0 39.3 44.1 3.2 1.5
Missing 308 390 4.9 6.7 13 14 62.0 59.2 13.0 14.9 3.9 7.7 83.1 77.4 96.4 90.5 1.3 2.3
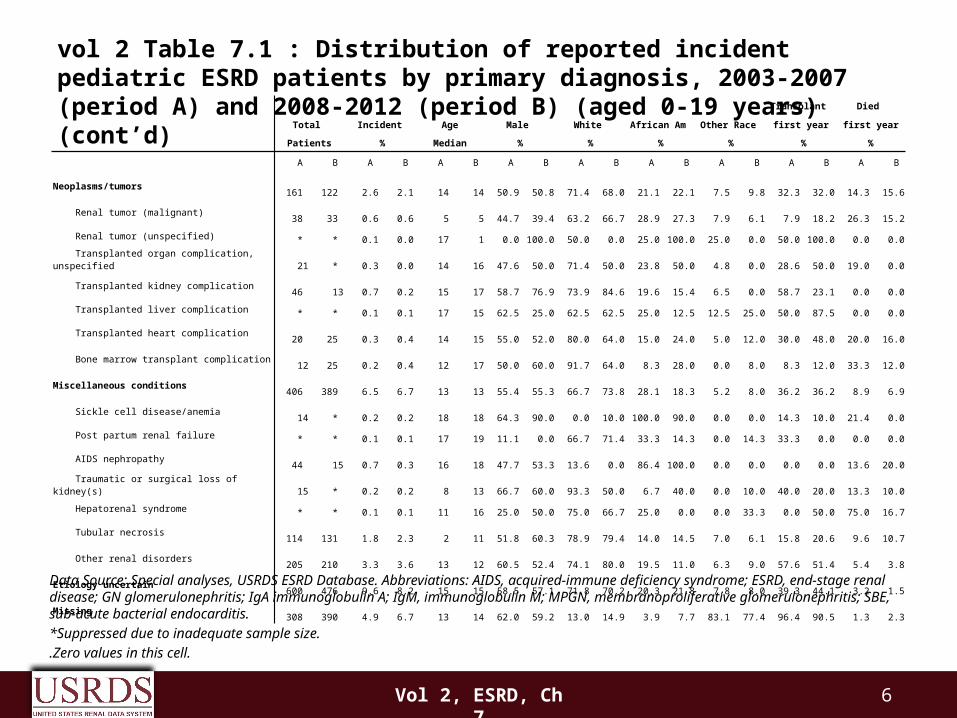
Data Source: Special analyses, USRDS ESRD Database. Abbreviations: AIDS, acquired-immune deficiency syndrome; ESRD, end-stage renal disease; GN glomerulonephritis; IgA immunoglobulin A; IgM, immunoglobulin M; MPGN, membranoproliferative glomerulonephritis; SBE, sub-acute bacterial endocarditis.*Suppressed due to inadequate sample size..Zero values in this cell.
vol 2 Table 7.1 : Distribution of reported incident pediatric ESRD patients by primary diagnosis, 2003-2007 (period A) and 2008-2012 (period B) (aged 0-19 years) (cont’d)

7Vol 2, ESRD, Ch 7
Data Source: Reference tables A1, E9, M1, and special analyses, USRDS ESRD Database. The rate of ESRD per million among the U.S. population age 0-19 and the rate of transplantation in dialysis patients age 0-19 at the time of transplant, 1989–2012. Abbreviations: ESRD, end-stage renal disease.
vol 2 Figure 7.2 Trends in pediatric transplantation (aged 0-19 years)(a) Incidence rate of ESRD and transplant rate in children
8Vol 2, ESRD, Ch 7
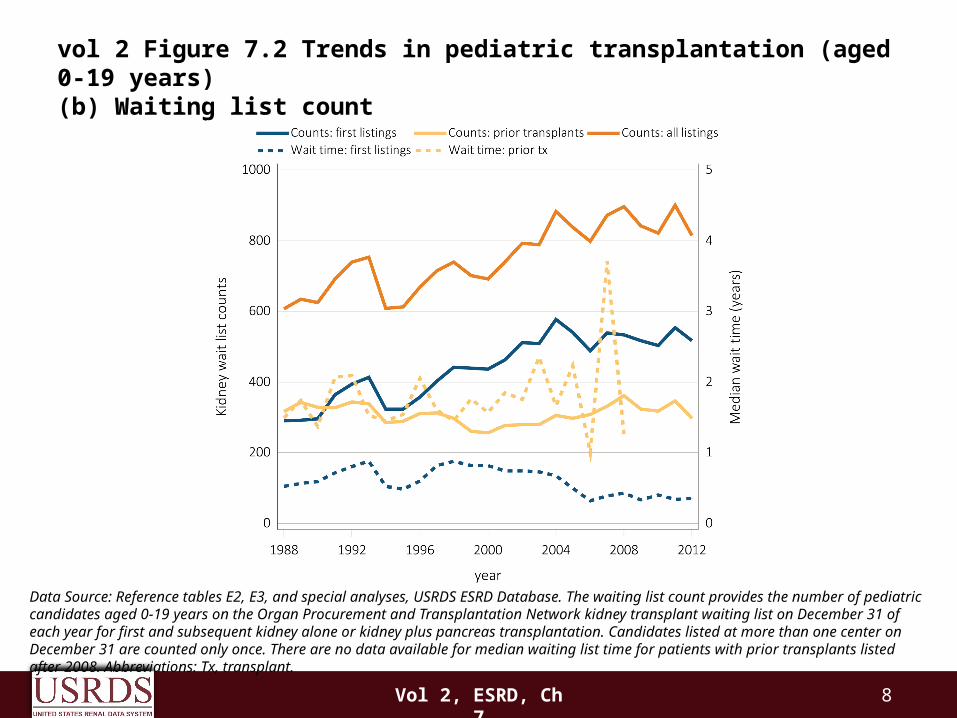
Data Source: Reference tables E2, E3, and special analyses, USRDS ESRD Database. The waiting list count provides the number of pediatric candidates aged 0-19 years on the Organ Procurement and Transplantation Network kidney transplant waiting list on December 31 of each year for first and subsequent kidney alone or kidney plus pancreas transplantation. Candidates listed at more than one center on December 31 are counted only once. There are no data available for median waiting list time for patients with prior transplants listed after 2008. Abbreviations: Tx, transplant.
vol 2 Figure 7.2 Trends in pediatric transplantation (aged 0-19 years)(b) Waiting list count
9Vol 2, ESRD, Ch 7
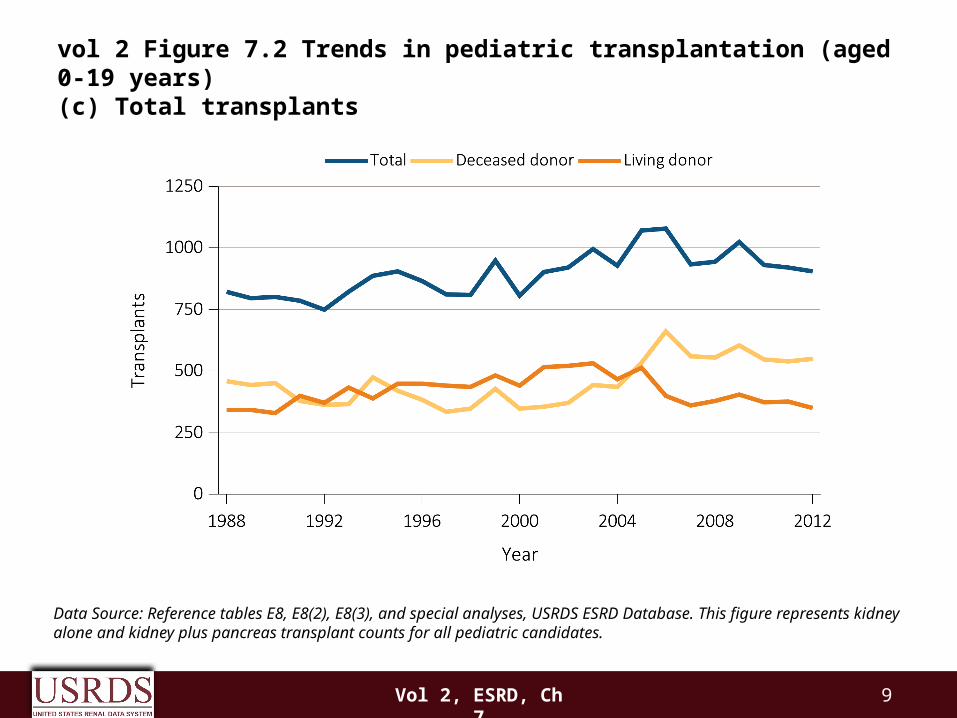
Data Source: Reference tables E8, E8(2), E8(3), and special analyses, USRDS ESRD Database. This figure represents kidney alone and kidney plus pancreas transplant counts for all pediatric candidates.
vol 2 Figure 7.2 Trends in pediatric transplantation (aged 0-19 years)(c) Total transplants
10Vol 2, ESRD, Ch 7
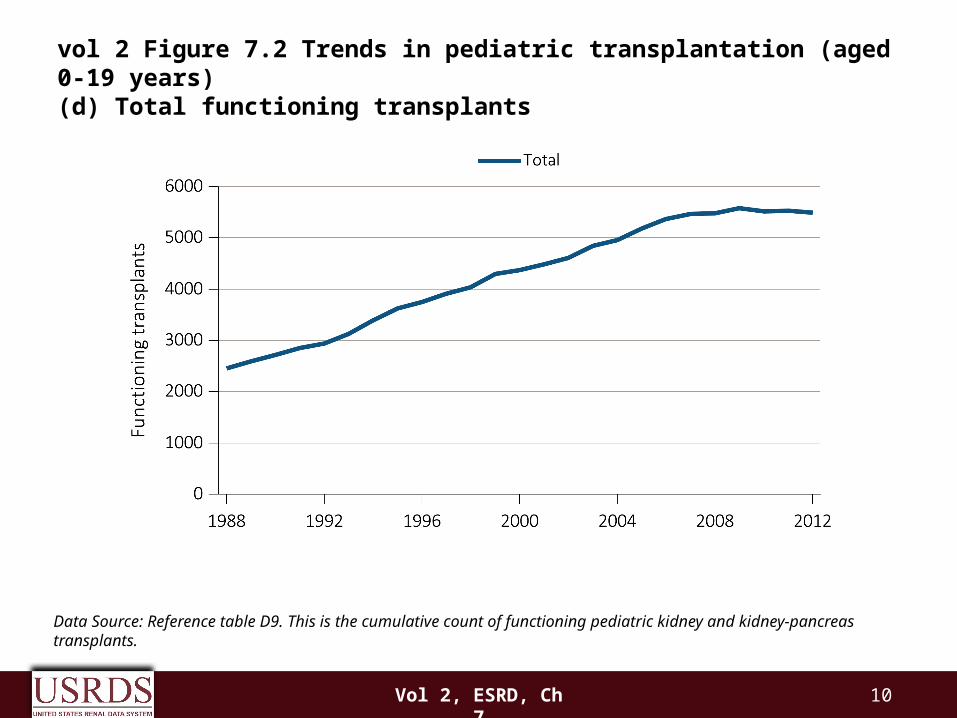
Data Source: Reference table D9. This is the cumulative count of functioning pediatric kidney and kidney-pancreas transplants.
vol 2 Figure 7.2 Trends in pediatric transplantation (aged 0-19 years)(d) Total functioning transplants

11Vol 2, ESRD, Ch 7
Data Source: Reference Table E9, and special analyses, USRDS ESRD Database. Includes transplant year between 1991–2012.
vol 2 Figure 7.3 Live and deceased donor transplants in pediatric patients (aged 0-19 years)(a) Transplant rate in pediatric dialysis patients by age
12Vol 2, ESRD, Ch 7
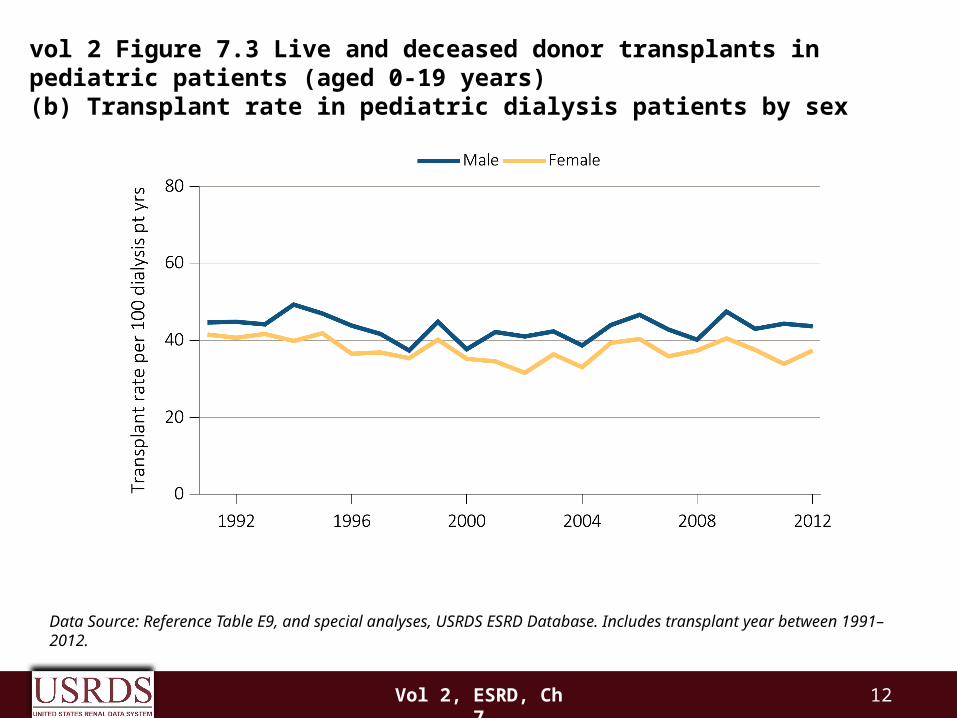
Data Source: Reference Table E9, and special analyses, USRDS ESRD Database. Includes transplant year between 1991–2012.
vol 2 Figure 7.3 Live and deceased donor transplants in pediatric patients (aged 0-19 years)(b) Transplant rate in pediatric dialysis patients by sex
13Vol 2, ESRD, Ch 7
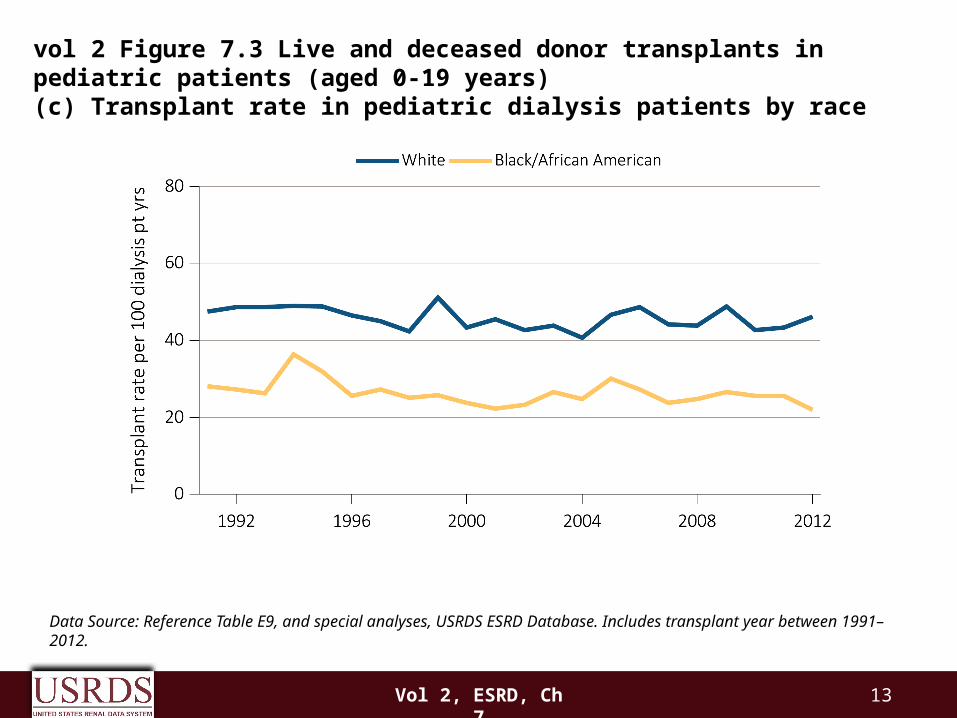
Data Source: Reference Table E9, and special analyses, USRDS ESRD Database. Includes transplant year between 1991–2012.
vol 2 Figure 7.3 Live and deceased donor transplants in pediatric patients (aged 0-19 years)(c) Transplant rate in pediatric dialysis patients by race
14Vol 2, ESRD, Ch 7
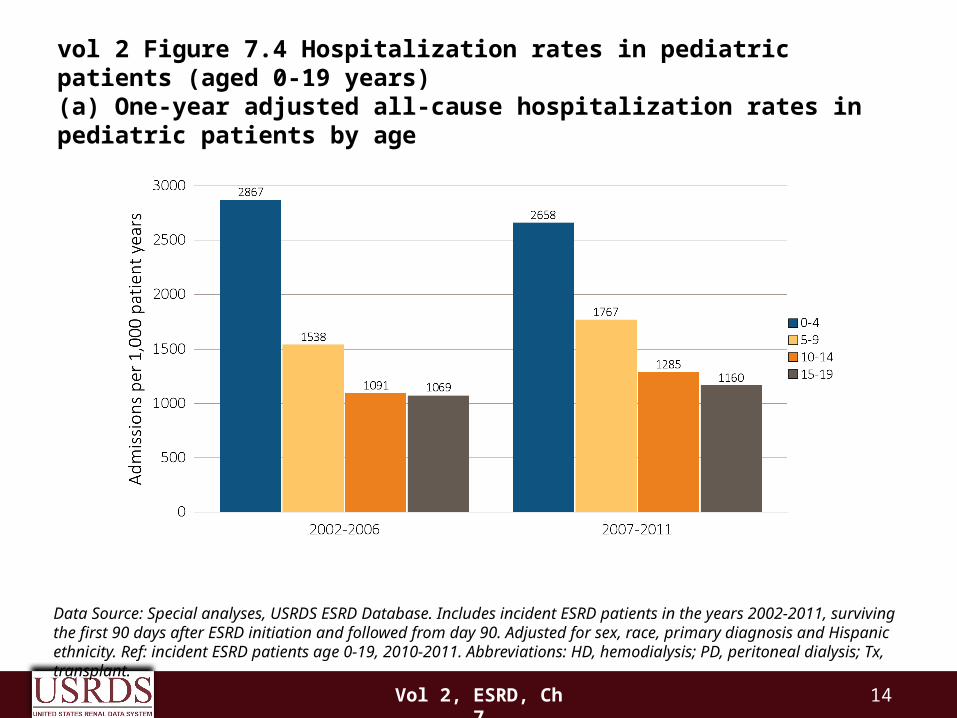
Data Source: Special analyses, USRDS ESRD Database. Includes incident ESRD patients in the years 2002-2011, surviving the first 90 days after ESRD initiation and followed from day 90. Adjusted for sex, race, primary diagnosis and Hispanic ethnicity. Ref: incident ESRD patients age 0-19, 2010-2011. Abbreviations: HD, hemodialysis; PD, peritoneal dialysis; Tx, transplant.
vol 2 Figure 7.4 Hospitalization rates in pediatric patients (aged 0-19 years)(a) One-year adjusted all-cause hospitalization rates in pediatric patients by age
15Vol 2, ESRD, Ch 7
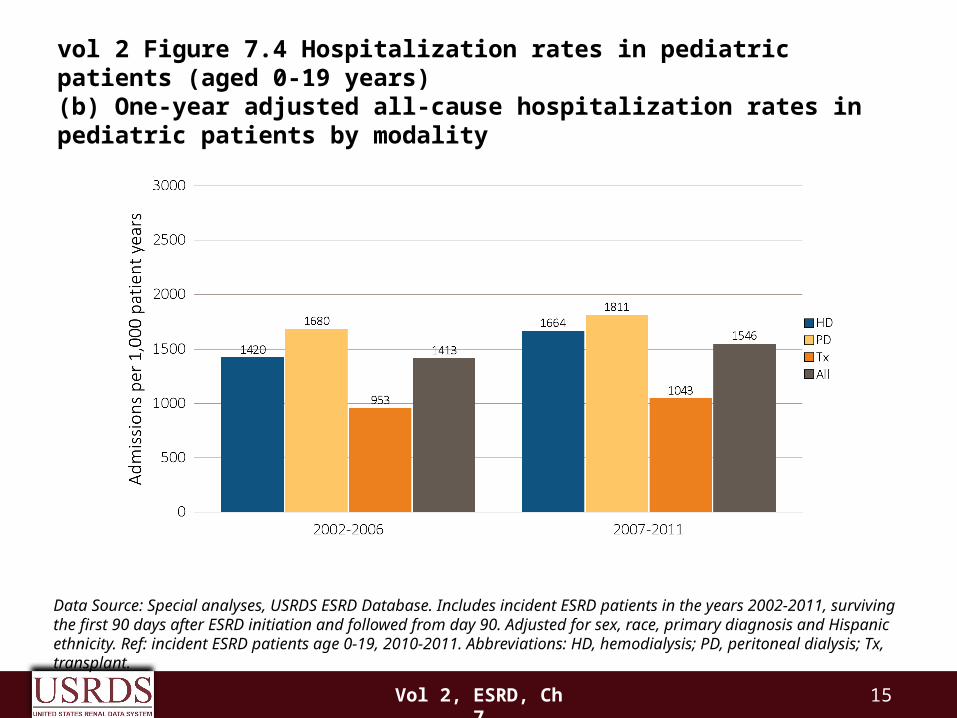
Data Source: Special analyses, USRDS ESRD Database. Includes incident ESRD patients in the years 2002-2011, surviving the first 90 days after ESRD initiation and followed from day 90. Adjusted for sex, race, primary diagnosis and Hispanic ethnicity. Ref: incident ESRD patients age 0-19, 2010-2011. Abbreviations: HD, hemodialysis; PD, peritoneal dialysis; Tx, transplant.
vol 2 Figure 7.4 Hospitalization rates in pediatric patients (aged 0-19 years)(b) One-year adjusted all-cause hospitalization rates in pediatric patients by modality
16Vol 2, ESRD, Ch 7
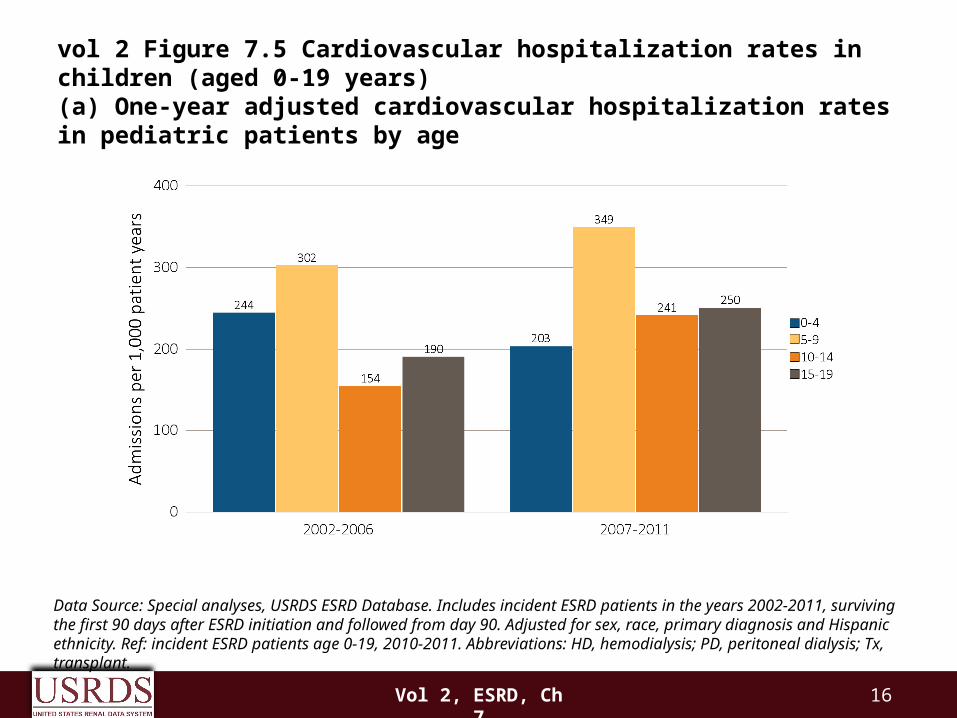
Data Source: Special analyses, USRDS ESRD Database. Includes incident ESRD patients in the years 2002-2011, surviving the first 90 days after ESRD initiation and followed from day 90. Adjusted for sex, race, primary diagnosis and Hispanic ethnicity. Ref: incident ESRD patients age 0-19, 2010-2011. Abbreviations: HD, hemodialysis; PD, peritoneal dialysis; Tx, transplant.
vol 2 Figure 7.5 Cardiovascular hospitalization rates in children (aged 0-19 years)(a) One-year adjusted cardiovascular hospitalization rates in pediatric patients by age
17Vol 2, ESRD, Ch 7
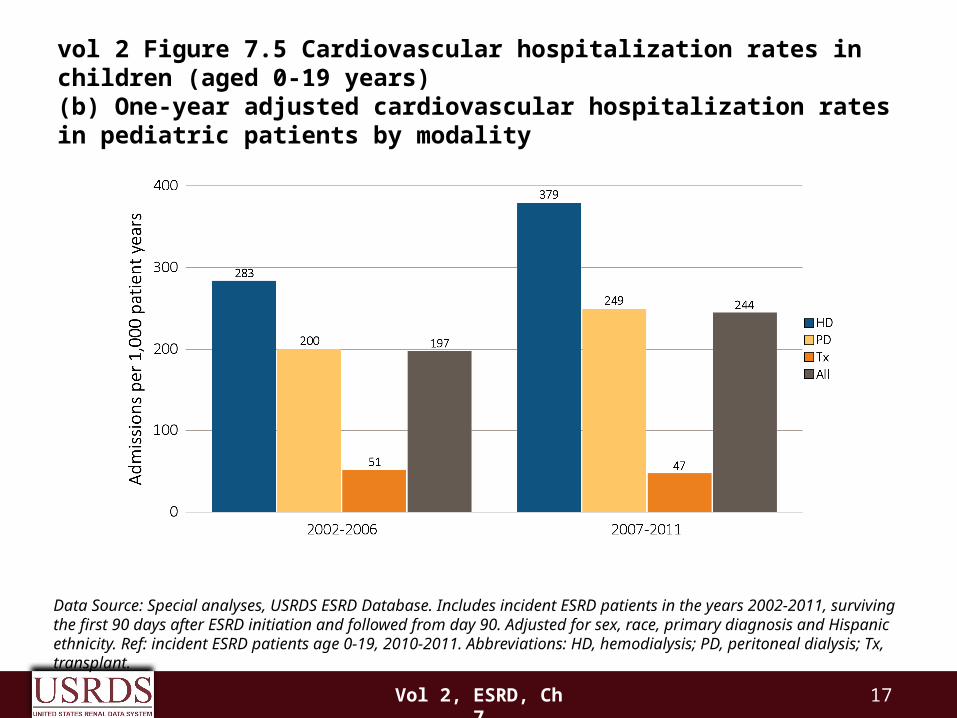
Data Source: Special analyses, USRDS ESRD Database. Includes incident ESRD patients in the years 2002-2011, surviving the first 90 days after ESRD initiation and followed from day 90. Adjusted for sex, race, primary diagnosis and Hispanic ethnicity. Ref: incident ESRD patients age 0-19, 2010-2011. Abbreviations: HD, hemodialysis; PD, peritoneal dialysis; Tx, transplant.
vol 2 Figure 7.5 Cardiovascular hospitalization rates in children (aged 0-19 years)(b) One-year adjusted cardiovascular hospitalization rates in pediatric patients by modality
18Vol 2, ESRD, Ch 7
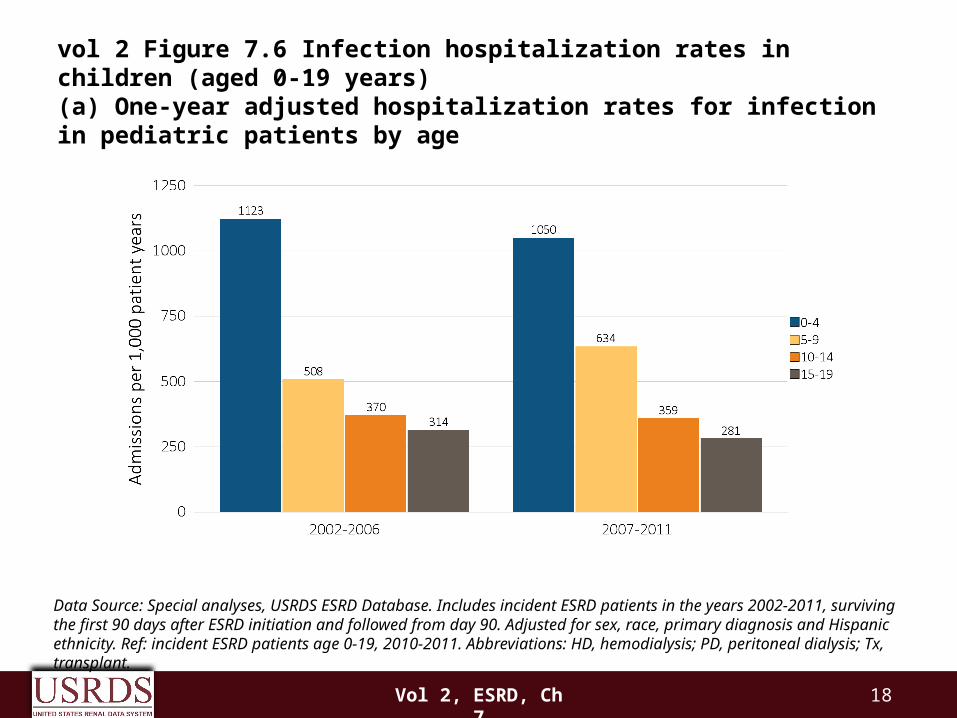
Data Source: Special analyses, USRDS ESRD Database. Includes incident ESRD patients in the years 2002-2011, surviving the first 90 days after ESRD initiation and followed from day 90. Adjusted for sex, race, primary diagnosis and Hispanic ethnicity. Ref: incident ESRD patients age 0-19, 2010-2011. Abbreviations: HD, hemodialysis; PD, peritoneal dialysis; Tx, transplant.
vol 2 Figure 7.6 Infection hospitalization rates in children (aged 0-19 years)(a) One-year adjusted hospitalization rates for infection in pediatric patients by age
19Vol 2, ESRD, Ch 7
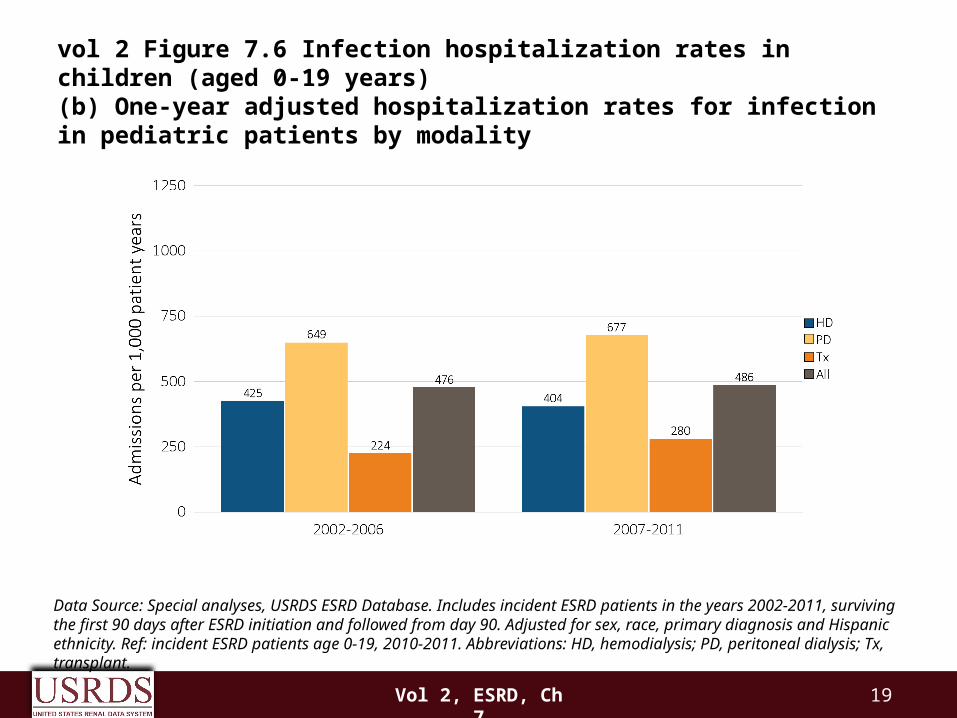
Data Source: Special analyses, USRDS ESRD Database. Includes incident ESRD patients in the years 2002-2011, surviving the first 90 days after ESRD initiation and followed from day 90. Adjusted for sex, race, primary diagnosis and Hispanic ethnicity. Ref: incident ESRD patients age 0-19, 2010-2011. Abbreviations: HD, hemodialysis; PD, peritoneal dialysis; Tx, transplant.
vol 2 Figure 7.6 Infection hospitalization rates in children (aged 0-19 years)(b) One-year adjusted hospitalization rates for infection in pediatric patients by modality
20Vol 2, ESRD, Ch 7
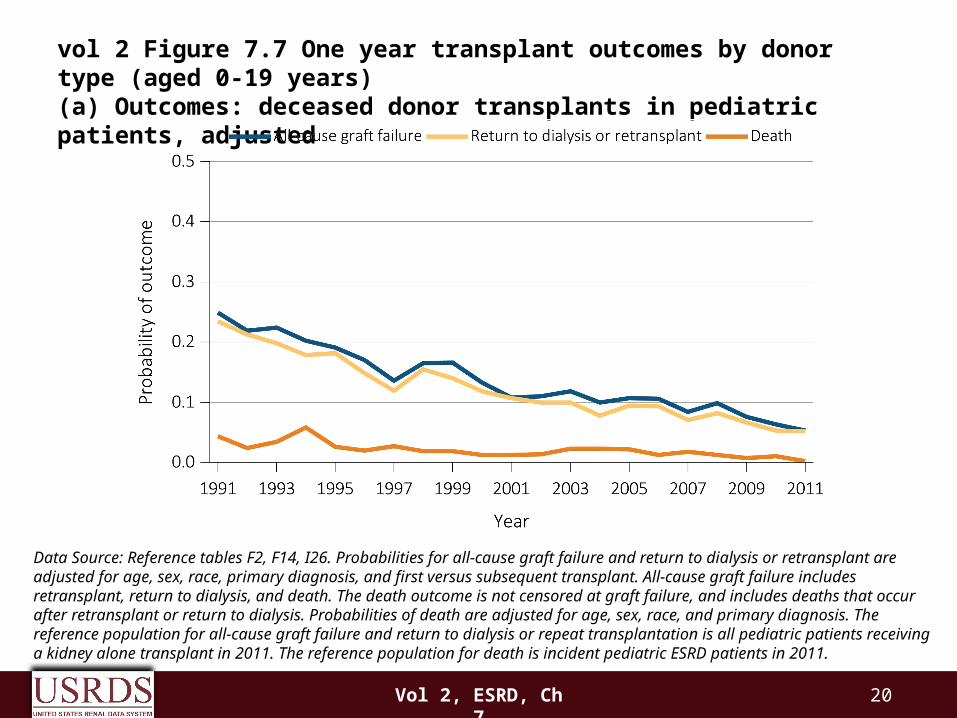
Data Source: Reference tables F2, F14, I26. Probabilities for all-cause graft failure and return to dialysis or retransplant are adjusted for age, sex, race, primary diagnosis, and first versus subsequent transplant. All-cause graft failure includes retransplant, return to dialysis, and death. The death outcome is not censored at graft failure, and includes deaths that occur after retransplant or return to dialysis. Probabilities of death are adjusted for age, sex, race, and primary diagnosis. The reference population for all-cause graft failure and return to dialysis or repeat transplantation is all pediatric patients receiving a kidney alone transplant in 2011. The reference population for death is incident pediatric ESRD patients in 2011.
vol 2 Figure 7.7 One year transplant outcomes by donor type (aged 0-19 years)(a) Outcomes: deceased donor transplants in pediatric patients, adjusted
21Vol 2, ESRD, Ch 7
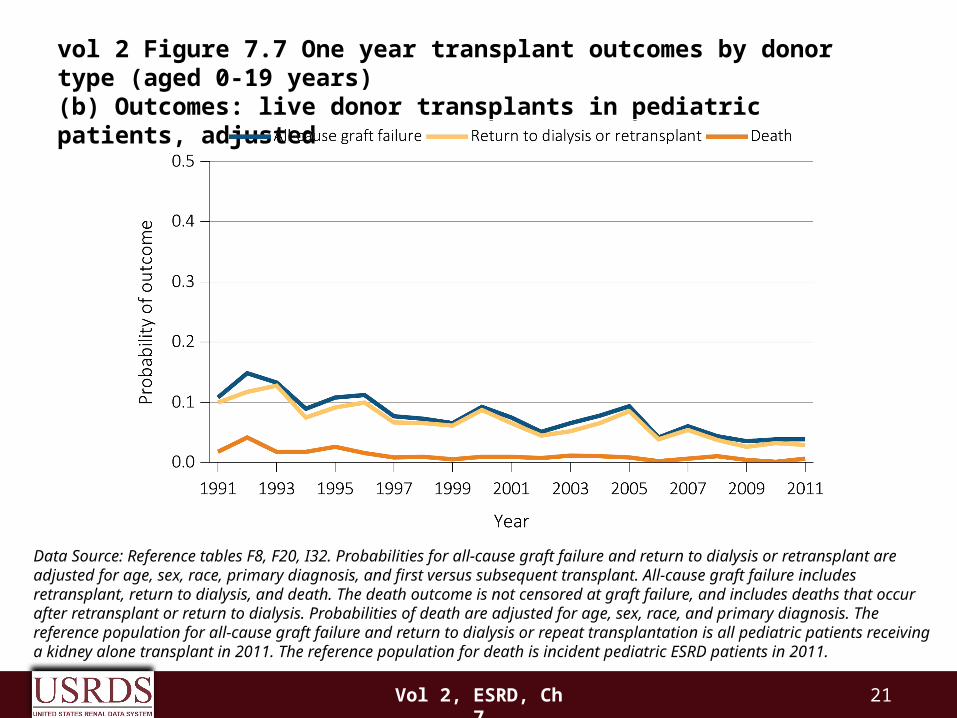
Data Source: Reference tables F8, F20, I32. Probabilities for all-cause graft failure and return to dialysis or retransplant are adjusted for age, sex, race, primary diagnosis, and first versus subsequent transplant. All-cause graft failure includes retransplant, return to dialysis, and death. The death outcome is not censored at graft failure, and includes deaths that occur after retransplant or return to dialysis. Probabilities of death are adjusted for age, sex, race, and primary diagnosis. The reference population for all-cause graft failure and return to dialysis or repeat transplantation is all pediatric patients receiving a kidney alone transplant in 2011. The reference population for death is incident pediatric ESRD patients in 2011.
vol 2 Figure 7.7 One year transplant outcomes by donor type (aged 0-19 years)(b) Outcomes: live donor transplants in pediatric patients, adjusted
22Vol 2, ESRD, Ch 7
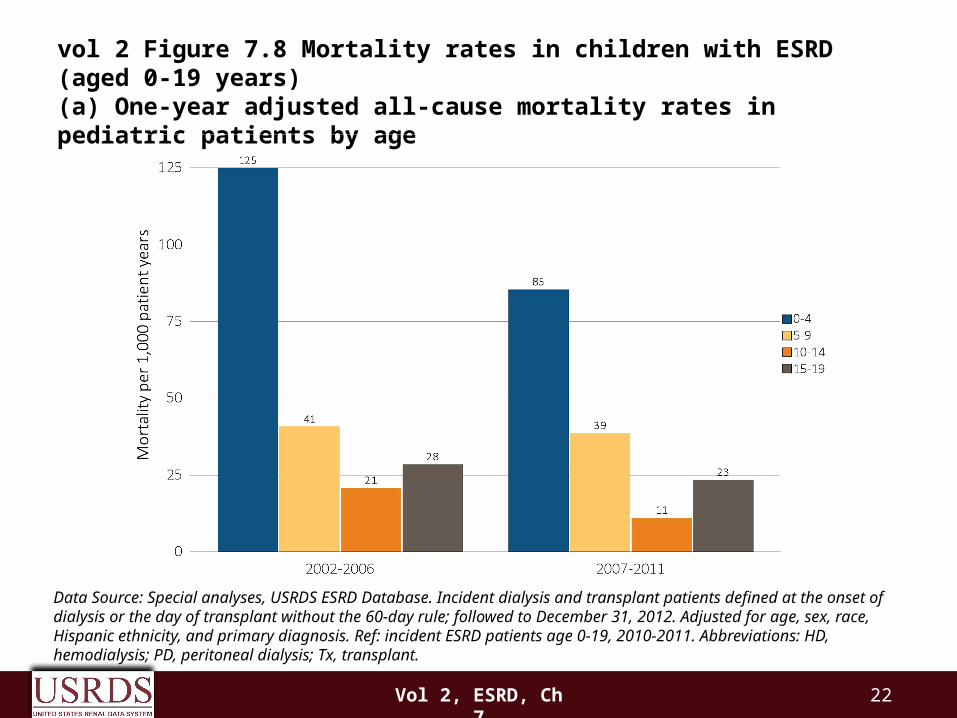
Data Source: Special analyses, USRDS ESRD Database. Incident dialysis and transplant patients defined at the onset of dialysis or the day of transplant without the 60-day rule; followed to December 31, 2012. Adjusted for age, sex, race, Hispanic ethnicity, and primary diagnosis. Ref: incident ESRD patients age 0-19, 2010-2011. Abbreviations: HD, hemodialysis; PD, peritoneal dialysis; Tx, transplant.
vol 2 Figure 7.8 Mortality rates in children with ESRD (aged 0-19 years)(a) One-year adjusted all-cause mortality rates in pediatric patients by age
23Vol 2, ESRD, Ch 7
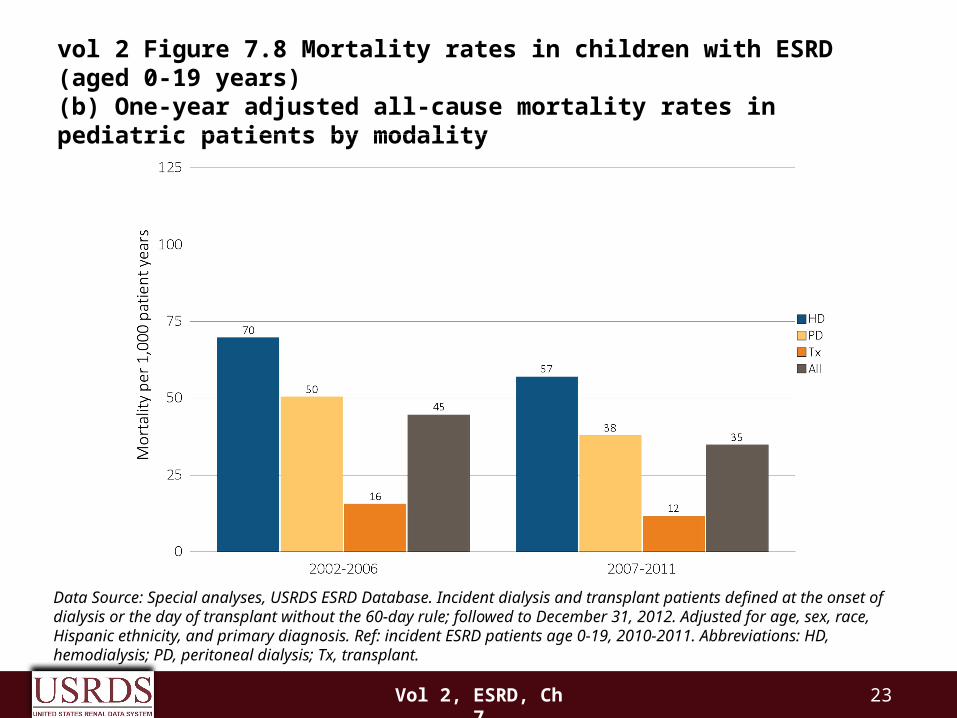
Data Source: Special analyses, USRDS ESRD Database. Incident dialysis and transplant patients defined at the onset of dialysis or the day of transplant without the 60-day rule; followed to December 31, 2012. Adjusted for age, sex, race, Hispanic ethnicity, and primary diagnosis. Ref: incident ESRD patients age 0-19, 2010-2011. Abbreviations: HD, hemodialysis; PD, peritoneal dialysis; Tx, transplant.
vol 2 Figure 7.8 Mortality rates in children with ESRD (aged 0-19 years)(b) One-year adjusted all-cause mortality rates in pediatric patients by modality

24Vol 2, ESRD, Ch 7
Data Source: Special analyses, USRDS ESRD Database. Incident dialysis and transplant patients defined at the onset of dialysis or the day of transplant without the 60-day rule; followed to December 31, 2012. Adjusted for age, sex, race, Hispanic ethnicity, and primary diagnosis. Ref: incident ESRD patients age 0-19, 2010-2011. Abbreviations: HD, hemodialysis; PD, peritoneal dialysis; Tx, transplant.
vol 2 Figure 7.9 Cardiovascular mortality in children with ESRD (aged 0-19 years)(a) One-year adjusted all-cause cardiovascular mortality rates in pediatric patients by age
25Vol 2, ESRD, Ch 7
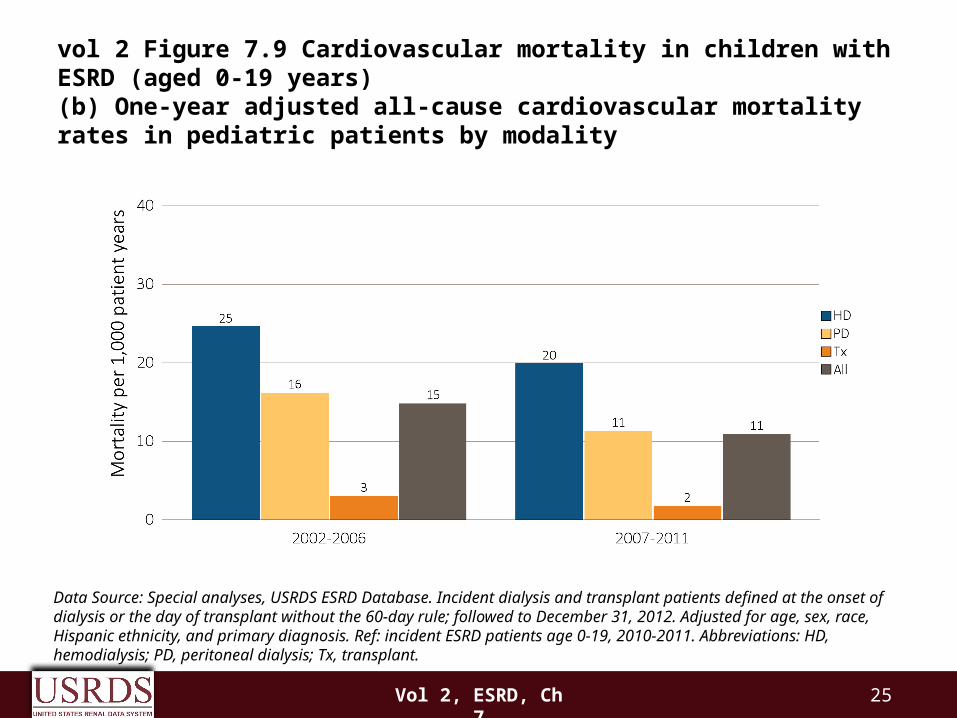
Data Source: Special analyses, USRDS ESRD Database. Incident dialysis and transplant patients defined at the onset of dialysis or the day of transplant without the 60-day rule; followed to December 31, 2012. Adjusted for age, sex, race, Hispanic ethnicity, and primary diagnosis. Ref: incident ESRD patients age 0-19, 2010-2011. Abbreviations: HD, hemodialysis; PD, peritoneal dialysis; Tx, transplant.
vol 2 Figure 7.9 Cardiovascular mortality in children with ESRD (aged 0-19 years)(b) One-year adjusted all-cause cardiovascular mortality rates in pediatric patients by modality
26Vol 2, ESRD, Ch 7
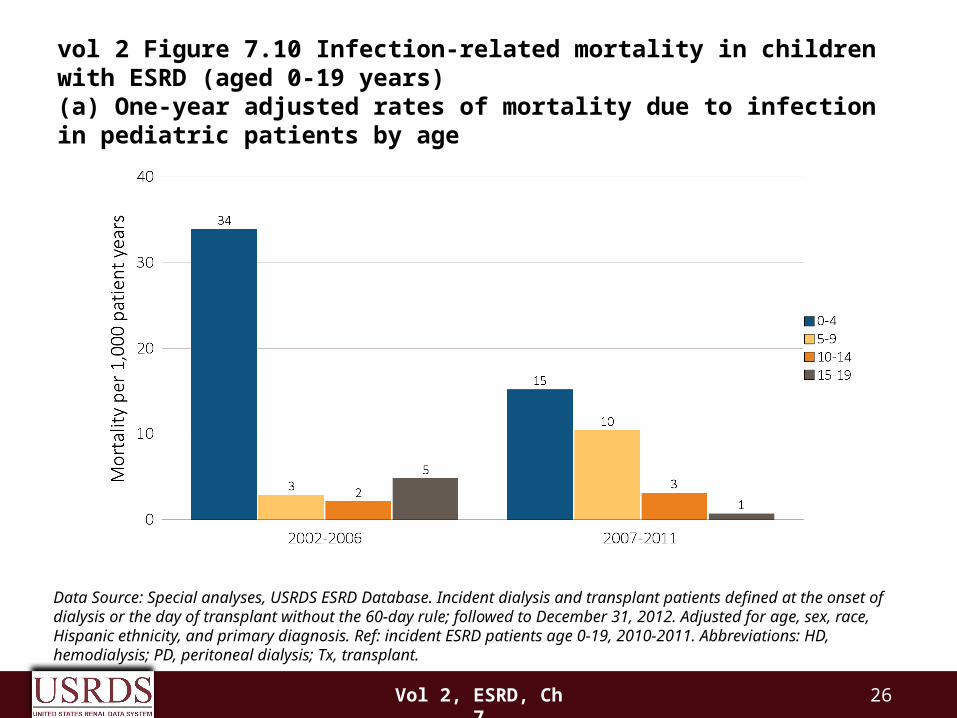
Data Source: Special analyses, USRDS ESRD Database. Incident dialysis and transplant patients defined at the onset of dialysis or the day of transplant without the 60-day rule; followed to December 31, 2012. Adjusted for age, sex, race, Hispanic ethnicity, and primary diagnosis. Ref: incident ESRD patients age 0-19, 2010-2011. Abbreviations: HD, hemodialysis; PD, peritoneal dialysis; Tx, transplant.
vol 2 Figure 7.10 Infection-related mortality in children with ESRD (aged 0-19 years)(a) One-year adjusted rates of mortality due to infection in pediatric patients by age
27Vol 2, ESRD, Ch 7
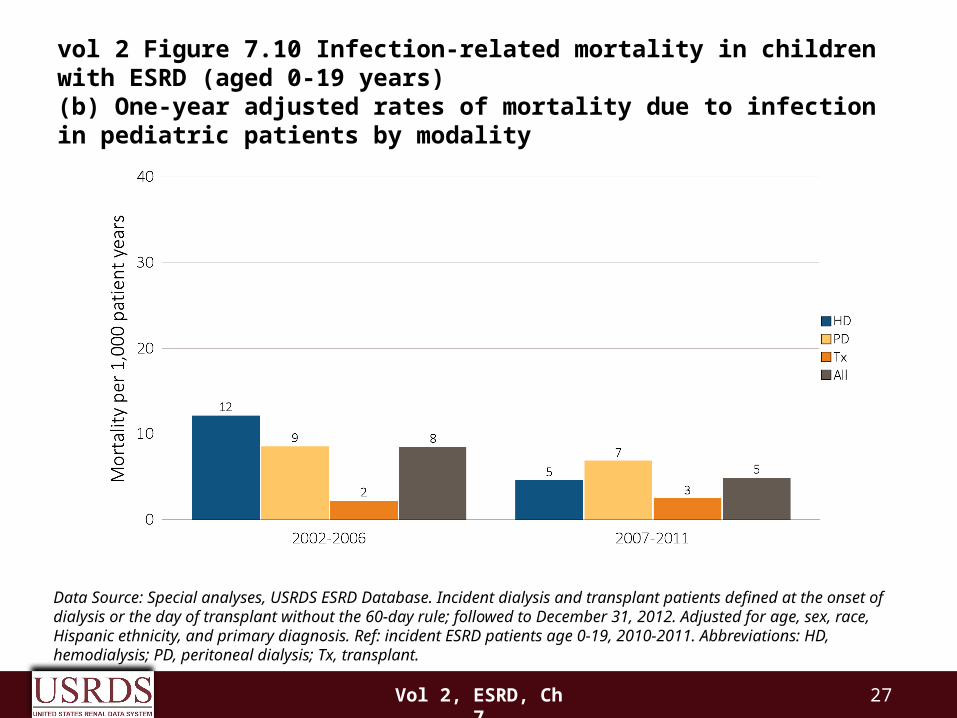
Data Source: Special analyses, USRDS ESRD Database. Incident dialysis and transplant patients defined at the onset of dialysis or the day of transplant without the 60-day rule; followed to December 31, 2012. Adjusted for age, sex, race, Hispanic ethnicity, and primary diagnosis. Ref: incident ESRD patients age 0-19, 2010-2011. Abbreviations: HD, hemodialysis; PD, peritoneal dialysis; Tx, transplant.
vol 2 Figure 7.10 Infection-related mortality in children with ESRD (aged 0-19 years)(b) One-year adjusted rates of mortality due to infection in pediatric patients by modality
28Vol 2, ESRD, Ch 7
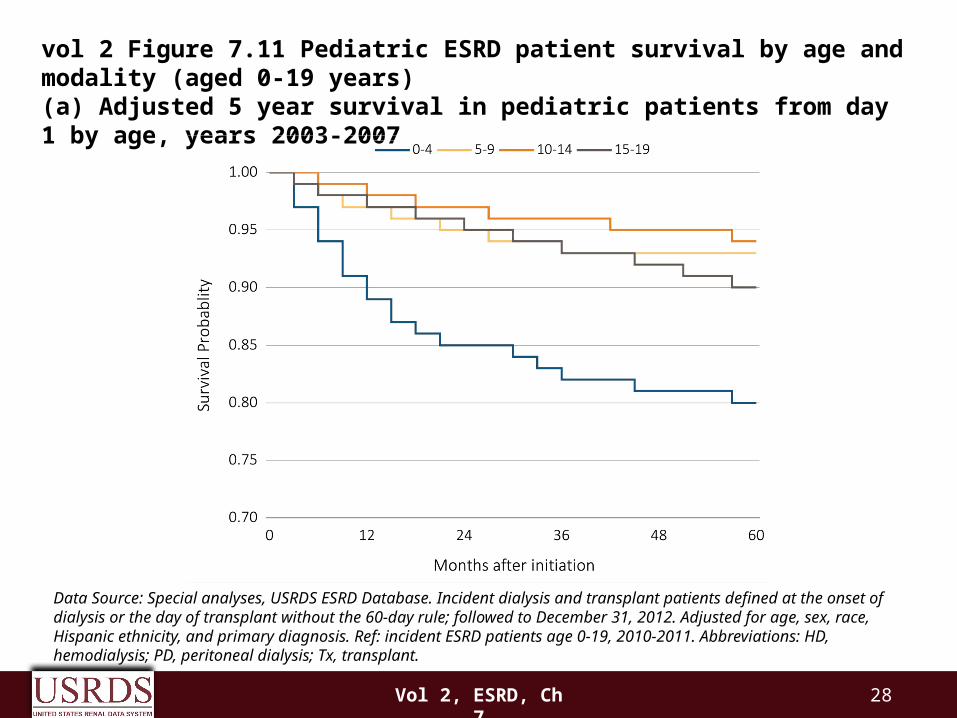
Data Source: Special analyses, USRDS ESRD Database. Incident dialysis and transplant patients defined at the onset of dialysis or the day of transplant without the 60-day rule; followed to December 31, 2012. Adjusted for age, sex, race, Hispanic ethnicity, and primary diagnosis. Ref: incident ESRD patients age 0-19, 2010-2011. Abbreviations: HD, hemodialysis; PD, peritoneal dialysis; Tx, transplant.
vol 2 Figure 7.11 Pediatric ESRD patient survival by age and modality (aged 0-19 years)(a) Adjusted 5 year survival in pediatric patients from day 1 by age, years 2003-2007
29Vol 2, ESRD, Ch 7
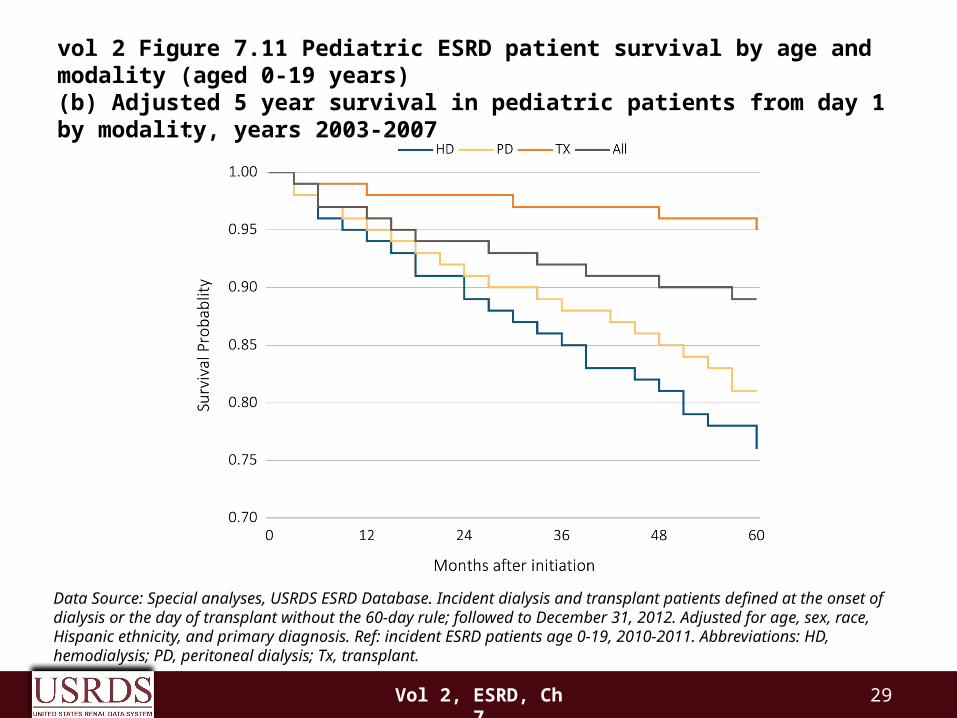
Data Source: Special analyses, USRDS ESRD Database. Incident dialysis and transplant patients defined at the onset of dialysis or the day of transplant without the 60-day rule; followed to December 31, 2012. Adjusted for age, sex, race, Hispanic ethnicity, and primary diagnosis. Ref: incident ESRD patients age 0-19, 2010-2011. Abbreviations: HD, hemodialysis; PD, peritoneal dialysis; Tx, transplant.
vol 2 Figure 7.11 Pediatric ESRD patient survival by age and modality (aged 0-19 years)(b) Adjusted 5 year survival in pediatric patients from day 1 by modality, years 2003-2007