Chapter 6 FLIGHT TO QUALITY: Investor Risk Tolerance and ...
27
Chapter 6 FLIGHT TO QUALITY: Investor Risk Tolerance and the Spread of Emerging Market Crises Barry Eichengreen University of California, Berkeley Galina Hale University of California, Berkeley Ashoka Mody The World Bank 1. INTRODUCTION The financial crises of the 1990s have raised new concerns about the operation of international financial markets. Prominent among these are worries about sharp changes in investor sentiment and their cross-border repercussions. The Mexican crisis dramatically altered investor sentiment toward emerging markets and echoed through Latin America, showing up in Argentina as the Tequila Effect. The spillover from the Thai crisis was limited initially to the Asian Tigers, but by the end of 1997 a wide variety of other developing countries were affected to some degree. In addition, Russia’s default in the summer of 1998, in conjunction with the all-but-failure of Long-Term Capital Management, precipitated a flight to quality with a strong negative impact on market sentiment regarding the entire population of emerging-market borrowers. While the fact of these spillovers is not in dispute, questions remain about their nature, incidence, and implications. One question concerns the channels through which financial distress is transmitted across borders, and in particular the relative importance of competitive-depreciation, wake-up-call, and deleveraging effects. 1 Another concerns the characteristics of the borrowers most susceptible to spillover effects and the role of budget deficits, current account balances, short-term debt, the exchange-rate regime, and international reserves in heightening or reducing a country’s vulnerability to external events. 2 A third is
Transcript of Chapter 6 FLIGHT TO QUALITY: Investor Risk Tolerance and ...

Chapter 6 FLIGHT TO QUALITY: Investor Risk Tolerance and the Spread of Emerging Market Crises Barry Eichengreen University of California, Berkeley Galina Hale University of California, Berkeley Ashoka Mody The World Bank
1. INTRODUCTION
The financial crises of the 1990s have raised new concerns about the
operation of international financial markets. Prominent among these are worries about sharp changes in investor sentiment and their cross-border repercussions. The Mexican crisis dramatically altered investor sentiment toward emerging markets and echoed through Latin America, showing up in Argentina as the Tequila Effect. The spillover from the Thai crisis was limited initially to the Asian Tigers, but by the end of 1997 a wide variety of other developing countries were affected to some degree. In addition, Russia’s default in the summer of 1998, in conjunction with the all-but-failure of Long-Term Capital Management, precipitated a flight to quality with a strong negative impact on market sentiment regarding the entire population of emerging-market borrowers.
While the fact of these spillovers is not in dispute, questions remain about their nature, incidence, and implications. One question concerns the channels through which financial distress is transmitted across borders, and in particular the relative importance of competitive-depreciation, wake-up-call, and deleveraging effects.1 Another concerns the characteristics of the borrowers most susceptible to spillover effects and the role of budget deficits, current account balances, short-term debt, the exchange-rate regime, and international reserves in heightening or reducing a country’s vulnerability to external events.2 A third is
130 Chapter 6
the extent to which policy initiatives, including everything from greater transparency to capital controls, can be used to limit the spread of instability.3 There exists a substantial literature on all these aspects of market volatility and its transmission, although intellectual consensus remains elusive.
Another aspect of the problem that has not received commensurate attention is how credit-market access is impaired by these sharp shifts in investor sentiment. The three obvious dimensions of market access, in this context, are the availability of funds, the cost of funds, and the maturity of funds. Most market commentary tends to focus on the cost of borrowing, since information on emerging-market spreads is readily available and since spreads respond to events in an immediate, visible way. In contrast, analysts concerned with macroeconomic implications (for example, the authors of the IMF’s International Capital Markets and the World Bank’s Global Development Finance) emphasize the volume of borrowing and lending, since this has immediate implications for the financing gap and the sustainability of exchange rates and the current account. Less attention has been paid to the maturity structure of borrowing, although those concerned with the risks associated with heavy reliance on short-term debt have pointed to the shortening of maturities as another channel through which instability can spread.4
Theory does not provide strong predictions about the margins on which the market will adjust or what types of borrowers will be affected. Models of complete information suggest that spillovers will operate through the cost of external finance. If lenders become more reluctant to lend, launch spreads will rise, and borrowers with the least attractive investment projects will withdraw from the market. Models of asymmetric information, on the other hand, suggest that spillovers will have a pronounced impact on the volume of lending and that both high- and low-quality borrowers will be affected, since it is difficult for investors to tell them apart.5 Models of the term structure of debt obligations offer reasons why a period of heightened financial turbulence will shorten the maturity of new loans for both more and less creditworthy borrowers, the latter because they are regarded as too risky to be extended long-term obligations, the former because they wish to avoid locking in high interest rates.6
There is some evidence consistent with each of these observations. The collapse in the volume of new issues in the wake of each of the crises of the 1990s is evident in Figure 1. After the Mexican crisis in December 1994, the decline lasted about one quarter and was followed by a period of rapid growth until the Asian crisis in mid-1997. While a similar drop in volumes is evident following the Asian crisis, more than two years following that event the volume of issues has still not recovered to early 1997 levels. Figure 1 also documents the tendency for spreads to widen during the financial turbulence that followed each of the three crises (whose timing is indicated in the figure by the three vertical lines). The sustained rise in spreads after the first half of 1997, like the sustained drop in volumes, attests to the widespread nature of the Asian crisis. The modest change in spreads following

Flight to Quality 131
�
the Mexican crisis, like the relatively modest change in volumes, provides another indication that the repercussions from the Mexican crisis were more limited than those which followed the Asian and Russian crises. Figure 1. Development of Spread, Maturity and Volume of Emerging Markets Bonds in 1990s

132 Chapter 6
The impact on maturities is less clear. While maturities fall modestly following each of the three crises, this effect is damped by their tendency to rise secularly over the course of the 1990s, reflecting the growth and maturation of the market for developing-country debt.7
This kind of “eye-conometrics” does not tell us how different borrowers were affected. It does not tell us whether changes in the price, availability, and maturity of external finance reflect mainly changes in borrower creditworthiness superimposed on a stable financial structure, or changes in the way the markets perceive and price a given set of borrower characteristics in the wake of a crisis (the so-called “flight to quality”).
In this chapter we present new evidence on how the Mexican crisis, the Asian crisis, and the Russian crisis affected the price, volume, and maturity of loans extended through the bond market in the 1990s. Our data set is essentially the universe of emerging-market bonds issued during the course of the decade. This allows us to mount a comprehensive analysis of how different types of borrowers were affected. We estimate an integrated model of borrowing and lending, pricing, and maturity decisions, something that does not seem to have been done before. This permits us to distinguish different margins along which emerging markets were affected.
Not surprisingly, we find a role for changes in both fundamentals and market sentiment following each of the three crises of the 1990s. We also find, however, that the impact of these changes in market sentiment is largely limited to the region in which the crisis originates. There is evidence of persistent unfavorable market sentiment in the behavior of primary-market spreads in Latin America but not East Asia starting in 1995, and in East Asia but not Latin America starting in the second half of 1997. While the volume of new issues by East Asian borrowers was temporarily depressed by unfavorable market sentiment in 1995, and the volume of new issues by Latin American borrowers was similarly depressed by unfavorable market sentiment in the second half of 1997, this cross-regional spillover died out quickly, unlike the within-region impact, which persisted. This is consistent with the findings of authors like Glick and Rose (1998) who have emphasized the regional character of contagion, although our interpretation of the phenomenon is different.
In addition, we find that for Latin America, unlike other regions, changes in market sentiment were felt more through their impact on prices and less through their impact on quantities. An interpretation is that when market sentiment deteriorated and spreads began to rise, East Asian countries withdrew from the market, preferring to delay borrowing until another day. They were able to do this because of their relatively high degree of real-side flexibility and pliable current accounts. Latin American countries, which historically have enjoyed less current account flexibility, continued to approach the market despite the less attractive terms.
Finally, while changes in market sentiment affect the price and quantity of new issues, we find less evidence of an impact on maturity. Why lenders and

Flight to Quality 133
�
borrowers are so reluctant to respond to changing credit-market conditions by adjusting the maturity of new issues thus emerges as an important topic for research.
Given that this chapter was prepared for a project on contagion, it is worth asking how it fits into the literature on this subject. Research on contagion is dominated by two approaches. One focuses on changes in the likelihood of a devaluation or currency crisis in a country when similar events occur in neighboring countries in the current or immediately preceding periods.8 The other looks for changes in the correlation of stock, bond and exchange-market returns across countries in periods of financial turbulence.9 Both of these approaches analyze macroeconomic aggregates. Both focus on the behavior of asset prices, be they exchange rates or stock prices. Both are therefore vulnerable to the “common-unobservable-shocks” critique — that observed co-movements across countries might reflect common, period-specific shocks that are not readily observed by the econometrician rather than contagion per se. While our approach is not entirely free of these limitations, it is nonetheless an attempt to address them. Rather than relying exclusively on macroeconomic data, we also utilize microeconomic data (on individual bonds). Rather than focusing exclusively on the behavior of prices, we also consider quantities and maturities. Lastly, rather than attempting to model contagion per se, we develop the distinction between fundamentals and market sentiment. 2. SPECIFICATION AND ESTIMATION
The typical model employed in studies of emerging-market spreads is a linear relationship of the form:
log (S) = bX + u1 (1) where S is the spread; X is a vector of issue, issuer, and period characteristics; and u1 is a stochastic error term.
Such models are typically estimated by ordinary-least squares (OLS). But OLS will be biased if not all potential issuers are in the sample. The spread and the maturity of the bond (and their relationship to issue and issuer characteristics) will be observed only when positive decisions to borrow and lend are made. Assume that these variables are only observed when a latent variable B crosses a threshold B’ defined by:
B’ = gX’ + u2 (2)

134 Chapter 6
where X’ is the vector of variables that determines the desire of borrowers to borrow and the willingness of lenders to lend, and u2 is a second error term. If the error terms in equations (1) and equation (2) are bivariate normal with standard deviations s1 and s2 and covariance s12
2/s1s2, this is a standard sample selection model, à la Heckman (1979).
Our model differs from the standard formulation in that S is a vector rather than a single variable (that single variable having been the spread in the aforementioned example), since we are interested in the impact of borrower characteristics and global credit conditions on the maturity as well as the price of emerging market issues. The maturity, as well as the spread, will only be observed when positive decisions to borrow and lend are made.
Estimating the spread, maturity and decision-to-borrow equations as a fully simultaneous system is not straightforward. Following previous work on the maturity structure of corporate bonds (e.g. Strohs and Mauer 1996), we assume that while maturity affects spread, spread does not affect maturity. Given this assumption, we can estimate the probit and maturity equations jointly using maximum likelihood, substitute predicted for observed maturity in the spreads equation, and then estimate the later jointly with the probit, again using maximum likelihood.10 The standard errors of the coefficients in the spread equation are corrected using the estimated variance from the Heckman maximum likelihood estimates of the spread using the observed (not predicted) value of maturity as an approximation of the appropriate variance. 3. DATA
We estimate the model using data for primary spreads for developing-country bonds issued from 1991-I through 1999-IV. From Capital Bondware we gathered data on the spread, maturity, and amount of each issue. In addition we look at whether it was privately placed; whether the issuer was a private or governmental entity; whether the issue was denominated in dollars, yen or deutsche marks; the industry of origin; whether the issuer was a sovereign, (other) public entity, or private-sector issuer; and whether the interest rate was fixed or floating. Building on earlier work on the bond market, we include the following variables as measures of credit worthiness: external debt relative to GDP; debt service relative to exports; whether a debt restructuring agreement (with either private or official creditors) had been concluded within the previous year; the growth rate of real GDP; the variance of the export growth rate; the ratio of reserves to short-term debt; and the ratio of domestic private credit to GDP. For the analysis of maturity, we also include the inflation rate.11
We also utilize a subjective measure of country credit worthiness provided by Institutional Investor.12 Since Institutional Investor’s country credit rating is correlated with other issuer characteristics, including it in the spreads equation, where many of these other issuer characteristics also appear,

Flight to Quality 135
�
complicates interpretation. We therefore substitute the residual from a first-stage regression in which the credit rating is regressed on the ratio of debt to GDP; the debt rescheduling dummy; the ratio of reserves to GNP; the rate of GDP growth; and the variance of export growth. In addition to entering these variables in levels, we interact them with a dummy for Latin America. We estimate this equation separately for each sub-period. We interpret the residuals from these regressions of credit ratings on observable economic characteristics as a measure of political risk.
Details on the procedure and the results are in Appendix B. Reassuringly, in contrast to our results for issuance, spreads and maturities, the signs of the coefficients in the credit-rating equations remain the same across periods.13
To proxy for international credit conditions, we use the yield on ten-year U.S. treasury bonds. Ten-year rates are appropriate insofar as the term to maturity of the underlying asset is broadly similar to that on the bonds in our sample. We also employ a measure of the yield curve, the log of the difference between the ten-year and one-year U.S. treasury rates.14
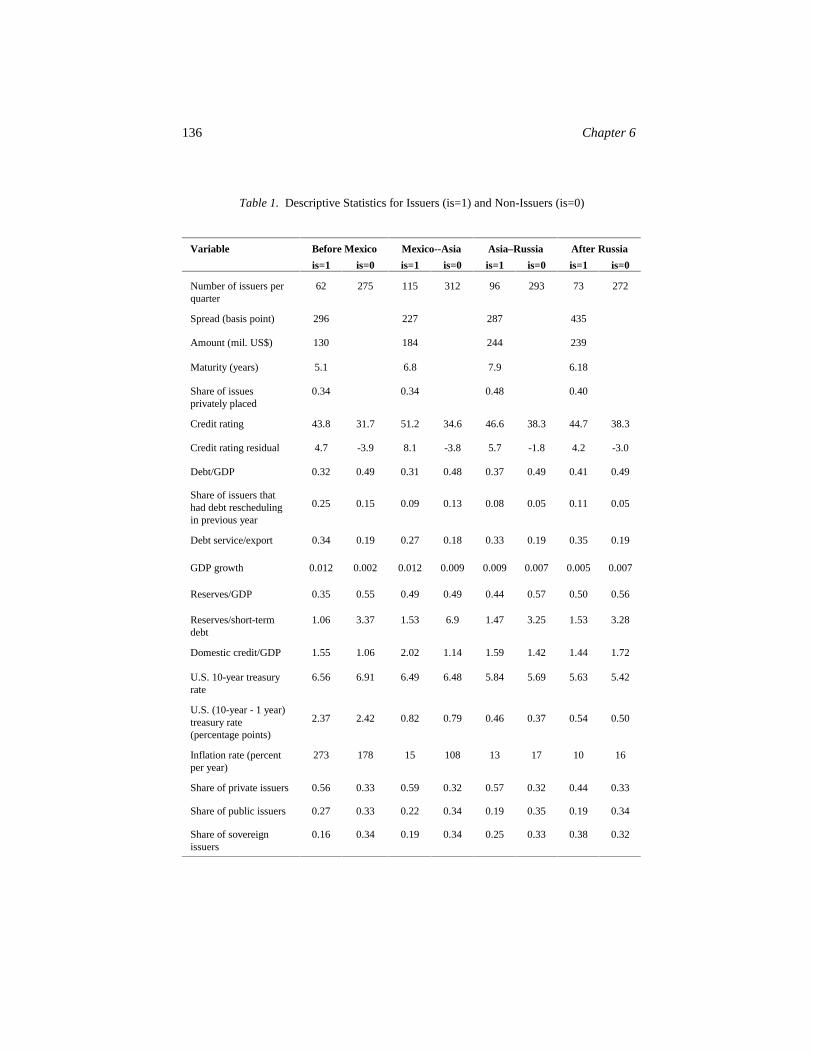
Estimating an equation for market access (whether or not borrowing is observed) requires information on those who did not issue bonds. For each country we consider three categories of issuers: sovereign, (other) public, and private. For each quarter and country where one of these issuers did not come to the market, we record a zero, and where they did come we record a one. Tabulations of the variables for the period up to the Mexican crisis, from the Mexican crisis to the Asian crisis, from the Asian crisis to Russia’s default, and since August 1998 appear in Table 1. The table highlights the expansion of the market up to the Asian crisis and its quiescence thereafter. The number of new bond issues rises through the Asian crisis before falling back in the two recent sub-periods. Launch spreads similarly narrow up to the Asian crisis and widen subsequently. Together these facts point to demand shifts by investors as a factor in changing market conditions. A number of other variables display interesting – and sometimes surprising – changes across columns. The share of sovereigns in borrowers is higher in each period than the period that came before–surprising given the emphasis in contemporary commentary on growing private sector access to the market. There has also been a trend toward the direct placement of bonds with qualified bondholders (i.e., those meeting certain regulatory thresholds and who are therefore deemed capable of their own due diligence). Such private placements, as distinct from general public issues, tend to be quicker to complete but can have a higher associated interest charge. We see that the share of privately placed bonds, having held steady up to the summer of 1997, rises after the Asian crisis and again after Russia’s default, contrary to the perception of steadily growing reliance on public issuance.
136 Chapter 6
Table 1. Descriptive Statistics for Issuers (is=1) and Non-Issuers (is=0)
Variable Before Mexico Mexico--Asia Asia–Russia After Russia
is=1 is=0 is=1 is=0 is=1 is=0 is=1 is=0
Number of issuers per quarter
62 275 115 312 96 293 73 272
Spread (basis point) 296 227 287 435
Amount (mil. US$) 130 184 244 239
Maturity (years) 5.1 6.8 7.9 6.18
Share of issues privately placed
0.34 0.34 0.48 0.40
Credit rating 43.8 31.7 51.2 34.6 46.6 38.3 44.7 38.3
Credit rating residual 4.7 -3.9 8.1 -3.8 5.7 -1.8 4.2 -3.0
Debt/GDP 0.32 0.49 0.31 0.48 0.37 0.49 0.41 0.49
Share of issuers that had debt rescheduling in previous year
0.25
0.15
0.09
0.13
0.08
0.05
0.11
0.05
Debt service/export 0.34 0.19 0.27 0.18 0.33 0.19 0.35 0.19
GDP growth 0.012 0.002 0.012 0.009 0.009 0.007 0.005 0.007
Reserves/GDP 0.35 0.55 0.49 0.49 0.44 0.57 0.50 0.56
Reserves/short-term debt
1.06 3.37 1.53 6.9 1.47 3.25 1.53 3.28
Domestic credit/GDP 1.55 1.06 2.02 1.14 1.59 1.42 1.44 1.72
U.S. 10-year treasury rate
6.56 6.91 6.49 6.48 5.84 5.69 5.63 5.42
U.S. (10-year - 1 year) treasury rate (percentage points)
2.37
2.42
0.82
0.79
0.46
0.37
0.54
0.50
Inflation rate (percent per year)
273 178 15 108 13 17 10 16
Share of private issuers 0.56 0.33 0.59 0.32 0.57 0.32 0.44 0.33
Share of public issuers 0.27 0.33 0.22 0.34 0.19 0.35 0.19 0.34
Share of sovereign issuers
0.16 0.34 0.19 0.34 0.25 0.33 0.38 0.32
Flight to Quality 137
�
4. DETERMINANTS OF ISSUANCE, MATURITIES, AND SPREADS
We are interested in whether the crises of the 1990s show up in reduced issuance, shorter maturities, or higher spreads. We therefore estimate a probit for the determinants of issuance, an equation to explain the maturity of new issues (corrected for selectivity bias), and a spreads equation (corrected for selectivity and also for the impact of maturities on spreads). We analyze changes in these relationships following the Mexican crisis, the Asian crisis, and the Russian crisis. 4.1 Issuance
Table 2 reports the results for the issue decision. (Throughout, coefficients in bold face differ significantly from zero at the five per cent confidence level, while coefficients that are only shaded differ from zero at the ten per cent confidence level.) For the full sample (through the end of 1999), the results are similar to those we reported in Eichengreen and Mody (1998a,b).15 A lower debt ratio, a higher credit rating residual (i.e. less political risk), faster growth, and a lower variance of export growth − all factors that improve country creditworthiness − plausibly increase the probability of observing a bond flotation. Since these factors are also associated with lower spreads (as our earlier analysis showed and results reported in this chapter confirm), we interpret them as mainly shifting investors’ appetite for emerging market bonds. In contrast, a lower ratio of reserves to short-term debt is associated with a higher probability of issuance and higher spreads. We interpret this variable as shifting outward the desire to borrow, that is, the supply of new issues by emerging-market borrowers.
Some noteworthy differences are evident across periods. Prior to the Mexican crisis, U.S. interest rates seem to have been negatively correlated with bond issuance. This effect appears to have waned, however, between the Mexican and Asian crises. After the Asian crisis, the sign on the U.S. interest rate turns positive, though it is smaller for Latin America than for other regions. Some years ago Calvo, Leiderman, and Reinhart (1996), focusing on Latin America, emphasized that higher U.S. interest rates tend to be associated with smaller capital flows to emerging markets. We obtain results consistent with their observation for the decade as a whole, but only for Latin America (the part of the world on which they focused).
GDP growth is the other country-specific factor that seems to have affected credit market access differently in different periods. The coefficient on growth rates appears to have increased after the Tequila crisis and to have increased further following the Asian crisis. Consequently, between the Mexican

138 Chapter 6
Table 2. Determinants of Issue Probability
Variable Full sample Before Mexico Mexico -Asia After Asia Log of 10 years U.S.
Treasury Rate 0.09
(1.09) -0.40
(-4.80) -0.01
(-0.02) 0.70
(2.42) Log of (10 yr - 1yr)
Treasury Rate -0.09
(-6.80) -0.17
(-3.97) 0.08
(1.20) 0.09
(2.21) Credit rating residual 0.01
(11.90) 0.01
(7.86) 0.01
(4.54) 0.01
(4.17) Debt/GDP -0.39
(-7.96) -0.46
(-6.11) -0.39
(-3.42) 0.21
(2.07) Debt Service/Export 0.74
(8.36) 1.32
(9.86) 0.73
(3.69) 0.34
(1.89) Debt rescheduled in
Previous Year 0.02
(0.50) -0.06
(-1.42) 0.10
(1.59) -0.05
(-0.65) GDP Growth 4.40
(6.96) 0.32
(0.33) 9.91
(4.84) 13.33 (6.99)
Standard Deviation of Export growth
-0.92 (-9.66)
-0.92 (-5.89)
-1.49 (-6.89)
-0.26 (-1.63)
Reserves/Short Term Debt
-0.02 (-4.00)
-0.01 (-1.46)
-0.02 (-3.20)
-0.06 (-5.62)
Reserves/Import -0.03 (-3.54)
-0.11 (-5.91)
0.02 (1.00)
0.06 (4.03)
Domestic credit/GDP 0.00 (0.07)
0.06 (5.03)
-0.00 (-0.12)
0.02 (1.27)
Dummies For:
Public Borrower -0.01 (-0.58)
0.01 (0.54)
0.06 (1.41)
-0.10 (-2.76)
Private Borrower 0.11 (5.81)
0.02 (0.81)
0.23 (6.42)
0.01 (0.34)
Latin America 0.88 (4.10)
0.20 (0.60)
0.77 (0.42)
0.99 (2.41)
East Asia and Pacific
0.23 (9.19)
0.18 (4.15)
0.34 (6.89)
0.16 (2.95)
Eastern Europe and Central Asia
0.41 (8.41)
Thailand, Indonesia, Malaysia, Korea
0.12 (1.65)
Period after Russian Crisis
-0.07 (-1.82)
Latin American
Log of 10 years US. Treasury Rate
-0.30 (-2.21)
-0.03 (-0.23)
-0.45 (-0.93)
-0.33 (-0.80)
Interactions with:
Log of (10 yr - 1 yr) Treasury Rate
0.18 (8.06)
0.25 (3.48)
-0.08 (-0.52)
-0.12 (-2.06)
Debt/GDP -0.74 (-7.93)
-0.02 (-0.21)
-0.69 (-2.75)
-2.42 (-8.08)
Debt Service/Export 0.08 (0.73)
-1.09 (-6.09)
0.88 (2.86)
0.87 (3.77)
GDP Growth -6.23 (-3.56)
-5.03 (-2.38)
-10.71 (-2.83)
-5.94 (-1.05)
Standard Deviation of Export growth
-0.59 (-3.64)
-0.17 (-0.69)
0.07 (0.19)
-1.09 (-3.92)
Reserves/Short Term Debt
-0.07 (-4.24)
-0.13 (-5.64)
-0.15 (-3.01)
-0.07 (-1.66)
Reserves/Imports 0.07 (6.35)
0.22 (9.52)
0.16 (3.74)
-0.08 (-3.78)
Domestic credit/GDP -0.04 (-2.15)
-0.11 (-4.14)
-0.03 (-0.45)
-0.03 (-0.75)
Public sector issue -0.10 (-3.03)
0.09 (1.77)
-0.24 (-3.71)
-0.21 (-3.41)
Private issue 0.13 (3.78)
0.32 (5.91)
-0.02 (-0.25)
0.04 (0.57)
Debt rescheduled in Previous Year
-0.03 (-0.61)
0.12 (1.89)
-0.20 (-2.31)
-0.03 (-0.25)
Credit rating residual 0.01 (7.40)
0.01 (1.75)
0.02 (4.14)
0.02 (5.55)
Observed probability .37 .31 .45 .35 Predicted probability .31 .14 .39 .30 Number observations 7355 2759 2474 1880
Log Likelihood -3059 -861 -944 -783

Flight to Quality 139
�
and Asian crises, when East Asia and many parts of Latin America enjoyed respectable rates of growth, small increases in growth rates were accompanied by large increases in issuance. But when growth rates fell and in some cases turned negative following the Asian crisis, these countries suffered doubly − both because of their poor growth prospects and also because poor growth was penalized more by the bond markets in the post-Asian crisis period (as reflected in the larger coefficient on the growth rate). These findings have a number of disturbing, if not unexpected, implications. For one, the positive coefficient on growth indicates a tendency for bond-market access to fluctuate procyclically. For another, one way in which the cross-border repercussions of crises are magnified is that the direct negative impact on growth is reinforced by the further tendency for deteriorating growth prospects to worsen bond-market access.
A third shift associated with the Mexican and Asian crises was a decline in non-sovereign issuance. Both private issues and issues by government agencies other than the sovereign fell sharply following the Mexican and Asian crises. Sovereign issuers are, with rare exceptions, the most creditworthy borrowers. (This is the basis for the so-called “sovereign ceiling.”) It follows that with the flight to quality following the Asian crisis, non-sovereign borrowers found themselves disproportionately rationed out of the market. This is evident in the decline in the size of the coefficients for public (non-sovereign) borrowers and private borrowers following the Asian crisis and the decline in their interactions with the dummy variable for Latin America following the Mexican crisis.
These three factors, changes in the level and effect of U.S. interest rates, the changing growth outlook, and changes in the relative attractiveness of non-sovereign credits, more than explain the decline in East Asian bond issuance following the 1997 crisis.16 In other words, after accounting for changes in the level and effect of these variables which were common to all emerging markets, issuance by Indonesia, Korea, Malaysia and Thailand was actually somewhat greater than predicted.17 Following the Russian crisis, in contrast, the story is the opposite: the three aforementioned factors do not account fully for the decline in the volume of new issues. The coefficient on the dummy variable for the post-Russia period is negative and significant.18 This points to the existence of additional effects of the Russia-LTCM affair importantly influencing the markets. 4.2 Maturities
Of the three dimensions of market access we consider, maturity seems to have been the most resilient to the successive crises of the 1990s. Although it declined slightly in the wake of the Mexican crisis, the average maturity of emerging-market bond flotations subsequently resumed its upward march.19 Following the Asian crisis, when the rate of bond issuance fell and spreads

140 Chapter 6
widened, average maturity remained strikingly stable.20 Only the Russian crisis seems to have noticeably dented the trend in the direction of longer maturities.
The U.S. yield curve seems to have been important for maturities throughout the decade, but in different ways in different periods. Before the Mexican crisis, a steeper yield curve resulted in shorter maturities, as if rendering international lenders reluctant to lend long-term on the grounds that interest rates were expected to rise. Following the Tequila and Russian crises, in contrast (columns 3 and 4 of Table 3), the coefficient on the yield curve was positive and significant, consistent with the notion that emerging markets that retained market access were, in these periods, seeking (and able) to lock in favorable interest rates by opting for longer maturities.21
Table 3. Determinants of the Maturity of Bond Issues
Variable Full sample Before Mexico Mexico -Asia After Asia Log Amount 0.18
(12.25) 0.19
(9.34) 0.10
(4.13) 0.20
(6.51) Private placement
0.07 (2.95)
0.10 (2.83)
0.10 (2.29)
0.02 (0.44)
Guarantee 0.02 (0.74)
0.10 (2.30)
0.02 (0.41)
0.11 (1.46)
Log Inflation rate 0.00 (0.27)
0.00 (0.32)
-0.30 (-5.30)
0.02 (0.33)
Log Inflation rate squared -0.00 (-0.10)
-0.01 (-1.76)
-0.05 (-5.30)
0.00 (0.23)
Credit rating 0.07 (11.03)
0.04 (4.68)
0.05 (4.64)
0.10 (5.35)
Credit rating squared -0.0005 (-8.88)
-0.0004 (-3.70)
-0.0004 (-4.20)
-0.0008 (-4.23)
Log of 10 years US. Treasury Rate 0.05 (0.38)
-0.20 (-1.41)
-0.40 (-1.02)
0.03 (0.05)
Log of (10 year - 1 year) Treasury Rate
-0.02 (-0.83)
-0.23 (-2.88)
0.30 (3.44)
0.15 (2.16)
Dummies for: Latin America
0.08
(1.52)
-0.29
(-3.50)
-0.25
(-2.11)
0.23
(1.91) East Asia and Pacific 0.09
(1.81) 0.04
(0.41) -0.13
(-1.21) -0.23
(-1.53) Eastern Europe and Central Asia - - - -0.22
(-1.93) Thailand, Indonesia, Malaysia, Korea
- - - 0.07 (0.46)
Period after Russian Crisis - - - -0.31 (-3.96)
Constant -1.85 (-6.18)
-0.03 (-0.09)
0.16 (0.20)
-2.72 (-2.37)
Inverse Mills Ratio 0.28 (7.26)
0.05 (0.90)
-0.05 (-0.58)
0.52 (7.78)
Number of bonds 2603 850 1080 571
Log likelihood -5151 -1375 -1897 -1291 Among the country-specific determinants of maturity that we consider are
the inflation rate and the credit rating. We include squared terms of both to test for nonlinear effects. In the period between the Mexican and Asian crises

Flight to Quality 141
�
increases in inflation, starting from low levels, appear to have reduced maturities; the same effect is not evident in other periods. Prior to the Tequila crisis, only very high inflation rates made it difficult to borrow long term (as reflected in the negative and statistically-significant coefficient on inflation squared). This effect disappears entirely following the Asian crisis, presumably because inflation became less of a concern and deflation became more of a risk.
Maturities appear to rise with credit quality as the latter improves from low levels, but then to decline as credit quality continues to improve. This pattern is robust; it is evident in each of the three sub-periods we consider. In fact, this is precisely the pattern predicted by parallel work on the domestic corporate bond market. In that context, Flannery (1986) suggests that relatively good borrowers will want to issue short-term debt, because in an environment of asymmetric information their own estimate of their credit worthiness will be higher than that of outside investors. Once their performance reveals them to be of high quality, however, they will be able to refinance at a lower cost, leading to reluctance to issue long-term debt that locks them into high interest rates. Our results suggest that precisely analogous effects operate in international bond markets. 4.3 Spreads
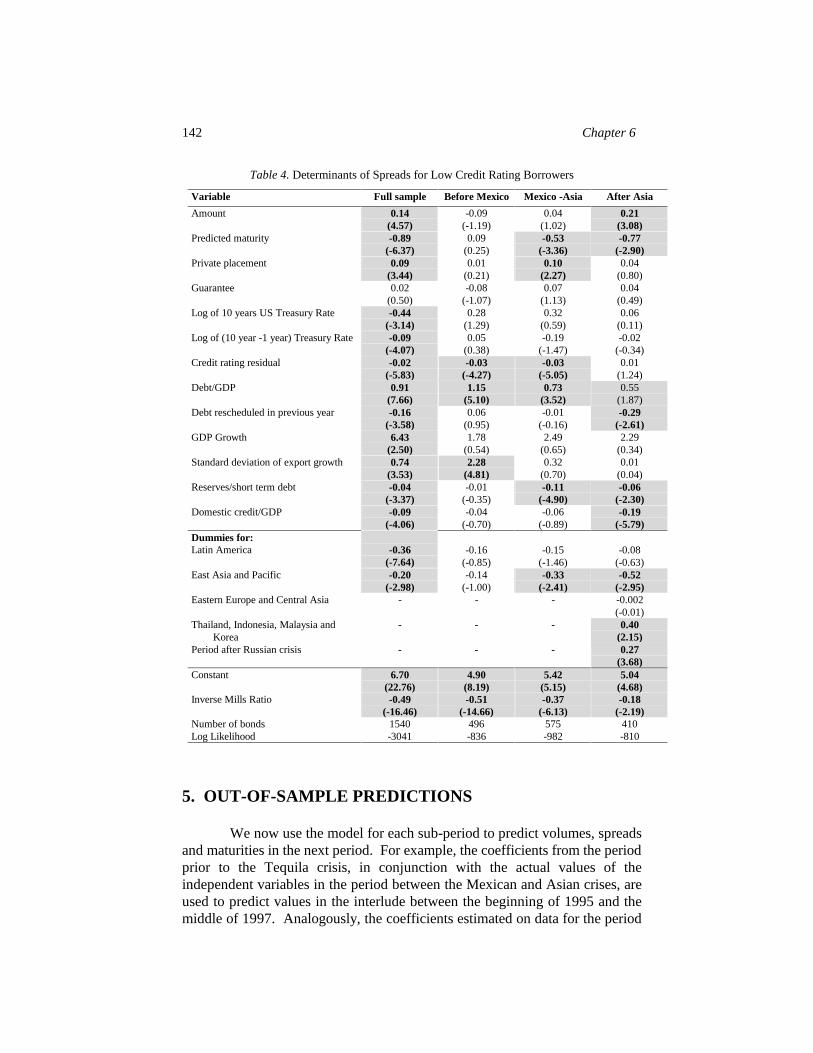
Because we have analyzed spreads in a series of previous papers, this section is brief.22 We limit it to touching on a few variables that are particularly relevant to the issues under consideration. We analyze the determinants of spreads separately for low- and high-rated issuers (those with ratings below and above 55 on the Institutional Investor scale) – in Tables 4 and 5.23
Country characteristics influence spreads in plausible ways.24 The credit rating residual is negative for both high- and low-rated countries. That is to say, less political risk implies lower spreads. The coefficient on this variable does not vary much between periods. In contrast, the coefficient on the debt/GDP ratio falls over time for both high and low-rated countries, as if heavily indebted countries were penalized less over time in terms of the spreads they pay.
U.S. interest rates do not appear to have had a consistent impact on spreads. While the U.S. interest rate has a negative impact on spreads in the full sample, the coefficient is unstable and differs significantly from zero in none of the sub-period estimates. This is consistent with the findings of previous investigators (e.g. Eichengreen and Mody 1998b), who have found the coefficient on this variable to be sensitive to time period, estimator and specification.
142 Chapter 6
Table 4. Determinants of Spreads for Low Credit Rating Borrowers
Variable Full sample Before Mexico Mexico -Asia After Asia
Amount 0.14 (4.57)
-0.09 (-1.19)
0.04 (1.02)
0.21 (3.08)
Predicted maturity -0.89 (-6.37)
0.09 (0.25)
-0.53 (-3.36)
-0.77 (-2.90)
Private placement 0.09 (3.44)
0.01 (0.21)
0.10 (2.27)
0.04 (0.80)
Guarantee 0.02 (0.50)
-0.08 (-1.07)
0.07 (1.13)
0.04 (0.49)
Log of 10 years US Treasury Rate -0.44 (-3.14)
0.28 (1.29)
0.32 (0.59)
0.06 (0.11)
Log of (10 year -1 year) Treasury Rate
-0.09 (-4.07)
0.05 (0.38)
-0.19 (-1.47)
-0.02 (-0.34)
Credit rating residual -0.02 (-5.83)
-0.03 (-4.27)
-0.03 (-5.05)
0.01 (1.24)
Debt/GDP 0.91 (7.66)
1.15 (5.10)
0.73 (3.52)
0.55 (1.87)
Debt rescheduled in previous year -0.16 (-3.58)
0.06 (0.95)
-0.01 (-0.16)
-0.29 (-2.61)
GDP Growth 6.43 (2.50)
1.78 (0.54)
2.49 (0.65)
2.29 (0.34)
Standard deviation of export growth 0.74 (3.53)
2.28 (4.81)
0.32 (0.70)
0.01 (0.04)
Reserves/short term debt -0.04 (-3.37)
-0.01 (-0.35)
-0.11 (-4.90)
-0.06 (-2.30)
Domestic credit/GDP -0.09 (-4.06)
-0.04 (-0.70)
-0.06 (-0.89)
-0.19 (-5.79)
Dummies for: Latin America
-0.36
(-7.64)
-0.16
(-0.85)
-0.15
(-1.46)
-0.08
(-0.63) East Asia and Pacific -0.20
(-2.98) -0.14
(-1.00) -0.33
(-2.41) -0.52
(-2.95) Eastern Europe and Central Asia - - - -0.002
(-0.01) Thailand, Indonesia, Malaysia and Korea
- - - 0.40 (2.15)
Period after Russian crisis - - - 0.27 (3.68)
Constant 6.70 (22.76)
4.90 (8.19)
5.42 (5.15)
5.04 (4.68)
Inverse Mills Ratio -0.49 (-16.46)
-0.51 (-14.66)
-0.37 (-6.13)
-0.18 (-2.19)
Number of bonds 1540 496 575 410 Log Likelihood -3041 -836 -982 -810
5. OUT-OF-SAMPLE PREDICTIONS
We now use the model for each sub-period to predict volumes, spreads and maturities in the next period. For example, the coefficients from the period prior to the Tequila crisis, in conjunction with the actual values of the independent variables in the period between the Mexican and Asian crises, are used to predict values in the interlude between the beginning of 1995 and the middle of 1997. Analogously, the coefficients estimated on data for the period

Flight to Quality 143
�
between the Mexican and Asian crises, in conjunction with the actual values of the independent variables in the period following the Asian crisis, are used to generate predicted values for the period after the summer of 1997. We follow the same procedure for the period following the Russian crisis.25 The prediction errors tell us whether changes in issuer, country and global credit conditions can explain observed changes in volumes, spreads and maturities, or whether there was an additional role played by shifts in market sentiment (the flight to quality).
Table 5. Determinants of Spreads for High Credit Rating Borrowers
Variable Full sample Before Mexico Mexico -Asia After Asia
Amount 0.26 (1.56)
0.14 (0.64)
0.06 (0.79)
-0.63 (-1.18)
Predicted maturity -1.56 (-1.75)
-0.26 (-0.25)
-1.81 (-3.26)
2.65 (1.26)
Private placement 0.31 (3.31)
-0.09 (-0.48)
0.36 (3.70)
0.16 (1.18)
Guarantee 0.14 (1.76)
0.07 (0.40)
-0.03 (-0.28)
0.23 (0.64)
Log of 10 years US Treasury Rate -0.46 (-1.43)
-0.25 (-0.43)
-0.77 (-1.07)
-2.00 (-0.68)
Log of (10 year - 1 year) Treasury Rate
-0.15 (-2.27)
-0.36 (-0.94)
0.35 (1.56)
0.04 (0.12)
Credit rating residual -0.04 (-4.18)
-0.03 (-1.09)
-0.05 (-5.52)
-0.04 (-1.35)
Debt/GDP 0.98 (4.27)
1.03 (1.82)
0.87 (2.17)
-1.86 (-1.16)
GDP Growth -11.71 (-0.96)
7.79 (0.41)
-42.09 (-2.95)
-37.30 (-1.03)
Standard deviation of export growth 3.91 (4.26)
4.15 (2.07)
2.60 (1.93)
4.83 (1.02)
Reserves/short term debt 0.02 (0.68)
-0.18 (-1.03)
0.19 (4.77)
-0.04 (-0.36)
Domestic credit/GDP -0.01 (-0.16)
0.03 (0.48)
0.02 (0.25)
-0.06 (-0.28)
Dummies for: Latin America
0.08
(0.31)
-
-
-
East Asia & Pacific 0.28 (1.02)
- -
-
Eastern Europe and Central Asia - - - 0.30 (0.32)
Thailand, Indonesia, Malaysia and Korea
- - - 1.58 (1.96)
Period after Russian Crisis - - - 1.25 (2.94)
Constant 5.82 (7.60)
4.11 (2.67)
9.29 (5.30)
7.62 (1.41)
Inverse Mills Ratio 0.08 (0.84)
0.15 (1.09)
-0.49 (-5.53)
0.65 (3.15)
Number of bonds 728 169 417 104 Log Likelihood -1338 -836 -655 -147

144 Chapter 6
5.1 Issuance
Plausibly, the volume of new bond issues by emerging markets was lower than predicted between the Mexican and Asian crises (Table 6), with one surprising exception, namely, that of Latin America. The results for these other regions suggest, intuitively, that the flight to quality led to a sharp drop in the volume of borrowing. Only in Latin America do deteriorating fundamentals more than fully account for the observed decline in issuance. As we will see, the effects of shifts in market sentiment against Latin America showed up in the behavior of spreads (and not in the volume of issuance).
Following the Asian crisis, the volume of new bond flotations again fell below the levels predicted by our out-of-sample forecasts. The discrepancy is particularly dramatic in the first half of 1998, reflecting the flight to quality.26 The volume of issuance then recovered most rapidly in Latin America (the crisis there being milder than that in Asia), with actual volumes again exceeding predicted levels in 1998.
After the Russian crisis, issuance remained below the levels predicted by the out-of-sample forecasts in all regions. Not surprisingly, Eastern Europe and Central Asia were disproportionately affected by the events of August 1998. Latin America and East Asia recovered more quickly, with the volume of issues again exceeding levels predicted in 1999.
Table 6. Effects of Crises on the Issuance Probability (%, Actual - Predicted) by Region
Mexican crisis Asian crisis Russian crisis
1995 1996 1997 1997 1998 1998 1999
Eastern Europe and Central Asia
-3.3 4.5 14.0 13.8 18.9 -12.9 -22.6
Middle East -18.8 -11.0 -2.2 2.2 -0.8 -5.1 -6.8
East Asia and Pacific
-22.5
-5.6
-8.0
-8.2
-19.6
-3.3
7.8
Caribbean -0.2 -3.5 -5.6 -5.6 -13.8
Latin America 2.0 6.1 9.6 -6.4 11.6 -10.9 1.0
South Asia -12.4 -17.1 6.2 -0.3 -19.2 -22.0
Africa -17.7 -18.8 -29.9 -14.8 -12.5 -11.3
Thus, it would appear that investor nervousness constraining the volume of bond issuance by Latin American borrowers died out more quickly than that affecting borrowers in other regions. It is not surprising to find this pattern following the Asian and Russian crises, whose effects were presumably most serious outside the Western Hemisphere. It is striking that the same effect is also evident following the Tequila crisis of 1994 and early 1995, however, suggesting

Flight to Quality 145
�
that it may reflect deeper, structural influences affecting the capital market access of Latin American countries. We say more about this below. 5.2 Maturities
Following the Mexican crisis, the out-of-sample forecasts for maturities (which are reported in Table 7) behave similarly to the out-of-sample forecasts for the volume of issuance. Maturity tends to be shorter than predicted in 1995, but to overshoot the out-of-sample forecast in 1996 and early 1997. Thus, while the maturity of new Latin American bond issues was nearly two years shorter than predicted in 1995, it was four years longer than predicted in the first half of 1997.
Table 7. Effects of Crises on the Maturity (Years, Actual - Predicted) by Region
Mexican crisis Asian crisis Russian crisis
1995 1996 1997 1997 1998 1998 1999
Eastern Europe and Central Asia
0.49
-1.34
-0.92
0.66
-0.42
4.46
1.22
Middle East -3.28 -1.47 -3.16 3.44 1.05 1.06 0.20
East Asia and Pacific
-1.06
0.37
0.86
0.51
2.74
6.05
0.97
Caribbean 1.18 1.09 -0.37 4.79 1.77
Latin America -2.05 1.15 4.52 3.94 4.08 1.88 -1.74
South Asia -0.93 7.30 12.10 1.96 7.51 2.70
Africa -3.17 0.16 2.80 -4.19 23.93 1.98
Following the Asian crisis, actual maturities exceed the out-of-sample
forecasts (in contrast to the period following the Tequila crisis, when they dipped below forecast levels). This attests to the stability and robustness of maturity; despite the crisis, borrowers who did come to the market were able to maintain and even lengthen the term of their obligations. Maturities also appear to have held up surprisingly well following the Russian crisis, except in Latin America. 5.3 Spreads
Following the Mexican crisis, Latin American spreads were, as expected,
higher than predicted by the out-of-sample forecasts for issuers from lower-rated countries. This effect decayed over time, until the first half of 1997 when the

146 Chapter 6
difference had reached negligible levels. The generally positive attitude of international investors toward East Asian borrowers in this period of “spread compression” is reflected in the tendency for actual spreads for that region to fall further and further below predicted levels as the Mexico-Asia interregnum proceeded.27
Following the Asian crisis, as seen in Table 8, the spreads paid by low-rated borrowers continue for the most part to be narrower than the out-of-sample forecasts. East Asia, not surprisingly, is the exception; there, spreads are higher than predicted by the out-of-sample forecasts in the second half of 1997 (though by only a relatively small margin), reflecting the deterioration in investor sentiment toward the region. However, this effect is short-lived; the 1998 East Asian spreads are again below the levels predicted by the out-of-sample forecasts. This quick recovery of sentiment is striking, given the severity of the crisis (and the contrasting behavior of Latin American spreads following the Tequila crisis).
Table 8. Effects of Crises on Spreads (Basis Points, Actual - Predicted) by Region for Low Rated Borrowers
Mexican crisis Asian crisis Russian crisis
1995 1996 1997 1997 1998 1998 1999
Eastern Europe and Central Asia
-373.34
-344.28
-378.00
-130.42
-24.82
-146.36
-65.12
Middle East -148.14 -206.55 -181.98 -163.79 -398.79 213.47 105.53
E. Asia & Pacific -35.08 -82.06 -134.03 29.56 -81.02 -1001.55 -477.27
Caribbean -627.18 -514.24 -205.46 -218.74
Latin America 89.89 34.20 -31.96 -95.10 -134.56 8.30 253.20
South Asia -255.11 -255.14 -193.60 -120.06 -60.76
Africa -226.57 -229.93 -263.63 196.41
Contrary to much informal discussion, it would appear that high observed spreads in East Asia in the first half of 1998 reflected the deterioration in fundamentals more than any shift in market sentiment or flight to quality.28 This is in contrast to issuance, where the effect of fundamentals is smaller and that of shifts in market sentiment is larger. After the Russian crisis, Asian spreads fell below predicted values. We suspect that this reflects the superior ability of Asian borrowers to delay borrowing in order to avoid paying exorbitant spreads. While the number of issuers in the high-credit-quality group is smaller, rendering the results in Table 9 less reliable, a few patterns stand out. The impact of the Tequila crisis on the spreads paid by relatively creditworthy borrowers lingers longest in Latin America.29 Again, it would appear that adjustment in that region occurs more in terms of spreads than in terms of issuance. Note also that Asian spreads exceed the out-of-sample forecasts following the Asian crisis, while Latin American spreads are lower than forecast.
Thus, while there is ample evidence of changes in market sentiment affecting spreads, the dominant impact of this “flight to quality effect” is within the region in which the crisis originates. Following the Mexican crisis, Latin

Flight to Quality 147
�
American spreads were persistently higher than predicted by the pre-crisis model, in contrast to other regions, where spreads returned quickly to predicted levels and even fell below them. Similarly, following the Asian crisis, the excess of actual over predicted spreads was larger in Asia than in other regions. Previous authors, such as Glick and Rose (1998), have emphasized the regional character of contagion. While we make the same observation, our interpretation is different. We emphasize changes in investor sentiment toward the region as a whole, rather than the trade links highlighted by these previous authors, which in our framework should show up as changes in fundamentals.
Table 9. Effects of Crises on Spreads (Basis Points, Actual - Predicted)
by Region for High Rated Borrowers
Mexican crisis Asian crisis Russian crisis
1995 1996 1997 1997 1998 1998 1999
Eastern Europe and Central Asia
19.61
-14.13
-11.81
-125.15
35.08
118.21
East Asia and Pacific
-15.40
4.89
42.44
24.60
-235.83
169.68
Latin America -119.91 -39.03 26.07 -47.14 -4.02 81.08
6. CONCLUSIONS
In this chapter we have examined how negative shifts in market sentiment are felt in the bond market and attempted to identify the country characteristics associated with the damage. To identify the impact on volumes, maturities and spreads, we estimated a model of these three dimensions of market access. Three findings are worth reemphasizing.
• While there is ample evidence of adverse changes in market sentiment
(the so-called “flight to quality”), the dominant effect is within the region in which the crisis originates. There is evidence of persistent unfavorable market sentiment in the behavior of primary-market spreads in Latin America but not East Asia after the end of 1994, and in East Asia but not Latin America after the first half of 1997. While the volume of new issues by East Asian borrowers was depressed by unfavorable market sentiment in 1995, and the volume of new issues by Latin American borrowers was similarly depressed by unfavorable market sentiment in the second half of 1997, inter-regional spillovers operating through this channel appear to have died out quickly, unlike the within-region impact which persisted.
148 Chapter 6
• In Latin America, compared to other regions, changes in market sentiment appear to have been felt more through their impact on prices and less on quantities. This might seem surprising given the decline in the volume of issues following the Mexican crisis. But even in the aftermath of the Tequila crisis, when the rate of new issues slowed, that decline is all but entirely attributable to the observed deterioration in country credit worthiness (that is, less favorable values of the independent variables), leaving little to be explained by changes in market sentiment. This is not to say that shifts in market sentiment were unimportant for Latin America, only that their main impact was on spreads rather than the volume of issuance. We conjecture that the contrast with East Asia reflects the relative flexibility of the economies in the two regions and their derived demands for external funds. Thus, when market sentiment deteriorates and spreads begin to widen, East Asian countries withdraw from the market, preferring to delay borrowing until another day. They are able to do this given their relatively high degree of real-side flexibility and pliable current accounts. In contrast, Latin American countries, which enjoy less flexibility, continue to come to the market irrespective of the level of spreads.
• While changes in market sentiment affect the price and quantity of new
issues, there is less evidence of an impact on maturities. Maturities have risen steadily over the 1990s and remained largely immune to changes in market sentiment. While they declined modestly in the aftermath of each emerging market crisis, those declines have been mild and the subsequent recovery rapid. Moreover, observed changes in fundamentals more than fully account for these temporary declines in the term of lending. That is to say, actual maturities exceed predictions based on the previous period’s estimated model and the current period’s independent variables in each of the intra-crisis intervals considered in this chapter. The upward drift in the maturity of emerging market bond issues and its stability in the face of repeated crises contrast with the shortening maturity of bank lending in the first half of the 1990s, and with sharp drops in the term of bank loans in periods of turbulence. This became a source of policy concern as the period progressed.
This last observation, the long term to maturity of bond debt and its
stability in the face of shocks, has led more than a few commentators to encourage countries to rely more on the bond market and less on bank debt, which is prone to run off in the event of a crisis. Our study highlights the other side of this coin, that access to the bond market tends to dry up just when it is needed most. Our analysis suggests that this problem has been growing with time. In particular, the weight investors attached to growth when deciding whether to lend increased after the Mexican crisis. Between the Tequila crisis and the outbreak of the Asian flu,

Flight to Quality 149
�
many countries in East Asia and Latin America enjoyed rapid growth, large quantities of bond issuance, and strikingly narrow spreads. But with the outbreak of the Asian crisis, as growth fell and in important instances turned negative, the importance investors attached to growth rose still further, precipitating an especially sharp drop in the volume of bond issuance. This heightened dependence of issue volumes on growth precisely in periods when growth rates suffered suggests that while bond debt may not flee in a crisis to the same extent as short-term bank debt, market access for those in need of additional credit can be seriously impaired. While foreign bank credits have special risks, bond finance is no panacea. APPENDIX A. DATA, SOURCES AND VARIABLES
Appendix Table A. Data Definitions and Sources �
Variable (billions) Periodicity Source Series Total external debt (EDT) US$ Annual WEO D
Gross domestic product (GDP, current prices)
US$
annual
WEO
NGDPD
Gross domestic product (GDPNC, current prices)
National
annual
WEO
NGDP
Gross domestic product (GDP90, 1990 prices)
National
annual
WEO
NGDP_R
Total debt service (TDS) US$ annual WEO DS
Exports (XGS) US$ annual WEO BX
Exports (X) US$ monthly IFS M#c|70__dzf
Reserves (RESIMF) US$ quarterly IFS q#c|_1l_dzf
Imports (IMP) US$ quarterly IFS q#c|71__dzf
Domestic bank credit (CLM_PVT)1
National
quarterly
IFS
q#c|32d__zf
Short-term bank debt (BISSHT)2 US$ semi-annual BIS
Total bank debt (BISTOT)3 US$ semi-annual BIS
Credit rating (CRTG) Scale semi-annual Inst. Inves.
Debt rescheduling (DRES) Indicator Annual WDT/GDF
Inflation rate (INFL) % per quarter Quarterly IFS 1. Credit to the private sector. 2. Cross-border bank claims in all currencies and local claims in non-local currencies of maturity up to and including one year. 3. Total consolidated cross-border claims in all currencies and local claims in non-local currencies.
Our data on international bonds, obtained from Capital Bondware and
supplemented by the Emerging Markets Division of the International Monetary Fund, covers the period 1991-I through 1999-IV. It includes: (a) launch spreads relative to risk-free rates (on government bonds of comparable maturities issued in the same currency as the bond under consideration), in basis points, where one basis point is one-hundredth of a percentage point; (b) amount of the issue (in millions of $US); (c) maturity of the issue

150 Chapter 6
in years; (d) whether the borrower was a sovereign, other public-sector entity, or private debtor; (e) the currency of issue; (f) the borrower’s sectoral affiliation: manufacturing, financial services, utility or infrastructure, other services, or government (where government refers to central banks and subsovereign entities that could not be classified in the other four industrial sectors); and (g) the country and region of the borrower.
This information was supplemented with country characteristics as described in Appendix Table A. Sources for this information included various issues of the International Monetary Fund’s World Economic Outlook (WEO) and International Financial Statistics (IFS), the World Bank’s World Debt Tables (WDT) and Global Development Finance (GDF), the Bank for International Settlements’ Maturity, Sectoral and National Distribution of International Bank Lending, and Institutional Investor’s Country Credit Ratings. Missing data for some countries were filled in using the U.S. State Department's annual country reports on Economic Policy and Trade Practices (available on the web at http:www.state.gov/www/issues/economic/ trade_reports/).
��
APPENDIX B. THE CREDIT RATING RESIDUAL
Appendix Table B. Determinants of Credit Rating
Variable Full sample Before Mexico Mexico -Asia After Asia
Debt rescheduling -7.37 (-10.83)
-5.25 (-5.38)
-11.44 (-9.70)
-5.14 (-3.91)
Reserves/GDP 6.42 (25.28)
3.58 (11.43)
10.16 (17.96)
13.98 (24.67)
Debt/GDP -19.42 (-31.85)
-23.00 (-26.92)
-12.32 (-11.35)
-10.59 (-7.97)
GDP Growth 93.45 (10.24)
119.71 (9.20)
541.75 (18.29)
26.17 (0.88)
Standard Deviation of Export Growth
-31.36 (-27.84)
-23.29 (-15.6)
-47.55 (-22.47)
-24.63 (-9.59)
Latin America -11.15 (-12.05)
-12.53 (-8.98)
-6.33 (-3.91)
-1.61 (-0.84)
Latin American interactions with: Debt rescheduling 1.86
(2.01) 1.96
(1.49) 8.46
(5.00) 0.04
(0.02) Reserves/GDP 16.73
(10.69) 20.44 (8.98)
9.56 (3.15)
4.48 (1.59)
Debt/GDP -0.43 (-0.26)
4.63 (2.14)
-1.92 (-0.62)
-6.76 (-1.75)
GDP Growth -97.62 (-3.69)
-316.99 (-5.21)
-558.62 (-8.82)
193.03 (2.21)
Standard Deviation of Export Growth
-2.89 (-1.04)
-17.65 (-4.09)
16.04 (3.21)
-1.65 (-0.34)
Constant
51.22 (133.55)
51.48 (95.55)
45.60 (57.94)
42.30 (48.84)
Adjusted R-squared 0.42 0.47 0.51 0.37
Number of observations 7659 3003 2531 2125
In this appendix we report the equations used to construct the credit rating
residual used as a measure of political risk. As explained in the text, we regress the credit rating on the ratio of debt to GNP, the debt-rescheduling dummy, the ratio of reserves to

Flight to Quality 151
�
GNP, the rate of GDP growth, and the variance of export growth. In addition to entering these variables in levels, we interacted them with a dummy variable for Latin America. We estimated the equation separately for each sub-period.
The results (shown in Appendix Table B) are of independent interest. When estimated on data for the full period, 10 of 12 independent variables enter with coefficients different from zero at the 95 per cent confidence level. (The exceptions are the interaction terms between the Latin America dummy on the one hand and standard deviation of export growth and the ratio of debt to GDP on the other.) The signs of the coefficients are intuitively plausible. Larger reserves, less debt, faster growth and more stable export growth improve credit ratings, while a recent history of debt rescheduling worsens them. Large reserves and a heavy debt burden matter more for Latin America, whereas fast growth and a recent history of rescheduling matter less.
In contrast to our results for issuance, spreads and maturities, the signs of the coefficients in the credit-rating equations generally remain the same across periods. Two exceptions are the interaction between the debt/GDP ratio and the dummy for Latin America, which is positive for the period before the Asian crisis, and the interaction between growth rate and Latin America dummy, which is negative for most of the 1990s but turns positive after the Asian crisis.
APPENDIX C. THE SPREAD-MATURITY RELATIONSHIP
Theoretical analyses suggest that maturity should first rise and then fall with credit quality. We expect maturity to rise with credit quality initially because lenders will be disinclined to purchase long-term bonds from the lowest-quality borrowers. For high-quality borrowers we expect maturity to decline with credit quality, since high-quality borrowers will prefer short-term debt in order to be able to refinance on more favorable terms in the future.
This implies that spreads should rise with maturity for high-quality borrowers, reflecting two factors working in the same direction. Spreads tend to increase with maturity, other things being equal, because of the higher liquidity risk, but in addition longer maturity will be associated with lower credit quality in the high-quality subgroup, thus also leading to higher spreads. For low-quality borrowers, in contrast, the two factors work in opposite directions, since higher maturity is associated with better credit quality and therefore with lower spreads. If this second effect dominates, we would expect the reverse relationship between maturity and spreads for low rating category borrowers, and the type of overall relationship between spreads and maturity indicated in Figure 2.
The data support this reasoning. We fit a quadratic in credit rating to maturity, obtaining coefficients of the expected sign and an inflection point at 55.3 on the Institutional Investor scale. The estimated equation is:
Log (maturity) = -0.279 + 0.075*Credit Rating - 0.0007*(Credit Rating)2 (2.08) (13.19) (12.06)
with t-statistics in parentheses, n = 2718, and an adjusted R2 = 0.075.

152 Chapter 6
This leads us to split the sample when we estimate our spreads equation at a credit rating of 55. The results there are consistent; the constant term is larger for the low-credit-quality subsample, while the coefficient on predicted maturity is negative for the low-credit-quality subgroup and generally positive for the high-credit-quality subgroup.�
Figure 2. Relationship Between Spread and Maturity�
Notes 1 Goldstein (1998), Eichengreen and Rose (1999), and chapter 4 by Pritsker are three efforts to address this question. 2 Representative of this genre is chapter 5 by De Gregorio and Valdés. 3 See for example Eichengreen (1998) and Corsetti and Srinivasan (1999) for literature reviews. 4 See for example Rodrik and Velasco (1999). 5 In other words, since higher interest rates cause borrowers with less risky projects to drop out of the market, upward pressure on interest rates will not equilibrate supply and demand. Credit rationing will result. Moral hazard (the tendency for higher interest rates to encourage borrowers to opt for riskier projects) works in the same direction as this adverse-selection effect. 6 See Diamond (1997). These alternative interpretations have very different policy implications: if the shortening of maturities mainly affects high-quality borrowers, it can be regarded as relatively benign, but if it affects mainly low-quality borrowers, then there is additional reason to be concerned about rollover risk. 7 The fall in maturities is most pronounced and extended following the Russian crisis. Figure 1 also shows that the variance of maturities and spreads fell sharply after each crisis. In Eichengreen and Mody (1998a), we showed that borrowers with relatively poor credit tend to be rationed out of the market following a crisis; this explains why the variance of spreads would fall. Figure 1 suggests that the same mechanism may operate on maturities.

Flight to Quality 153
�
8 Here the relevant neighborhood can be defined in economic and financial (Eichengreen and Rose 1999) as well as in purely geographic terms (Glick and Rose 1998). 9 See the articles surveyed in chapter 3 by Forbes and Rigobon. 10 To establish the robustness of our results, we relax this assumption and estimate the spread and maturity equations by two-stage least squares (after estimating the probit and constructing the Inverse Mills Ratio for inclusion in the other two equations). Point estimates on the vast majority of the coefficients (and all those discussed in the text) differ little under the two treatments. 11 These are the variables we employed as measures of credit worthiness in Eichengreen and Mody (2000); our earlier analysis (Eichengreen and Mody 1998a) used a more limited set of country characteristics. Details on the definition, construction and sources of these variables are provided in Appendix A. 12 The advantage of the Institutional Investor data over the Moody’s/S&P ratings used by most authors is more complete country coverage and regular publication. The data are biannual. 13 In other words, changes in procedures and indicators used by the rating agencies do not appear to have been a channel for contagion, insofar as it is valid to generalize from the Institutional Investor scores. 14 Average maturity was 5 to 8 years, depending on which of the samples used below is considered. The ten-year note was also used by previous authors such as Cline and Barnes (1997), which therefore enhances comparability. The use of the yield curve also brings into play the role of short-term interest rates. 15 The coefficients are normalized to the partial derivative of the probability distribution function with respect to a small change in the independent variable evaluated at average values of the independent variables to facilitate interpretation. 16 Thus, the Gang-of-Four dummy (which equals unity for Indonesia, Malaysia, the Republic of Korea, and Thailand) enters with a positive and statistically significant coefficient at the 10 percent confidence level in the equation for the period following the Asian crisis. 17 Presumably the volume of issuance was positively influenced by other perceived attributes of these four economies, possibly the view that growth prospects were still positive in the long run. 18 At the ten percent confidence level. 19 As shown in Figure 1. 20 Although the length of new issues did fall sharply in the second quarter of 1998. 21 Notice also that the Inverse Mills Ratio has been especially large since Asian crisis. The positive sign on this coefficient implies that issuers have unobserved characteristics that lead simultaneously to a higher probability of market issuance and longer maturities. In Tables 3-5, dummy variables for currencies, industrial sectors, private and public borrowers, and supranationals are included but not reported.

154 Chapter 6
22 See Eichengreen and Mody (1998a,b). 23 We do so because our analysis shows that maturity bears a non-linear relationship to creditworthiness and that spreads are influenced by maturity. Note that the same basic results obtain whether we split the sample at this or slightly different credit-rating thresholds. We chose 55 in order to obtain clean coefficients on the maturity variable, as explained in Appendix C. 24 The rescheduling variable appears in Table 4 for low-rated issuers but not in Table 5 for high-rated issuers because there are no highly-rated countries with recent histories of rescheduling in the sample, not surprisingly given the way the rating agencies operate. 25 Thus, while the results in the final columns of Tables 2-5 include data through 1999-IV (given the difficulty of estimating the full model on the relatively small number of observations for the sub-period following the Russian crisis), the out-of-sample forecast errors in the final column of Tables 6-8 are based on a model estimated through 1998-IV. For Table 9, we use a model estimated on data through 1999-IV and an in-sample forecast due to what would otherwise be an insufficient number of observations. 26 Except in Eastern Europe, where issuance remained buoyant. 27 For other regions, we similarly see actual spreads below predicted levels. Note that some of the differences for these other regions are driven by a relatively small number of observations.
28 Specifically, the decline in growth rate and the rise in debt/GDP ratios had the effect of raising spreads, as would have been predicted. For example, for low-rated East Asian borrowers, debt/GDP rose from 49 percent in the Mexico-Asian crisis period to 75 percent following the Asian crisis and growth fell from over four percent to negative rates. 29 Actual minus predicted spreads remain positive from 1995 through 1997.
References Calvo, Guillermo, Leonardo Leiderman, and Carmen Reinhart (1996). “Inflows of Capital to Developing Countries in the 1990s.” Journal of Economic Perspectives, 10:12-139. Cline, William, and K. Barnes. (1997). “Spreads and Risk in Emerging Market Lending.” Institute of International Finance Research Paper no. 97-1. Corsetti, Giancarlo, and T.N. Srinivasan (1999). “The Asian Financial Crisis and Proposals for Reform of the International Financial Architecture.” Mimeo, Yale University. Diamond, Douglas (1997). “Liquidity, Bank and Markets.” Journal of Political Economy, 105: 928-956. Eichengreen, Barry, and Ashoka Mody (1998a). “What Explains Changing Spreads on Emerging-Market Debt? Fundamentals or Market Sentiment?” NBER Working Paper no. 6408.

Flight to Quality 155
�
Eichengreen, Barry, and Ashoka Mody (1998b). “Interest Rates in the North and Capital Flows to the South: Is There a Missing Link?” International Finance, 1:35-58. Eichengreen, Barry, and Ashoka Mody (2000). “Would Collective Action Clauses Raise Borrowing Costs?” NBER Working Paper no. 7458. Eichengreen, Barry, and Andrew Rose (1999). “Contagious Currency Crises: Channels of Conveyance.” In Changes in Exchange Rates in Rapidly Developing Countries, Takatoshi Ito and Anne Krueger, eds., Chicago: University of Chicago Press. Flannery, Mark (1986). “Asymmetric Information and Risky Debt Maturity Choice.” Journal of Finance, 41(1); 19-37. Glick, Reuven, and Andrew Rose (1998). “Contagion and Trade: Why are Currency Crises Regional?” NBER Working Paper no. 6806. Goldstein, Morris (1998). The Asian Financial Crisis. Washington, D.C.: Institute for International Economics. Heckman, James (1979). “Sample Selection Bias as a Specification Error.” Econometrica, 47: 153-161. Rodrik, Dani, and Andrés Velasco (1999). “Short Term Capital Flows.” Mimeo, Harvard University and New York University. Stohs, Mark, and David Mauer (1996). “The Determinants of Corporate Debt Maturity Structure.” Journal of Business, 69: 279-312.