CHAPTER 5 A CASE STUDY OF BAMBOO SHOOTS IN...
46
140 CHAPTER 5 A CASE STUDY OF BAMBOO SHOOTS IN THAILAND This chapter offers a solution for selection of post-harvest technologies, optimal route selection including risk identification, risk assessment and risk mitigation for a case study of the Bamboo shoot supply chain in Thailand. 5.1 RISK INDENTIFICATION AND RISK ASSESMENT FOR BAMBOO SHOOTS To cover all possible risk issues in the bamboo supply chain, risk assessment guideline of World Bank, proposed by Jaffee et al (2010) was applied for interview and decision practices. The shelf life of the bamboo shoots depends on storage temperature, storage duration, treatment methods, packaging etc., and is determined by discoloration, fungal infection etc.,. Samples of bamboo shoot from farm and wholesale markets were randomly selected and stored in two different conditions, ambient temperature and chill temperature (4-10 o C). Table 5.1 Shelf life of fresh bamboo shoot with two storage conditions Source Ambient Temperature (25 – 30 o C) Controlled Temperature (4 – 10 o C) Farm 5 days 2 months Wholesale market 10 days > 2 months*
Transcript of CHAPTER 5 A CASE STUDY OF BAMBOO SHOOTS IN...

140
CHAPTER 5
A CASE STUDY OF BAMBOO SHOOTS IN THAILAND
This chapter offers a solution for selection of post-harvest
technologies, optimal route selection including risk identification, risk
assessment and risk mitigation for a case study of the Bamboo shoot supply
chain in Thailand.
5.1 RISK INDENTIFICATION AND RISK ASSESMENT FOR
BAMBOO SHOOTS
To cover all possible risk issues in the bamboo supply chain, risk
assessment guideline of World Bank, proposed by Jaffee et al (2010) was
applied for interview and decision practices. The shelf life of the bamboo
shoots depends on storage temperature, storage duration, treatment methods,
packaging etc., and is determined by discoloration, fungal infection etc.,.
Samples of bamboo shoot from farm and wholesale markets were randomly
selected and stored in two different conditions, ambient temperature and chill
temperature (4-10oC).
Table 5.1 Shelf life of fresh bamboo shoot with two storage conditions
SourceAmbient Temperature
(25 – 30oC)
Controlled Temperature
(4 – 10oC)
Farm 5 days 2 months
Wholesale market 10 days > 2 months*
141
*It is observed that when the samples were stored for 73 days during experiment, the
appearance attribute was acceptable
As shown in Table 5.1, samples selected from the wholesale market
can last longer than samples selected from farms because samples from the
wholesale market were treated with chemical treatment methods by
commission agents or traders at collection points or wholesale markets, while
samples from farm were not treated. Generally, fresh bamboo shoots from
different farms were picked. At collection points, peeling and trimming were
applied before soaking the shoots in a sulfur dioxide solution. Peeled and
trimmed bamboo shoots were soaked in sulfur dioxide solution (10-30% w/v)
about 3- 5 seconds, and packed in 10 kilogram polypropylene bags, each.
Goods were carried to wholesale markets by pick-up (small truck) at ambient
temperature. To study food safety risk causes by sulfur dioxide (SO2) content
in bamboo shoots, samples from different parts in the chain were randomly
collected and checked for SO2 residual. The results are shown in Table 5.2.
Table 5.2 SO2 residual per 1 kg bamboo shoot
Sources of sampling SO2 (g)
Farms 0.244
Collection Point 92.911
Wholesale Market 13.503
Consumers 1.414
The World Health Organization recommended consumption
quantity should not exceed 0.7 mg per 1 kg body weight. As data shown in
Table 5.2, it can be safe for a consumer if only he consumes fresh bamboo

142
shoots from farms. Bamboo shoots must be cooked before consuming.
However, there are many Thai cuisines served with raw items, herring
bamboo shoot for instance. In this case, consumers are at high chemical
hazard risk. To secure profit, post-harvest treatment as a chemical method is
generally applied for bamboo shoots. This is done at the collection point
before shoots are carried to wholesale market. Although this method can
increase chemical hazard risk to consumers, there is no system to prove that
the product is safe or not. Traceability is one vital issue in the quality chain
not yet applied in the case of bamboo shoots. Moreover, if chemical hazard
treatment is not applied, traders believe that the product is in a significant
biological and marketing risk. A trader makes based on his own risk since
browning reaction, growth of yeast and mold and unsatisfactory appearance
occur. These problems directly impact loss for traders and wholesalers. Three
major risk issues in the fresh bamboo shoot supply chain were identified as
shown in Table 5.3.
Table 5.3 List of Identified risks in post-harvest supply chain: a case
of bamboo shoot
Risk Issue Elementary risk Respect to
Product Risk Chemical Hazard Risk Consumers
Biological Hazard Risk Wholesalers and Traders a
Marketing Risk Product Appearance Risk Wholesalers and Traders b
Economic Risk Over cost risk Wholesalers and Traders c
a Biological Hazard Risk is assessed with respect to respects to
wholesalers and traders only because during storage and transportation,
produce can be affected by microorganisms, mostly fungi from outside of
bamboo shoot and lactic acid bacteria from inside of bamboo shoot.

143
Moreover, if the produces are stored at the ambient temperature for long time,
bamboo shoots become hard due to lignification process. The lignification
process makes the bamboo shoot into wood or woody through the formation
and deposit of lignin in cell walls. Usually, if bamboo shoot is treated
through chemical treatment, Wholesalers and traders can avoid this risk.
b Product Appearance Risk is evaluated with respect to respect to
wholesalers and traders because mostly this risk occurs during storage and
transportation. When storage temperatures were kept at ambient temperature,
bamboo shoots discolored and were visually unacceptable. Discoloration of
bamboo shoots was attributed to enzymatic browning caused by
phenylalanine ammonia-lyase (PAL) and peroxidase (PO), activated by tissue
injury at harvest. Greater activity of PAL and PO was correlated with increase
of crude fibre and lignin in shoots. Usually, if bamboo shoot is treated
through chemical treatment, Wholesalers and traders can avoid this risk.
c Over cost risk is caused by investment in post harvest treatment.
There are various techniques that can be applied to reduce risk level of
biological hazard risk and discolour appearance risk. However, usually
wholesalers and traders also want to avoid losses due to return can�t recover
investment cost, referred as over cost risk. Chemical treatment is commonly
applied by wholesalers and traders because the cost of implementation of
chemical treatment is very low when compared to other methods.
Risk value or the magnitude of risk events for sustainability is
usually affected by more than one elementary risk factor which is determined
through the recognized cause and effect feedback loop. In Figure 5.1 it is
shown that the magnitude of a risk event has been affected by risk input
factors as an illustrative example. The risk magnitude prediction system is to
determine the magnitude of different risks based on uncertainty level of input

144
factors affecting risks. The magnitude obtained from the fuzzy inference
system shows the risk value for sustainability.
Figure 5.1 Quantification of Risk
For the structure shown in Figure 5.1, details of elementary risk
factors shows in Table 5.4.
A commission agent or a trader is a major decision maker involved
in the chain. Frequently both commission agent and wholesaler can be the
same actor who plays a vital role in different activities including selection of
post-harvest treatment. However, application of improper post-harvest
technology to improve quality of products can result in loss of profit due to
price and demand uncertainty. Agricultural producers have little control over
the market forces that drive commodity prices. Supply and demand changes
can cause large and unforeseen swings in prices. Farmers face a variety of
price, yield, and resource risks which make their incomes unstable from year
to year. Farmers deal with a significant level of uncertainty every day. It is
therefore imperative for farmers to manage risk both on the input and the
1. Risk Identification
2. Define Rule for model: Knowledge base in technology, agribusiness, and agro-industry management
3. Fuzzy Inference System (FIS) 4. Elementary Risk Factor
5. Risk Value for Sustainability

145
output side. The objective of this part is to understand mechanism and
interaction amongst risks, internal risk factors, risk magnitude, and producers�
revenue in order to mitigate the negative impacts of the risk for farmers.
Interview with the players revealed the major possible risks in the bamboo
shoot supply chain as shown in Table 5.5. Yield loss, over production cost,
and poor appearance were located at important ranks by farmers.
Table 5.4 Risk factors and elementary risk factors with respect to
elementary risk
Elementary Risk Risk Factors Elementary Risk
Factors Fixed and Operation Cost
Complexity Chemical Hazard Risk
Post-harvest treatment
Awareness of consumer
Fixed Operation Cost
Complexity
Biological Hazard Risk
Post-harvest treatment
Awareness of consumer Fixed and Operation Cost
Complexity
Product Appearance Risk
Post-harvest treatment
Awareness of consumer
Fixed and Operation Cost
Complexity
Over cost risk Post-harvest treatment
Awareness of consumer
Fixed and operation cost, complexity, and awareness of consumer were
the elementary risk factors obtained from interview with fifteen experts(stake
holders or players) involved in bamboo shoot supply chain. Players in the
supply chain are considering these three factors for making decision to
implement post-harvest treatment alternative in long term. For instance, if the

146
awareness level of consumer to food safety is very high, then the treatment
method with plausible low cost, and plausible low complexity level which
satisfy quality attribute and food safety will be chosen. But if awareness level
of consumer to food safety is very low, then the treatment method with
possible lower cost and possible lower level of complexity of application that
satisfy only quality attribute will be implemented. Even though the
implementation of second case help in achieving lower cost and lover
complexity level of application, it may contribute hazard risk to consumers.
Table 5.5 List of Identified risk
No. Risks
1 Yield Loss
2 Over production cost
3 Poor appearance
4 Wholesale Price Suddenly Decline
5 Commitment failure
6 Over handling & transportation cost
7 Lignifications during storage
8 Spoilage during storage
9 Demand suddenly declines
10 Retail price declines
11 Insufficient raw material supply
12 Insufficient raw material supply
13 Insufficient Labor

147
5.1.1 Application of Fuzzy Logic for Identification and
Assessment
Agricultural producers are forced to make decisions based on
imperfect information. Born out of this uncertainty is the possibility of loss.
A flowchart representing the different stages of the risk management process
carried out by the proposed fuzzy SD approach is shown in Figure 5.1. As
seen in this figure, the dynamic risk management system performs all phases
of the risk management process, i.e. risk identification, analysis, response
planning by the use of the proposed SD-based approach. The complex model
of the risk management process described above was developed employing a
SD modeling software tool known as �VENSIM Plus 5.9e�. The magnitudes
of risks were also calculated using MATLAB software.
A fuzzy inference system is used to determine the degree to which
the inputs belong to each of the appropriate fuzzy sets through the
membership functions. The input is always a crisp numerical value limited to
the universe of discourse of the input variable and the result of fuzzification is
a fuzzy degree of membership. The problem of constructing a membership
function is that of capturing the meaning of the linguistic terms employed in a
particular application adequately and of assigning the meanings of associated
operations to the linguistic terms. The scenario involves a specific knowledge
domain of interest. For this case, fifteen experts were interviewed to elicit the
knowledge of interest and to express the knowledge in some operational form
of a required type.
The magnitude of risk events is usually affected by some risk
factors which are determined through the recognized cause and effect
feedback loops. In Figure 5.2 it has been shown that the magnitude of a risk
event has been affected by four risk input factors as an illustrative example.

148
The value of the input factors cannot be known. Moreover, the relationship
between the values of the input factors and the magnitude of risks cannot be
obviously defined.
Figure 5.2 Relationships between the risk input factors, risk magnitude
and consequences
The risk magnitude prediction system is to determine the magnitude
of different risks based on the level of uncertainty of input factors affecting
the respective risk. The magnitude obtained from fuzzy inference system acts
as an input for the simulation of risk consequences in the later stages. The risk
magnitude prediction system includes determination of input factors affecting
the risk magnitude by fuzzy numbers, consolidation of expert inputs by the
fuzzy Delphi technique, and prediction of risk magnitude by the fuzzy
inference system.
The consolidation of input factors was done using the fuzzy Delphi
technique. The final consolidated fuzzy numbers will act as an input to the
fuzzy control system to determine the magnitude of risk events in the later
stage. The inputs (the probability of yield loss and poor appearance) for
simulating the system is computed by the application of fuzzy inference
system. The values of four input factors affecting to risks are proposed by
different experts as triangular fuzzy numbers (TFN) based on their subjective
judgments. The Fuzzy Delphi technique was employed to consolidate the
IrrigationCapital Level
FertilizerApplication
Level
Pre-harvest Treatment Capital Level
BambooClump
Age
Risk Event Magnitude
Consequence of risk

149
TFNs provided by the experts. Different components of the fuzzy control
system are determined as follows:
(1) Fuzzification: The membership function values for the four
input variables (i.e. irrigation capital level, fertilizer application level, bamboo
clump age and pre-harvest treatment capital level) and also unit of the input
variables obtained are shown in Table 5.6.
The membership function graphs shown in Figure 5.3, the
membership functions for this study were obtained from the expert. In order
to apply the model to any other supply chain risk project, further work is
needed to establish appropriate membership functions (or rules).
Table 5.6 Input membership function
Operational risk factors
Risk Min Max Most
plausibleUnit
Low Irrigation Level YL 4 30 4 $/Acre High Irrigation Level YL 15 40 40 $/Acre Low Fertilizer Level YL,PA 152 400 152 $/Acre Average Fertilizer Level YL,PA 230 670 450 $/Acre High Fertilizer Level YL,PA 500 758 758 $/Acre Young bamboo clump age
YL 1 3.5 1 Year
Mature bamboo clump age
YL 2 6 4 Year
Old bamboo clump age YL 5 8 8 Year Low pre-harvest treatment level
PA 50 100 50 $/Ton
High pre-harvest treatment level
PA 70 114 114 $/Ton
YL=Yield Loss, PA= Poor Appearance

150
(2) Inference: The level of the fuzzy control system�s output
(i.e. the probability of yield loss and poor appearance) is induced by the
inference rules. With four input factors and two output factors: probability of
yield loss and poor appearance, there exist the total of 69 fuzzy control rules.
Output membership function is shown in Table 5.7.
(a) Irrigation capital level
(b) Fertilizer application level

151
(c) Bamboo clump age
(d) Pre-harvest treatment capital level
(e) Probability of yield loss/ Probability of poor appearance
Figure 5.3 Membership functions of inputs and outputs
152
Samples of Fuzzy input membership function for bamboo clump show
in equation (5.2)
(5.2)
From equation (5.2) ,fuzzy membership functions of bamboo shoot
clump age: young, maturity, and old are derived. The is age of bamboo
clump.
For example, a membership function for a fuzzy set �age� on the
universe of discourse X is defined as U age :X [0,1], where each element of
X is mapped to a value between 0 and 1. This value, called membership value
or degree of membership, quantifies the grade of membership of the element
in X to the fuzzy set age.
Young:
When the age is less than 1year, membership level with respect to young is 1.
If the age is equal to or greater than 1 year and less than or equal to 3.5 years,
membership level with respect to young is . If the age is greater than 3.5
years, membership level with respect to young is 0.

153
Maturity:
When age is less than 2 years or greater than 6 years, membership
level with respect to maturity is 0. If the age is equal to or greater than 2
years and less than or equal to 4 years, membership level with respect to
maturity is . If the age is greater than 4 years and less than or equal to 6
years, membership level with respect to maturity is .
Old:
When age is less than 5 years, membership level with respect to old
is 0. If the age is equal to or greater than 5 years and less than or equal to 8
years, membership level with respect to old is . If the age is greater than 8
years, membership level with respect to old is 1.
Fuzzy output membership function for risk magnitude
quantification is shown in equation (5.3) and Table 5.7.

154
(5.3)
Definition: a membership function for a fuzzy set R on the universe
of discourse X is defined as µR:X [0,1], where each element of X is
mapped to a value between 0 and 1. This value, called membership value or
degree of membership, quantifies the grade of membership of the element in
X to the fuzzy set R.
Very Low
When risk magnitude is less than or equal to 0.10, membership
level with respect to very low is 1. If the risk magnitude is greater than 0.1
155
and less than or equal to 0.20, membership level with respect to very low is
. If risk magnitude is greater than 0.2, membership level with respect to
very low is 0.
Low
When risk magnitude is less than 0.10 or greater than 0.40,
membership level with respect to low is 0. If the risk magnitude is equal to
or greater than 0.1 and less than 0.25, membership level with respect to low
is . If the risk magnitude is equal to 0.25, membership level with
respect to low is 1.0. If the risk magnitude is greater than 0.25 and less than
or equal to l 0.4, membership level with respect to low is .
Medium:
When the risk magnitude is less than 0.30 or greater than 0.70,
membership level with respect to medium is 0. If the risk magnitude is
equal to or greater than 0.30 and less than 0.50, membership level with
respect to medium is . If the risk magnitude is equal to 0.50,
membership level with respect to medium is 1.0. If the risk magnitude is

156
greater than 0.50 and less than or equal to 0.7, the membership level with
respect to medium is .
High:
When the risk magnitude is less than 0.60 or greater than 0.90,
membership level with respect to high is 0. If the risk magnitude is equal to
or greater than 0.60 and less than 0.75, the membership level with respect to
high is . If the risk magnitude is equal to 0.75, membership level with
respect to high is 1.0. If the risk magnitude is greater than 0.75 and less than
or equal to 0.9, membership level with respect to high is .
Very High
When the risk magnitude is less than 0.80, membership level with
respect to very high is 0. If the risk magnitude is equal to or greater than 0.80
and less than 0.90, membership level with respect to very high is . If
the risk magnitude is equal to or greater than 0.90 and less than or equal to
1.0, membership level with respect to high is 1.

157
Table 5.7 Output membership function
Ling Linguistic
terms linguistic
Trap Trapezoidal
fuzzy number
Very high (0.80, 0.90, 0.10, 1.00)
High (0.60, 0.75, 0.75 0.90)
Medium (0.30, 0.50, 0.50 0.70)
Low (0.10, 0.25, 0.25, 0.40)
Very low (0.0, 0.0, 0.10, 0.20)
From input and output membership function defined, Mamdani FIS
for risk magnitude prediction was developed. Some fuzzy rules used in this
FIS were shown in Figure 5.4. The complete fuzzy rules used in FIS is given
in Appendix 4.

158
Figure 5.4 Sample Rules of Fuzzy Inference Systems
Commodity cycles do not only arise in raw material and agriculture
products but also in high-tech and highly differentiated products. System
dynamics (SD) is useful approach in the agricultural commodity supply chain.
In order to study the imprecise and uncertain nature of risk events, fuzzy logic
is integrated to the proposed SD-based approach. The production and
distribution simulation model (PDSM) is needed to act as a baseline in the
risk analysis. There is deficiency of conventional techniques for supply chain
risk management and tools are arising from the multiple feedback processes
involved in the supply chain, as well as the highly dynamic nature of fresh
produce supply chain. The complementary tool is required. The system
dynamics approach is an alternative tool that enables one to consider these
issues in a SD environment. PDSM for risk analysis was developed in a SD
environment.

159
5.1.2 System Dynamics Modeling
Average production is 80,808 tons per year (2005-2008), while
produce is supplied to wholesale markets, retailers, and factories. Two
significant risks are yield loss and poor appearance. These were selected to
quantify inputs and develop risk models through the fuzzy SD approach. With
random age of bamboo clumps, farmers are required to decide appropriate
capital levels for irrigation, fertilizer, and pre-harvest treatment. These
internal factors are considered by farmers as the main risk factors affecting
their return. Furthermore, for manufacturers, wholesalers and retailers,
post-harvest treatment with respect to the desired market is required. The
harvest season of bamboo shoots starts from March and lasts to November.
Apart from production input, production yield and price depends on season.
Both influence interaction. In order to quantify risk magnitude for yield using
the fuzzy inference system and predict revenue through system dynamics
simulations reasonably, we divided the harvest season into four periods. There
are D1 (March-April), D2 (May-June), D3 (July-August), and D4
(September-November). System dynamic Simulation model developed for the
case considered and the simulated results are given in Figure A3.1 to A3.8 of
Appendix 3. The equations used in the System dynamic Simulation model for
simulation is given in Table A3.1 of Appendix 3.
5.2 ANALYSIS OF RISK USING SYSTEM DYNAMICS AND
DESIGN OF THE EXPERIMENT
From the bamboo shoot supply chain problem discussed in 5.1, four
policies are proposed for testing as shown in Table 5.8.

160
Table 5.8 Four policies (I, II, III, and IV) were tested
Policy Irrigation Fertilizer Pre-harvest
Capital Level
I Low Low Low
II High High High
III Low Average Low
IV High Average Low
The above policies are simulated through the system dynamics
application, Vensim software. Total cost and profit obtained from the system
dynamic models were presented in Table A5.2 to Table 5.13 in Appendix 5.
After the simulation runs, the results were used for factorial design
experiments and Response Surface optimization. The details are presented in
Tables 5.9-5.16.
Table 5.9 Factors and its level for Policy I
Factors Levels Values A: Bamboo Clump Age (block) 7 1.0, 2.0, 3.5, 4.0, 5.0,
6.0, 8.0 B:Irrigation Capital Investment Level
2 4, 30
C: Fertilizing Capital Investment Level
2 152, 400
D: Pre-harvest treatment capital level 2 50, 100

161
Policy I: As shown in Table 5.9, to avoid financial risk, all the input factors
were set at a low level. This is the level at which we expect to take on
minimum risk of investment loss in the system. Moreover bamboo clump age
was considered as an uncontrollable factor by setting a block for the factorial
design experiment in randomized complete block design (RCBC). Analysis of
factorial design for policy I is shown in Table 5.10.
Table 5.10 Analysis of Variance for Policy I
Source DF SSE MSE P A 6 807909491 134651582 0.000 B 1 358236799 358236799 0.000 C 1 65033031 65033031 0.000 D 1 33733559 33733559 0.007 B*C 1 160579 160579 0.847 B*D 1 79 79 0.997 C*D 1 2449055 2449055 0.452 A*B*C 1 23633 23633 0.941 Error 42 178851811 4258376 Total 55 1446398037
From Table 5.10, a set of experimental designs have been done in
order to explore the appropriate investment conditions of the three factors.
Irrigation capital investment level (B), fertilizing capital investment level (C)
and pre-harvest treatment capital level (D) are having a significant influence
(p<0.05) on the total profit.

162
(a) Main effect plot for policy I
(b) Interaction plots for policy I
Figure 5.5 Main effect and Interaction plots for policy I
Figure 5.5 (a) shows the main effects of the profit in which the
irrigation capital investment level is the most significant influence. With
irrigation capital investment at a low level, it shows that the increasing
irrigation capital investment seemingly caused an increase in profit. Figure
5.5(b) shows two factor interactions in which all cases of interaction do not
significantly influence profit.

163
Policy II: All the input factors were set at high levels at which we expect to
take minimum risk for yield loss in the system. This is shown in Table 5.11.
Table 5.11 Factors and its level for Policy II as per factorial Design
Factor Levels Values
A: Bamboo Clump Age (block) 7 1.0 2.0 3.5 4.0 5.0 6.0 8.0
B : Irrigation Capital Investment Level
2 15, 40
C: Fertilizing Capital Investment Level
2 500, 758
D: Pre-harvest treatment capital level 2 70, 114
Bamboo clump age was considered as block in the factorial design
experiment. Analysis of factorial design for policy II is shown in Table 5.12.
Table 5.12 Analysis of Policy II as per factorial Design
Source DF SSE MSE P
A 6 13466356761 13466356761 0.000
B 1 748318867 748318867 0.000
C 1 318374626 318374626 0.000
D 1 2303402 2303402 0.441
B*C 1 104231974 104231974 0.000
B*D 1 17814 17814 0.946
C*D 1 17020616 17020616 0.041
A*B*C 1 21994 21994 0.940
Error 42 160076471 160076471
Total 55 2697001440

164
As shown in Table 5. 12, a set of experimental designs have been
done in the case of policy II in order to explore the appropriate investment
conditions of the three factors. From the analysis shown in Table 5.12, it is
found that Irrigation Capital investment level (B), Fertilizing Capital
investment level (C) significantly influence (p<0.05) the total profit for
policy II.
(a) Main effect plot for policy II
(b) Interaction plots for policy II
Figure 5.6 Main effect and Interaction plots for policy II

165
Figure 5.6 (a) shows the main effects of the profit. With irrigation
capital investment at a low level, it shows that the increasing irrigation capital
investment seemingly caused an increase in profit. Moreover Figure 5.6(b)
shows interactions between B and C and C and D significantly influence the
profit.
Policy III: As shown in Table 5.13, the fertilizer capital factor level was set
at average and other factors were set at low levels. Bamboo clump age was
considered as a block in the factorial design experiment.
Table 5.13 Factors and its level for Policy III as per factorial Design
Factor Levels Values
A: Bamboo Clump Age (block) 7 1.0 2.0 3.5 4.0 5.0 6.0 8.0
B : Irrigation Capital Investment Level
2 4, 30
C: Fertilizing Capital Investment Level
3 230, 450,670
D: Pre-harvest treatment capital level
2 50, 100
Analysis of factorial design for policy III is shown in Table 5.14.

166
Table 5.14 Analysis of Policy III as per factorial Design
Source DF SSE MSE P A 6 1559220256 259870043 0.000
B 1 1033534685 103353468 0.000
C 2 206522296 103261148 0.000
D 1 13343295 13343295 0.011
B*C 2 133682664 66841332 0.000
B*D 1 4157 4157 0.963
C*D 2 2449055 14130035 0.001
A*B*C 2 28260069 42775 0.978
Error 66 85551 1932655
Total 55 1446398037
As shown in Table 5.14, a set of experimental designs have been
done in the case of policy III in order to explore the appropriate investment
conditions of the three factors. Irrigation capital investment level (B),
Fertilizing capital investment level (C) and Pre-harvest treatment capital level
(D) are significantly influence (p<0.05) the total profit.
(a) Main effect plot for policy III

167
(b) Interaction plots for policy III
Figure 5.7 Main effect and Interaction plots for policy III
Figure 5.7 (a) shows the main effects on profit in which irrigation
capital investment level (B),Fertilizing Capital investment level (C) and
Pre-harvest treatment capital level (D) are significantly influencing the
response. Moreover Figure 5.7 (b) shows two factor interactions and
interaction effect between B and C, and between C and D are significantly
influence the profit.
Policy IV: As shown in Table 5.15, the fertilizer capital factor level was set at
average and other factors were set at a high level. Bamboo clump age was
considered as block in the factorial design experiment.
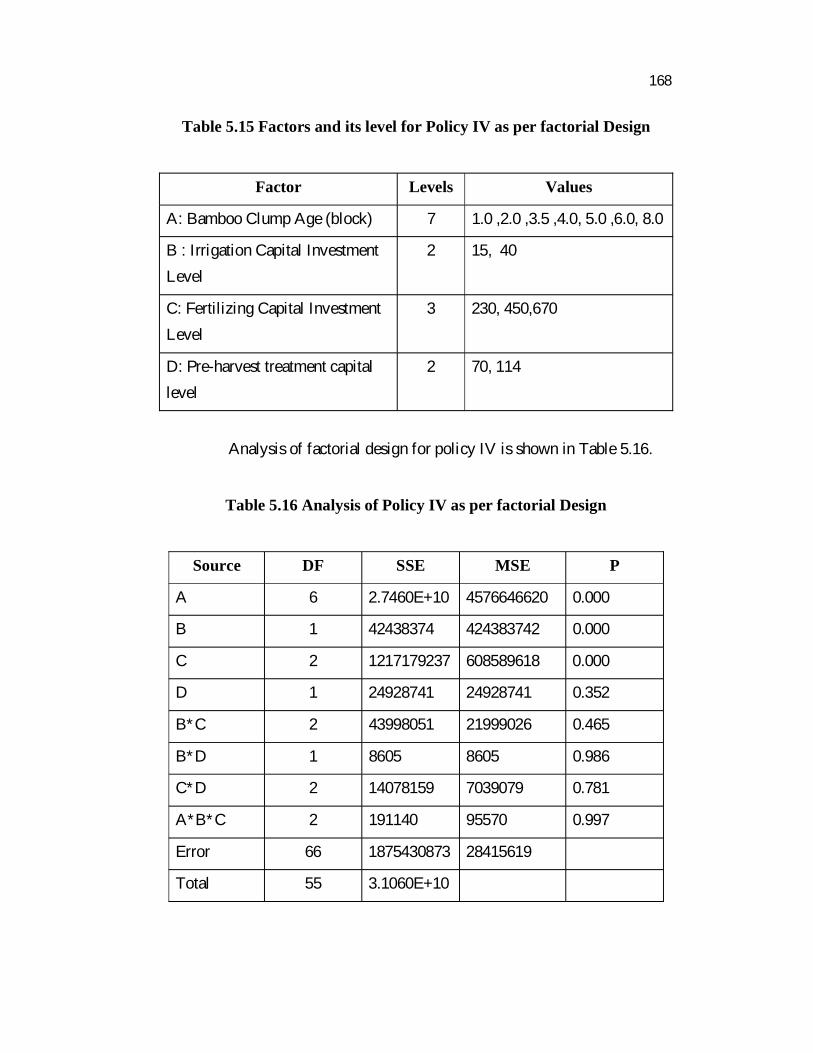
168
Table 5.15 Factors and its level for Policy IV as per factorial Design
Factor Levels Values
A: Bamboo Clump Age (block) 7 1.0 ,2.0 ,3.5 ,4.0, 5.0 ,6.0, 8.0
B : Irrigation Capital Investment Level
2 15, 40
C: Fertilizing Capital Investment Level
3 230, 450,670
D: Pre-harvest treatment capital level
2 70, 114
Analysis of factorial design for policy IV is shown in Table 5.16.
Table 5.16 Analysis of Policy IV as per factorial Design
Source DF SSE MSE P
A 6 2.7460E+10 4576646620 0.000
B 1 42438374 424383742 0.000
C 2 1217179237 608589618 0.000
D 1 24928741 24928741 0.352
B*C 2 43998051 21999026 0.465
B*D 1 8605 8605 0.986
C*D 2 14078159 7039079 0.781
A*B*C 2 191140 95570 0.997
Error 66 1875430873 28415619
Total 55 3.1060E+10

169
As shown in Table 5.16, a set of experimental designs have been
done in the case of policy IV in order to explore the appropriate investment
conditions of the three factors. Irrigation capital investment level (B) and
fertilizing capital investment level (C) are significantly influencing (p<0.05)
the total profit. While pre-harvest treatment capital level (D) is not
significantly influencing the profit in this policy.
(a) Main effect plot for policy IV
(b) Interaction plots for policy IV
Figure 5.8 Main effect and Interaction plots for policy IV

170
Figure 5.8 (a) shows the main effects of the profit in which
fertilizing capital investment level also produced a quadratic effect.
Figure 5.8(b) shows that two factor interactions in all cases of interaction are
not significantly influences the profit.
5.2.1 Optimization to Mitigate Risk to Profit/ Loss
In another set of analyses, response surface optimization was
applied to achieve higher performance of the profit from production and
pre-harvest treatment investment levels. The optimal conditions is shown in
Figure 5.9.
Figure 5.9 Policy Optimization
Figure 5.9 shows that recommended capital investment levels of irrigation, fertilizing and pre-harvest treatment at 40 $/Acre, 455 $/Acre, and 50 $/Ton respectively. This condition was suggested to mitigate risk in the case study. Irrigation capital investment at high level, fertilizing capital investment at average level, and pre-harvest treatment capital investment at low level are recommended. From the Analysis of Variance of Factorial experiments performed for different policies and the main effects plot, the significant factors and the best level for the factors were identified. The details are provided in Table 5.16a.

171
Table 5.16a Comparison of different policies
Best levels(values) for the factorsPolicy Significant factor
(B ) (C) (D)
I
Irrigation Capital Investment (B ) , Fertilizing Capital Investment (C) and Pre-harvest treatment capital(D)
30 (High)
400 (High)
50 (Low)
II
Irrigation Capital Investment (B ) and Fertilizing Capital Investment (C)
40 (High)
500 (Low)
114 (High)
III
Irrigation Capital Investment (B ) , Fertilizing Capital Investment (C) and Pre-harvest treatment capital(D)
30 (High)
450 (Average)
50 (Low)
IV Irrigation Capital Investment (B ) and Fertilizing Capital Investment (C)
40 (High)
670 (High)
114 (High)
When comparing the factorial experiment results related to different
policies with optimal result obtained through Response Surface Method, it is
observed that pattern of response obtained through Policy III (Irrigation
capital investment at high level, fertilizing capital investment at average level,
and pre-harvest treatment capital investment at low level) is similar to that of
optimal results achieved by Response Surface Method. Hence, Policy III is
recommended to mitigate risk in this case study.
5.3 SELECTION OF POST–HARVEST TREATMENT IN THE
FRESH BAMBOO SHOOT SUPPLY CHAIN
Supply chain parties in the bamboo shoot supply chain consist of
growers (harvest), commission agents (collection and post-harvest treatment),
wholesalers (storage), buyer (transportation) and retailers (storage).
Commission agents or traders are key players for making decisions for

172
selection of post-harvest technology strategies with respect to the desired
quality level.
5.3.1 Alternative Post-Harvest Treatment Methods
Four post-harvest treatment methods considered are: (1) soaking in
sulfur dioxide solution, (2) blanching, (3) controlled-temperature
transportation, and (4) dipping in vinegar. The details of four treatments are
explained in Table 5.17.
Table 5.17 Post-harvest treatment for bamboo shoot supply chain
TreatmentMethods
Details
Soaking in sulfur dioxide solution
Peeled and Trimmed Bamboo shoots are soaked in a sulfur dioxide solution (10-30% w/v) about 3- 5 seconds, and packed in 10 kilogram plastic bags. Goods are carried to the wholesale market by pick-up (small truck) at ambient temperature.
Blanching Peeled and Trimmed Bamboo shoots are dipped in hot water(80-90 C) for 1 second followed by cool water (0-1 C)
for 3 seconds, and packed in 10 kilogram plastic bags. Goods are carried to the wholesale market by pick-up (small truck) at ambient temperature.
Controlled-temperature during storage and transportation
Peeled and Trimmed Bamboo shoots are soaked in cool water for 5 � 10 minutes and packed in 5 kilogram plastic bags. Each five kilogram bamboo shoot pack is covered by an ice bag and kept in an ice tank(approximately 600 kilograms per tank). Goods are carried to the wholesale market by pick-up (small truck).
Dipping in vinegar Peeled and Trimmed Bamboo is dipped in hot vinegar for 3-5 seconds and packed in 10 kilogram plastic bags. Goods are carried to the wholesale market by pick-up (small truck) at ambient temperature.

173
5.3.2 Criteria for Selecting Post-Harvest Treatment
Post-harvest technology has impact on the quality attributes of the
product reaching the customer (Aked 2002). However, when an individual is
willing to purchase fresh bamboo shoots, not only quality issues must be
considered. Economic issues must also be taken in account. From information
obtained through interview and discussion, there are five related criteria
considered including: food safety, whiteness, shelf life, price and peeled
bamboo shoot color (shown in Table 5.18).
Table 5.18 Food safety, whiteness, shelf life, price and peeled bamboo
shoot color
Criteria Explanation
Food Safety Food safety for consumers� health
Whiteness Whiteness at cutting area after trimming
Shelf life Product can last during storage
Price Wholesale price
Peel Appearance Peel colour and shape
The conceptual model of the proposed method for selecting
post-harvest technology is shown in Figure 5.10. From the identified risk, the
specified alternative post-harvest technology methods were chosen to be
performed and then people involved in the chains were interviewed(both
private and government sectors). Post-harvest technological goals were
defined and the hierarchy scheme was constructed. FDM was used to obtain
data from field work for the pairwise comparisons. Using the Centriod
Method to quantify fuzzy numbers associated with the pairwise comparisons,

174
values will be transformed to crisp values. Finally by applying the AHP
approach, the optimum post-harvest technology strategy was selected.
Figure 5.10 Conceptual model for selecting post-harvest treatment and
continuous improvement
5.3.3 Generic Hierarchy Structure: Goal, Criteria, and Alternative
Multiple Attribute Decision Making (MADM) technique is applied
in order to make decisions in the presence of multiple and conflicting criteria.
In MADM, AHP recognizes the basic rationality by breaking down a problem
into smaller and smaller constituent parts and then guides the decision maker
Identification of Post-harvest Treatment alternatives Identification of the decision criteria
Construct the hierarchy scheme
Construct Pairwise comparisons using fuzzy Delphi method
Defuzzification
Utilize AHP method to find optimum post-harvest Treatment
Knowledge Base of Post-Harvest Management for Fresh Bamboo
Shoot
Fuzzy Inference System (FIS)
Data obtained from field work through observation, interview and discussion
Risk Value for Sustainability of SC
Implementation of the selected method

175
through a series of pairwise comparison judgments to express the relative
strength or intensity of impact of the elements in the hierarchy.
5.3.4 Consolidation of Expert Input: Fuzzy Delphi Method
The value obtained from input factors was vague and ambiguous.
When Decision Maker (DM) considers input criteria to select post-harvest
treatment methods, owing to the imprecise and uncertain pairwise rating of
these factors and a general lack of data for their probabilistic quantification,
fuzzy logic is implemented. The values of the input factors are determined
based on the experience and subjective judgment of experts involved in the
post-harvest chain.
Fuzzy logic is an analytical approach that allows for multiple
membership of sets and different levels of belonging to any one set. The basic
assumption is that no clear boundaries exist between members and non-
members of a set, which has been defined as a collection of distinct things
considered as a whole. The notion of fuzzy logic has been used in a wide
range of topics in agricultural management. However, the notion of fuzzy
logic theory has not been developed in the agricultural supply chain as a
means of assessing this research. We use the people involved in the
agricultural chain in the East of Thailand as a case to demonstrate that fuzzy
set theory can be used as an effective approach to examining post-harvest
technology�s contribution values, particularly when enablers in the chain hold
multiple values with different levels of emphasis. The consolidation of input
factors can be done using FDM. The final consolidated fuzzy numbers will
act as rating for AHP approach to evaluate criteria and technological strategy.
The FDM consists of the following steps (Kaufmann and Gupta,
1988; Shaheen et al 2007):

176
Step 1: �n� number of experts provide the estimates of input factors
in the form of triangular fuzzy numbers . Triangular
membership function is shown in equation (5.1). In Delphi technique highly
qualified experts must be interviewed to give their opinions regarding a
specific issue. The minimum number of experts required in Delphi technique
has been reported as 12 persons (Kaufmann and Gupta, 1988). Each expert
may give his/her best estimate on the amount of input factor based on his/her
experience as a triangular fuzzy number. For this purpose, the experts are
asked to provide three estimates of a specific value by determining the
minimum, the most plausible, and the maximum estimate. The estimates are
presented in the form of triangular fuzzy numbers:
(5.1)
Step 2: The estimates are averaged. For each expert, the deviation
from the average is calculated as shown below:
(5.2)
(5.3)
where F_ave = fuzzy average; and (a_ave b_ave c_ave ) = first, second and
third elements of the fuzzy number, respectively.

177
Step 3: The deviations in the estimates are sent back to the experts
for revision. Each expert provides a new triangular fuzzy number. Steps 1�3
are repeated until two successive averages become reasonably close based on
the decision maker�s stopping criterion as described in step 4 (Shaheen et al
2007).
Step 4: This is step for defuzzification. It transforms the resulting
fuzzy values from expert�s judgement induced into crisp value. The centre of
area method (Z*) as function shown in (5.4) is utilized for defuzzification
(Zimmermann 2001)
(5.4)
5.3.5 Application of Analytic Hierarchy Process Approach and
Numerical Illustration
Defuzzified value obtained from step 4 is applied for pairwise
comparison in the AHP approach. In pairwise comparison for technology, we
consider how the first technologies being compared can contribute to the
objective over the second technology. Nine point scale used in this study is
shown in Table 5.19.

178
Table 5.19 Nine point scale rating
Scale Explanation
1 Both treatment methods contribute equally to the objective
3 Moderate importance, slightly favor one treatment over the other
5 Strong importance, strongly favor one over the other
7 Very strong importance, strongly favor one over the other
9 Extremely importance, the first treatment is extremely relevant to contribute to object than the other
5.3.6 Risk Assessment
For the indentified risk, elementary risk, risk factor, elementary risk
factor shown in Table 5.3, value of severity and possibility quantified through
discussion with experts involved in the bamboo shoot supply chain as shown
in Table 5.20.
Table 5.20 Risk Assessment
Elementary Risk Severity Possibility Risk Value
Chemical Hazard Risk 6 0.70 4.20
Biological Hazard Risk 4 0.40 1.60
Product Appearance Risk 1 0.90 0.90
Over cost risk 3 0.40 1.20
179
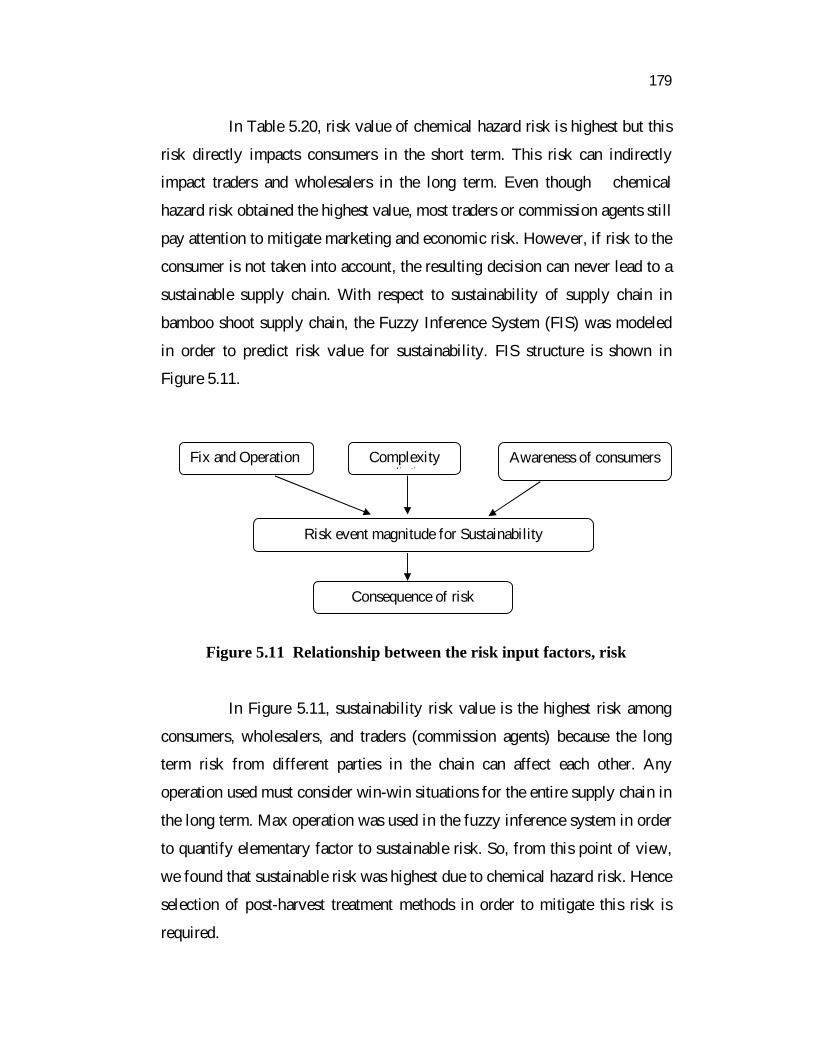
In Table 5.20, risk value of chemical hazard risk is highest but this
risk directly impacts consumers in the short term. This risk can indirectly
impact traders and wholesalers in the long term. Even though chemical
hazard risk obtained the highest value, most traders or commission agents still
pay attention to mitigate marketing and economic risk. However, if risk to the
consumer is not taken into account, the resulting decision can never lead to a
sustainable supply chain. With respect to sustainability of supply chain in
bamboo shoot supply chain, the Fuzzy Inference System (FIS) was modeled
in order to predict risk value for sustainability. FIS structure is shown in
Figure 5.11.
Figure 5.11 Relationship between the risk input factors, risk
In Figure 5.11, sustainability risk value is the highest risk among
consumers, wholesalers, and traders (commission agents) because the long
term risk from different parties in the chain can affect each other. Any
operation used must consider win-win situations for the entire supply chain in
the long term. Max operation was used in the fuzzy inference system in order
to quantify elementary factor to sustainable risk. So, from this point of view,
we found that sustainable risk was highest due to chemical hazard risk. Hence
selection of post-harvest treatment methods in order to mitigate this risk is
required.
Risk event magnitude for Sustainability
Consequence of risk
Fix and Operation Complexity li ti
Awareness of consumers

180
5.3.7 The Selection of Post-Harvest Treatment
An algorithm is presented based on the proposed approach for the
selection of the post-harvest technology to be performed specific to the
bamboo shoot supply chain in The East of Thailand. It is assumed that the
availability of each post-harvest technology is constant. The algorithm is
presented in five steps:
Step 1:
The goal considered for achieving the success in the post-harvest
bamboo shoot chain is to find the most appropriate method with respect to
five criteria given in Table 5.21.
Step 2:
For the information gathered in step 1, the AHP is applied. AHP is
a decision-aid that can provide the decision maker (DM) with relevant
information to assist the DM in choosing the most plausible alternative. The
hierarchy scheme for the proposed AHP is shown in Figure 5.12.
Figure 5.12 The hierarchy scheme
WhitenessSafety Appearance
SO2 Blanching Vinegar Controlled
Shelf Life Price
The most appropriate post-harvest-technology

181
Step 3: Representatives from commission agents in Prachinburi,
wholesalers of the bamboo shoot business chains located at Simummuang
Rangsit and Taladthai Rangsit markets, faculty members and officials from
government agencies were considered the as experts to estimate the
importance of decision criteria. Worst cases, general cases, and best cases are
assumed to make experts estimated minimum important value (a), most
plausible important value (b), and maximum important value (c) for each
pairwise comparison from five criteria. The eigenvectors derived in this step
reflect the weights associated for each criterion. These details are presented
in Table 5.21.
Table 5.21 Decision criteria: pairwise comparison
Criteria Weight Priority
Food Safety 0.536 1
Whiteness 0.208 2
shelf life 0.163 3
Price 0.057 4
Peel Appearance 0.035 5
Step 4: The comparison of post-harvest technologies under each
criterion was carried out. However, in the case of technological comparison
we obtained crisp values. The eigenvectors derived from this step are
presented in Table 5.22 along with weights obtained for each criterion in
step 4.

182
Table 5.22 Post-harvest Treatment comparison with respect to each
criterion and overall ranking
CriteriaFoodSafety
WhitenessShelfLife
Price Peel Weight Priority
Priority 0.536 0.206 0.163 0.057 0.035
Using Sulfur 0.103 0.472 0.418 0.446 0.449 0.2617 2
Blanching 0.430 0.384 0.361 0.386 0.380 0.4037 1
Dipping in vinegar 0.159 0.089 0.082 0.105 0.069 0.1253 4
Controlled-temp. 0.308 0.056 0.140 0.063 0.102 0.2066 3
The responses received from commission agents, wholesalers and
experts from academia are checked for consistency. These details are
presented below.
In order to estimate relative weigh of criteria in pairwise
comparative matrix A, priority of criteria is compared by computing
eigenvalues and eigenvectors as
(5.5)
where w is eigenvector of matrix A; max is largest eigenvalue of matrix A.
Consistency of matrix is achieved by examining reliability of
judgement in pairwise comparison. Consistency Ratio (CR) and Consistency
Index (CI) are defined as
(5.6)

183
(5.7)
where n is number being comparing in the matrix, and RI is random
consistency index. RI depends on number of criteria being compared as
shown in Table 5.23.
Table 5.23 Random Consistency Index
Number of criteria (n) 3 4 5 6
Random Consistency
Index (RI) 0.58 0.90 1.12 1.24
As shown in Table 5.22, blanching treatment is the most significant
method with an overall priority of 0.4037.
As shown in Table 5.23, for the five criteria pairwise comparison,
RI is 1.12 and on another hand, from the four alternative technological
pairwise comparisons RI is 0.09. From equation (5.5), (5.6), (5.7) and RI
from table 5.23, we determined CR and is shown in Table 5.24.
Table 5.24 Consistency Ratio of pairwise comparison
Respect to n CI RI CR
5 Criteria Safety, Quality and Economics
5 5.32 0.64 1.12 0.058
4 treatments Safety 4 4.06 0.020 0.90 0.022
4 treatments Whiteness 4 4.25 0.086 0.90 0.095
4 treatments shelf life 4 4.21 0.069 0.90 0.077
4 treatments Price 4 4.21 0.071 0.90 0.079
4 treatments Peel Color 4 4.23 0.079 0.90 0.088

184
Since all CR is less than 0.1, so the pairwise comparison is found to
be consistent.
5.4 CONCLUSION
In the case study of the bamboo shoot supply chain in Thailand,
risk issues and risk factors were indentified through supply chain risk
assessment guideline reported by World Bank and Jaffee et al (2010). Experts
from academia, agribusiness business and government sectors were
interviewed. Data obtained from experts in the agribusiness sector was
ambiguous. Chemical hazard risk gives the highest risk value.
Fuzzy logic and system dynamics approach are applied to develop
an integrated supply chain management process to deal with the complex
dynamic behavior and uncertain nature of supply chain risks. It was illustrated
that the uncertain and imprecise nature of risks could be better approached by
integrating fuzzy logic into the proposed SD-based model. The applicability
and performance of the proposed method in the risk management process was
evaluated by bamboo shoot production and distribution in Thailand. The
impact of this risk on revenue was well quantified. The effectiveness of
alternative response scenarios may be employed to mitigate the negative
impacts of the risk. Farmers� income with respect to alternative risk
management policies for sustainable growth was analyzed using the proposed
fuzzy SD approach. Design of experiment was used for simulate the proposed
SD model.
The output from the SD model was applied through response
surface methodology to obtain the optimum condition that maximizes the
profit.

185
The study also investigates the key factors for selection of
post-harvest treatment by combining FDM and AHP. From four possible
post-harvest treatment alternatives, pairwise comparisons of five evaluative
criteria influencing post-harvest technology selection are analyzed through
expert�s opinions. FDM was used to quantify those fuzzy to crisp values
before evaluation through AHP. FDM and AHP were used to integrate
expert�s opinions to obtain the significance of various criteria. The results
from experts of different fields were compared and analyzed. Finally, it was
found that blanching method is the most recommended treatment method.
Integration of FDM and AHP was done for selecting future post-harvest
technology.
These proposed integrated approaches are useful for production and
distribution of horticultural products with uncertainly and imperfect
information.