Chapter 4 SILVER NANOPARTICLES AND THE YEAST...
48
Chapter 4 SILVER NANOPARTICLES AND THE YEAST CELL: INHIBITORY CONCENTRATIONS, EFFECT ON GROWTH, CELLULAR LOCALIZATION, PERMEABILITY AND METABOLIC ACTIVITIES 4.1 Introduction The procedure for the synthesis of nanoparticles in growth media was standardized and the nanoparticles were characterized by UV-Vis, XRD and TEM analysis. These aspects are described in the previous chapter. Following the successful synthesis protocol, the next phase of experiments was designed to evaluate the effect of nanoparticles on the test organism. The current chapter describes the experimental findings on the effect of silver nanoparticles (Ag NPs) on growth, morphology and some physical and biochemical parameters of Saccharomyces cerevisiae. A discussion on the experimental findings concludes the chapter. In assessing the toxicity of an agent the first step, inevitably, is to determine the minimum dosage limits of treatment. There are reports available on a variety of protocols for determination of minimum inhibitory and killing concentrations of nanoparticles including agar disk diffusion (Kim et al., 2007), conductimetric assay (Sawai, 2003) and culture turbidity and plate count assays. We have followed the NCCLS recommended protocol as described by Taso et al. (2002). The yeast growth phases were studied by the turbidity method while the cell cycle was analyzed in a flow cytometer. Williams et al. (2004), in a pioneering work, had evaluated the growth responses of microbes to inorganic nanoparticles and described the importance of such studies. The analysis of yeast cell cycle under silver nanoparticle stress described in the present study is, to the best of our knowledge, a novel approach and complements the findings in mammalian cell lines described by others. Cell morphology as also the localization of nanoparticles was studied by SEM and High-resolution TEM analysis of nanoparticle stressed cells. Electron
Transcript of Chapter 4 SILVER NANOPARTICLES AND THE YEAST...

Chapter 4
SILVER NANOPARTICLES AND THE YEAST CELL:
INHIBITORY CONCENTRATIONS, EFFECT ON GROWTH,
CELLULAR LOCALIZATION, PERMEABILITY AND
METABOLIC ACTIVITIES
4.1 Introduction
The procedure for the synthesis of nanoparticles in growth media was
standardized and the nanoparticles were characterized by UV-Vis, XRD and
TEM analysis. These aspects are described in the previous chapter. Following the
successful synthesis protocol, the next phase of experiments was designed to
evaluate the effect of nanoparticles on the test organism. The current chapter
describes the experimental findings on the effect of silver nanoparticles (Ag NPs)
on growth, morphology and some physical and biochemical parameters of
Saccharomyces cerevisiae. A discussion on the experimental findings concludes
the chapter.
In assessing the toxicity of an agent the first step, inevitably, is to determine the
minimum dosage limits of treatment. There are reports available on a variety of
protocols for determination of minimum inhibitory and killing concentrations of
nanoparticles including agar disk diffusion (Kim et al., 2007), conductimetric
assay (Sawai, 2003) and culture turbidity and plate count assays. We have
followed the NCCLS recommended protocol as described by Taso et al. (2002).
The yeast growth phases were studied by the turbidity method while the cell
cycle was analyzed in a flow cytometer. Williams et al. (2004), in a pioneering
work, had evaluated the growth responses of microbes to inorganic nanoparticles
and described the importance of such studies. The analysis of yeast cell cycle
under silver nanoparticle stress described in the present study is, to the best of our
knowledge, a novel approach and complements the findings in mammalian cell
lines described by others.
Cell morphology as also the localization of nanoparticles was studied by SEM
and High-resolution TEM analysis of nanoparticle stressed cells. Electron

Silver nanoparticles and the yeast cell 77
micrographs representing the ultra-structure of cells are a potent method for
understanding the effect of nanoparticles and have been widely described in
literature. In one of the most cite works, Sondi and Salopek-Sondi (2004) has
reported the formation of “pits” in the cell wall of bacteria, while the silver
nanoparticles were found to accumulate in the bacterial membrane. In the present
study we have included a cell permeability assay to confirm the observations
from electron micrographs pertaining to membrane/cell wall damage.
The concentration of key cellular metabolites viz. RNA, amino acids and protein
as also the stress protectant – trehalose was evaluated in nanoparticle stressed
cells. While there are no specific literatures pertaining to the impact of
nanoparticles on the metabolic activities of microorganisms; it is well
documented that yeast cells may change their level of metabolic activity, such as
their carbon metabolism and nitrogen metabolism, as well as their stress response
to environmental conditions (Higgins et al., 2001).
4.2 Materials and Methods
A list of all buffers and reagents used in the following protocols are described in
Appendix I.
4.2.1 Saccharomyces cerevisiae strain and growth conditions
The yeast, Saccharomyces cerevisiae, used throughout this study was procured
from the Microbial Type Culture Collection & Gene Bank, Institute of Microbial
Technology, Chandigarh, India as an active culture on slant.
The strain MTCC 36 (equivalent to NRRLY–11857, ATCC26602, and
NCYC975) was originally isolated from sugar refinery.
Cells were grown on yeast malt (YM) (HiMedia Labs) agar slants at 30ºC with
an incubation time of 48 h. Cultures were then transferred and maintained at
refrigerated temperature and routinely sub-cultured at 30 days intervals.
Silver nanoparticles and the yeast cell 78
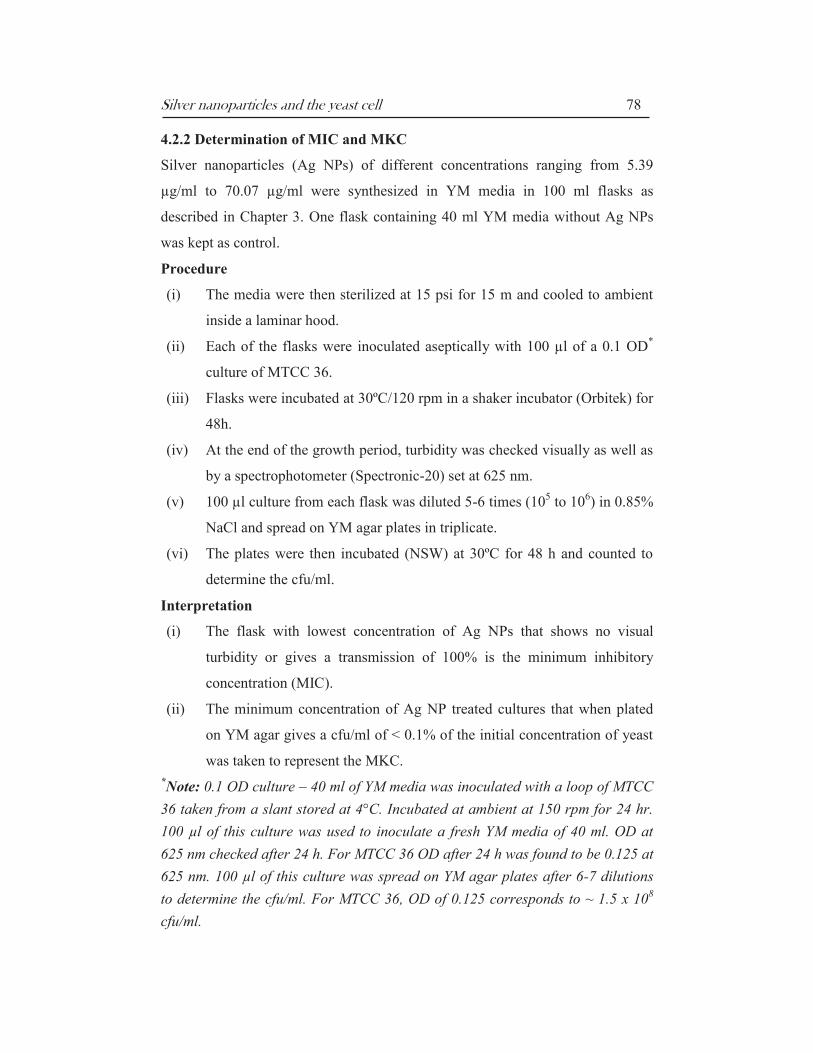
4.2.2 Determination of MIC and MKC
Silver nanoparticles (Ag NPs) of different concentrations ranging from 5.39
µg/ml to 70.07 µg/ml were synthesized in YM media in 100 ml flasks as
described in Chapter 3. One flask containing 40 ml YM media without Ag NPs
was kept as control.
Procedure
(i) The media were then sterilized at 15 psi for 15 m and cooled to ambient
inside a laminar hood.
(ii) Each of the flasks were inoculated aseptically with 100 µl of a 0.1 OD*
culture of MTCC 36.
(iii) Flasks were incubated at 30ºC/120 rpm in a shaker incubator (Orbitek) for
48h.
(iv) At the end of the growth period, turbidity was checked visually as well as
by a spectrophotometer (Spectronic-20) set at 625 nm.
(v) 100 µl culture from each flask was diluted 5-6 times (105 to 10
6) in 0.85%
NaCl and spread on YM agar plates in triplicate.
(vi) The plates were then incubated (NSW) at 30ºC for 48 h and counted to
determine the cfu/ml.
Interpretation
(i) The flask with lowest concentration of Ag NPs that shows no visual
turbidity or gives a transmission of 100% is the minimum inhibitory
concentration (MIC).
(ii) The minimum concentration of Ag NP treated cultures that when plated
on YM agar gives a cfu/ml of < 0.1% of the initial concentration of yeast
was taken to represent the MKC.
*Note: 0.1 OD culture – 40 ml of YM media was inoculated with a loop of MTCC
36 taken from a slant stored at 4°C. Incubated at ambient at 150 rpm for 24 hr.
100 µl of this culture was used to inoculate a fresh YM media of 40 ml. OD at
625 nm checked after 24 h. For MTCC 36 OD after 24 h was found to be 0.125 at
625 nm. 100 µl of this culture was spread on YM agar plates after 6-7 dilutions
to determine the cfu/ml. For MTCC 36, OD of 0.125 corresponds to ~ 1.5 x 10⁸
cfu/ml.

Silver nanoparticles and the yeast cell 79
4.2.3 Growth Studies
Silver nanoparticles (Ag NPs) of concentrations 26.95, 48.51 and 70.07 µg/ml
were synthesized in YM media in 100 ml flasks as described in Chapter 3. One
flask containing 40 ml YM media without Ag NPs was kept as a control.
Procedure
(i) Growth was initiated in each flask with 106 cells and flasks were then
incubated in a shaker incubator set at 30ºC/120 rpm.
(ii) Aliquots of 200 µl were collected aseptically at intervals of 0, 6.42, 9.33,
12.25, 26.25, 30, 33.08 and 36.25 h from each of the flasks and stored at
4ºC after adding sodium azide (NaN3) to a final concentration of 10 mM.
(iii) OD of all aliquots were recorded together in a microplate reader (iMark,
Bio-Rad) at 595 nm after an initial mixing for 10 s.
(iv) Data were analyzed with GraphPad Prism®
Version 5.03.
4.2.4 Cell Cycle Analysis
Nanoparticles of concentration 5.39, 26.95, 48.51 and 70.07 µg/ml were
synthesized in YM media as described in Chapter 3. One flask containing 40 ml
YM media without Ag NPs was kept as control. 100 µl of a log phase culture (as
described in Section 4.2.7) was used to inoculate the flasks. The flasks were then
incubated overnight at 30ºC/120 rpm. These cultures were used for the study of
cell cycle by flow cytometry.
Reagents
§ Cold absolute ethanol
§ 0.5 M sodium citrate stock (filtered), 50 mM diluted stock
§ 10 mg/ml RNase A
§ 10 mg/ml propidium iodide (filtered)

Silver nanoparticles and the yeast cell 80
Procedure
(i) Cell number in the cultures was determined with a haemocytometer and
107 cells were pelleted by spinning down cultures at 2000 rpm at 4ºC for
5 min.
(ii) 1.0 ml of cold 70% ethanol (Amresco) was added under constant vortex.
Cells thus fixed were stored at 4ºC till further process.
(iii) 0.3 ml of EtOH fixed cells (~ 2-3 x 10⁶ cells) were taken in a 5 ml falcon
tube and 3 ml of 50 mM Na (Hi-Media) citrate was added.
(iv) Cells were mixed by pipetting, centrifuged at 2000 rpm for 5 min and the
supernatant discarded.
(v) Pellets were then re-suspended in 0.5 ml of 50 mM Na citrate containing
0.1 mg/ml RNase A (Sigma-Aldrich) and the tubes were left at 37ºC for
2 h for RNA digestion.
(vi) For staining, 0.5 ml 50 mM Na citrate containing 50 µg/ml propidium
iodide (Sigma-Aldrich) was added so that the final concentration in the
samples was 25 µg/ml.
(vii) Stained cells were processed immediately in a FACSCalibur (BD
Biosciences) flow cytometer and data analyzed with BD CellQuest Pro
software.
Flow cytometer settings
Parameter Detector Voltage Amp Gain
P1 FSC E00 5.57
P2 SSC 427 1.00
P3 FL1 600 1.00
P4 FL2 580 2.00
P5 FL3 650 1.00
P6 FL2-A 2.00
P7 FL2-W 1.00

Silver nanoparticles and the yeast cell 81
4.2.5 Cell Viability and Cell Volume
The percentage of viable cells in yeast populations grown under Ag NP stress
was determined by the methylene blue staining method. Nanoparticles of
concentration 26.95, 48.51 and 70.07 µg/ml were synthesized in YM media in
100 ml flasks as described in Chapter 3. Flasks were sterilized, inoculated with
MTCC 36 cells and then incubated for 48 h at 30ºC/120 rpm. At the end of the
growth period, aliquots were taken out for microscopic examination.
Preparation of methylene blue solution
0.01 g of methylene blue (Blue Star) was dissolved in 10 ml distilled water. Then,
2 g sodium citrate dihydrate (HiMedia) was added and dissolved under constant
stirring. The solution was filtered through Whatman No.1 and volume was made
upto 100 ml with distilled water.
Procedure
(i) Cell viability
Equal volumes of the yeast cultures and methylene blue solution were mixed on a
haemocytometer using a wire loop. The cells were examined for staining using 40
x objective in a bright field microscope (Olympus BX51).
Approximately 350 cells were examined in each culture and the percentage of
unstained cells was recorded. This figure was taken to represent the percentage
viability of the cultures.
(ii) Cell volume
For cell volume measurements, the length and width of approximately 100 cells
was measured using a micrometer. Volume was calculated according to the
equation of an ellipse
where, a = length/2; b = width/2

Silver nanoparticles and the yeast cell 82
4.2.6 Electron Microscopy of Yeast Cells
Nanoparticles of concentration 26.95, 48.51 and 70.07 µg/ml were synthesized in
YM media in 100 ml flasks as described in Chapter 3. One flask without
nanoparticles was kept as a control. Flasks were sterilized, inoculated with
MTCC 36 cells and then incubated for 24 h at 30ºC/120 rpm. At the end of the
growth period aliquots of 1 ml cultures were collected in 1.5 ml tubes for TEM
and SEM analysis.
4.2.6.1 Analysis by Transmission Electron Microscope (TEM)
Cultures were centrifuged at 3500 rpm for 5 min at 4ºC and supernatant was
discarded. The following standard protocol was then followed for sample
processing:
Fixation
(i) Primary fixation was done in Karnovsky’s fixative for 1 h at 4ºC.
(ii) Tubes were centrifuged and fixative was decanted. Pellets were then
washed thrice with 0.1 M sodium cacodylate buffer for 15 min at 4ºC.
(iii) Post-fixation was done in 1% osmium tetroxide in 0.1 M sodium
cacodylate buffer at 4ºC for 1 h.
(iv) Pellets were again washed thrice with 0.1 M sodium cacodylate buffer
for 15 min at 4ºC.
Dehydration
(v) Dehydration was carried out successively in 30, 50, 70, 80, 90, 95 and
100% acetone at 4ºC. At each concentration the pellets were kept for 15
min with two changes. A final dehydration step was done in 100%
acetone for 30 min at room temperature.
Clearing
(vi) Clearing was carried out twice using propylene oxide at room
temperature for 15 min.

Silver nanoparticles and the yeast cell 83
Infiltration
(vii) Infiltration of samples was done according to the scheme below:
Propylene oxide : Embedding medium – 3:1 (overnight)
Propylene oxide : Embedding medium – 1:1 (1 h)
Propylene oxide : Embedding medium – 1:3 (1 h in vaccum)
Pure embedding medium – 1 h at 50ºC
Embedding
(viii) Infiltrated samples were transferred into BEEM capsules and oriented.
Pure embedding medium was then poured into the capsules and
incubated overnight in oven at 50ºC.
Polymerization
(ix) Oven temperature was then raised to 60ºC and kept for 24 h for
polymerization.
Sectioning and Staining
(x) The samples were cut into 60-90 nm sections with an ultramicrotome,
placed on copper grid (200 mesh) and then stained by double staining
method with uranyl acetate and lead citrate.
Imaging
(xi) Viewing of samples and capture of electron micrographs was done in a
JEM-2100 (JEOL, Japan) high resolution transmission electron
microscope (HRTEM) operating at a maximum of 200 kV.
4.2.6.2 Analysis by Scanning Electron Microscope (SEM)
Cultures were centrifuged at 3500 rpm for 5 min at 4ºC and supernatant was
discarded. The following standard protocol was then followed for sample
processing:

Silver nanoparticles and the yeast cell 84
(i) Primary fixation was done in 2.5% glutaraldehyde for 1 h at 4ºC.
(ii) Tubes were centrifuged and fixative was decanted. Pellets were then
washed thrice with 1X PBS pH 7.2 for 15 min at 4ºC.
(iii) Dehydration was carried out successively in 30, 50, 70, 80, 90, 95 and
100% acetone at 4ºC. At each concentration the pellets were kept for 15
min with two changes.
(iv) Dehydrated samples were spread on a cover slip and dried at 30ºC for
1 h.
(v) The samples were then mounted on brass stubs with double-sided tape
(vii) Finally samples were sputter coated with gold particles to a thickness of
~ 35 nm and stubs loaded into the instrument for viewing.
(viii) Viewing of samples and capture of electron micrographs was done in
JSM-6360 scanning electron microscope operating at 20 kV.
4.2.7 Cell Permeability Assay
Nanoparticles of concentration 5.39, 16.17, 26.95, 37.73, 48.51 and 70.07 µg/ml
were synthesized in de-ionized water in 100 ml flasks as described in Chapter 3.
A loopful of yeast cells from slants were inoculated into 50 ml YM media and
grown overnight at 30ºC/120 rpm. 100 µl of this culture was then inoculated into
100 ml YM media and grown at 30ºC/120 rpm to log phase (24 h). Cells for the
assay were harvested from this culture by spinning down at 3000 rpm for 10 min
in centrifuge (Remi).
Procedure
Cell membrane damage was studied by adopting the procedure described by
Yphantis et al. (1967).

Silver nanoparticles and the yeast cell 85
(i) 2.0 mg cells/ml (wet weight) was mixed in 5 ml Ag NP solutions taken
in falcon tubes. Tubes were incubated in a water bath (GeNei) at 30ºC
for 1 h.
(ii) At the end of the treatment period, cells were spinned down at 3000 rpm
for 10 min and the supernatant was collected.
(iii) Absorbance of the supernatant fluid was recorded at 260/280 nm in a
spectrophotometer (Chemito UV Scan 2600) to account for the UV-
absorbing compounds released from the cells due to Ag NP treatment.
Notes: The data was adjusted to account for the spontaneous release of UV-
absorbing compounds by cells in de-ionized water. Total extractable compounds
was estimated by incubating 2.0 mg cells/ml in 1.0 N HClO4 (perchloric acid) at
100ºC for 1 h.
4.2.8 Metabolite Concentrations
Nanoparticles of concentration 5.39, 16.17, 26.95, 37.73, 48.51 and 70.07 µg/ml
were synthesized in YM media as described in Chapter 3. One flask containing
40 ml YM media without Ag NPs was kept as control. 100 µl of a log phase
culture (as described in Section 4.2.7) was used to inoculate the flasks. The flasks
were then incubated overnight at 30ºC/120 rpm. These cultures were used for the
determination of cellular metabolites viz. – RNA, protein, amino acid and
trehalose
4.2.8.1 Cellular RNA
The total cellular RNA content was determined according to the method
described by Benthin et al. (1991).

Silver nanoparticles and the yeast cell 86
Procedure
(i) 1 ml culture was collected from the flasks and OD was adjusted to 0.1
with sterile nuclease free water (Amresco).
(ii) Cells were spinned down at 5000 rpm at 4ºC for 10 m. Supernatant was
aspirated and the pellet was frozen in liquid N2 and stored at -20ºC till
analysis.
(iii) Thawed samples were washed thrice with 600 µl of cold 0.7 M HClO4
and re-suspended in 300 µl of 0.3 M KOH.
(iv) The tubes were incubated at 37ºC for 90 min to hydrolyze RNA.
(v) Samples were then cooled in an ice bath and 100 µl of 3 M HClO4 was
added and volume adjusted to 1 ml with 0.5 M HClO4.
(vi) Supernatant was collected by spinning the samples at 10000 rpm for 10
min at 4 ºC.
(vii) RNA was quantified by measuring the absorbance at 260 nm according
to the Schmidt-Tannhauser method:
where,
A = absorbance at 260 nm
ε = Molar extinction co-efficient = 10800 M-1
cm-1
l = path length
Molecular weight of average nucleotide = 340 g mol-1
4.2.8.2 Total Cellular Protein
Estimation of cellular protein content was done using a GeNei™
Protein
Estimation kit by Lowry’s Method.
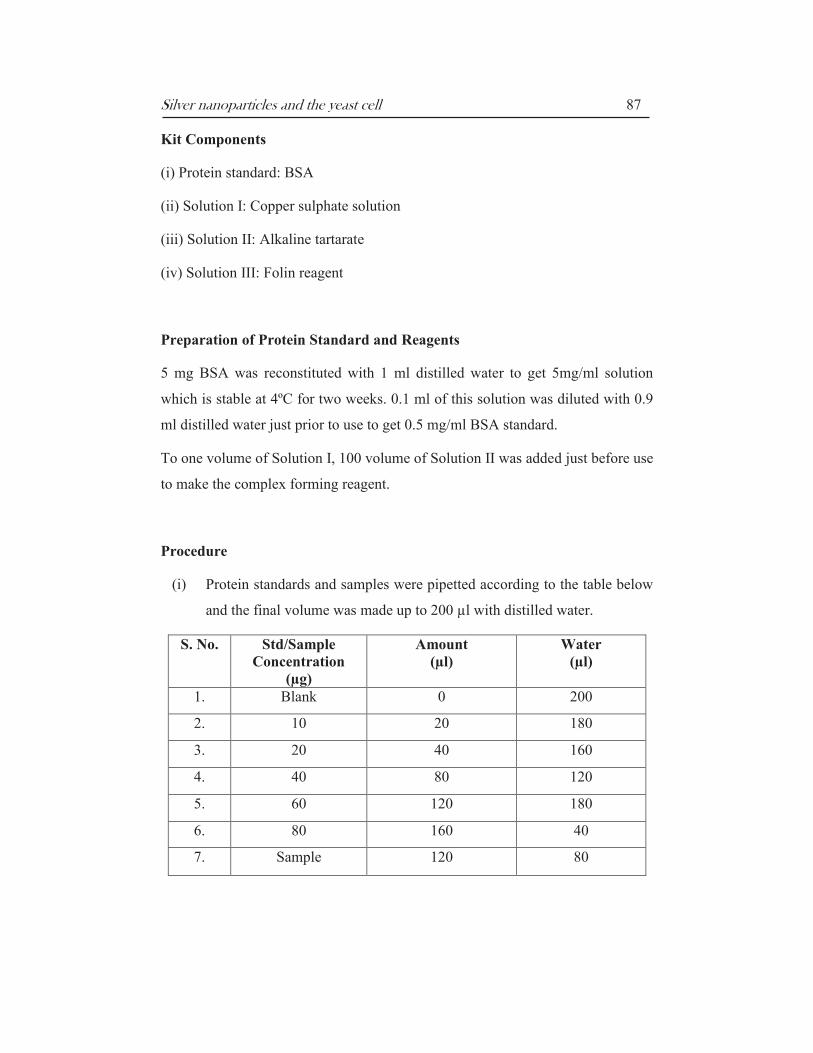
Silver nanoparticles and the yeast cell 87
Kit Components
(i) Protein standard: BSA
(ii) Solution I: Copper sulphate solution
(iii) Solution II: Alkaline tartarate
(iv) Solution III: Folin reagent
Preparation of Protein Standard and Reagents
5 mg BSA was reconstituted with 1 ml distilled water to get 5mg/ml solution
which is stable at 4ºC for two weeks. 0.1 ml of this solution was diluted with 0.9
ml distilled water just prior to use to get 0.5 mg/ml BSA standard.
To one volume of Solution I, 100 volume of Solution II was added just before use
to make the complex forming reagent.
Procedure
(i) Protein standards and samples were pipetted according to the table below
and the final volume was made up to 200 µl with distilled water.
S. No. Std/Sample
Concentration
(µg)
Amount
(µl)
Water
(µl)
1. Blank 0 200
2. 10 20 180
3. 20 40 160
4. 40 80 120
5. 60 120 180
6. 80 160 40
7. Sample 120 80
Silver nanoparticles and the yeast cell 88
(ii) 2 ml of the complex forming reagent was added and the solutions kept at
ambient for 10 min.
(iii) 200 µl of Solution III was added under constant vortex and the solutions
incubated at ambient for 30 min.
(iv) The OD of the solutions was then recorded at 660 nm with a
spectrophotometer (Chemito UV Scan 2600).
(v) A calibration curve was constructed by plotting the OD readings against
protein standards and the sample concentrations were interpolated.
4.2.8.3 Total Free Amino Acid
Measurement of free amino acids was done according to the procedure described
by Holmes et al. (1991) with slight modifications.
Procedure
Sample Preparation
(i) 10 ml cultures were spinned down at 3000 rpm for 10 min to collect the
pellets.
(ii) Pellets were re-suspended in 1 ml of 600 mM cold HClO4 and vortexed
for 2 min.
(iii) The tubes were then centrifuged at 3000 rpm for 5 min.
(iv) The supernatant was collected and neutralized by adding 200 µl of 2 M
K2CO3.
(v) Crystals were removed by spinning at 10000 rpm for 5 min and the
samples were then frozen in liquid N2 and stored at -20ºC till analysis.
(vi) Thawed samples were analyzed by staining with ninhydrin using glycine
as the standard.
Silver nanoparticles and the yeast cell 89
Standards
50 mg glycine was dissolved in 50 ml distilled water and 10 ml of this stock
solution was diluted to 100 ml in a volumetric flask to get the working standard
solution. A series of volume from 0.1 to 1 ml of this standard solution gives a
concentration range of 10 µg to 100 µg.
Ninhydrin Assay
(i) To 100 µl of the sample/standards 1 ml of ninhydrin solution was added
and the volume was made up to 2 ml with distilled water.
(ii) The tubes were then heated in a boiling water bath for 20 min.
(iii) 5 ml of the diluents (water:n-propanol) was added and contents were
mixed by pipetting.
(iv) After 15 min, the intensity of the solutions was read in a
spectrophotometer at 570 nm. The reagent blank was prepared as above
by taking 100 µl of 80% ethanol instead of the sample.
(v) A calibration curve was constructed by plotting the OD readings against
glycine standards and the sample concentrations were interpolated.
4.2.8.4 Trehalose
Intracellular and released trehalose from nanoparticle stressed cells was
determined according to Parrou and Francois (1997) with slight modifications.
Yeast cultures, as described in Section 4.2.8, grown at nanoparticle concentration
of 26.95, 48.51 and 70.07 µg/ml were used for the measurements.
(i) 1 ml cultures (1.2 x 10⁷ cells) were spinned down at 12000 rpm for 20
min.
(ii) Supernatant (released trehalose) was transferred to a new microfuge tube
while pellets (intracellular trehalose) were re-suspended in 1 ml ice-cold
water.

Silver nanoparticles and the yeast cell 90
(iii) Pellets were then centrifuged at 12000 rpm for 15 s, liquid drained out
completely and stored at – 20 ºC till analysis.
(iv) To the supernatant of step (ii) 0.05 U/ml of trehalase (Sigma-Aldrich)
was added and the tubes were incubated at 37 ºC for 1 h.
(v) 500 µl of the reaction suspension was then added to 500 µl of 16% DNS
reagent.
(vi) The mixture was boiled in a water bath for 5 min and then cooled before
recording the colour intensity in a spectrophotometer (Chemito UVScan)
at 525 nm.
(vii) The pellets from step (iii) were dried and weighed and then 0.25 ml of
0.25M Na2CO3 was added and tubes were incubated in a water bath set at
95-98 °C for 4 h.
(viii) Then 0.15 ml of 1 M acetic acid and 0.6 ml of 0.2 M sodium acetate
were added to each sample.
(ix) Samples were then incubated overnight with 0.05 U/ml of trehalase at
37ºC.
(x) At the end of incubation, samples were centrifuged at 12000 rpm for 3
min.
(xi) Reaction suspensions were separated and steps (v) – (vi) were followed.
(xii) Trehalose content were determined from interpolating the absorbance
values obtained in step (vi) and (xi) in a standard graph. The standard
curve was prepared from the absorbance reading obtained from the
reaction of a series of glucose (0 to 50 µg) with 16% DNS reagent.

Silver nanoparticles and the yeast cell 91
4.3 Experimental Findings
4.3.1 Minimum Inhibitory and Killing Concentrations
The procedure followed to determine the minimum inhibitory concentration
(MIC) and minimum killing concentration (MKC) of Ag NPs against yeast was
based on culture turbidity and plate count.The experimental findings are
presented below:
Figure 4.1 Growth of cells in different concentrations of nanoparticles. (a) YM
media (w/o Ag NPs) and YM media with 5.39, 26.95, 43.12, 48.51, 53.90 µg/ml
Ag NPs (left – right) and (b) YM media (w/o Ag NPs) and YM media with 59.29,
64.68 and 70.07 µg/ml Ag NPs (left – right).

Silver nanoparticles and the yeast cell 92
Turbidity of the cultures was clearly visible in the tubes containing up to 43.12
µg/ml nanoparticle concentration (Figure 4.1). This observation was confirmed
by recording the percent (%) transmission at 625 nm of each culture (Table 4.1).
For cultures with higher nanoparticle concentrations the % transmission
decreased progressively indicating that the growth of cells was inhibited.
Table 4.1: Evaluation of turbid cultures by spectrophotometer.
Concentration Turbidity % Transmission
Yeast Malt Media + 49.5
5.39 µg/ml + 34.5
26.95 µg/ml + 88.0
43.12 µg/ml + 95.2
48.51 µg/ml - 100.0
The lowest concentration of Ag NPs at which no visible turbidity was observed
and which recorded a transmission of 100% was the MIC value. We found that
48.51 µg/ml was the minimum inhibitory concentration of silver nanoparticles for
S. cerevisiae.
Each of the non-turbid cultures (of concentrations 48.45 µg/ml and higher) was
then plated onto YM agar and the number of colonies were counted (Figure 4.2
and Table 4.2).

Silver nanoparticles and the yeast cell 93
Figure 4.2 Growth of cells from non-turbid cultures of different Ag NP
concentrations after re-inoculation in YM agar. Figures represent cultures from
(a) 48.51 9, (b) 53.90, (c) 59.29, (d) 64.68 and (e) 70.07 µg/ml Ag NPs
respectively. A progressive decrease in the number of CFUs/ml at increasing
nanoparticle concentrations is evident.
Table 4.2: Colony forming units per ml in non-turbid cultures.
CONCENTRATION CFU/ML % DECREASE#
48.51 µg/ml 2.1 x10⁷ 86.00%
53.90 µg/ml 1.6 x 10⁷ 89.33%
59.29 µg/ml 3.1 x 10⁶ 97.93%
64.68 µg/ml 2.3 x 10⁶ 98.46%
70.07 µg/ml 1.0 x 10⁵ 99.93%
# initial CFU/ml was 1.5 x 10
8

Silver nanoparticles and the yeast cell 94
It was observed that growth of cells in presence of 70.07 µg/ml of nanoparticles
led to decrease of > 99% of the initial cell concentration. According to the criteria
that the MKC is minimum concentration of Ag NPs where CFU/ml (Colony
Forming Unit/ml) was < 0.1% of the initial concentration, we concluded that
70.07 µg/ml was the minimum killing concentration (MKC) of Ag NPs for S.
cerevisiae.
4.3.1.1 Comparison of antimicrobial effect of Ag NPs and Silver ions
To compare the antimicrobial activity of silver nanoparticles and silver ions, the
susceptibility constants or Z values of silver materials were calculated according
to the following equation:
Where, N is the number of CFUs after exposure to silver material; N0 is the
number of CFUs in the absence of silver materials and C is the concentration of
silver material (ppm or µg/ml).
Using the Z value, a given C value, and the exposure time, the survival fraction
can be predicted. A higher Z value implies that the microbes are more sensitive to
the material, indicating that the materials are more toxic to the microbes (Lee et
al, 2009).
In the present study, the yeast cells were exposed to equivalent concentrations of
Ag NPs and silver ions (Ag NO3) prepared in the growth media (YM media) for a
period of 48 h. At the end of the incubation period, cells were plated onto YM
agar after appropriate dilutions in normal saline and the CFUs were counted.
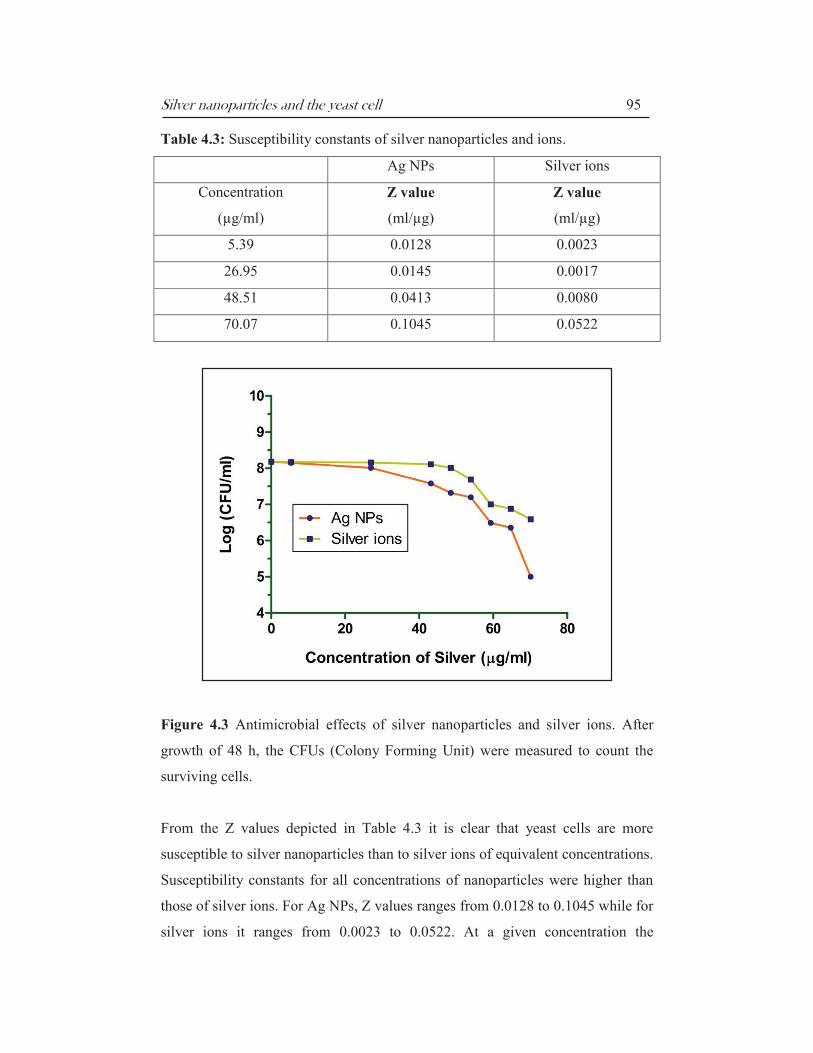
The experimental findings are presented below in Table 4.3 and Figure 4.3.
Silver nanoparticles and the yeast cell 95
Table 4.3: Susceptibility constants of silver nanoparticles and ions.
Ag NPs Silver ions
Concentration
(µg/ml)
Z value
(ml/µg)
Z value
(ml/µg)
5.39 0.0128 0.0023
26.95 0.0145 0.0017
48.51 0.0413 0.0080
70.07 0.1045 0.0522
Figure 4.3 Antimicrobial effects of silver nanoparticles and silver ions. After
growth of 48 h, the CFUs (Colony Forming Unit) were measured to count the
surviving cells.
From the Z values depicted in Table 4.3 it is clear that yeast cells are more
susceptible to silver nanoparticles than to silver ions of equivalent concentrations.
Susceptibility constants for all concentrations of nanoparticles were higher than
those of silver ions. For Ag NPs, Z values ranges from 0.0128 to 0.1045 while for
silver ions it ranges from 0.0023 to 0.0522. At a given concentration the

Silver nanoparticles and the yeast cell 96
susceptibility constants were higher for Ag NPs than those of silver ions. The
corresponding values obtained at the MIC (48.51 µg/ml) and MKC (70.07 µg/ml)
doses are significantly higher in case of nanoparticles being 0.0413 (Ag NPs)
against 0.0080 (ions) and 0.1045 (Ag NPs) against 0.0522 (ions) respectively.
This indicates that S. cerevisiae are more sensitive to silver nanoparticles.
The antimicrobial effects of nanoparticles and ions depicted in Figure 4.3
demonstrate that the effects of Ag NPs are more potent than those of silver ions
of an equivalent concentration. Starting with an initial number of 1.5 x 10⁸
CFUs/ml, the decrease in the number of CFUs/ml is significantly higher in case
of cells exposed to nanoparticles than those exposed to silver ions of the same
concentration. This is particularly evident at the MIC and MKC doses where
surviving population was 2.1 x 10⁷ (Ag NPs) against 1.0 x 10
8 (ions) and 1.0 x
105
(Ag NPs) against 3.4 x 10⁶ (ions) respectively. This comparison of the
antimicrobial efficacy of Ag NPs and silver ions was done to preclude the
possibility that the effect observed on yeast cells as a result of exposure to the
nanoparticle solutions might be influenced by any residual silver ions present
therein.
As has been discussed in the previous chapter, a large excess of the reducing
agent NaBH4 (up to 2 x 10² times) than that of the silver salt (Ag NO3) was used
during the preparation of nanoparticles. Under the synthesis conditions employed,
all of the silver salt is reduced and any proportion of silver ions left is negligible.
The effect on the yeast cells arising due to exposure to Ag NPs in YM media is
likely due to nanoparticles alone. As is evident from the comparison of
antimicrobial effects of silver nanoparticles and ions of equivalent
concentrations, the presence of any residual ions left-over from the synthesis
process would not influence the effect of Ag NPs on yeast cells.
In all subsequent experiments of this study, the effect of silver nanoparticles
alone was considered as it was evident that the test solutions was composed
almost entirely of nanoparticles and also, as discussed in the findings above, Ag
NPs have a more potent effect on yeast cells than that of silver ions of equivalent
concentrations.
Silver nanoparticles and the yeast cell 97
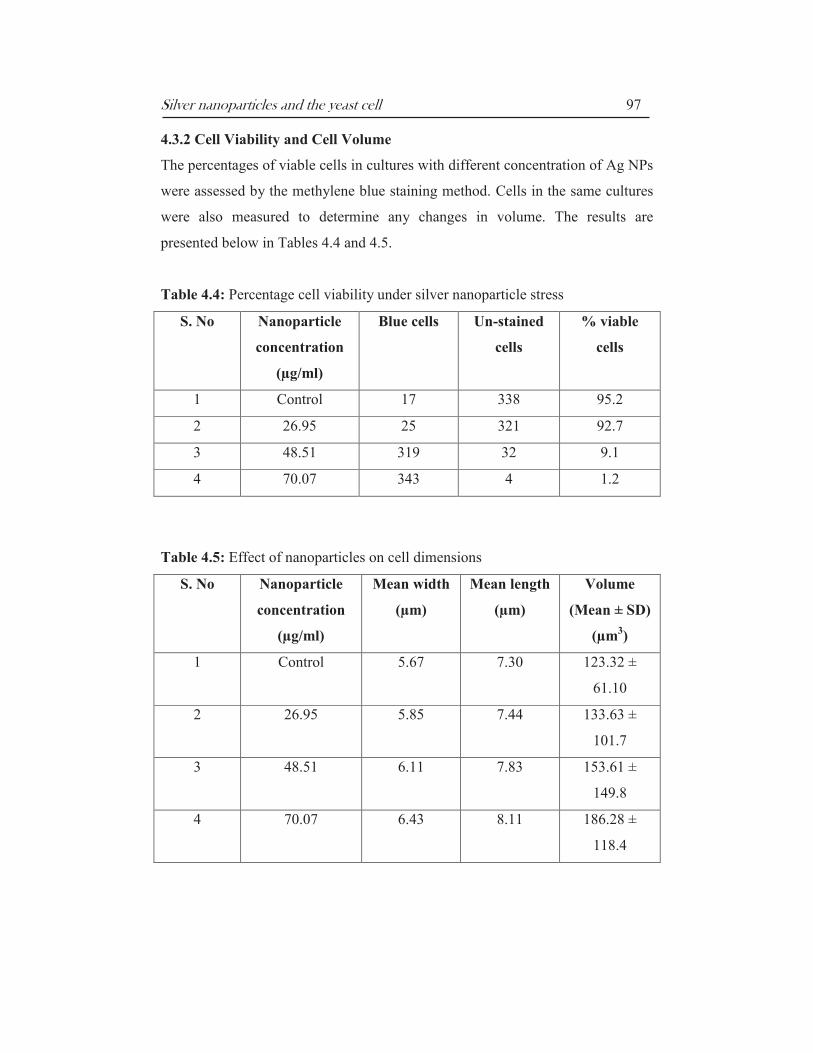
4.3.2 Cell Viability and Cell Volume
The percentages of viable cells in cultures with different concentration of Ag NPs
were assessed by the methylene blue staining method. Cells in the same cultures
were also measured to determine any changes in volume. The results are
presented below in Tables 4.4 and 4.5.
Table 4.4: Percentage cell viability under silver nanoparticle stress
S. No Nanoparticle
concentration
(µg/ml)
Blue cells Un-stained
cells
% viable
cells
1 Control 17 338 95.2
2 26.95 25 321 92.7
3 48.51 319 32 9.1
4 70.07 343 4 1.2
Table 4.5: Effect of nanoparticles on cell dimensions
S. No Nanoparticle
concentration
(µg/ml)
Mean width
(µm)
Mean length
(µm)
Volume
(Mean ± SD)
(µm3)
1 Control 5.67 7.30 123.32 ±
61.10
2 26.95 5.85 7.44 133.63 ±
101.7
3 48.51 6.11 7.83 153.61 ±
149.8
4 70.07 6.43 8.11 186.28 ±
118.4
Silver nanoparticles and the yeast cell 98
The methylene blue assay involves mixing the dye with a yeast sample, with live
cells either excluding or reducing the dye, such that only dead cells stain blue
(Sami et al, 1994). Methylene blue in a sample containing microorganisms gets
reduced to ‘leuko’ or colorless form of the dye at the cell surface via reductase
enzymes present in the cell membrane. The sample is then analysed by light
microscopy. The assay confirmed the earlier observation that yeast cultures lose
viability upon growth in presence of nanoparticles (Table 4.2). There was a
progressive decrease in the number of viable (colourless) cells at higher
concentrations of nanoparticles (Table 4.4). While >95% of cells were found to
be viable in the control culture the percentage of viable cells decreased to 92.7%
at 26.95 µg/ml, 9.1% at 48.51 µg/ml and 1.2% at 70.07 µg/ml Ag NP
concentration. Thus at the MKC less than 98% of the cells were found to be
viable.
The change in volume of yeast cells grown at different concentrations of
nanoparticles is depicted in Table 4.5. The cell volume was observed to increase
at higher nanoparticle concentrations. While the mean volume of cells grown in
pure YM media (control) was found to be 123.32 µm3, it increased to 133.63 µm
3
at 26.95 µg/ml, 153.61 µm3 at 48.51 µg/ml and 186.28 µm
3 at 70.07 µg/ml Ag
NP concentrations.
Table 4.6 t-Test of mean volumes in control and nanoparticle stressed cell
Nanoparticle
Concentration
SD N P value Significance*
26.95 µg/ml 101.7 100 0.3859 No
48.51 µg/ml 149.8 100 0.0626 No
70.07 µg/ml 118.4 100 0.0001 Yes
* Significance at 95% CI
To determine the statistical significance of volume changes due to nanoparticle
exposure, a t-Test was performed between control and stressed cells in the
GraphPad QuickCalcs online software (Table 4.5). It was found that the volume

Silver nanoparticles and the yeast cell 99
of cells grown at the sub-lethal concentration of 26.95 µg/ml was not
significantly different (P = 0.3859) from those of the control while the volume
changes of cells grown at MIC of 48.51 µg/ml was close, but not quite
significantly different (P = 0.0626). However, the change in volume of cells
grown at the MKC of 70.07 µg/ml was found to be extremely significant (P =
0.0001).
4.3.3 Growth Kinetics and Cell Cycle
Having determined the MIC and MKC values, we followed the growth curves of
cells under sub-lethal and lethal doses of Ag NPs; a control set of cells were
grown in plain YM media for the sake of comparison. The observations are
presented below.
Table 4.7 Data of growth curves: Mean OD at different time intervals
Time (h)
Nanoparticle Concentrations
Control 26.95 µg/ml 48.51 µg/ml 70.07 µg/ml
Mean (OD) ± SD Mean (OD)± SD Mean (OD)± SD Mean(OD)± SD
0.00 0.017 ± 0.020 0.120 ± 0.031 0.109 ± 0.026 0.004 ± 0.007
6.42 0.019 ± 0.020 0.125 ± 0.026 0.022 ± 0.023 0.012 ± 0.009
9.33 0.153 ± 0.035 0.132 ± 0.029 0.035 ± 0.036 0.011 ± 0.006
12.25 0.410 ± 0.041 0.323 ± 0.035 0.041 ± 0.033 0.014 ± 0.008
26.25 0.828 ± 0.052 0.627 ± 0.041 0.033 ± 0.040 0.004 ± 0.008
30.00 0.577 ± 0.047 0.493 ± 0.038 0.034 ± 0.043 0.001 ± 0.005
33.08 0.415 ± 0.031 0.517 ± 0.034 0.021 ± 0.029 0.001 ± 0.006
36.25 0.410 ± 0.027 0.506 ± 0.036 0.020 ± 0.037 0.003 ± 0.005
OD values are mean of three independent experiments.
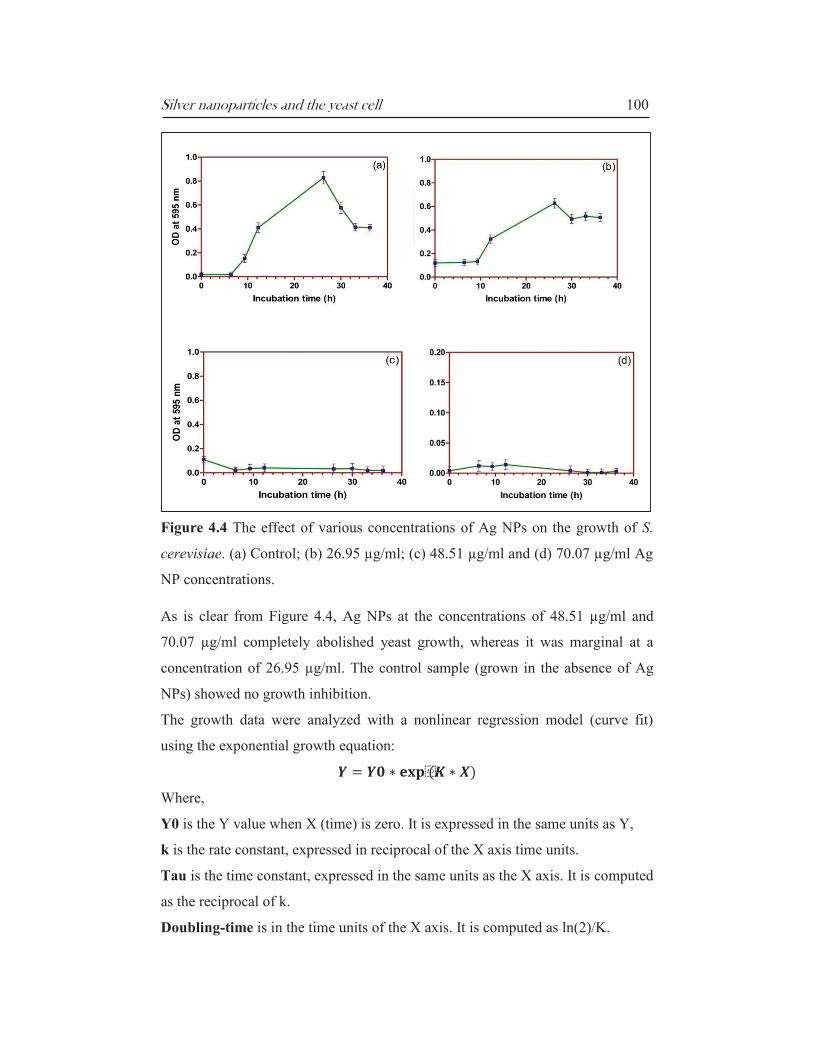
Table 4.7 presents the optical density measurements of yeast cultures grown in
different concentrations of silver nanoparticles. These data were used to plot the
growth curves of cultures, represented in Figure 4.4.
Silver nanoparticles and the yeast cell 100
Figure 4.4 The effect of various concentrations of Ag NPs on the growth of S.
cerevisiae. (a) Control; (b) 26.95 µg/ml; (c) 48.51 µg/ml and (d) 70.07 µg/ml Ag
NP concentrations.
As is clear from Figure 4.4, Ag NPs at the concentrations of 48.51 µg/ml and
70.07 µg/ml completely abolished yeast growth, whereas it was marginal at a
concentration of 26.95 µg/ml. The control sample (grown in the absence of Ag
NPs) showed no growth inhibition.
The growth data were analyzed with a nonlinear regression model (curve fit)
using the exponential growth equation:
Where,
Y0 is the Y value when X (time) is zero. It is expressed in the same units as Y,
k is the rate constant, expressed in reciprocal of the X axis time units.
Tau is the time constant, expressed in the same units as the X axis. It is computed
as the reciprocal of k.
Doubling-time is in the time units of the X axis. It is computed as ln(2)/K.

Silver nanoparticles and the yeast cell 101
The results are presented below in Table 4.8.
Table 4.8 Growth parameters of S. cerevisiae under Ag NP stress
Figure Nanoparticle
Concentration
(µg/ml)
Y0 K
(h-1
)
Tau
(h)
Doubling
Time
(h)
4.4 a 0 0.1721 0.03407
29.35
20.35
4.4 b 26.95 0.1620 0.03617
27.65
19.17
4.4 c 48.51 0.08147 -0.05196
-19.25
-13.34
4.4 d 70.07 0.01057 -0.03098
-32.28
-22.37
It is evident that cells grown in the presence of silver nanoparticles witness
significant changes in growth kinetics. While the growth rate (k) and doubling
time were observed to be similar for the control and 26.95 µg/ml concentrations;
the cultures reported negative growth rates at the MIC and MKC concentrations.
It can be concluded that silver nanoparticles have little effect on the growth of
cells at concentrations well below the lethal doses; however they are able to
significantly alter the growth parameters at higher doses.
We studied the cell cycle stages of S. cerevisiae under nanoparticle stress in an
effort to determine whether the cells get arrested at a certain stage of growth and
also the percentage of apoptotic cells, if any. The results of flow cytometry
analysis pertaining to Ag NP stressed cells are presented below.

Silver nanoparticles and the yeast cell 102
Figure 4.5a Analysis of yeast cells by flow cytometry. The scatter plots indicate
the granularity and staining (by PI). The purple plots (below) show the effect of
Ag NPs on the cell cycle. The x-axis indicates the fluorescent intensity of PI,
while y-axis indicates cell numbers (events). Cells in this analysis were treated
with (bottom, left to right) control, 5.39 µg/ml and 26.95 µg/ml Ag NPs.
Figure 4.5b Analysis of yeast cells by flow cytometry. The scatter plots indicate
the granularity and staining (by PI). The purple plots (below) show the effect of
Ag NPs on the cell cycle. The x-axis indicates the fluorescent intensity of PI,
while y-axis indicates cell numbers (events). Cells in this analysis were treated
with (bottom, left to right) 48.51 µg/ml and 70.07 µg/ml Ag NPs.

Silver nanoparticles and the yeast cell 103
Table 4.9 Percentage events (Gated) and Markers in cultures grown at different
Ag NP concentrations.
Nanoparticle
Concentration
Markers
G0/G1 S G2/M
%
Gated
CV %
Gated
CV %
Gated
CV
0 26.10 9.36 51.39 12.11 14.50 7.43
5.39 µg/ml 14.68 9.85 43.26 11.75 31.77 7.63
26.95 µg/ml 13.50 8.70 45.30 10.98 33.58 7.73
48.51 µg/ml 4.20 9.15 40.18 12.10 45.65 7.16
70.07 µg/ml 5.21 9.78 32.12 11.48 52.17 7.55
Figure 4.6 Histogram indicating cell cycle progressions under nanoparticle
stress. Blue bars (1) are for control cells (without Ag NPs) while the green are for
cells grown under different nanoparticle concentrations viz. (2 – 5) 5.39, 26.95,
48.51 and 70.07 µg/ml respectively. Error bars represent % CV.

Silver nanoparticles and the yeast cell 104
As shown in Figure 4.6, silver nanoparticles clearly has an effect on the cell cycle
progression of yeast cells. A total of 10000 events were analyzed for each of the
different nanoparticle concentrations. It was observed that the percentage of cells
in the G2/M phase increased by over 37% (from 14.5 in control cultures to 52.17
in cultures with 70.07 µg/ml Ag NPs). While on the other hand, the percentage of
cells in the G1 phase significantly decreased by about 22% (from 26.1 in control
cultures to 5.21 in cultures with 70.07 µg/ml Ag NPs) in the presence of Ag NPs
(Table 4.9). These variations are positively correlated with increasing Ag NP
concentrations. The percentage of apoptotic cells in each of the cultures was
variable ranging from about 0.6% (at 26.95 µg/ml Ag NPs) to ~ 8% (at 48.51
µg/ml Ag NPs); the control set had ~ 6% apoptotic cells. There was no strong
evidence to suggest that apoptosis was induced by silver nanoparticles. The flow
cytometry data are presented in Appendix III.
4.3.4 Electron Microscopy and Cellular Localization of Nanoparticles
Yeast cells were studied by transmission and scanning electron microscope to
observe changes in the surface and intracellular morphology induced by growth
under silver nanoparticles stress. The micrographs were compared with those of
cells grown without Ag NP stress. The observations are presented in the
photographs below.
Figure 4.7 Scanning electron micrograph (SEM) of yeast cells grown in YM
media (Magnifactions: 3500X, 15000X & 25000X).

Silver nanoparticles and the yeast cell 105
Figure 4.8 SEM micrograph of yeast cells grown in YM media with 5.39 µg/ml
Ag NPs (Magnification 3500 X & 25000X).
Figure 4.9 SEM micrograph of yeast cells grown in YM media with 26.95 µg/ml
Ag NPs (Magnification 3500X & 25000X).
Figure 4.10 SEM micrograph of yeast cells grown in YM media with 48.51
µg/ml Ag NPs (Magnification 3500X & 25000X).

Silver nanoparticles and the yeast cell 106
Figure 4.11 SEM micrographs of yeast cells grown in YM media with
70.07µg/ml Ag NPs (Magnification 3500X, 15000X & 25000X)
Yeast cells were grown for 48 h in YM media and in YM media having different
concentrations of nanoparticles before fixation in 2.5% glutaraldehyde for SEM
analysis. The filamentous morphology of cells may be attributed to prolonged
growth and subsequent limitation of nitrogen in the growth media.
When compared to the control, those cells taken from cultures having Ag NPs
show a distorted surface morphology i.e. the cell wall/membrane is not smooth as
is observed in the case of cells grown in YM media without nanoparticles. The
outer layer may be said to be ruptured or segmented. This observation was found
to be more pronounced in the case of cultures with higher concentrations of
nanoparticles particularly at the lethal concentrations of 48.51 and 70.07 µg/ml. It
is obvious from the SEM micrographs that yeast cells also show significant
changes in their outer layers, which might be crucial in explaining the mechanism
of silver nanoparticle toxicity.
Further changes in cellular morphology were studied by transmission electron
microscope, the observations are presented in the following micrographs.

Silver nanoparticles and the yeast cell 107
Figure 4.12 TEM micrographs of yeast cells grown in YM media (left) and 48.51
µg/ml Ag NP concentration (right). Arrows in the right image indicate deposition
of nanoparticles in the cell wall and breakage of outer layer.
Figure 4.13 High-resolution TEM micrographs of yeast cells grown in YM
media without nanoparticle stress. (a) Different growth forms (Scale bar = 1µm)
(b) budding cell (Scale bar = 100 nm) (c) & (d) A typical ellipsoidal and
filamentous cell at high magnification (Scale bar = 100 nm)
Silver nanoparticles and the yeast cell 108
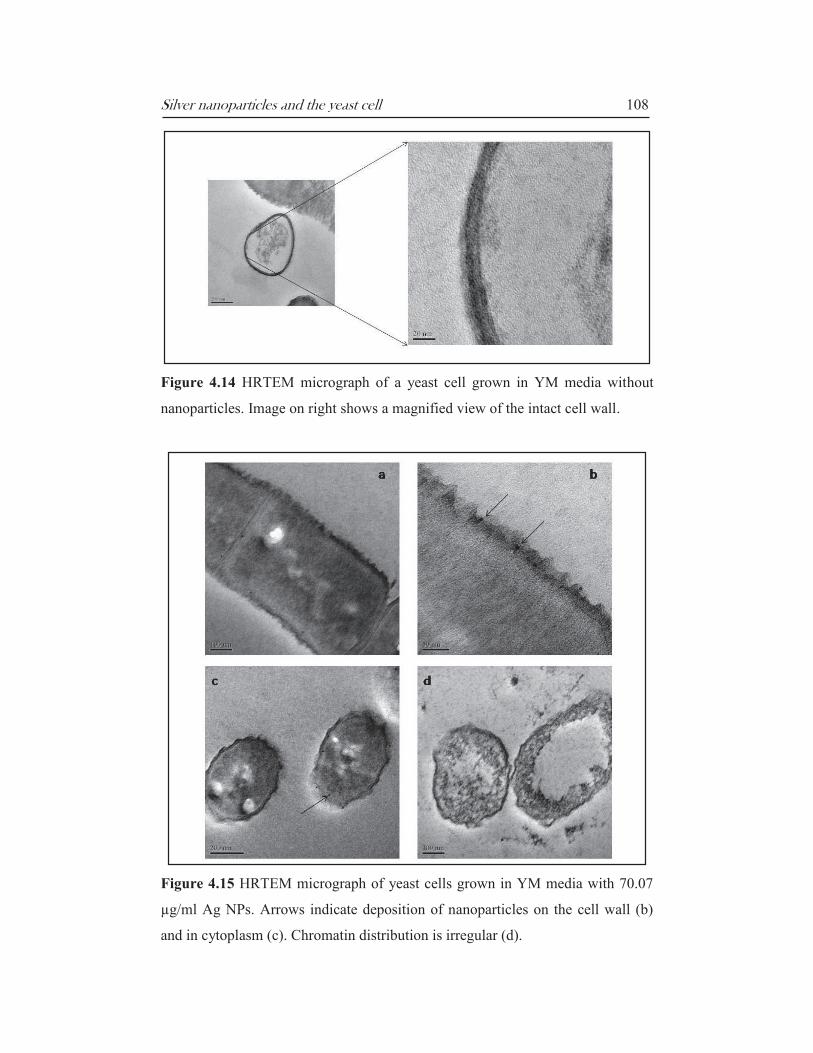
Figure 4.14 HRTEM micrograph of a yeast cell grown in YM media without
nanoparticles. Image on right shows a magnified view of the intact cell wall.
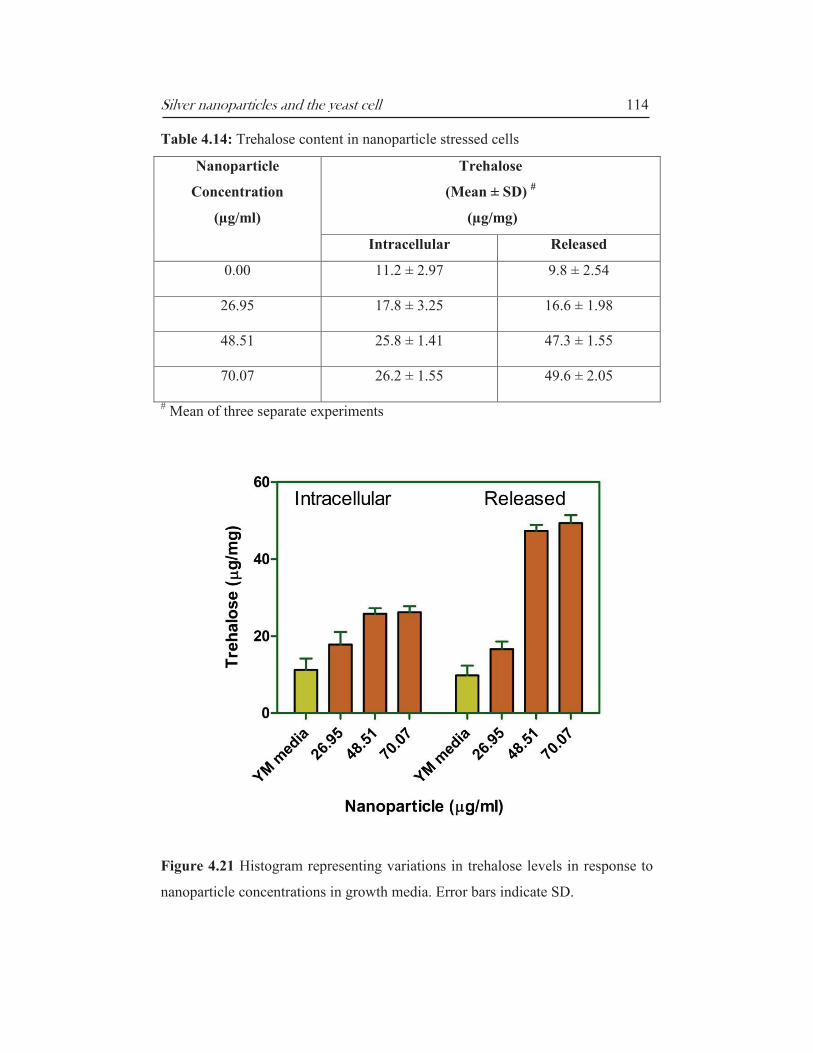
Figure 4.15 HRTEM micrograph of yeast cells grown in YM media with 70.07
µg/ml Ag NPs. Arrows indicate deposition of nanoparticles on the cell wall (b)
and in cytoplasm (c). Chromatin distribution is irregular (d).

Silver nanoparticles and the yeast cell 109
Figure 4.16 HRTEM micrograph of yeast cell grown in YM media with 70.07
µg/ml Ag NPs showing deposition of nanoparticles on the outer layers and
destruction of cell wall.
The electron micrographs reveal that yeast cells in the cultures are dimorphic, i.e.
exhibiting both the typical ellipsoidal as well as filamentous forms (Figure 4.13).
Cells grown in YM media only have a well-defined and intact cell wall (Figure
4.14). The distribution of chromatin is uniform and in general the cultures exhibit
‘good health’ such as budding (Figure 4.13 b) and a well defined shape.
In cultures that were grown in the presence of nanoparticles, the striking feature
is the lack of a defined cell wall Figures 4.12 & 4.16). These cells appear to be
‘diffuse’ with part of the cytoplasm exposed to the elements (Figure 4.15 c & d).
The chromatin is either unrecognisable (Figure 4.16) or sequestered towards the
outer envelope (Figure 4.15 d). It was observed that a majority of the
nanoparticles were localized in the cell wall/membrane (Figures 4.15 b & 4.16)
seemingly embedded in the outer matrix. Some particles were also detected
inside the cytoplasm (Figure 4.15 c) in areas where the cell wall was completely
destroyed. Possibly the particles are tightly bound to the cell surface groups and
diffuse inside once the cell wall has dissolved. The disruption of outer layers has
been reported in previous studies as an important mechanism of nanoparticle
mediated inhibition of microorganisms (see discussion below). This aspect was
validated by an in vitro cell permeability assay, the results of which are presented
below.

Silver nanoparticles and the yeast cell 110
4.3.5 Cell Permeability Assay
The assay was performed to investigate any change in membrane permeability of
yeast cells exposed to silver nanoparticles. As cells may spontaneously release
constituents into the suspending medium, an appropriate control (water) was set.
Values in Figure 4.17 represent readings after adjustment with the control.
Table 4.10 Data of cell permeability assay: Absorbance readings of culture
supernatants
Sample
(incubated in)
Absorbance Adjusted Values (Mean ± SD)
260 nm 280 nm 260 nm 280 nm
Water 0.404 0.248 - -
Perchloric Acid 0.974 0.784 0.570 ± 0.035 0.536 ± 0.042
5.39 µg/ml Ag NP 0.552 0.349 0.148 ± 0.041 0.101 ± 0.028
16.17 µg/ml Ag NP 0.581 0.347 0.177 ± 0.049 0.099 ± 0.028
26.95 µg/ml Ag NP 0.443 0.304 0.215 ± 0.025 0.125 ± 0.042
37.73 µg/ml Ag NP 0.908 0.468 0.504 ± 0.032 0.220 ± 0.028
48.51 µg/ml Ag NP 1.203 0.645 0.799 ± 0.042 0.397 ± 0.056
70.07 µg/ml Ag NP 2.164 1.327 1.760 ± 0.038 1.079 ± 0.046
Figure 4.17 Release of UV-absorbing compounds from cells after treatment with
perchloric acid (PCA) and nanoparticles. Values are mean of three readings, error
bars represent SD.

Silver nanoparticles and the yeast cell 111
The in vitro membrane permeability assay confirmed the damage caused by Ag
NPs to cell membrane. The release of UV-absorbing compounds from cells
increased in proportion to the concentration of nanoparticles (Figure 4.17) present
in the growth media. At the MIC of 48.51 µg/ml nanoparticles mediated the
release of metabolites which was similar to that of perchloric acid (~ 1.08 times
that of PCA). There was a dramatic increase in the permeability of cells at the
MKC of 70.07μg/ml nanoparticle when the release of metabolites were more
than 2.5 times than that released after digestion in 1N HClO4 at 100°C for 1 hour.
4.3.6 Cellular Metabolites
Changes in intracellular concentrations of metabolites viz. RNA, amino acid,
protein, and trehalose in yeast cells grown under nanoparticle stress are presented
below.
Table 4.11: Total RNA content in nanoparticle stressed cells
Nanoparticle Concentration
(µg/ml)
RNA Content
(Mean ± SD)#
(µg/ml)
0.00 27.30 ± 4.31
5.39 25.70 ± 7.09
16.17 26.65 ± 7.11
26.95 26.65 ± 12.73
37.73 42.30 ± 6.65
48.51 3.64 ± 2.83
70.07 2.31 ± 1.70 # Mean of three separate experiments
Figure 4.18 Histogram representing variations in RNA content in response to
nanoparticle concentrations in growth media. Error bars indicate SD.

Silver nanoparticles and the yeast cell 112
Table 4.12: Free amino acid content in nanoparticle stressed cells
Nanoparticle Concentration
(µg/ml)
Amino acid
(Mean ± SD) #
(µM/ml)
0.00 0.320 ± 0.040
5.39 0.156 ± 0.007
16.17 0.148 ± 0.016
26.95 0.141 ± 0.006
37.73 0.129 ± 0.011
48.51 0.008 ± 0.004
70.07 0.005 ± 0.002
# Mean of three separate experiments
Figure 4.19 Histogram representing variations in free amino acid content in
response to nanoparticle concentrations in growth media. Error bars indicate SD.

Silver nanoparticles and the yeast cell 113
Table 4.13: Total cellular protein content in nanoparticle stressed cells
Nanoparticle Concentration
(µg/ml)
Protein
(Mean ± SD) #
(mg/ml)
0.00 0.084600 ± 0.00410
5.39 0.037800 ± 0.00085
16.17 0.034400 ± 0.00212
26.95 0..030900 ± 0.00085
37.73 0.020500 ± 0.00113
48.51 0.008950 ± 0.00035
70.07 0.003800 ± 0.00010
# Mean of three separate experiments
Figure 4.20 Histogram representing variations in protein levels in response to
nanoparticle concentrations in growth media. Error bars indicate SD.
Silver nanoparticles and the yeast cell 114
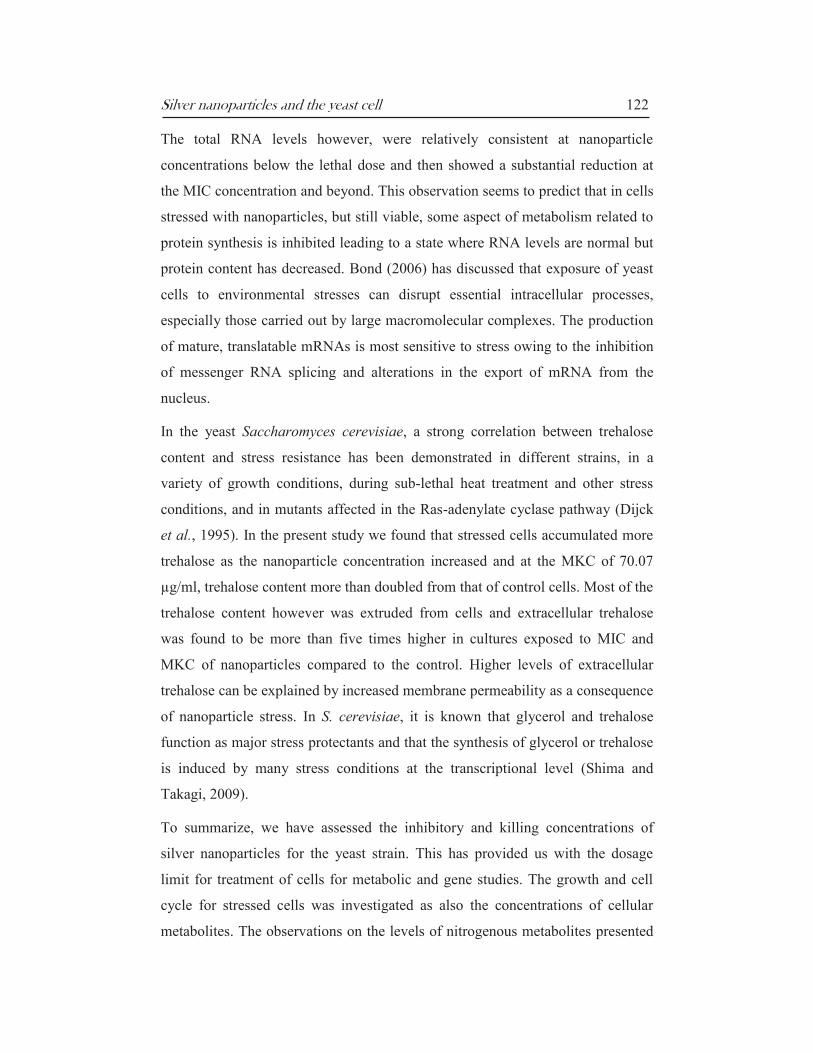
Table 4.14: Trehalose content in nanoparticle stressed cells
Nanoparticle
Concentration
(µg/ml)
Trehalose
(Mean ± SD) #
(µg/mg)
Intracellular Released
0.00 11.2 ± 2.97 9.8 ± 2.54
26.95 17.8 ± 3.25 16.6 ± 1.98
48.51 25.8 ± 1.41 47.3 ± 1.55
70.07 26.2 ± 1.55 49.6 ± 2.05
# Mean of three separate experiments
Figure 4.21 Histogram representing variations in trehalose levels in response to
nanoparticle concentrations in growth media. Error bars indicate SD.

Silver nanoparticles and the yeast cell 115
Cellular metabolites levels in yeast cells were clearly influenced by presence of
nanoparticles in the growth medium. Free amino acid and total cellular protein
content showed a gradual decrease when cells were grown in increasingly higher
concentrations of Ag NPs (Tables 4.12, 4.13 and Figures 4.19, 4.20). At the MIC
concentration of 48.51µg/ml and higher there was very low level of nitrogenous
metabolites. Interestingly RNA content (Table 4.11 and Figure 4.18) was almost
stable and then decreased significantly at the MIC and MKC concentrations.
It might be possible that nanoparticles adversely affect protein synthesis which
leads to lowered expression of genes while RNA tends to accumulate at normal
levels in stressed cells. This aspect was further investigated by expression
profiling of genes involved in protein synthesis, the results of which are described
in Chapter 5.
Trehalose levels, both intracellular and released, increased in nanoparticle
stressed cells (Table 4.14 and Figure 4.21). Extracellular trehalose was more than
five times higher at the MIC and MKC compared to control. This can be
explained by the fact that nanoparticles damage cell membrane and increases
permeability which leads to extrusion of intracellular compounds. This was
demonstrated in the cell permeability assay described in section 4.3.5.
Nanoparticle stressed cells also accumulated more trehalose (intracellular) than
the control set.
4.4 Discussion
The minimum inhibitory and killing concentrations, MIC and MKC values were
found to be 48.51 µg/ml and 70.07 µg/ml respectively. There have been
numerous reports on the anti-bactericidal effects of nanoparticles (see Rai et al.,
2011 for review), however data on eukaryotic cells are limited. Kim et al. (2007)
reported a MIC value of >6.6 nM against yeast (ATCC19636) while Panacek et
al. (2009) report that against Candida albicans, non-stabilized Ag NPs have an
MIC of 0.42 mg/L. These values are lower than those found in the current study.
In a recent study, Nasrollahi et al. (2011), investigated the antifungal effects of

Silver nanoparticles and the yeast cell 116
silver nanoparticles on Candida albicans (ATCC 5027) and Saccharomyces
cerevisiae (ATCC 5027). They reported MIC50 of 0.5 mg/ml and MIC90 of 2
mg/ml against C. ablicans and against S. Cerevisiae the MIC50 was 4 mg/ml
while MIC90 was reportedly 32 mg/ml. When compared to our study these
values are significantly higher.
It is pertinent to note that inhibitory concentrations are dependent on the species
tested and the method employed. It is also reported (Ruparelia et al., 2008) that
strain specific variation in MIC/MBC (minimum bactericidal concentration) is
present in case of silver and copper nanoparticles against E. coli. The use of
stabilizing agents in particle synthesis also contribute towards inhibition,
however in the present study this was avoided by direct synthesis of nanoparticles
in growth media without the use of stabilizers. The MKC value of 70.07 µg/ml
provided an upper limit of treatment in experiments concerning metabolic and
gene expression studies.
Viability is an essential analytical measurement for quantifying cell culture. It is
most frequently determined by microscopic examination of stained cells. The dye
most widely used to measure yeast viability in is methylene blue. Although
relatively inexpensive and easy to perform, the assay produces inconsistent
results, with many observations of both overestimation and underestimation of
viability. Furthermore, analysis is subjective, and the relatively low number of
cells that can be analysed is not representative of the entire yeast population
(Byod et al., 2003). We found that the methylene blue assay of cell viability
largely confirmed the experimental results obtained for determining the MIC and
MKC of Ag NPs by plate count. At 70.07 µg/ml i.e. the minimum killing
concentration, only 1.2% of the cells were found to be viable or in other words a
>98% reduction in cell viability. It might be recalled that at this concentration
there was a decrease of 99.93% in the number of CFUs/ml when assessed by
plate count (Table 4.2).
The mean cell volume was observed to increase in cultures grown at higher
concentrations of Ag NPs, this change was found to be extremely significant (P =

Silver nanoparticles and the yeast cell 117
0.0001), when cells were grown at 70.07 µg/ml nanoparticle concentration.
Under suboptimal conditions, cells developed higher specific volumes
(surface/volume ratio), and in the case of inefficient oxygenation, this could be
explained by an increase of the cell surface in response to a lack of dissolved
oxygen in the growth medium (Furukawa et al., 1983). In a recent study,
Reisetter et al. (2011) determined whether reduced plasma membrane integrity
affected cell size/volume of human macrophage cell line after exposure to carbon
black (CB) nanoparticles. The authors report an increase in both the size and
cellular volume with CB nanoparticle exposure.
To the best of our knowledge there has been no previous study on the growth
cycle of S. cerevisiae under silver nanoparticle stress. The absorbance readings
were recorded in a microplate reader, which was a novel approach. As all
samples from the entire growth period were analyzed together, variations in
absorbance readings were minimized and the process was convenient for high-
throughput. Toussaint and Conconi (2006) had described a method to determine
the sensitivity of growing yeast to DNA-damaging agents that is based on
automatic measurements of the optical density of very small (100 µl) liquid
cultures. Starting with the treatment of cells with different doses of damaging
agents, pre-prepared growing media containing 96-well plates were inoculated
and cell population automatically monitored every 10 min for 48 hours.
Reportedly the sensitivity of a number of yeast strains to several concentrations
of drug can be tested in triplicate in less than 4 hours. Microplate based assays for
cell growth may be an effective alternative to the traditional spectrometer and cell
counts.
Representative growth profiles of the yeast cultures in presence of varying
concentration of silver nanoparticles are depicted in Figure 4.4. At concentrations
below the MIC, the doubling time was not significantly different from the control
cells. The lag phase however was longer being 10 h for cells grown in 26.95
µg/ml Ag NPs compared to 6 h for the control. A greater lag phase and lower
maximum absorbance (at 600 nm) in eight different strains of bacteria were
reported by Ruparelia et al. (2008) as the concentration of silver and copper

Silver nanoparticles and the yeast cell 118
nanoparticles increased. Similar observation was reported by Sondi and Salopek-
Sondi (2004) in their studies on effect of silver nanoparticles on a single strain of
E. coli. In the current study we had found a negative growth rate (k) for cultures
grown at the MIC and MKC concentrations, the trace of the curves being similar
to those reported by Gogoi et al. (2006) for E. coli grown under silver
nanoparticle stress. However, at the sub-lethal concentration of 26.95 µg/ml the
growth rate was similar to that of the control. A study by Williams et al. (2006)
evaluated the growth of E. coli exposed to silica, silica/iron oxide, and gold
nanoparticles. Growth curves were generated for E. coli growing in 100 ml of LB
media containing silica/iron oxide nanoparticles at a concentration of 2.2 × 10⁻³
g/ml of solution. Under these growth conditions, there was no evidence that the
nanoparticles prevented the microbial cells from growing. The authors confirm
that the growth curves for E. coli growing with and without silica/iron oxide
nanoparticles have little difference and that it is possible that there may be more
subtle changes in cell function and behaviour detectable at the gene or protein
level. It must however be noted that in their study the growth was evaluated at
only one concentration of nanoparticles and the inhibitory and bactericidal
concentrations of the nanoparticles were not assessed. The important similarity is
that as in the present study, the growth of cells exposed to non-lethal doses of
nanoparticles closely resembles to that of control cells not exposed to
nanoparticles.
The use of flow cytometry to monitor the cell cycle position of individual cells in
a population has been a standard tool for cell cycle studies in both mammalian
cells and yeast. Fluorescence can be measured for cells by a flow cytometer
following fixation and staining with a fluorescent dye that binds DNA
quantitatively. Individual cells in a population can then be assigned to a cell cycle
position based on DNA content, as defined by fluorescence intensity (Haase and
Reed, 2002). In order to elucidate the physiological changes of the yeast cells
induced by silver nanoparticles, a flow cytometric analysis of the cell cycle was
performed. The cells were cultured in the presence or absence of nanoparticles
and their DNA content was determined via flow cytometry by staining with
Silver nanoparticles and the yeast cell 119
propidium iodide (PI). PI is a DNA-staining dye that intercalates between the
bases of DNA or RNA molecules (Tas and Westerneng, 1981). The flow
cytometric profiles of control cultures showed that they had about 26% of cells
with the DNA content of the G1 phase and only 14.5% of cells with the DNA
content of the G2 phase, during the 24 h of incubation (Figures. 4.5a,b & 4.6). In
cultures with Ag NPs, the proportion of cells with the DNA content of the G2
phase more than doubled, accounting for upto 52% of all cells at the MKC of
70.07 µg/ml. The increase was seen to be positively correlated with the
nanoparticle concentration. The fact that cells tend to accumulate in the G2/M
phase seems to indicate that nanoparticles do not affect DNA replication but
inhibited normal bud growth. Endo et al. (1997) reported similar results with 80-
85% of cells in G2 upon treatment with Aureobasidin A, a fungicide. The authors
conclude that inhibition of bud growth correlates with maintenance of the
integrity of the cell membrane.
The G2/M phase arrest seems to be a recurring phenomena in Ag NP mediated
toxicity. It was earlier reported that starch-coated silver nanoparticles caused cell
cycle arrest in G2/M phase in human lung fibroblast cells (IMR-90) and
glioblastoma cells (U251) (Asha Rani et al., 2009). The authors speculate that the
accumulation of cells at the G2/M interface is associated with DNA repair which
could lead to cell death at a later stage if repair pathways were unsuccessful.
In a study on the cellular uptake of AS-COOH nanoparticles by A549 cell lines
(Kim et al., 2011) it was reported that uptake of nanoparticles by cells is also
influenced by their cell cycle phase. Although cells in different phases of the cell
cycle were found to internalize nanoparticles at similar rates, after 24 h the
concentration of nanoparticles in the cells could be ranked according to the
different phases: G2/M > S > G0/G1. Nanoparticles that are internalized by cells
are not exported from cells but are split between daughter cells when the parent
cell divides. As from our study, we found a G2/M phase arrest; a higher
concentration of nanoparticles in a large proportion of the cell population could
lead to increased toxicity as particle toxicity is dose dependent.

Silver nanoparticles and the yeast cell 120
The study of yeast cells by electron microscope revealed changes induced by
nanoparticle stress (Section 4.3.4). A large proportion of cells (both control and
stressed) were elongated. During vegetative growth, the ascomycete
Saccharomyces cerevisiae is able to adopt one of two distinct morphologic forms,
designated the yeast form and the filamentous form (Edgington et al., 1999). In
the phenomenon known as pseudohyphal growth, diploid cells become
filamentous when grown on solid agar medium containing a rich carbon source
but limited for nitrogen (Gimeno et al., 1992). In the present study cells were
cultured for 24 h in 100 ml flasks, before fixation and image capture. Such
conditions can be attributed for the filamentous growth of cells.
Scanning electron micrographs (Figures 4.8 – 4.11) show damage to cell
wall/membranes in cultures exposed to nanoparticles. This aspect is further
confirmed in the TEM images (Figures 4.12 – 4.16) where the disruption of
membrane integrity and uneven distribution of chromatin is evident. Cells grown
in absence of Ag NPs (Figure 4.14) show an intact outer layer and homogenous
distribution of chromatin, whereas deformities in the cell wall are observed for
those cells grown in presence of Ag NPs (Figure 4.16). Dark spots, construed to
be nanoparticles, were deposited on the outer layers as well as in the cytoplasm
indicating deposition and penetration of the particles inside cells. It is likely that
the interaction between the particles and the membrane is non-specific rather than
specific between the nanoparticles and a particular component of the membrane
such as a surface expressed protein (Williams et al., 2006). There are reports in
the literature that show that electrostatic attraction between negatively charged
bacterial cells and positively charged nanoparticles is crucial for the activity of
nanoparticles as bactericidal materials (Stoimenov et al., 2002). In contrast,
Sondi and Salopek-Sondi, (2004) used negatively charged silver nanoparticles
which interacted with the constituents of the outer membrane of E. coli and
despite their negative surface charge, they somehow interacted with “building
elements” of the bacterial membrane, causing structural changes and degradation
and finally, cell death. The authors showed by TEM analysis the existence of
elementary silver in the membranes of treated bacteria, detected by EDAX,

Silver nanoparticles and the yeast cell 121
thereby confirming the incorporation of silver nanoparticles into the membrane
structure. This observation is crucial for explaining the antibacterial mode of
these particles. It is clear that treated bacteria also show significant changes in
and damage to membranes, which are recognized by the formation of “pits” on
their surfaces (Sondi and Salopek-Sondi, 2004). A similar effect was described
by Stoimenov and co-workers (2002) when E. coli bacteria were treated with
highly reactive metal oxide nanoparticles. A recent study (Despax et al., 2011)
reported sulphur-containing silver clusters preferentially located at the cell wall
periphery together with nodules composed of silver, sulphur and phosphorus all
over the cell. Electron-dense regions and apparent destruction of chromatin are
visible inside cells treated with Ag NPs.
A yeast membrane with this aberrant morphology exhibits a significant increase
in permeability, leaving the cells incapable of properly regulating transport
through the plasma membrane and, finally, causing cell death. Endo et al. (1997)
had measured amino acids released by S. Cerevisiae treated with Aureobasidin A
to assess disruption of the cell membrane. In the present study, an in vitro
membrane permeability assay confirmed the damage caused by Ag NPs to cell
membrane. The release of UV-absorbing compounds from cells increased in
proportion to the concentration of nanoparticles (Figure 4.17) present in the
growth media. Nanoparticles of 70.07μg/ml mediated the release of metabolites
which were >2.5 times than that released after digestion in 1N perchloric at
100°C for 1 hour. These observations on the yeast cell suggest that silver
nanoparticles are potent cytotoxic agents and have a profound impact on their cell
wall leading to altered diffusion across membranes and cell death.
The intracellular metabolite concentrations have been investigated to assess the
impact of nanoparticles on the metabolic activities of yeast cells. Baker’s-yeast
cells may change their level of metabolic activity, such as their carbon
metabolism and nitrogen metabolism, as well as their stress response to
environmental conditions (Higgins et al., 2001). As is described in Section 4.3.6,
the amino acid and cellular protein concentrations of stressed cells showed a
steady decrease when cells were exposed to increasingly higher doses of Ag NPs.
Silver nanoparticles and the yeast cell 122
The total RNA levels however, were relatively consistent at nanoparticle
concentrations below the lethal dose and then showed a substantial reduction at
the MIC concentration and beyond. This observation seems to predict that in cells
stressed with nanoparticles, but still viable, some aspect of metabolism related to
protein synthesis is inhibited leading to a state where RNA levels are normal but
protein content has decreased. Bond (2006) has discussed that exposure of yeast
cells to environmental stresses can disrupt essential intracellular processes,
especially those carried out by large macromolecular complexes. The production
of mature, translatable mRNAs is most sensitive to stress owing to the inhibition
of messenger RNA splicing and alterations in the export of mRNA from the
nucleus.
In the yeast Saccharomyces cerevisiae, a strong correlation between trehalose
content and stress resistance has been demonstrated in different strains, in a
variety of growth conditions, during sub-lethal heat treatment and other stress
conditions, and in mutants affected in the Ras-adenylate cyclase pathway (Dijck
et al., 1995). In the present study we found that stressed cells accumulated more
trehalose as the nanoparticle concentration increased and at the MKC of 70.07
µg/ml, trehalose content more than doubled from that of control cells. Most of the
trehalose content however was extruded from cells and extracellular trehalose
was found to be more than five times higher in cultures exposed to MIC and
MKC of nanoparticles compared to the control. Higher levels of extracellular
trehalose can be explained by increased membrane permeability as a consequence
of nanoparticle stress. In S. cerevisiae, it is known that glycerol and trehalose
function as major stress protectants and that the synthesis of glycerol or trehalose
is induced by many stress conditions at the transcriptional level (Shima and
Takagi, 2009).
To summarize, we have assessed the inhibitory and killing concentrations of
silver nanoparticles for the yeast strain. This has provided us with the dosage
limit for treatment of cells for metabolic and gene studies. The growth and cell
cycle for stressed cells was investigated as also the concentrations of cellular
metabolites. The observations on the levels of nitrogenous metabolites presented

Silver nanoparticles and the yeast cell 123
some clues about deficiencies in protein synthesis process; this aspect was further
investigated and is described in the next chapter. Finally, high-resolution electron
microscopic analysis of cells confirmed the damage incurred during nanoparticle
exposure which was further confirmed by a cell permeability assay.